


Introduction
Sustained social relationships are a vital aspect of later-life wellbeing (Cornwell and Laumann Reference Cornwell and Laumann2015). According to Heaven et al. (Reference Heaven, Brown, White, Errington, Mathers and Moffatt2013), social relationships consist of three distinct components: (1) the social network, (2) received social and emotional support and (3) personally meaningful social roles. These components can change over time, with the first two being examined extensively in previous research (e.g. Ayalon and Levkovich Reference Ayalon and Levkovich2019; Wu and Sheng Reference Wu and Sheng2019). Social roles, however, are less well studied.
To better understand how social relationships shape later-life wellbeing, studying (changes in) social roles is highly relevant. Roles contextualize individuals in their social environment (Thoits Reference Thoits2012) and carry meaning and importance, thereby shaping older adults’ identity (McCall and Simmons Reference McCall and Simmons1978; Heaven et al. Reference Heaven, Brown, White, Errington, Mathers and Moffatt2013). The roles people hold (e.g. grandparent, worker and friend) and the importance given to them are likely to change over time, influenced by major life transitions or changes in personal or situational circumstances. However, literature on changes in the importance of social roles over time is currently lacking, which is the aim of the present study.
Literature review and theoretical framework
Social roles and role importance
Central to understanding changes in social relationships in later life is the concept of social roles, which originated in identity theory. Classic identity theory defines social roles as the various positions an individual holds (Mead Reference Mead1934; McCall and Simmons Reference McCall and Simmons1978; Stryker Reference Stryker1980; Stets and Burke Reference Stets and Burke2000). Roles address the question ‘Who am I?’, linking the individual to their social environment (Thoits Reference Thoits2012). The various roles shape one’s identity and self-concept – that is, individuals derive meaning from role enactment – and different roles come with behavioural expectations regarding the self and others (McCall and Simmons Reference McCall and Simmons1978; Super Reference Super1980).
A central notion in identity theory is that different roles carry different amounts of importance, termed identity salience (Hoelter Reference Hoelter1983; Hogg et al. Reference Hogg, Terry and White1995). Reitzes and Mutran (Reference Reitzes and Mutran2002) conceptualized salience (or role importance) as a multidimensional construct with three distinct concepts: importance (i.e. individuals assign varying importance to roles), balance (i.e. whether individuals’ self-concept revolves around a few or many important roles) and relative importance (i.e. individuals order the importance of a role compared to the importance of other roles). The authors also argue that role importance and the relative importance of roles are two ‘conceptually different and empirically independent’ concepts (Reitzes and Mutran Reference Reitzes and Mutran2002, 650). That is, a higher relative importance is given to roles within a role set that are potentially all rated very important; still, the roles with the highest relative importance may be prioritized for investments and resources. In this study, we will adopt this conceptualization by operationalizing social roles in different ways. Importance is measured by the absolute importance of roles and the average importance across roles; relative importance is measured by comparing each role’s importance to the importance of other roles; and balance is measured by the total number of roles and the number of important roles.
Intra-individual changes in social roles and role importance
The relative importance of social roles may change in later life for two main reasons. First, social networks change across the lifespan. Compared with younger people, older adults have smaller overall networks, with a higher proportion of important contacts (van Tilburg Reference van Tilburg1998; Lang Reference Lang2001; Bruine De Bruin et al. Reference Bruine De Bruin, Parker and Strough2020). An explanation for this change is provided by socio-emotional selectivity theory (Carstensen Reference Carstensen1992), which states that ageing is associated with an increased awareness of a limited remaining time horizon. As a result, older adults shift their energy towards emotionally rewarding contacts, thereby discontinuing relationships with weaker ties (English and Carstensen Reference English and Carstensen2014; Carstensen Reference Carstensen2021). Following this argumentation, we might expect the number of roles to decrease later in life, yet the importance of family and friend roles could increase.
Second, major life events cause role changes and, consequently, shift the relative importance of roles. This argument is based on Super’s (Reference Super1980) lifespan, life-space approach, which originated in career development literature. This approach assumes that the number of roles individuals occupy changes over the lifespan, while the total amount of resources (i.e. importance) available for investing in these roles stays constant. As such, gaining a role that requires investment, such as becoming a grandparent, means that the resources need to be distributed over more roles, thereby potentially diminishing the importance of other roles. On the other hand, losing a role, such as through retirement or widowhood, allows resources to be redirected toward remaining roles (Tang Reference Tang2016; Tanskanen et al. Reference Tanskanen, Danielsbacka, Hämäläinen and Solé-Auró2021).
Furthermore, the lifespan, life-space approach posits that role importance consists of two distinct factors: temporal importance (i.e. invested time) and emotional importance (i.e. invested energy and emotional depth; Super Reference Super1980). An individual’s assessment of role importance is likely a combination of these two factors. However, while the model assumes that roles lose importance after losing the role, we argue that factual temporal importance might be lost, but emotional importance is not solely linked to role occupancy. In other words, one might find a role important without actively enacting it (Silverstein and Long Reference Silverstein and Long1998). For instance, studies have found that losing one’s partner does not necessarily mean losing spousal identity (Longoria Reference Longoria2022), and retirees with a strong pre-retirement work identity may still rate their work as highly important (Bordia et al. Reference Bordia, Read and Bordia2020). Therefore, we argue that it is pivotal to study life and role transitions in terms of changes in role importance, which is the first aim of the present study.
Inter-individual differences in social role importance
Besides intra-individual changes in role importance, we might also expect different older adults to show different rates and directions in the importance of their social roles. Early cross-sectional work on differences in the relative importance of roles in the adult population revealed relative stability between individuals in ordering roles, with family roles rated as more important than work roles, and the partner and parent roles as more important than other family roles (Pleck Reference Pleck1985; Thoits Reference Thoits1992). However, contemporary comparisons among older adults are lacking.
Additionally, opportunities for social engagement are argued to vary with personal and contextual factors, which, in turn, can affect roles and their importance (Kahn and Antonucci Reference Kahn, Antonucci, Baltes and Brim1980; Huxhold et al. Reference Huxhold, Fiori and Windsor2022). Therefore, this study’s second aim is to examine several of these factors in predicting individual differences in the levels and changes in social role importance. As literature on predictors of role importance is lacking, we based our predictor selection on previous research on related concepts such as social participation and social relationships. These predictors include differences in gender, education, health, retirement, relationship status, social support and personality.
Regarding gender, women typically maintain larger and more diverse support networks and have more contact with family and friends than men (Ajrouch et al. Reference Ajrouch, Blandon and Antonucci2005; McDonald and Mair Reference McDonald and Mair2010), while men’s networks are often more partner-centred (Reitzes and Mutran Reference Reitzes and Mutran2002; Dykstra and Fokkema Reference Dykstra and Fokkema2007). Men tend to stay in touch with co-workers more frequently and may also be more affected by the loss of relationships after retirement (Shaw et al. Reference Shaw, Krause, Liang and Bennett2007; McDonald and Mair Reference McDonald and Mair2010; Harling et al. Reference Harling, Morris, Manderson, Perkins and Berkman2020). These could lead to distinct trajectories in the importance of specific social roles over time, such as the worker or partner role.
Lower education has been associated with smaller, more family-centred networks and higher levels of loneliness due to limited social interactions (Broese van Groenou and van Tilburg Reference Broese van Groenou and van Tilburg2003; Cohen-Mansfield et al. Reference Cohen-Mansfield, Hazan, Lerman and Shalom2016). It also appears to be related to a lower likelihood of volunteering (Gesthuizen and Scheepers Reference Gesthuizen and Scheepers2012), possibly reflecting the greater importance individuals place on family roles and the lower importance they place on volunteering or active membership.
Poor health can limit social interactions due to mobility issues (Okoro Reference Okoro2018; Shandra Reference Shandra2019; Fingerman et al. Reference Fingerman, Ng, Huo, Birditt, Charles and Zarit2021) and shifts in priorities, making individuals more reliant on care-givers, often family or spouses (Wolff and Kasper Reference Wolff and Kasper2006; Lima et al. Reference Lima, Allen, Goldscheider and Intrator2008; Noël-Miller Reference Noël-Miller2011). Declining health may thus increase the importance of close family ties while reducing the importance of roles that require active social participation, such as volunteering.
Retirement can change relationships with family, friends and the community (Moen et al. Reference Moen, Erickson and Dempster-McClain2000) and is also perceived as an opportunity to acquire new roles. For example, Bordia et al. (Reference Bordia, Read and Bordia2020) found that important non-work-related roles, such as friend or spouse, when present before retirement, were often maintained or intensified after retirement.
Partnership status offers or restricts opportunities to engage in and value specific roles. For example, widowed or divorced grandparents perceive their grandparent role as less important than partnered grandparents (Mahne and Motel-Klingebiel Reference Mahne and Motel-Klingebiel2012), and losing a partner increases social involvement after some time (e.g. volunteering; Li Reference Li2007).
Furthermore, social support significantly affects relationship satisfaction (Cramer Reference Cramer2004, Reference Cramer2006), and support networks are known to change following life transitions (Guiaux et al. Reference Guiaux, Van Tilburg and Broese Van Groenou2007). Thus, in this study, we assess if social support, measured on the subscales Family, Friends and Significant Others (Zimet et al. Reference Zimet, Dahlem, Zimet and Farley1988), impacts the evaluation of the (relative) importance of specific roles.
Regarding the big five personality traits, more extraverted and agreeable individuals have larger, more tightly knit networks (Molho et al. Reference Molho, Roberts, de Vries and Pollet2016; Iveniuk Reference Iveniuk2019; Rollings et al. Reference Rollings, Micheletta, Van Laar and Waller2023), as they are known to more actively seek out (deep) social interactions (Iveniuk Reference Iveniuk2019). Additionally, higher conscientiousness and lower neuroticism are associated with greater social engagement (Lodi-Smith and Roberts Reference Lodi-Smith and Roberts2012; Pfund and Allemand Reference Pfund and Allemand2024). Openness is least linked to (changes in) social relationships in previous studies (Pfund and Allemand Reference Pfund and Allemand2024).
The present study
In this pre-registered exploratory study, we aim to describe the concept of the relative importance of social roles and longitudinal changes therein. We argue that it is a relevant pathway to understanding social relationships and social wellbeing in later life (Thoits Reference Thoits2012; Heaven et al. Reference Heaven, Brown, White, Errington, Mathers and Moffatt2013; Kulik Reference Kulik2015). We formulated two exploratory research questions, aimed at assessing both intra-individual changes in role importance and inter-individual differences in those changes:
RQ1.Does the importance of social roles change over time?
RQ2.How do gender, education, health status, work status, partner status, social support and personality explain individual differences in the (change in) importance of social roles?
Because the study is primarily descriptive, it covers an extensive range of predictors and outcomes. Given the limited existing research on this topic, we did not formulate specific hypotheses.
Methods
Transparency and openness
The analyses and research questions were pre-registered (https://osf.io/t3rh8). The analysis code is available on an Open Science Framework (OSF) repository (https://osf.io/gnj53). The deviations from the pre-registration are described in Supplementary Table S1. We analysed the data in R version 4.4.3 (R Core Team 2024) using the packages lavaan 0.6-21 (Rosseel Reference Rosseel2012) and ggplot2 4.0.2 (Wickham Reference Wickham2016).
Data and participants
We used longitudinal data from the HEalth, Aging, and Retirement Transitions in Sweden (HEARTS) study, comprising online or paper surveys on demographics, work, retirement, health, wellbeing, social relationships, personality and lifestyle. For details of the study’s design and procedure, see Lindwall et al. (Reference Lindwall, Berg, Bjälkebring, Buratti, Hansson, Hassing, Henning, Kivi, König, Thorvaldsson and Johansson2017). Ethical approval for the HEARTS study was obtained from the University of Gothenburg (Dnr: 970-14).
HEARTS invited a nationally representative population-based sample of 14,990 Swedish adults aged 60 to 66 in 2015, of which 5,913 (39.5%) participated in the baseline assessment (T1, 2015). Thus far, nine waves have been collected. We used data from the waves that included the social roles questionnaire, namely T5 (2019; n = 3,935), T6 (2020; n = 3,914) and T9 (2023; n = 3,160). As such, our analytic sample included older adults aged 64 to 74 years. Gender and education were taken from the baseline measurement of T1, while the other predictors were taken from T5.
From the sample at T5, we excluded 53 participants with missing data on the social roles questionnaire across all three waves. Our final analytic sample included N = 3,882 participants with a mean age of 66.9 years (range 63.2–70.3, SD = 2.0), of whom 54 per cent were female, 80 per cent in a relationship and 72 per cent retired. The average years of education was 13.7 (SD = 3.4) and the average self-reported health was 4.6 (SD = 1.0), indicating fair to good health. A detailed power analysis is provided in the pre-registration. Compared to the baseline sample at T1, the respondents in our analytic sample were comparable in baseline age (p = 0.191, d = 0.04) and gender (p = 0.191, φ = 0.02), but were slightly more educated (p < 0.001, d = 0.21) and in better health (p = 0.001, d = 0.48).
Measures
Social roles
Respondents rated the importance of ten specific social roles in their current lives on a five-point Likert scale from 1 (not at all important) to 5 (very important), with the option to rate a role as not applicable. The roles included partner, sibling, parent, friend, grandparent, care-giver, volunteer, worker (if still working), previous worker (if retired) and active membership (e.g. sports, organizations, congregations).
Depending on their retirement status, participants were asked to complete only the worker or previous worker role. However, we saw that many retired respondents filled in the previous profession role and vice versa, or filled in both. We decided to combine the roles into one ‘(previous) worker’ role based on retirement status, as follows: for retired respondents, the new ‘(previous) worker’ role had the value given to the previous worker role; for working respondents, the ‘(previous) worker’ role had the value given to the worker role. Therefore, the analyses included nine roles rather than ten.
In line with the definitions of Reitzes and Mutran (Reference Reitzes and Mutran2002), we computed the following person-specific variables: (1) the number of applicable roles (i.e. score > 0); (2) the number of very important roles (i.e. score = 5); and (3) the average importance, calculated as the mean across all applicable roles. We also computed nine role-specific relative importance scores by dividing each role’s importance by the person’s average importance rating. Scores above 1 indicated above-average relative importance, while scores below 1 indicated below-average importance. Roles marked as not applicable were coded as missing and therefore omitted in calculating the composite role scores and further analyses.
Predictors
As predictors, we included gender and education measured at T1, and health, retirement, relationship, social support and personality measured at T5.Footnote 1
Gender. Gender was coded as male, female or other.
Education. Education was measured as the total years of education attained.
Self-rated health. Health status was measured by asking participants ‘How do you rate your overall health condition?’, with response options ranging from 1 (very bad) to 6 (very good).
Retirement status. Retirement status was assessed by the item ‘Are you retired (i.e. have you started receiving old age pension)?’ with response options: 1 (no), 2 (yes – but continue working and do not perceive myself as a pensioner), 3 (yes – continue working but perceive myself as a pensioner), and 4 (yes, full-time retired). In our operationalization of retirement, the subjective experience – that is, perceiving oneself as s pensioner – was leading, as we were interested in the individual experience of retirement as a life transition. As such, we coded options 1 and 2 as ‘not retired’ and options 3 and 4 as ‘retired’. This operationalization has previously been employed by, for instance, Henning et al. (Reference Henning, Bjälkebring, Stenling, Thorvaldsson, Johansson and Lindwall2019).
Relationship status. For relationship status, respondents first indicated their civil status (1 = married/partner, 2 = single (never married), 3= divorced/separated , 4 =widow/widower ). Those who did not indicate that they were married/partnered received the follow-up question of whether they were currently in a relationship (yes/no). We measured relationship status as either being married or being in a relationship.
Social support. Social support was measured with the Multidimensional Scale of Perceived Social Support (MSPSS) (Zimet et al. Reference Zimet, Dahlem, Zimet and Farley1988). It consists of 12 self-reported items, evenly divided into three subscales: Family, Friends and Partner. Items are rated on a 7-point Likert scale (1 = completely false to 7 = completely true). Cronbach’s α was 0.95 for Family, 0.95 for Friend and 0.94 for Partner. We created person means for each subscale (scored from 1 to 7), with higher scores indicating greater support.
Personality. Personality was measured with the 20-item short form of the International Personality Item Pool (Mini-IPIP) (Donnellan et al. Reference Donnellan, Oswald, Baird and Lucas2006). Each of the big five personality traits (extraversion, agreeableness, conscientiousness, neuroticism and openness) was assessed with four items, including both positively and negatively keyed items, on a 5-point Likert scale (1 = completely false to 5 = completely true). Cronbach’s α was 0.79 for extraversion, 0.65 for agreeableness, 0.59 for conscientiousness, 0.62 for neuroticism and 0.65 for openness. We calculated person means for each personality trait, ranging from 1 to 5, where higher scores indicated higher trait levels.
Statistical analysis
We analysed the data in a structural equation modelling (SEM) framework, which offers a flexible way to assess longitudinal change while adequately handling common statistical issues such as missing data and unequal spacing between measurements. Furthermore, SEM models provide goodness-of-fit measures that assess how well they fit the data, which is an advantage over other longitudinal models, such as multi-level models (Hox Reference Hox and Little2013; Preacher Reference Preacher, Hancock, Stapleton and Mueller2018).Footnote 2
To answer if the (relative) importance of social roles changed over time in old age (RQ1), we ran separate latent growth curve models (LGCMs) on the following outcomes: the total number of roles, the number of very important roles, the average importance of all roles and the relative importance of the nine individual roles. We specified the linear slope (change) factor by constraining the measurement occasion loadings to represent years passed since the first assessment, that is, λ = 0 at T5, λ = 1 at T6 and λ = 4 at T9. We used Full Information Maximum Likelihood (FIML) to handle missing data.
To investigate whether the individual differences in the (relative) importance of social roles are explained by various predictors (RQ2), we loaded the following predictors on the intercept (level) and slope (change) of the social role outcomes: gender, education, health status, relationship status, retirement status, social support (from friends, family and partner) and the big five personality traits. A graphical representation of the model is shown in Supplementary Figure S1.
As we were primarily interested in inter-individual differences (e.g. how social roles and changes therein differ between those with high and low educational levels) rather than in intra-individual change associations (e.g. how changes in extraversion are associated with social role changes), we included time-invariant covariates based on their values at T1 (for gender and education) or T5 (for health status, social support and personality). The only exceptions were retirement and relationship status, which we included as time-variant covariates. We did so because later work and relationship status depend on initial status (i.e. one can only retire if still working at T5), and changes in status would alter social roles (e.g. decreasing relevance of work role). As such, including only the baseline variable would have led to the false conclusion that the work and partnership roles become less important for initially working and partnered older adults, but solely because a subset of participants will lose those roles over time. Therefore, for retirement and partner status, we included variables comparing the status in T5 with that in T9. These change variables are part of the models described in the main text; however, for readability, the results of these variables are presented in the Supplementary Materials (Appendix A).
LGCMs assessing changes in the relative importance of partner and sibling failed to converge. Upon further investigation, we noticed that this was due to some participants having extreme values. To account for these outliers, all instances more than three standard deviations above or below the mean for all relative importance scores were set to missing.Footnote 3
Model inference
We used the Benjamini–Hochberg adjustment of the p-values to correct for multiple testing (Benjamini and Hochberg Reference Benjamini and Hochberg1995). To assess the LGCM fit, we used the following goodness of fit indices: comparative fit indices (CFI; acceptable above 0.90), root mean squared error of approximation (RMSEA; acceptable below 0.08) and standardized root mean squared residual (SRMR; acceptable below 0.08) (Hu and Bentler Reference Hu and Bentler1999).
Sensitivity analysis
Since we combined the ‘worker’ and ‘previous worker’ roles based on retirement status, this outcome is interpreted differently for retired respondents (rating their current work) and non-retired respondents (rating their previous work). As a consequence of retirement, therefore, respondents do not rate the same role over waves: they rate their current work on waves where they are working and their previous work on waves where they are retired. Thus, changes in work role importance could simply reflect older adults’ rating a different role than actual changes in individual importance. Therefore, we ran the model for the work role without predictors on the subsample of 2,176 respondents who did not transition during the study period – that is, either worked at both T5 and T9 (n = 226) or were retired at both T5 and T9 (n = 1,950). This did not change the model’s conclusions (see Appendix B of the Supplementary Materials).
Results
Descriptive results
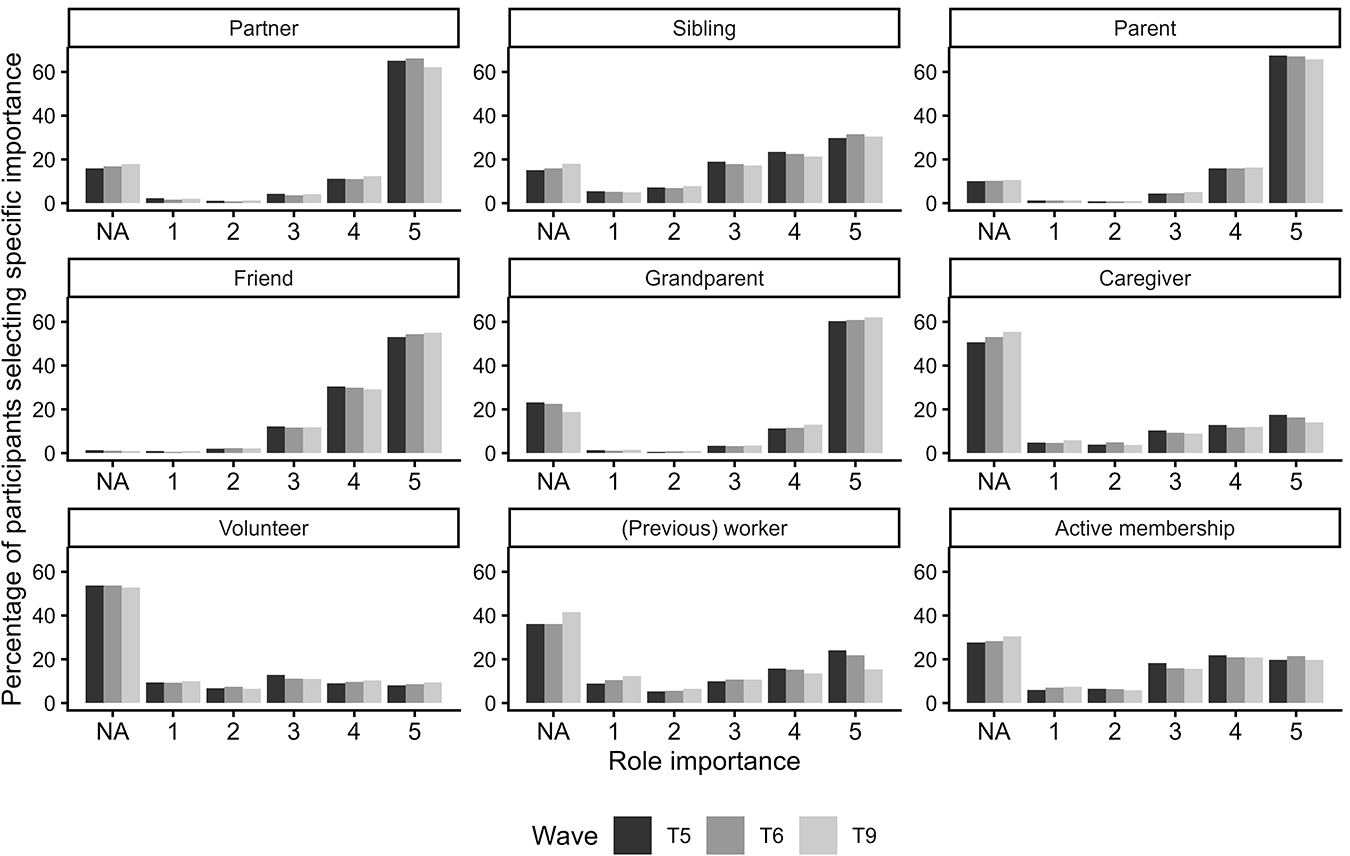
On average, participants held 6.61 roles at T5 (SD = 1.84), of which 3.43 were rated very important (SD = 2.05). The average importance was 4.14 (SD = 0.67), indicating high importance. The roles of parent, partner, friend and grandparent are indicated by most participants as applicable (range 76.8%–98.6%) and very important (range 53.0%–67.5%). In contrast, activity- and work-related roles (i.e. care-giver, volunteer, (previous) worker and active membership) were rated more evenly, with fewer individuals rating these roles as applicable (range 46.3%–72.3%) or very important (range 8.1%–24.0%). See Figure 1 for the distribution of role importance scores.
Distributions of importance for all social roles separately for each wave. Role importance ranged from 1 (not at all important) to 5 (very important), with NA = not applicable. For every role in every wave, percentages were calculated by dividing the count per importance value by the total number of responses in that role and wave.

Figure 1 Long description
The image contains nine bar graphs, each representing the importance of different social roles across waves labeled T5, T6 and T9. The x-axis is labeled 'Role importance' with values ranging from NA (not applicable) to 5 (very important). The y-axis is labeled 'Percentage of participants' ranging from 0 to 60 percent. Each graph corresponds to a specific role: Part ner, Sibling, Parent, Friend, Grandparent, Caregiver, Volunteer, Previous work and Active membership. The bars are differentiated by shades representing different waves. 1. Part ner: Shows a peak at importance level 5 across all waves. 2. Sibling: Displays a gradual increase in importance from level 1 to 5. 3. Parent: Importance peaks at level 5, with consistent high values across waves. 4. Friend: Importance peaks at level 5, with noticeable differences between waves. 5. Grandparent: Shows a peak at importance level 5, with wave T9 having the highest percentage. 6. Caregiver: Displays a more even distribution across importance levels. 7. Volunteer: Shows lower importance levels, peaking at level 3. 8. Previous work: Importance is spread across levels, with peaks at level 3. 9. Active membership: Shows a peak at level 3, with wave T9 having the highest percentage. The graphs highlight variations in role importance across different waves, with roles like Part ner and Parent consistently rated as very important, while roles like Volunteer and Active membership show more varied importance levels.
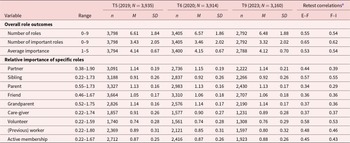
Table 1 provides descriptive statistics of the outcomes (descriptives of predictors are shown in Supplementary Table S2). Over time, the overall social role outcomes and the relative importance of all roles remained largely stable (retest correlations between 0.29 and 0.65). On average, the roles of partner, parent, grandparent, friend and (previous) worker were given above-average importance at T5 (i.e. scores above one), while the other roles were given below-average importance (i.e. scores below one).
Descriptive statistics and retest correlations for the different role outcomes

Table 1 Long description
The table reports descriptive statistics at three measurement waves in 2019, 2020, and 2023 for overall role outcomes and the relative importance assigned to specific roles, along with retest correlations between adjacent waves. Overall, the mean number of roles is stable and slightly declines from 6.61 in 2019 to 6.48 in 2023, while the mean number of important roles stays near 3.3 to 3.5. Average importance remains consistently high at about 4.12 to 4.15 on a five-point scale. For relative importance, partner, parent, and grandparent are above a person’s average across roles at about 1.13 to 1.15, while sibling and caregiver are below average at about 0.89 to 0.92; volunteer and (previous) worker are lowest, around 0.74 to 0.80. Most role-specific means change little across waves, with a small increase for volunteer and a gradual decrease for (previous) worker. Retest correlations indicate moderate stability overall, highest for number of important roles and volunteer, and lower for parent and friend; correlations are reported as statistically significant, but they do not indicate causation.
Notes: M: mean, SD: standard deviation. Retest correlations show bivariate Pearson correlation coefficients between two subsequent measurements. Relative importance is measured as the person-specific ratio between the specific role importance divided by the person-mean across all applicable roles. A value below 1 indicates below-average importance; a value above 1 indicates above-average importance.
a All correlations are significant at p < 0.001.
The correlation table (Supplementary Table S3) shows small but significant correlations between most predictors and the overall role outcomes. Most notable are the correlations between relationship status and the number of roles (r = 0.28, p < 0.001 for all waves) and between the different forms of social support and the number of important roles (rs 0.32–0.40, p < 0.001) and the average importance (rs 0.26–0.41, p < 0.001). Correlation tables between the predictors and the relative importance of specific roles are provided in Supplementary Tables S4 and S5.
Intra-individual change in role importance
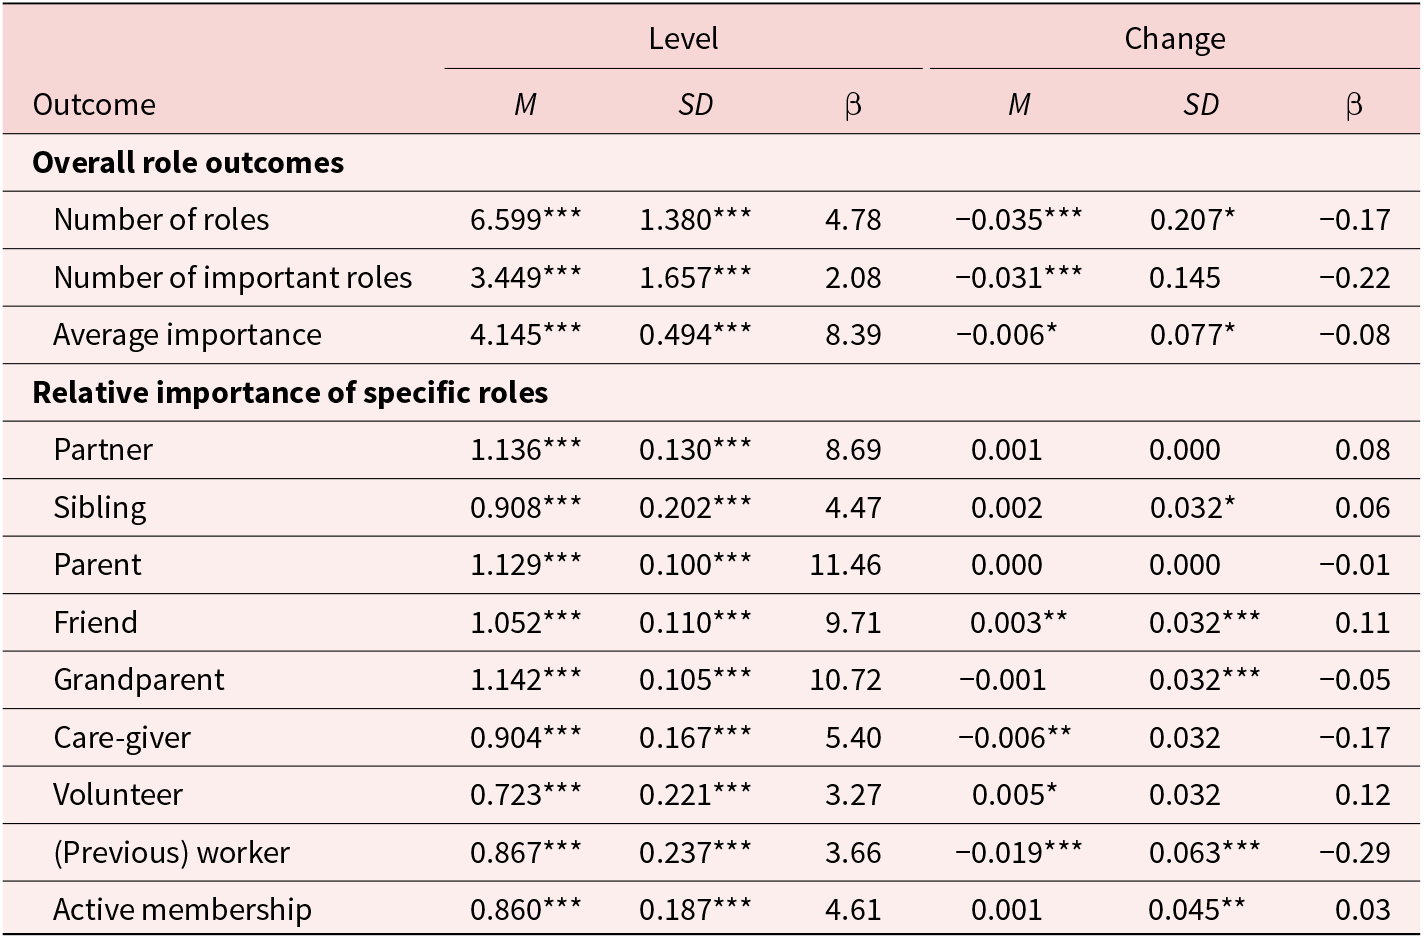
To assess whether the social role outcomes changed over time (RQ1), we ran LGCMs without predictors for all outcomes separately. The model fit of all models was good (Supplementary Table S6). Table 2 shows that with age, older adults reported fewer roles (p < 0.001) and fewer important roles (p < 0.001), and perceived their roles as less important, on average (p = 0.038). Furthermore, we found average increases in the relative importance of the friend role (p = 0.003) and the volunteer role (p = 0.022), as well as average decreases in the relative importance of the (previous) work role (p < 0.001) and the care-giver role (p = 0.008). The relative importance of the other roles did not change significantly over time.
Parameter estimates of LGCMs assessing level and change in older adults’ social roles over time
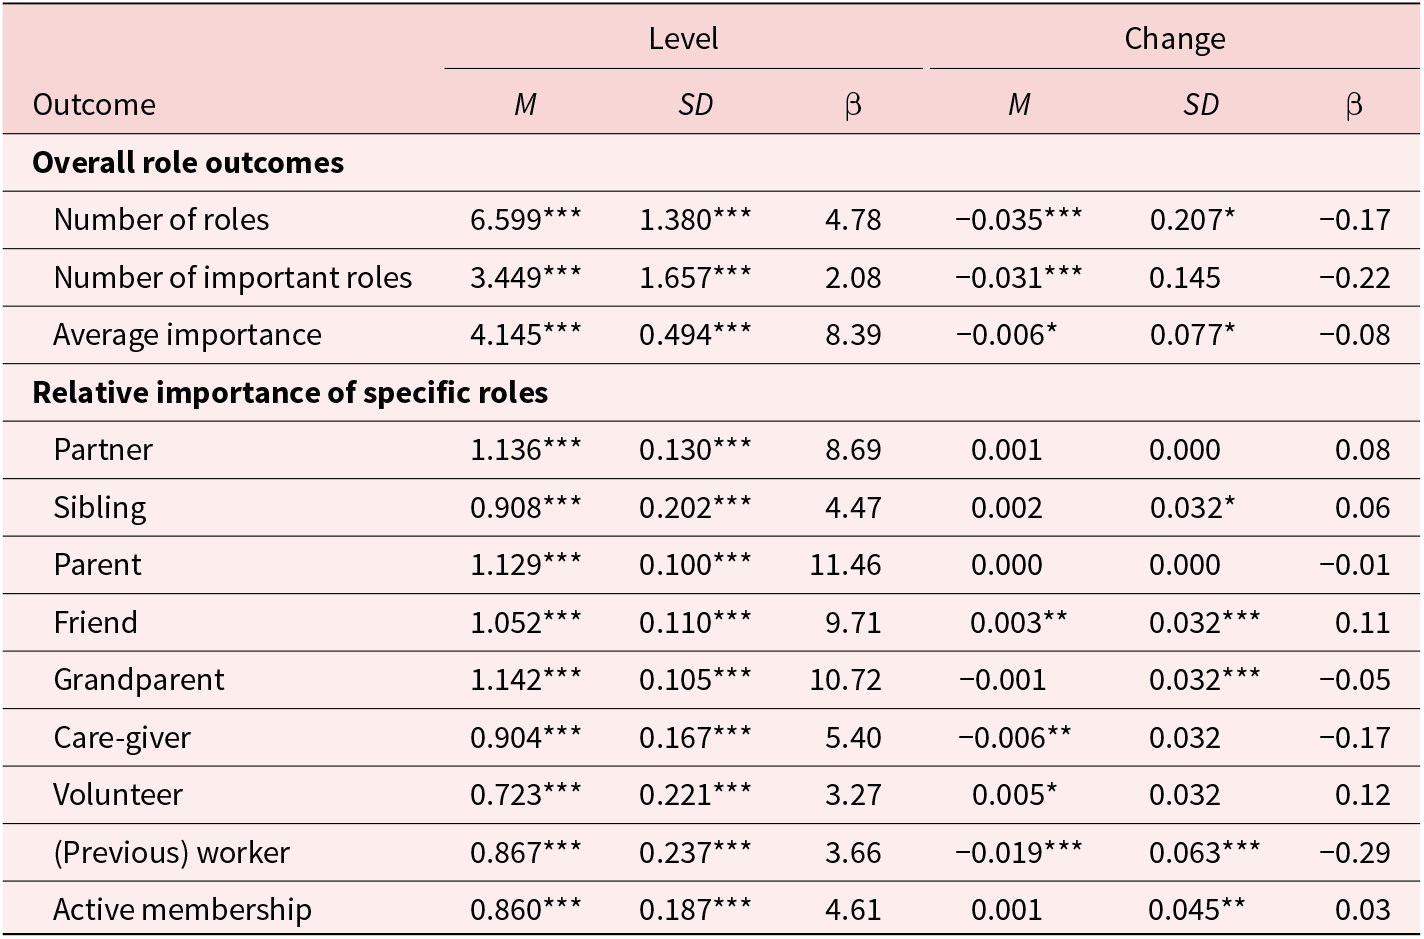
Table 2 Long description
The table reports latent growth curve model estimates for older adults’ social roles, separating starting level from change over time for overall role counts, average importance, and the relative importance of specific roles. At baseline, participants average about 6.6 roles and about 3.4 important roles, and average importance is about 4.15; all three show small declines over time. Relative importance at baseline is highest for grandparent, partner, and parent roles (each around 1.13 to 1.14), and lowest for volunteer (about 0.72). Over time, friend and volunteer roles show small increases in relative importance, while caregiver and especially previous work show decreases, with previous work having the largest negative change. Partner, sibling, parent, and active membership show little to no change in relative importance. Reported significance markers indicate which estimates are statistically reliable, and some role models exclude extreme outliers, so changes should be interpreted as modest average trends rather than uniform shifts for every individual.
Notes: M: mean, SD: standard deviation. The results are based on separate LGCMs for every outcome. For the relative importance models, we excluded outliers deviating more than 3 SD from the mean to prevent estimation problems in the partner and sibling models.
Significance levels: * p < 0.05, ** p < 0.01, *** p < 0.001
For the sensitivity analysis (details shown in Appendix B of the Supplementary Materials), we repeated the LGCM of the relative importance of the (previous) work role on the subsample of respondents who did not transition during the study period (i.e. either remained working or remained stable). In this subsample, the relative importance of the work role still showed a significant decrease over time (β = –0.08, p = 0.048), thereby reconfirming our main conclusions.
Inter-individual differences in role importance over time
To study whether changes in role importance can be predicted by individual characteristics (RQ2), we regressed the latent intercept and slope for each outcome on the predictors using separate LGCMs for each role outcome. The model fit for all models was good (Supplementary Table S6). We found that none of the baseline predictors significantly explained individual differences in change in all outcomes. Therefore, we illustrate only the baseline associations in Figures 2 to 4 (see Supplementary Figures S2–S4 for all change parameters). Based on the descriptive results, we divided the outcomes into three parts: overall role outcomes (i.e. number of roles, number of important roles and average importance), family and friend roles (i.e. partner, sibling, parent, friend and grandparent) and activity- and work-related roles (i.e. care-giver, volunteer, (previous) worker and active membership).
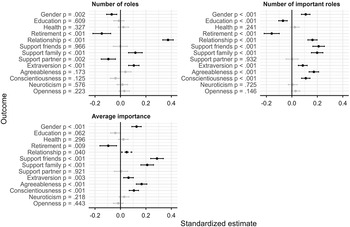
Standardized LGCM level estimates of baseline predictors on the overall role outcomes. Figures show standardized point estimates (dots) with the 95 per cent confidence intervals (lines). Grey solid lines indicate non-significant estimates, black dashed lines indicate 0.01 < p < 0.05, and black solid lines indicate p < 0.01. Change parameters omitted as none were significant.
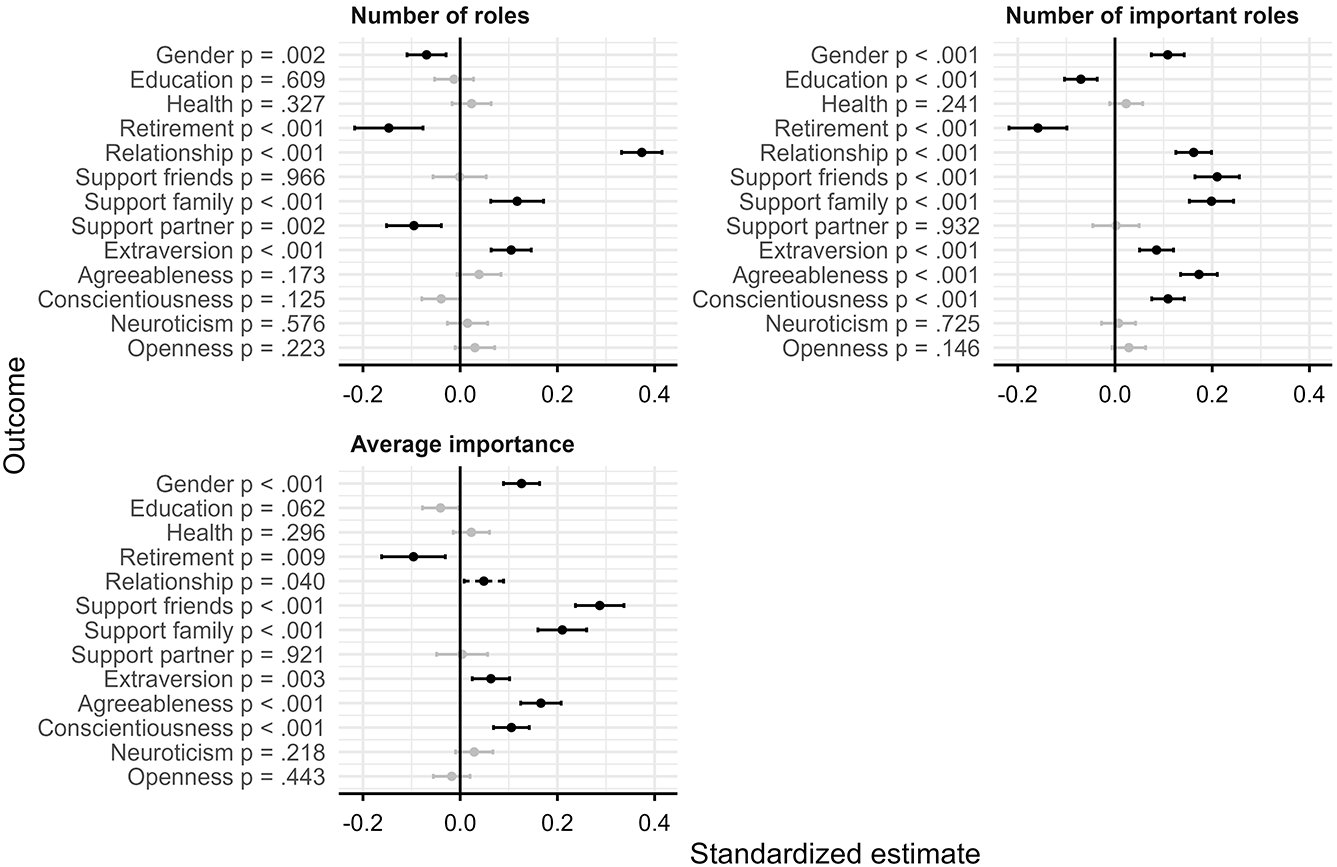
Figure 2 Long description
Standardized LGCM level estimates of baseline predictors on the overall role outcomes. Figures show standardized point estimates (dots) with the 95 percent confidence intervals (lines). Grey solid lines indicate non-significant estimates, black dashed lines indicate .01 less than p less than .05 and black solid lines indicate p less than .01. Number of roles The y-axis lists predictors: Gender, Education, Health, Retirement, Relationship, Support family, Support friends, Extraversion, Agreeableness, Conscientiousness, Neuroticism, Openness. The x-axis is labeled Standardized estimate, ranging from minus 0.2 to 0.4. Dots represent standardized estimates and whiskers show 95 percent confidence intervals. Notable predictors include Education with a positive estimate around 0.3 and Health with a positive estimate around 0.25. Number of important roles The y-axis lists the same predictors. The x-axis ranges from 0.0 to 0.4. Education and Health show positive estimates near 0.3, while Openness is near zero. Average importance The y-axis lists predictors and the x-axis ranges from minus 0.2 to 0.4. Relationship shows a positive estimate around 0.3, while Retirement has a negative estimate near minus 0.1. Confidence intervals crossing zero indicate non-significance. The plots highlight the varying influence of predictors on role outcomes, with Education and Health consistently showing positive effects.
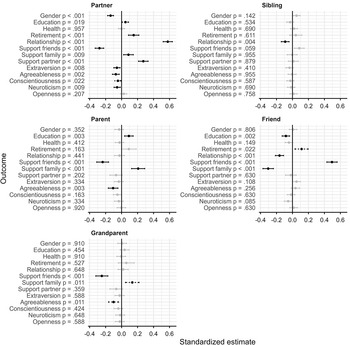
Standardized LGCM level estimates of baseline predictors on the relative importance of family and friend roles. Figures show standardized point estimates (dots) with the 95 per cent confidence intervals (lines). Grey solid lines indicate non-significant estimates, black dashed lines indicate 0.01 < p < 0.05, and black solid lines indicate p < 0.01. Change parameters omitted as none were significant.
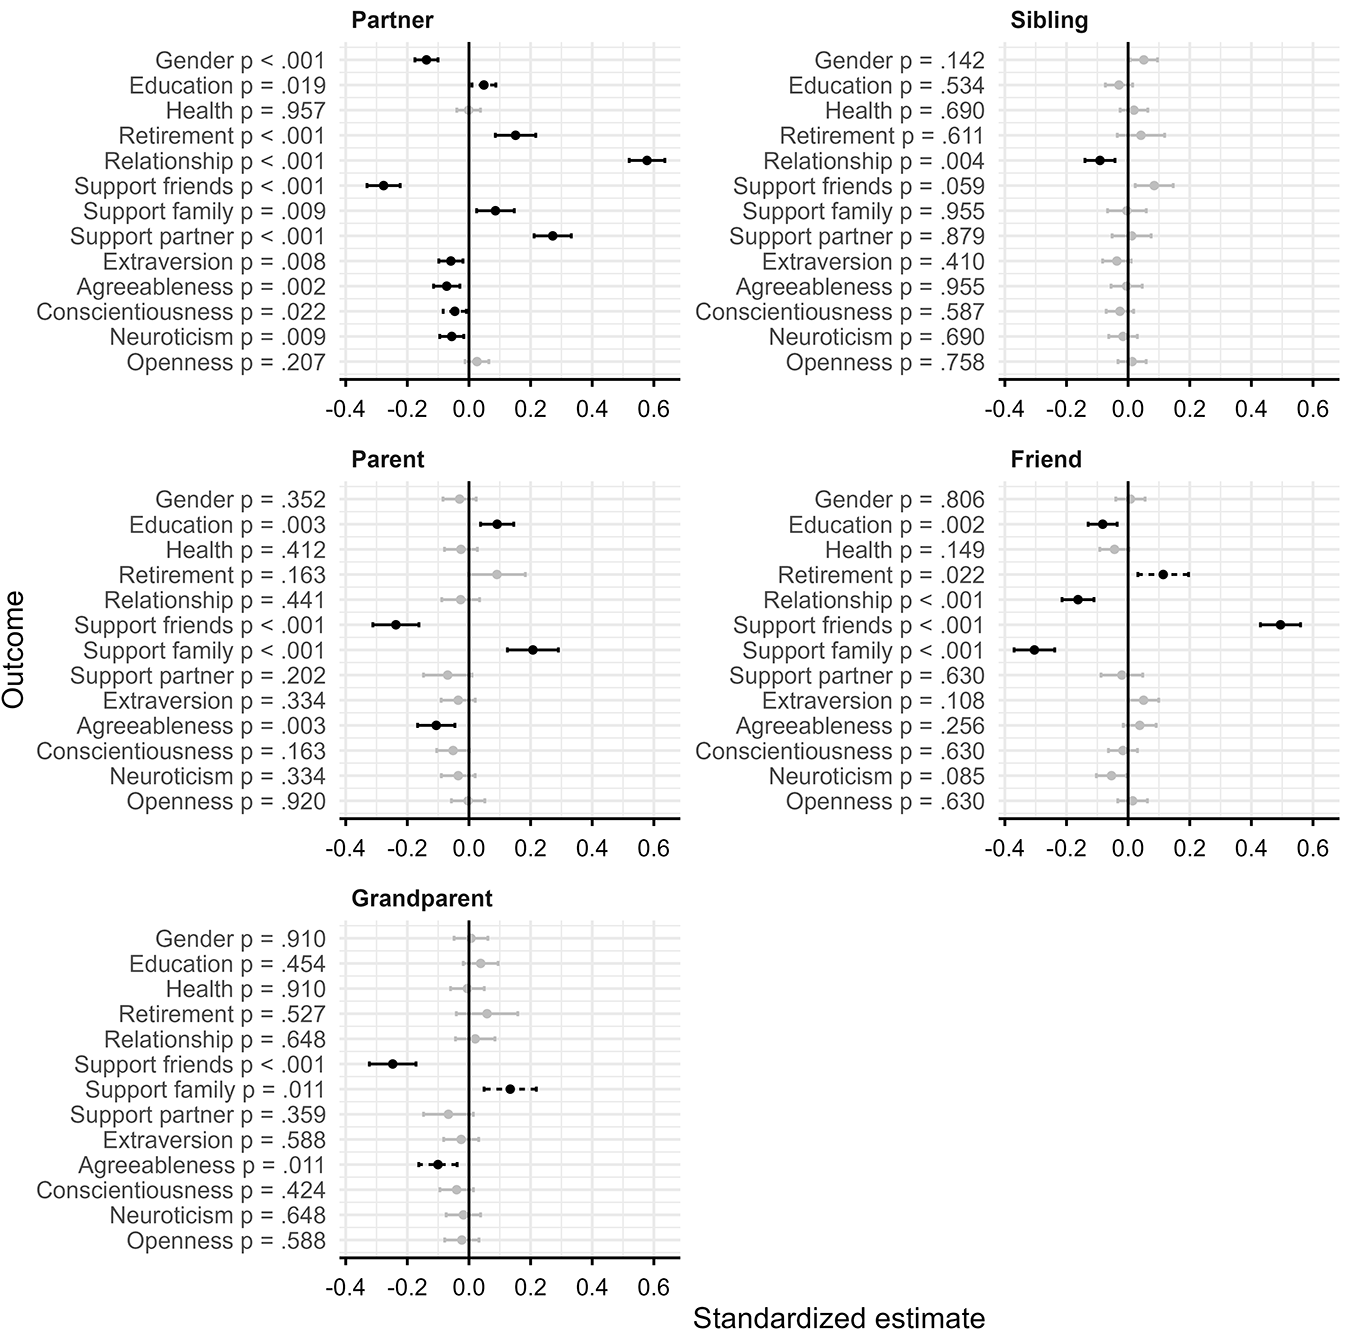
Figure 3 Long description
The figure contains five forest plots arranged as partner, sibling, parent, friend and grandparent. Each plot shares the same x-axis labeled standardized estimate, ranging from -0.4 to 0.6. The y-axis in each plot lists ten predictors: gender, education, health, relationship quality, support from friends, support from family, agreeableness, conscientiousness, extraversion, neuroticism and openness. Each predictor is shown as a point estimate (dot) with a line representing the 95 percent confidence interval. Lines that are grey and solid indicate non-significant estimates. Lines that are black and dashed indicate significance at .01 less than p less than .05. Lines that are black and solid indicate significance at p less than .01. In the partner plot, p values are listed beside each predictor: gender p less than .001, education p equals .018, health p equals .087, relationship quality p equals .003, support from friends p equals .021, support from family p less than .001, agreeableness p equals .088, conscientiousness p equals .122, extraversion p equals .008, neuroticism p equals .022, openness p equals .207. In the sibling plot, p values include: gender p equals .142, education p equals .011, health p equals .311, relationship quality p equals .480, support from friends p equals .024, support from family p equals .109, agreeableness p equals .412, conscientiousness p equals .587, extraversion p equals .410, neuroticism p equals .690, openness p equals .758. In the parent plot, p values include: gender p equals .352, education p equals .003, health p equals .441, relationship quality p equals .001, support from friends p equals .001, support from family p equals .148, agreeableness p equals .033, conscientiousness p equals .334, extraversion p equals .403, neuroticism p equals .024, openness p equals .588. In the friend plot, p values include: gender p equals .806, education p equals .149, health p equals .022, relationship quality p equals .001, support from friends p equals .410, support from family p equals .029, agreeableness p equals .298, conscientiousness p equals .295, extraversion p equals .093, neuroticism p equals .690, openness p equals .085. In the grandparent plot, p values include: gender p equals .918, education p equals .454, health p equals .183, relationship quality p equals .027, support from friends p equals .001, support from family p equals .027, agreeableness p equals .399, conscientiousness p equals .024, extraversion p equals .577, neuroticism p equals .388, openness p equals .388. Across all five plots, estimates with confidence intervals that do not cross zero and are marked with black lines represent statistically significant predictors. The largest standardized estimates in magnitude appear in the partner and grandparent plots, with support from friends and support from family showing positive estimates in the grandparent plot near 0.4 to 0.6 on the standardized estimate scale.
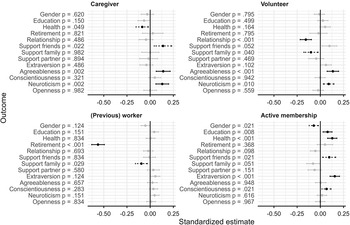
Standardized LGCM level estimates of baseline predictors on the relative importance of activity and work roles. Figures show standardized point estimates (dots) with the 95 per cent confidence intervals (lines). Grey solid lines indicate non-significant estimates, black dashed lines indicate 0.01 < p < 0.05, and black solid lines indicate p < 0.01. Change parameters omitted as none were significant.

Figure 4 Long description
The figure consists of four forest plots, each representing standardized estimates for different roles: caregiver, volunteer, previous work and active membership. The x-axis is labeled 'Standardized estimate,' ranging from -0.5 to 0.5. The y-axis lists predictors such as gender, education, health, retirement, relationships, support from friends and partner, agreeableness and openness. Each plot includes dots representing point estimates with lines indicating 95 percent confidence intervals. Grey solid lines denote non-significant estimates, black dashed lines indicate significance between 0.01 and 0.05 and black solid lines indicate significance less than 0.01. The vertical zero line represents no effect. In the caregiver plot, predictors like support from friends and partner show positive effects. The volunteer plot highlights significant positive effects for education and relationships. The previous work plot shows significant negative effects for health and retirement. The active membership plot indicates positive effects for relationships and support from friends. Each panel illustrates distinct models for the respective roles, highlighting differences in predictor significance and magnitude across roles.
Overall role outcomes
The level estimates for the overall role outcomes are provided in Figure 2.
Number of roles. More roles were deemed applicable when in a relationship (ꞵ = 0.37, p < 0.001), receiving more support from family (ꞵ = 0.12, p < 0.001) and being more extraverted (ꞵ = 0.10, p < 0.001), while fewer roles were rated by women (ꞵ = –0.07, p = 0.002), retirees (ꞵ = –0.15, p < 0.001) and individuals receiving more partner support (ꞵ = –0.10, p = 0.003).
Number of important roles. More roles were rated very important for women (ꞵ = 0.11, p < 0.001), those with a partner (ꞵ = 0.16, p < 0.001), respondents receiving more support from friends (ꞵ = 0.21, p < 0.001) and family (ꞵ = 0.20, p < 0.001) and those with higher levels of extraversion (ꞵ = 0.09, p < 0.001), agreeableness (ꞵ = 0.17, p < 0.001) and conscientiousness (ꞵ = 0.11, p < 0.001). Fewer roles were deemed important for respondents with fewer years of education (ꞵ = –0.07, p < 0.001) and retirees (ꞵ = –0.16, p < 0.001).
Average importance. The average importance across applicable roles was found to be higher for women (ꞵ = 0.13, p < 0.001), when in a relationship (ꞵ = 0.05, p = 0.040), when receiving more support from friends (ꞵ = 0.29, p < 0.001) and family (ꞵ = 0.21, p < 0.001) and when being more extraverted (ꞵ = 0.06, p = 0.004), agreeable (ꞵ = 0.17, p < 0.001) or conscientious (ꞵ = 0.11, p < 0.001), while roles were rated as less important for retirees (ꞵ = –0.10, p = 0.010).
Relative importance of family and friend roles
Figure 3 shows the level estimates of the predictors on the relative importance of the family and friend roles (i.e. partner, sibling, parent, friend and grandparent).
Partner. Higher relative partner ratings were given by respondents being higher educated (ꞵ = 0.05, p = 0.020), retired (ꞵ = 0.15, p < 0.001), in a relationship (ꞵ = 0.58, p < 0.001) and receiving more support from family (ꞵ = 0.09, p = 0.010) and the partner (ꞵ = 0.27, p < 0.001). Lower partner ratings were given by women (ꞵ = –0.14, p < 0.001), those receiving more friends’ support (ꞵ = –0.28, p < 0.001) and those higher in extraversion (ꞵ = –0.06, p = 0.008), agreeableness (ꞵ = –0.07, p = 0.003), conscientiousness (ꞵ = –0.05, p = 0.022) and neuroticism (ꞵ = –0.06, p = 0.009).
Sibling. We only found that being in a relationship predicted lower relative important scores for the sibling role (ꞵ = –0.09, p = 0.004).
Parent. Higher relative parent ratings were given for more years of education (ꞵ = 0.09, p = 0.004) and more family support (ꞵ = 0.21, p < 0.001). In comparison, ratings were lower for those with more friend support (ꞵ = –0.24, p < 0.001) and higher levels of agreeableness (ꞵ = –0.11, p = 0.003).
Friend. Higher relative importance of the friend role was found for those being retired (ꞵ = 0.11, p = 0.023) and receiving more friend support (ꞵ = 0.50, p < 0.001), while those with more years of education (ꞵ = –0.08, p = 0.003), being in a relationship (ꞵ = –0.16, p < 0.001) and receiving more family support (ꞵ = –0.30, p < 0.001) rated the friend role as less important.
Grandparent. Higher relative grandparent ratings were given by those receiving more family support (ꞵ = 0.13, p = 0.011). In comparison, lower ratings were given by those receiving more friend support (ꞵ = –0.25, p < 0.001) and those higher in agreeableness (ꞵ = –0.10, p = 0.011).
Relative importance of activity- and work-related roles
Figure 4 shows the level estimates of the predictors on the relative importance of the activity-related roles (i.e. care-giver, volunteer, (previous) worker and active membership).
Care-giver. Higher relative care-giver ratings were given by those receiving more friend support (ꞵ = 0.14, p = 0.023) and those higher in agreeableness (ꞵ = 0.14, p = 0.002) and neuroticism (ꞵ = 0.13, p = 0.002), whereas lower ratings were given by those in better health (ꞵ = –0.09, p = 0.049).
Volunteer. The volunteer role was rated higher by those higher in agreeableness (ꞵ = 0.14, p < 0.001) and neuroticism (ꞵ = 0.09, p = 0.011), and lower by those in a relationship (ꞵ = –0.16, p < 0.001) and receiving more family support (ꞵ = –0.10, p = 0.041).
(Previous) work. Lower relative (previous) work ratings were given by retirees (ꞵ = –0.56, p < 0.001) and those receiving more family support (ꞵ = –0.10, p = 0.030).
Active membership. Higher ratings of the active membership role were given by those with more years of education (ꞵ = 0.08, p = 0.009), better health (ꞵ = 0.13, p < 0.001), more friend support (ꞵ = 0.10, p = 0.021) and those higher in extraversion (ꞵ = 0.16, p < 0.001) and conscientiousness (ꞵ = 0.07, p = 0.021), whereas lower ratings were given by women compared to men (ꞵ = –0.07, p = 0.021).
Discussion
This exploratory study assessed the longitudinal trajectories of social role importance in older adults around the retirement transition. Understanding the importance individuals allocate to their roles and how this evolves over time is a crucial first step in examining how social roles can contribute to later-life wellbeing. This study contributes to the literature in several ways. First, using a new social roles questionnaire, we assessed qualitative aspects of role occupancy that are known to be relevant to the study of roles and wellbeing (Thoits Reference Thoits2012; Kulik Reference Kulik2015). Occupying (multiple) roles primarily benefits wellbeing when the roles are important, and individuals derive personal meaning from them (Thoits Reference Thoits2012; Heaven et al. Reference Heaven, Brown, White, Errington, Mathers and Moffatt2013; Burke and Cerven Reference Burke, Cerven, Stets and Serpe2019).
Second, covering a four-year timespan, this is the first study to investigate longitudinal stability and change in (the importance of) social roles. Previous studies either were cross-sectional (e.g. Adelmann Reference Adelmann1994; Reitzes and Mutran Reference Reitzes and Mutran2002; Kulik Reference Kulik2015) or covered related constructs such as life goals (Buchinger et al. Reference Buchinger, Richter and Heckhausen2022). However, a longitudinal perspective on social roles is essential, as role occupancy and importance are likely to change across the older adult lifespan and shape one’s social interactions and relationships (Thoits Reference Thoits2012).
Stability and change in overall role importance
We found that the number of roles, the number of important roles and their average importance decreased over time. Major life transitions, such as retirement or widowhood, often result in role losses. Although role losses can open up time and energy to invest in new or existing roles (Super Reference Super1980), specific roles might be challenging to replace due to their emotional closeness (Baltes et al. Reference Baltes, Lindenberger, Staudinger, Damon and Lerner2007). From a socio-emotional selectivity perspective, older adults might be less inclined to take on new positions to replace lost roles and instead focus on increasing investments in important existing roles (English and Carstensen Reference English and Carstensen2014), thereby decreasing the total number of roles.
We also observed a decrease in the number of important roles and average importance over time. While Super (Reference Super1980) assumed that the total amount of ‘importance’ an individual distributes across roles remains equal across the lifespan, our findings indicate a decrease in the total resources available or used, resulting in fewer roles assessed as very important and a lower average importance. This may reflect older adults having fewer resources to invest in roles over time (Baltes et al. Reference Baltes, Lindenberger, Staudinger, Damon and Lerner2007; Huxhold et al. Reference Huxhold, Fiori and Windsor2022). Alternatively, it could mean that very important roles either are not replaced by other very important roles or are replaced by less important ones, such as volunteering, which may not provide the same fulfilment as the work role. We found a significant increase in the importance of the friend role and a decrease in the importance of work and care-giving. This could indicate that the total decrease in work and care-giving outweighs the increase in the friend role, resulting in a lower average importance across all roles.
Taken together, this longitudinal investigation of overall importance provides novel insights into whether and how the assessment of roles might be (re)distributed in later life. The next step would be to dive deeper into specific role transitions such as retirement, grandparenthood or widowhood, to empirically test how role structure develops in later life.
Predictors of individual differences in overall role importance
In general, we observed a consistent pattern when predicting individual differences in the overall role outcomes: all three outcomes tended to be higher among individuals who live in contexts that support the accumulation of multiple roles – such as having a partner, having supportive relationships, being employed and having certain personality traits known to promote an active lifestyle (i.e. extraversion, agreeableness; Iveniuk Reference Iveniuk2019) and being disciplined and dutiful (i.e. conscientiousness; Lodi-Smith and Roberts Reference Lodi-Smith and Roberts2012).
We highlight two specific findings related to individual differences in overall role importance outcomes: gender and retirement. First, women reported fewer roles than men, but they reported more important roles and a higher average importance. This seems contradictory to studies showing larger networks for women (McDonald and Mair Reference McDonald and Mair2010). However, active parenting and care tasks typically hinder women’s network maintenance in midlife (Ajrouch et al. Reference Ajrouch, Blandon and Antonucci2005), making their networks more vulnerable to declines in size, proximity and contact frequency later in life. Furthermore, the greater number of important roles and the higher average importance for women corroborate research showing that women’s networks contain more strong-tied family and friends than men’s (Nakash et al. Reference Nakash, Arnon, Hayat and Abu Kaf2022).
Second, retired older adults have fewer roles, fewer important roles and lower average importance than non-retired peers. However, these losses are accompanied by the increased relative importance of the partner and friend roles. Recent studies show a similar shift from the worker role towards a focus on stronger ties (Kauppi et al. Reference Kauppi, Virtanen, Pentti, Aalto, Kivimäki, Vahtera and Stenholm2021; Comi et al. Reference Comi, Cottini and Lucifora2022). Future research should explore whether these substitutions reflect conscious, voluntary shifts or losses that retirees cannot compensate for.
Stability and change in the relative importance of social roles
Over the observed timespan, we found the relative importance of the roles to be highly stable. We observed individual differences in baseline levels but not in changes in relative importance. In other words, we found predictors for inter-individual differences but no intra-individual changes.
The relative importance of family and friend roles
The consistent importance of family and friend roles largely aligns with previous empirical studies (Reitzes and Mutran Reference Reitzes and Mutran2002; Vidovićová Reference Vidovićová, Zaida, Harper, Howse, Lamura and Perek-Białas2018b). From socio-emotional selectivity theory, we would have expected family roles to become more important over time, as individuals increasingly invest time and effort in emotionally meaningful, strong-tie relationships (Carstensen Reference Carstensen2021; Chereches et al. Reference Chereches, Ballhausen, Olaru, Laukka and Brehmer2025). However, we found little change across waves, as family roles are consistently rated as (very) important. This stability might suggest that the increases in role importance proposed by socio-emotional selectivity occurred prior to our observation period, resulting in a stable trajectory in our analytic sample. Alternatively, it may indicate that the perceived relative importance of family roles typically comprises already well-established, long-lasting relationships that may be less susceptible to life events and transitions than other roles (Antonucci and Akiyama Reference Antonucci and Akiyama1987; Weiss et al. Reference Weiss, Lawton and Fischer2022).
We also found that higher perceived social support in one of the domains (i.e. friends, family or partner) was usually associated with increased relative importance of roles within that domain, with siblings as the notable exception. For instance, those who prioritized their roles as parents or grandparents received more support from their family and less from friends, whereas those who prioritized their role as friends received more support from friends and less from family. This indicates a pattern of reciprocity, where older individuals value roles that provide the most support (Cramer Reference Cramer2006). Conversely, rating a role as important may reflect a stronger investment in that relationship, leading to greater support received.
Previous wellbeing research has distinguished between family and friend ties based on the voluntariness of the relationship and, consequently, perceived support (Huxhold et al. Reference Huxhold, Miche and Schüz2014). While family ties are obligatory and provide more instrumental support, friends are voluntary and better sources of social integration and companionship. Although we did not find a difference in absolute role importance, we observed a significant increase in the importance of friends over time. This is consistent with Huxhold et al. (Reference Huxhold, Miche and Schüz2014), who showed that interactions with friends, rather than with family, predict life satisfaction in older adults.
A notable exception to the importance of family roles is the sibling role, which is often rated as less important than other family roles. This may stem from the unique nature of the sibling bond. Unlike parent–child relationships, sibling relationships are relatively independent and voluntary (Sýkorová Reference Sýkorová2024). This could reduce the perceived responsibility and importance of the relationship, especially for those who are not in need of support.
For the roles of grandparent and partner, we found lower importance ratings of individuals high on extraversion, agreeableness and conscientiousness. This seemingly contradicts previous studies showing higher trait scores to be related to higher partner and grandparent relationship satisfaction (Hakoyama and MaloneBeach Reference Hakoyama and MaloneBeach2013; Schaffhuser et al. Reference Schaffhuser, Allemand and Martin2014). However, these three personality traits are also associated with larger networks, stronger ties and greater perceived support (Iveniuk Reference Iveniuk2019; Hill et al. Reference Hill, Pfund, Allemand, Kivi, Berg, Thorvaldsson and Hansson2024). As, by definition, a role’s relative importance relates to all other acquired roles, the lower relative role importance in our study may result from the presence of multiple other important roles associated with these personality traits. This highlights the importance of studying multiple roles relative to each other.
The relative importance of the grandparent role was high and remained high over time for almost all role occupants. While previous literature has found that grandparent–grandchild contact decreases over time (Chereches et al. Reference Chereches, Ballhausen, Olaru, Laukka and Brehmer2025), the discrepancy with our findings underscores a difference between role importance and role occupancy. Rating the grandparent role as important may be only partly related to the amount of contact older adults have with their grandchildren. Instead, it might be the sum of contact frequency, intrinsic value, role centrality in one’s identity and cultural norms (Thoits Reference Thoits2012).
The relative importance of activity-related roles
For activity-related roles (i.e. care-giver, volunteer, (previous) worker and active membership), the importance varies more across individuals. This could reflect differences in the voluntariness and purpose of these roles. For example, perceived voluntariness is an important predictor of role satisfaction in grandparents (Glaser and Di Gessa Reference Glaser and Di Gessa2025). On the other hand, care-giving and working are often done out of a sense of duty or obligation, which does not necessarily reflect the importance of one’s role. This may, for instance, explain the negative association between health and care-giver importance, possibly reflecting the increased obligation to provide care when in better health. The decline in the importance of the care-giver role may reflect the end of care tasks due to the care recipient’s passing away or ageing (in the case of grandchildren), or due to functional or health declines in the care-giver.
Lastly, many of the individual differences found in the active membership importance reflected differences in opportunities for active ageing. Lower health and education decreased physical and financial options for organization membership (World Health Organization 2002), reflected in the lower importance given by those individuals. We also found that women gave lower ratings than men. As argued by Calasanti and Repetti (Reference Calasanti and Repetti2018), women are less able than men to engage in active membership, as they often continue household and informal care tasks after retirement.
Limitations and future perspectives
This article explores longitudinal changes in social role importance in older adults, focusing on their stability and changes in later life. Some limitations should be considered when interpreting the results. First, the study was exploratory and descriptive, primarily aimed at providing an overview of intra- and inter-individual changes and differences in social role importance and identifying possible predictors of change. While the predictors were carefully selected based on theoretical grounding and prior literature, we did not formulate a priori hypotheses, primarily because of the wide range of predictors and roles. This should be considered when interpreting the current study’s results.
Second, based on the effect sizes and confidence intervals, most changes were relatively small, with overall relative stability in social roles over time. To confirm whether these results are both practically and conceptually meaningful, we recommend replicating these findings in studies that examine specific roles and relate role changes to predictors relevant to those roles.
Third, our analysis included only baseline predictors, offering an overview of relevant factors rather than tracking changes over time. While we accounted for differences in retirement and relationship status, future studies should examine how changes in covariates, such as social support, work status and health, affect the importance of the roles.
Fourth, the HEARTS sample focuses on the retirement transition, thereby including older adults in a relatively narrow age range (spanning 64 to 74 in our analytic sample). The narrow range, combined with annual follow-ups, increases the chance of detecting within-person changes (Lindwall et al. Reference Lindwall, Berg, Bjälkebring, Buratti, Hansson, Hassing, Henning, Kivi, König, Thorvaldsson and Johansson2017) and assessing role trajectories in a period that requires older adults to reconsider their social environment, often accompanied by role changes or redistributing importance to different roles (Mutran and Reitzes Reference Mutran and Reitzes1981; Heaven et al. Reference Heaven, Brown, White, Errington, Mathers and Moffatt2013; Vidovićová Reference Vidovićová2018a; Bordia et al. Reference Bordia, Read and Bordia2020). However, it also means that the sample only included older adults in or around the third age (i.e. the young-old), characterized by relatively good health, independence from work and freedom from responsibilities (Weiss and Bass Reference Weiss and Bass2002). In contrast, the fourth age (i.e. the old-old) is characterized by acceptance, losses, declining health and a limited time horizon (Baltes and Smith Reference Baltes and Smith2003), which likely results in other roles being rated as important. Therefore, future studies should include older age groups to see how our results apply to individuals in the fourth age.
Related to the previous point, it is important to consider the social context of our sample when interpreting the results. Sweden, as a Nordic welfare state, fosters high levels of social capital and social participation, reducing older adults’ dependence on social resources (Kumlin and Rothstein Reference Kumlin and Rothstein2005; Kangas and Kvist Reference Kangas, Kvist and Greve2018; Nyqvist et al. Reference Nyqvist, Nygård and Scharf2019, Reference Nyqvist, Näsman, Hemberg and Nygård2023). Partly because of these enabling factors, Sweden has among the highest proportions of older adults living alone in Europe (Reher and Requena Reference Reher and Requena2018; Shaw et al. Reference Shaw, Fors, Fritzell, Lennartsoon and Agahi2018). Furthermore, Swedish retirees are among the highest in Europe for continuing to work after retirement (Dingemans et al. Reference Dingemans, Henkens and Van Solinge2017; Swedish Pension Agency 2021). This is primarily the result of sustained good health, financial incentives and opportunities for social interaction at work (Nilsson Reference Nilsson2012; Anxo et al. Reference Anxo, Ericson and Miao2019). The same demographics (i.e. relatively good health, a majority living alone and many working retirees) are also present in our sample and may influence which social roles are deemed important.
Fifth, for partner status, status is directly related to role occupancy, which could introduce bias into associations between these predictors and overall role outcomes.Footnote 4 However, we observed that many single individuals still rated the partner role as important. Although not the focus of the present article, similar trends might be seen when anticipating role transitions, for example increased parent role importance when expecting to become a grandparent, or decreased work importance prior to retirement. This further underscores the distinct concepts of role occupancy and importance, and the need to examine the precise distinction between them, especially regarding their effects on wellbeing (Thoits Reference Thoits2012; Heaven et al. Reference Heaven, Brown, White, Errington, Mathers and Moffatt2013).
The relative importance of social roles is considered a relevant indicator of social wellbeing, distinct from social relationships or social support (Heaven et al. Reference Heaven, Brown, White, Errington, Mathers and Moffatt2013). The next step, therefore, would be to relate (changes in) the relative importance of roles to wellbeing, needs satisfaction and life satisfaction. Furthermore, more empirical evidence is needed on the distinct contribution of roles, relationships and support to wellbeing. This would deepen our understanding of social roles’ unique contribution to later-life psychosocial functioning.
Conclusion
This exploratory study examined the stability and change of various social roles and the individual differences therein, providing new longitudinal insights into shifts in role importance during a period marked by many changes in relationships and roles. The results showed that, over time, older adults had fewer (important) roles. The roles of friends and volunteering increased, while the importance of work and care-giving decreased. Individual differences in role trajectories exist in various demographic, social and personality variables. As such, this descriptive, longitudinal study provides a valuable starting point for further confirmatory and theoretical research into social role importance changes, thereby advancing our understanding of the unique contribution of social roles in later-life social functioning and psychosocial wellbeing.
Supplementary material
The supplementary material for this article can be found at https://doi.org/10.1017/S0144686X26100816.
Author contributions
Conceptualization: JJ, FC, GO, YB; methodology: JJ, FC, GO, YB, IH; formal analysis and investigation: JJ, FC, GO, YB; writing – original draft preparation: JJ; writing – review and editing: JJ, FC, GO, IH, YB; funding acquisition: IH; resources: FC, GO, IH, YB; supervision: YB.
Financial support
This publication is based on data from the HEalth, Aging, and Retirement Transitions in Sweden (HEARTS) research programme at the University of Gothenburg, supported by funding from FORTE (Swedish Research Council for Health, Working Life and Welfare); Dnr: 2013-2291 & 2020-00547. Open access funding provided by Tilburg University.
Competing interests
We have no conflicts of interest to disclose.
Ethical standards
Ethical approval of the HEARTS study was provided by the University of Gothenburg (Dnr: 970-14). All participants provided written informed consent prior to the data collection in accordance with the Declaration of Helsinki. The data can be made available upon request and in accordance with applicable laws. For further information about the accessibility of data, please contact hearts@psy.gu.se. The analysis code is available in an Open Science Framework repository (https://osf.io/gnj53). The analyses and research questions were pre-registered (https://osf.io/t3rh8).


 Open access

