


Introduction
Prehistoric and early historic human remains have been recovered from numerous northern European mires—defined here as peatlands where active peat formation has or continues to take place (cf. Joosten & Clarke Reference Joosten and Clarke2002: 24; Tanneberger et al. Reference Tanneberger2017). Most of these discoveries have come to light during peat extraction and drainage work (e.g. van der Sanden Reference van der Sanden, Menotti and O'Sullivan2012; Giles Reference Giles2020). Such finds are generally described under the overarching term ‘bog bodies’. On closer inspection, however, different categories can be distinguished based on levels of preservation (e.g. Nielsen et al. Reference Nielsen, Christensen and Frei2020: 2) (Figure 1). In this article, the term ‘bog mummy’ is used for human remains with preserved soft tissue and/or hair, while ‘bog skeleton’ refers to skeletal remains which can reasonably be assumed to have been deposited as a complete body. Disarticulated or partial remains of both bog mummies and bog skeletons also occur; depending on context, these may reflect either intentional past practices or post-depositional disturbance.
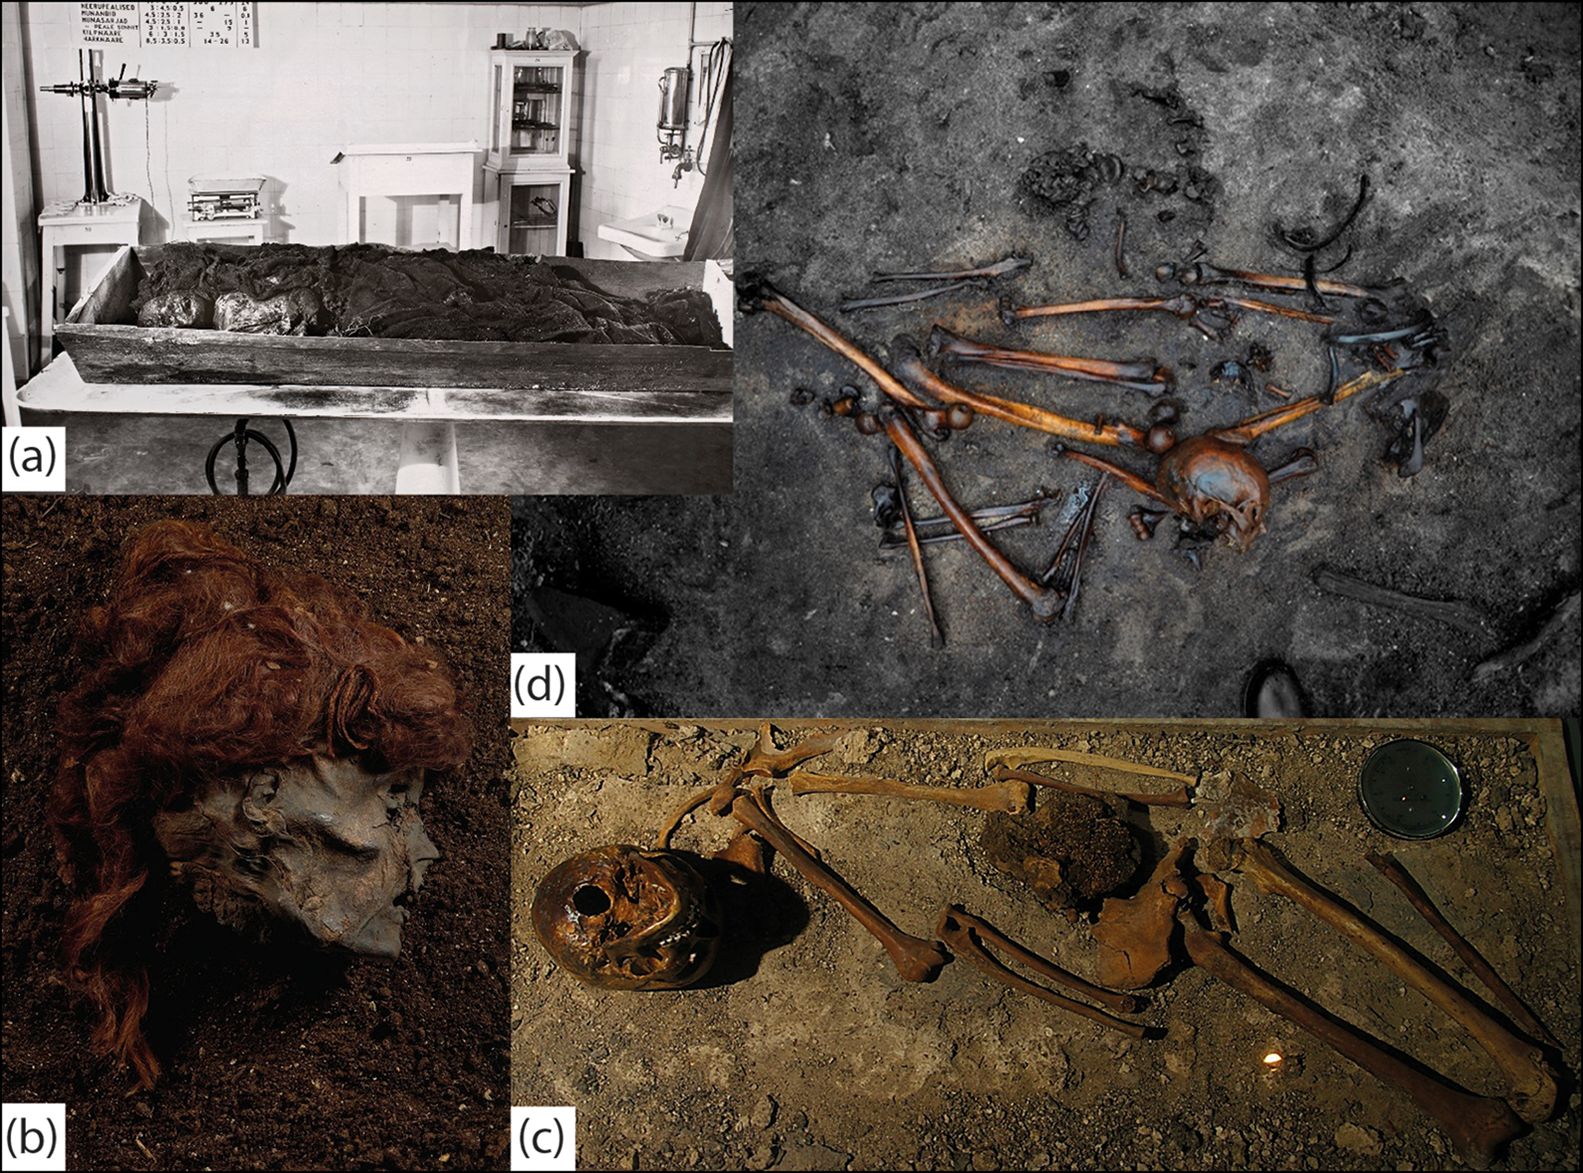
a) Example of a bog mummy (Rabivere, Estonia); b) the severed head of a bog mummy (Stidsholt, Denmark); c) bog skeleton (Luttra, Sweden); and d) disarticulated skeletal remains (Alken Enge, Denmark) (copyright: Estonian National Museum (a); Nationalmuseet Copenhagen (b); Jan Kask (c); Peter Jensen (d)).
Current knowledge of the character and development of ‘the bog body phenomenon’ is biased in various ways. First, the dichotomy between bog mummies and bog skeletons can be misleading, as it at least partially represents preservation conditions rather than past human behaviour (Bennike Reference Bennike, Lynnerup, Andreasse and Berglund2003). Although the scientific potential of skeletal material from mires is gradually being realised (e.g. Bennike Reference Bennike, Coles, Coles and Jorgensen1999, Reference Bennike, Lynnerup, Andreasse and Berglund2003; Fredengren Reference Fredengren2018; Nielsen et al. Reference Nielsen, Christensen and Frei2020), research into bog mummies dominates debate. More often than not, generalising conclusions are drawn from a small group of well-preserved bog mummies, the representativity of which has been insufficiently questioned. Second, most overviews focus on specific time frames (often the Iron Age/Roman period; note that here we use Western European chronologies) and on limited geographical areas. Some parts of Europe (e.g. Norway, Finland, Poland, the Baltic States) and chronological phases (especially the medieval and post-medieval periods) are rarely included in general studies of the phenomenon (for exceptions, see Cowie et al. Reference Cowie, Pickin and Wallace2011; Kama Reference Kama2017). These biases hamper an empirical assessment of trends in both time and space.
To address these issues, this present article offers the first large-scale overview of well-dated human remains from northern European mires, including Ireland, the UK, Norway, Sweden, Finland, Denmark, the Netherlands, Germany, Poland and the Baltic States (Figure 2). Our principal goal is to identify broad spatio-temporal trends in the frequency and general character of finds, with the aim of addressing the following research questions: 1) are there chronological peaks in the deposition of human remains in northern European mires? And 2) what are the main characteristics that distinguish each phase, especially in relation to spatial patterns, preservation, age at death, biological sex and assumed causes of death?
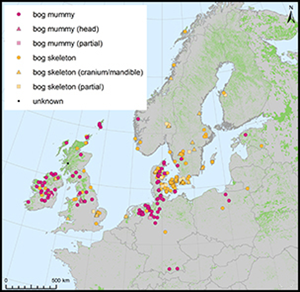
Distribution of different site types (a) and preservation (b) of human remains in European mires (maps by the authors; peatland distribution based on Tanneberger et al. Reference Tanneberger2017).

The database we have collated consists of 266 sites and more than 1000 individuals (see online supplementary materials (OSM) 1–2). Using statistical modelling, we identify six major chronological phases, the characteristics of which are discussed in detail below. The results of this study contribute to ongoing debates concerning the potentially dynamic and diverse underlying processes and motives relating to ‘the bog body phenomenon’. More generally, they provide new insights into how northern European prehistoric and early historic societies perceived mires and other wetlands, and the roles that these places played in practices relating to death and burial.
Research background
The number of known bog bodies in Europe, including bog mummies and bog skeletons, is estimated to be approximately 2000 (e.g. Gill-Robinson Reference Gill-Robinson and Mathieu2002: 111; Nielsen et al. Reference Nielsen, Christensen and Frei2020: 2). This number is conservative. Recent regional surveys—of, for example, Scotland (Cowie et al. Reference Cowie, Pickin and Wallace2011) and parts of Scandinavia (e.g. Ravn Reference Ravn2010; Sjögren et al. Reference Sjögren2017; Fredengren Reference Fredengren2018)—have consistently yielded many more sites than previously recognised, and bog skeletons and disarticulated skeletal material markedly outnumber surviving bog mummies (van der Sanden Reference van der Sanden, Menotti and O'Sullivan2012: 404). In addition, many finds have been lost in the distant past or are only known through published sources. The latter category, sometimes known as ‘paper’ bog bodies, are documented with varying levels of detail and reliability (van der Sanden Reference van der Sanden, Menotti and O'Sullivan2012: 403). The available dating evidence for all types of finds has, however, greatly increased over the last two decades.
The state of preservation of human remains from European mires varies greatly (Brothwell Reference Brothwell and Spindler1996: 161–64; Figure 1). Most bog mummies are found in raised bogs, where the antibiotic properties of sphagnan, an organic component derived from Sphagnum moss, are essential in the bodies’ preservation (Painter Reference Painter, Turner and Scaife1995). The survival of human tissue also depends on how quickly a body is immersed in water, the temperature and time of year, and the presence of insects and internal micro-organisms. Depending on local circumstances, the bones of bog mummies may or may not be preserved. In general, calcified and keratinous structures, such as bones, teeth, skin, hair and nails, are the most resistant to decay. In more alkaline wetlands such as calcareous fens, however, only bone will be preserved (van der Sanden Reference van der Sanden1996: 18; Giles Reference Giles2009: 77–78). Similarly, garments made of wool, skin and leather may be well-preserved in raised bogs, whereas clothing made of plant fibres, such as linen, decays (van der Sanden Reference van der Sanden1996: 18). Preservation conditions may even vary significantly within a single mire, and conditions within mires may change over time (Gill-Robinson Reference Gill-Robinson and Mathieu2002: 118). This variability in environment and preservation levels highlights that bold distinctions between bog mummies and bog skeletons are unjustified, and that any distribution map of finds is inevitably uneven.
The deposition of human remains in mires extends from the Mesolithic to recent times (van der Sanden Reference van der Sanden, Menotti and O'Sullivan2012: 404). To our knowledge, detailed overviews of long-term trends in the numbers and spatial patterning of finds are unavailable (for some basic trends, see van der Sanden Reference van der Sanden1996). Nonetheless, some chronological peaks and spatial clustering have previously been identified. The earliest dated peak concerns a cluster of skeletal remains from southern Sweden and Denmark, which dates to the fourth millennium BC (Sjögren et al. Reference Sjögren2017; Nielsen & Sørensen Reference Nielsen and Sørensen2018). There is also a concentration of skeletons dating to the later third/early second millennium BC in the English fenlands (Healey & Housley Reference Healey and Housley1992; Roberts Reference Roberts1998). The Iron Age and Roman period, however, are generally perceived as the peak of the ‘bog body phenomenon’, with finds distributed throughout North-west Europe. Medieval and later finds cluster predominantly in Scotland and Ireland (van der Sanden Reference van der Sanden, Menotti and O'Sullivan2012: 404).
There has been much discussion of why human remains were deposited in mires. Hypotheses can be divided into five categories (cf. Munksgaard Reference Munksgaard1984; Giles Reference Giles2009; van der Sanden Reference van der Sanden, Menotti and O'Sullivan2012), with such finds suggested to represent: 1) the remains of ritualistic sacrifice to supernatural powers, for example for fertility or agricultural success; 2) burials of deceased (and sometimes executed) individuals who had transgressed social conventions and were not allowed burial in a ‘normal’ cemetery; 3) victims of criminal acts; 4) ‘deviant’ burial customs; or 5) accidental deaths in treacherous circumstances (e.g. drowning). As these explanations may partly overlap, a contextual approach is key to interpreting individual finds (cf. Roberts Reference Roberts1998; Giles Reference Giles2009). High-resolution synthetic studies of spatial and temporal trends concerning assumed causes of death are currently lacking. Similarly, assessments of variation in the number of individuals found at each site and the frequency of site use (e.g. single or recurrent events) have not been considered to date.
Methods and materials
Database construction
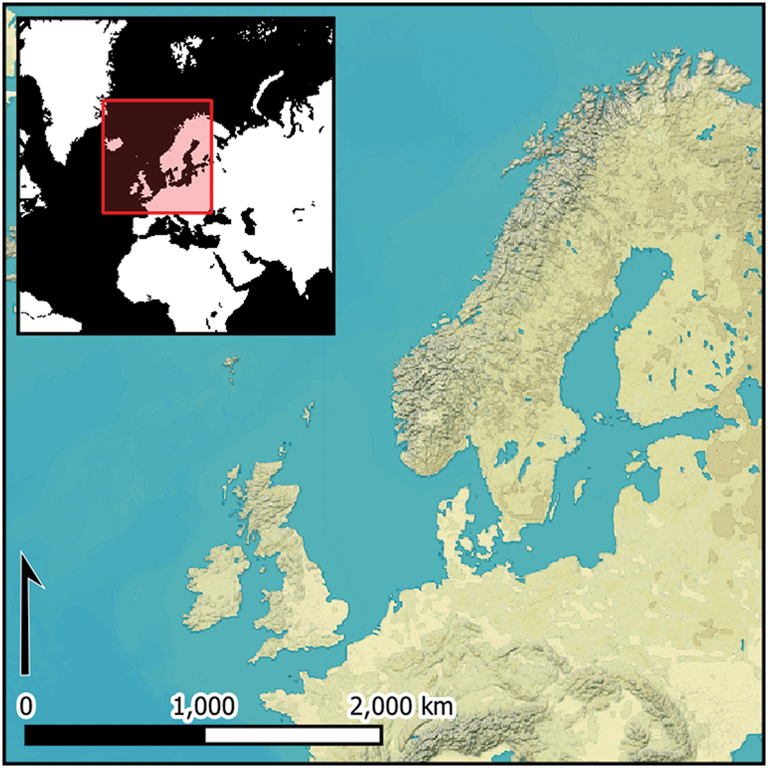
We have constructed a detailed database (OSM 1–2), including all finds of reliably dated human remains from mires across Northern Europe. Sites were inventoried using a wide range of overview studies and site-based publications. Additionally, various regional experts were consulted (listed in the Acknowledgements). To our knowledge, there are no relevant finds from Belgium and France. South-central Europe and the Mediterranean, which have far fewer mires (Tanneberger et al. Reference Tanneberger2017), are excluded.
‘Mire’ is an overarching term and finds from all types of peatlands are included (e.g. fens, coastal bogs, blanket bogs and raised bogs). As we are specifically concerned with finds from peat layers formed in the context of standing water, finds from river contexts (that is, running water) have been excluded as representing a different environmental setting. In a few situations, finds contexts may have differed from the original landscape setting at the time of ‘deposition’ as, for example, in the case of Swedish ponds or lakes that subsequently developed into mires (e.g. Sjögren et al. Reference Sjögren2017). High-resolution environmental reconstruction of individual sites was not feasible within the scope of this study, but relevant information regarding landscape changes is recorded in the database.
The resulting database comprises 266 sites, divided into single-phased sites with one individual (A1), single-phased sites with multiple individuals (A2), and sites reflecting recurrent depositional events (Figure 3; OSM 1–2). For methodological purposes, the latter category is divided into sites that provide high-resolution dating evidence for individuals (B1), and sites for which only a general date range is available (B2). Individuals found at different locations within the same mire (more than 250m apart) are recorded in the database as separate sites. Various properties for each site and individual are recorded, including: site characteristics; the age and biological sex of individuals; ante-, peri- and post-mortem traumas; assumed cause of death; and dating evidence. It is not possible to determine the exact number of individuals present across all 266 sites, as only estimates are available for some sites (especially those in the B category). Nonetheless, the total number of individuals certainly exceeds 1000.
Site types incorporated in this study and their dating evidence (figure by the authors).

Dating evidence and analysis
Uncalibrated radiocarbon dates are available for most of the sites recorded in the database, including high-resolution dates for 317 individuals (in a few cases, only calibrated dates are available). As δ13C, δ15N and C:N values (which contain potentially important information on collagen quality and possible reservoir effects) are only published for a limited number of finds, these are excluded from the database and omitted from our modelling. Radiocarbon dates that were deemed unreliable in the literature are also excluded from analyses. Finally, sites with reliable dating evidence other than radiocarbon (e.g. associated archaeological finds, historical records) are also included in the database and modelling. All dates are analysed in OxCal (v4.4; Bronk Ramsey Reference Bronk Ramsey1995, Reference Bronk Ramsey2009) and radiocarbon dates calibrated using IntCal20 (Reimer et al. Reference Reimer2020). Where multiple radiocarbon dates are available for the same individual, we use R_Combine or Combine.
To address the first research question—the identification of chronological peaks—we refrain from assuming a priori groupings or phases. Although summed calibrated date probability distributions (SCDPD) are widely used to analyse demographic trends (Shennan et al. Reference Shennan2013; Holton Price et al. Reference Holten Price2021), here we use kernel density estimates (KDE), as this method retains the underlying signal while removing high frequency noise (Bronk Ramsey Reference Bronk Ramsey2017). Therefore, we use the KDE_Model() function to determine the temporal density of ages. Our three KDE_Models were constructed for sites in the categories A1 and A2 and for reliably dated individuals from categories A1, A2 and B1. Note that the first two models are based on sites, whereas the third is based on all well-dated individuals, and therefore includes instances where multiple individuals derive from the same site. The distributions of the periods of use for sites in the B category are either based on a known date range (mostly using non-radiocarbon dates) that applied to all bodies or on a KDE_Plot within a Phase model (assuming a uniform distribution) that contained either radiocarbon-dated individuals or multiple radiocarbon dates that were not clearly ascribed to individuals.
Based on the KDE_Models, six main phases can be defined. The boundaries chosen are based on the combined interpretation of the three KDE_Models (that is, the underlying distributions) and are clarified with the aid of a multiphase plot (Figure S1 in OSM3). To address the second research question—what were the main characteristics that distinguish each phase—the well-dated A1, A2 and B1 individuals are assigned to phases based on their calibrated age range (at 95.4% reliability; where ambiguous, the individual's calibrated median age is used). For each phase, we present pie charts and bar plots for multiple properties and, for phases including more than 20 individuals, (kernel density) heat maps created in ArcMap (v10.6; Esri).
General distribution patterns
The majority of sites (n = 210) reflect single events. In most cases, single individuals are involved (A1; n = 196); sites with multiple individuals are rare (A2; n = 14). Sites in the latter category feature generally two to four individuals. The only exception is the remarkable site of Alken Enge, Denmark, which includes more than 380 individuals killed in violent conflict and deposited in open water (Løvschal et al. Reference Løvschal, Birch Iversen and Kähler Holst2019). Repeatedly used sites are more common (B; n = 56). Their character is variable, with the numbers of individuals present ranging from two to approximately 100.
The highest find densities occur in Ireland, the UK, northern Germany, Denmark, southern Norway and southern Sweden (Figure 2). Fewer finds are known from Poland, Finland and the Baltic States. Whereas sites reflecting single events appear throughout the study area, those that were repeatedly used are mainly found in Denmark, southern Norway and Sweden, and parts of the UK. Remarkably, repeatedly used sites are completely absent in Ireland. Bog skeletons and disarticulated skeletal material dominate in eastern Denmark and southern Sweden, whereas bog mummies are far more common in other regions, such as the northern Netherlands, Germany and Ireland.
General dating patterns
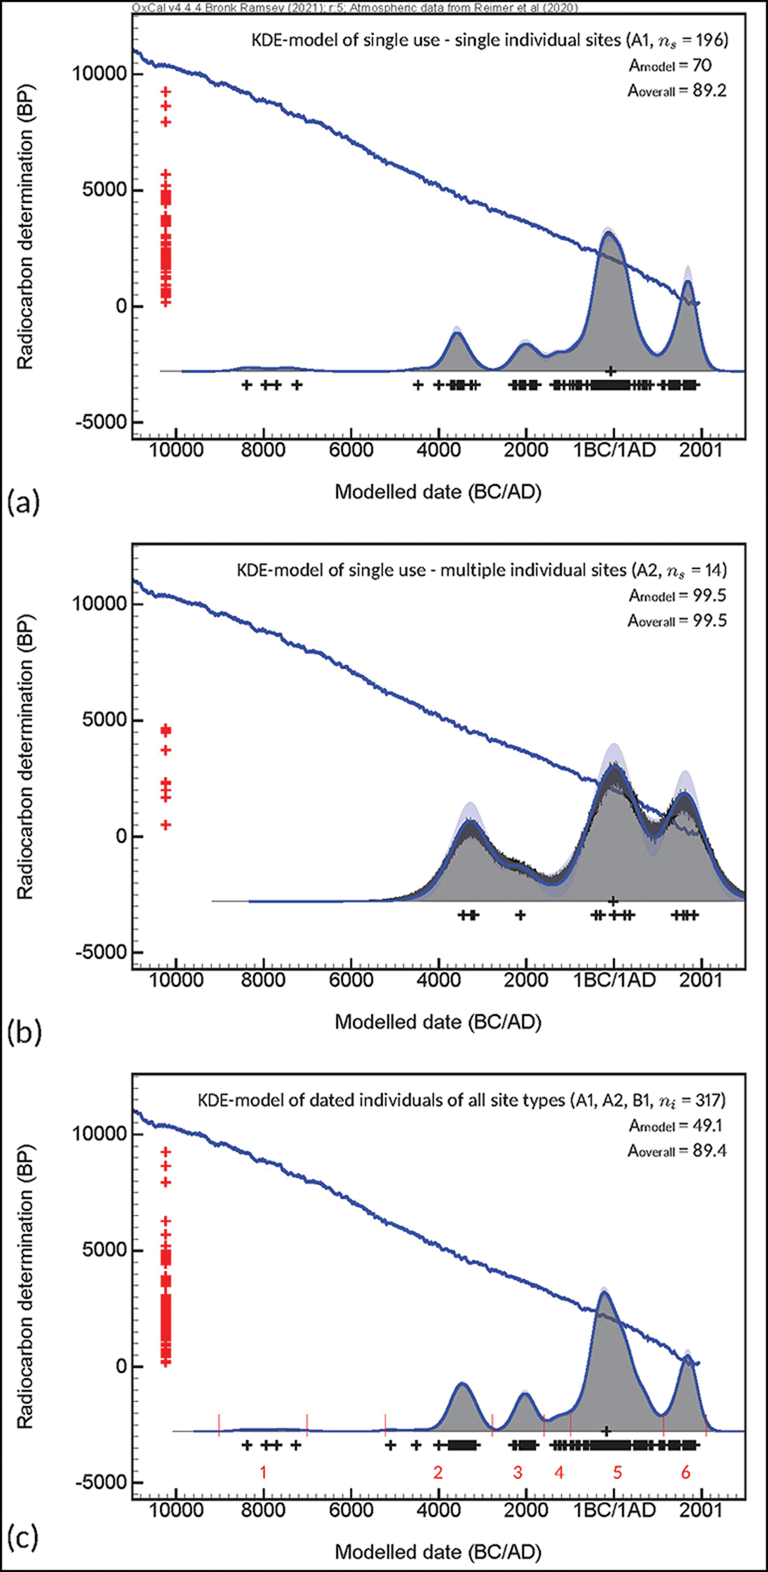
The KDE_Models demonstrate clear temporal trends. The models based on single-event sites with single individuals (Figure 4a) and all dated individuals (Figure 4c) are comparable. The model for single-event sites with multiple individuals (Figure 4b) includes no Mesolithic dates but is comparable with the other two models. All three models allow for a chronological division into six main phases (Table 1), which are separated by periods with fewer finds.
KDE_Models of all single use sites with single and multiple individuals (a and b), and all individuals with reliable dates regardless of site type (c). The six phases distinguished here are indicated in (c) (dates modelled in OxCal v4.4.4 (Bronk Ramsey Reference Bronk Ramsey2021) and calibrated using IntCal20 (Reimer et al. Reference Reimer2020)) (figure by the authors).
Occurrence frequency of site types and key characteristics of all reliably dated individuals (regardless of site type). Numbers in parentheses refer to unknowns.

* Sites may be part of more than 1 phase.
The ‘boundaries’ between these phases are indicated in Figure 4c and the multiphase plot in Figure S1 (in OSM3). Phase 1 consists of only five sites, with dates clustering between the ninth and seventh millennium BC. A temporal gap of almost two millennia separates these finds from the oldest examples in Phase 2. Phases 2 and 3 demonstrate clear peaks in activity, whereas Phase 4 is less prominent. The high peak of Phase 5 stands out, followed by the prominent but slightly lower peak of Phase 6. The average number of deposited individuals per century (Table 1) is very low in Phase 1, significantly higher and quite stable during Phases 2–4 and demonstrates a steep (roughly fourfold) increase in Phases 5–6. Another notable trend is that repeatedly used sites are particularly well-represented in Phases 2 and 5, whereas they are relatively rare in Phase 6 (Table 1).
Observed changes in key characteristics
The key characteristics for each phase are summarised in Figures 5–10 and Table 1.
Site distribution and key characteristics of individuals from Phase 1: a) site distribution pattern; b) preservation trends; c) assumed cause of death; d) evidence for violence-related peri-mortem trauma; e) age distribution; f) biological sex (figure by the authors; age categories adopted from Frei et al. Reference Frei2019).

Site distribution and key characteristics of individuals from Phase 2. For a general key, see Figure 5 (figure by the authors; age categories adopted from Frei et al. Reference Frei2019; the heat map in (a) was created in ArcMap (v10.6; Esri)).

Site distribution and key characteristics of individuals from Phase 3. For a general key, see Figure 5 (figure by the authors; age categories adopted from Frei et al. Reference Frei2019; the heat map in (a) was created in ArcMap (v10.6; Esri)).

Site distribution and key characteristics of individuals from Phase 4. For a general key, see Figure 5 (figure by the authors; age categories adopted from Frei et al. Reference Frei2019).

Site distribution and key characteristics of individuals from Phase 5. For a general key, see Figure 5 (figure by the authors; age categories adopted from Frei et al. Reference Frei2019; the heat map in (a) was created in ArcMap (v10.6; Esri)).

Site distribution and key characteristics of individuals from Phase 6. For a general key, see Figure 5 (figure by the authors; age categories adopted from Frei et al. Reference Frei2019; the heat map in (a) was created in ArcMap (v10.6; Esri)).

Spatial trends
Phase 1 sites are all situated in Denmark, southern Sweden and Norway. In Phase 2, a clear cluster of sites emerges in Denmark and southern Sweden, and the first sites appear in Ireland and the UK. In Phase 3, a new cluster arises in south-east England. The relatively limited number of sites in Phase 4 demonstrates a dispersed pattern. In Phase 5, various clusters appear and northern Germany, Jutland and the Irish Midlands become prominent for the first time. The first sites in Poland, the Baltic States and the northern coastal areas of Norway also appear in this phase. Phase 6 demonstrates a remarkable shift from Denmark and southern Sweden towards Ireland and the central/northern parts of the UK.
Preservation trends
Phases 1 and 2 sites have exclusively yielded bog skeletons and partial/disarticulated skeletal material. The first bog mummies appear later, in Phases 3 and 4, with just five bog mummies from before 1000 BC, compared with almost 80 finds of bog skeletons/skeletal material. Phase 5 features a far larger number of bog mummies, although they still represent fewer than half of cases. In Phase 6, the balance completely shifts, with bog mummies predominating.
Cause of death
Cause of death is established for 57 individuals. In 45 cases, violence was involved, featuring in all phases except for Phase 1. The earliest indications for violent deaths cluster in Denmark. The highest numbers of violent deaths appear in Phases 2 and 6, followed by Phases 3 and 5. Evidence of violence appears to be less frequent in Phase 4. Some individuals, mainly in Phase 5, demonstrate evidence for excessive violence, with multiple potential causes of death. In rare cases, only occurring in Phase 5, disease is the probable cause of death. Phase 6 includes six suicide victims and four cases of accidental death (e.g. drowning).
Biological sex and age distribution
In Phases 1, 3, 5 and 6 males form the largest group, whereas Phases 2 and 4 show almost equal numbers of females and males. Adults are most common and, in most cases (Phases 2 and 4–6), the ‘young adult’ (18–25-year-old) group displays a slight dominance. In almost all phases, excepting Phase 4, children—of various ages—are also present.
Discussion
Our results illuminate a range of issues. Here, we focus our discussion on two key themes for future studies: 1) chronological and spatial trends and their representativity; and 2) cause of death and underlying motives.
Chronological and spatial trends and their representativity
Bog body research is biased due to: 1) depositional circumstances—that is, the distribution of mires and their preservation conditions; 2) post-depositional factors reflected in the history of finds; and 3) scientists’ choice of study region, chronological focus, and find category. Our approach shows that widening our focus to encompass a larger study region, longer timeframe, the incorporation of bog mummies as well as bog skeletons, and the inclusion of both radiocarbon and historical dating evidence, permits new trends to come to light. Only by broadening our perspective will we be able to link these trends to the underlying motives and societal transformations behind the deposition of bodies within mires, such as population density, migration and ideological change.
We do not discuss the histories of discoveries in different countries in detail here. An overview is, however, provided in Figure S2 (in OSM4). Differences in the character and timing of wetland reclamation have undoubtedly influenced the discoveries recorded in the database. Furthermore, some regions have received greater attention than others and display clear finds clusters, as demonstrated by our distribution maps. As only reliably dated sites have been incorporated into our study, seemingly ‘empty’ spaces are not necessarily devoid of finds.
Bog skeletons and partial/disarticulated skeletal remains are far more numerous than previously assumed (cf. Bennike Reference Bennike, Coles, Coles and Jorgensen1999, Reference Bennike, Lynnerup, Andreasse and Berglund2003). Without their inclusion in our study, Phases 1–4 would not have been recognised. The numbers of bog mummies strongly increase from 1000 BC onwards. At the same time, new clusters of finds appear (Phase 5), and eventually the spatial focus shifts towards Ireland and the northern/central UK (Phase 6). These simultaneous spatial shifts and changing preservation trends are probably related. It is clear that regions such as the Irish Midlands (dominated by raised bogs, with numerous bog mummies from Phases 5–6) and Zealand (rich in alkaline fens, with numerous bog skeletons from Phases 1–4; Bennike Reference Bennike, Lynnerup, Andreasse and Berglund2003) offer very different preservation conditions; whether these trends in our data are caused primarily by human behaviour or changing environmental conditions, however, requires further research. Similarly, further work is needed to assess the original landscape character of the sites of ‘deposition’, as opposed to the environmental settings from which the human remains were recovered, which, in some cases, may have been very different. Importantly, bog mummies and bog skeletons represent different types of archaeological evidence (Bennike Reference Bennike, Coles, Coles and Jorgensen1999, Reference Bennike, Lynnerup, Andreasse and Berglund2003), creating biases in regard to the ‘archaeological visibility’ of specific characteristics (e.g. cause of death; see below).
The Iron Age and Roman periods are generally considered to represent a peak in the deposition of human remains in mires (e.g. van der Sanden Reference van der Sanden1996). This persistent notion, however, requires nuancing. Even though this peak indeed is highest, it is significantly longer than previously thought, starting in the Late Bronze Age and continuing into the early Middle Ages, and appears to be part of a long-term trend that began far earlier. A large number of finds date to the Early/Middle Neolithic (Phase 2) onwards and the significance of this earlier peak—previously noted by Sjögren et al. (Reference Sjögren2017) and Nielsen and Sørensen (Reference Nielsen and Sørensen2018)—is confirmed here; a striking characteristic of Phase 2 is the large number of repeatedly used sites. Conversely, Phase 3 has not previously been recognised, apart from the Early Bronze Age cluster in the south-eastern English Fens (Healey & Housley Reference Healey and Housley1992; Roberts Reference Roberts1998). The same applies to the less marked Phase 4. The peak of Phase 6, which was detected through the inclusion of historical dating evidence, demonstrates that medieval and later finds are far more numerous than expected. Determining the extent to which fluctuations in the numbers of finds are related to changes in population density is challenging. This is due to the scarcity of studies with a large spatial and temporal scope (but see, for example, Müller & Diachenko Reference Müller and Diachenko2019), methodological issues and potentially significant spatial variability. Nonetheless, regional-scale analyses may yield important insights in this respect.
Cause of death and underlying motives
It has been repeatedly stated in the relevant literature that single hypotheses are insufficient to explain the presence of human remains in mires (e.g. Brothwell Reference Brothwell and Spindler1996; Giles Reference Giles2009). Considering the enormous time span, as well as the wide geographical distribution and variety of site types, we support that statement. A complicating factor is that the potential motives behind the deposition of bodies in mires do not necessarily leave distinct archaeological traces, often rendering our interpretations speculative. The significant number of suicide victims and accidental deaths recognised in Phase 6 thanks to details from historical sources that are unavailable for earlier periods, suggests that such deaths may also have been common in earlier periods. On the other hand, the possibility that the perception and practical uses of mires may have changed significantly over time needs to be considered. Notably, Phase 6 demonstrates both a marked intensification in the economic exploitation of mires throughout the study area and, at least in some regions, a simultaneous continuation of ‘pagan’ practices, including ‘ritual’ depositions of various types of objects through until early modern times (e.g. van der Sanden Reference van der Sanden, Coles, Coles and Jørgensen1999). This well illustrates that mires could have multiple meanings at any one time (see also Paulissen et al. Reference Paulissen2022).
Setting aside accidental deaths, the significant evidence for violent deaths and the large number of repeatedly used sites make it safe to assume that most finds of human remains in mires reflect intentional depositions. Violent deaths are probably underrepresented in our database due to preservation issues and a frequent lack of high-resolution palaeoanthropological investigation. In general, distinguishing between ‘ritualistic’ and other forms of violent acts, such as armed conflicts, raids or robberies, is often impossible based on archaeological evidence. The exceptions are ‘cult sites’, where ritual depositions of other materials took place alongside (often disarticulated) human remains (e.g. Behm-Blancke Reference Behm-Blancke2003). The same applies to individuals subject to excessive violence or so-called ‘overkill’ (mainly Phase 5), which are generally considered to be ritualistic offerings (e.g. van der Sanden Reference van der Sanden, Menotti and O'Sullivan2012; Giles Reference Giles2020: 166–216). More generally, ritual and violence can be variously entangled, as visible at sites such as Alken Enge (Løvschal et al. Reference Løvschal, Birch Iversen and Kähler Holst2019) and ‘war-booty’ sites (e.g. Monikander Reference Monikander2010). Consequently, making a hard distinction between sites demonstrating violent causes of death and ritual violence is unjustified.
Conclusions
Based on the collation of data for more than 1000 individuals, we have identified spatial and temporal patterns in the deposition of human remains in European mires. Following an extended period of sporadic examples, the phenomenon of intentional deposition of human remains first becomes consistently visible in the Early/Middle Neolithic, subsequently continuing over the next seven millennia. Distinct fluctuations in the intensity of deposition are apparent. Bog mummies, which have been central to scientific debates to date, form only one end of a spectrum of preservation. These bog mummies generally date to the more recent phases discussed here and are only found in parts of the study area. Our more inclusive approach, including bog skeletons, significantly increases the size of the database and allows for the recognition of specific and robust trends that have not previously been recognised.
Given the vast time span, wide geographical distribution and variety in site types involved, a nuanced and context-based approach is necessary to unravel the potential motives for the deposition of these remains. There is significant evidence for violent causes of deaths, especially in Phases 2, 5 and 6. In some cases, such finds display clear ‘ritual’ connotations; however, distinguishing between violence and ritual violence is not always possible, and is probably not useful. Furthermore, various finds from Phase 6 indicate that accidental deaths and potentially suicides may have been more common in earlier phases than previously believed.
On a more general note, this study demonstrates the added value of synthetic studies of large databases covering wide spatio-temporal scales. In our case, this scope of research, combined with the sharp increase in available dating information over the last two decades and new computing techniques for summarising large sets of radiocarbon dates, has allowed us to identify hitherto unrecognised patterns. The full database, freely available in the OSM, offers great potential for the recognition of other trends and for further study.
Acknowledgements
This study would not have been possible without the invaluable help of many European colleagues, who kindly shared (sometimes unpublished) data on many sites. We especially thank Conor McDermott and Isabella Mulhall (Ireland), Henry Chapman and Melanie Giles (UK), Merete Moe Henriksen, Marianne Moen and Grethe Bjørkan Bukkemoen (Norway), Christina Fredengren and Karl-Göran Sjögren (Sweden), Pauline Asingh and Nina Helt Nielsen (Denmark), Satu Koivisto (Finland), and Gediminas Petrauskas (Lithuania). Luc Steinbuch (Wageningen University, the Netherlands) assisted with data visualisation. Bart van de Korput and Charlotte Engelmann (Wageningen University) provided input for early database drafts.
Funding statement
This study was initiated by the first two authors as part of the Home Turf project, funded by the Netherlands Organisation for Scientific Research (grant 276-60-003). The third author is a member of the Towards a New European Prehistory project, funded by the Swedish Foundation for Humanities and Social Sciences (grant M16-0455:1).
Supplementary material
To view supplementary material for this article, please visit https://doi.org/10.15184/aqy.2022.163.


 Open access