

INTRODUCTION
This paper presents the results of petrographic and elemental analysis of pottery from the Minoan site of Palaikastro in east Crete. The multiple phases of continuous Bronze Age occupation allow for an examination of patterns in pottery consumption over a wide chronological range. These patterns are of interest because of the socio-economic context, with marked urban growth at the site such that the settlement grew to a size of some 15–20 ha during the Neopalatial period. In this study, 288 samples of pottery, representing all the main fabrics and ceramic categories defined through a macroscopic examination of pottery assemblages dating from Middle Minoan (MM) IIA through to Late Minoan (LM) IIIA2 (c. 1850 to 1300 BC),Footnote 1 recovered during excavations undertaken in the 1980s and 1990s, were analysed by thin section petrographic analysis, wavelength dispersive X-ray fluorescence spectroscopy (WD-XRF) and re-firing tests. An extensive geological prospection of the site and its hinterland was also conducted, and a number of geological samples were collected and analysed using the same techniques as those used for the pottery samples, in order to identify and characterise the range of potential pottery raw materials available within the landscape today.
Location
The Minoan town we call Palaikastro is situated at Roussolakkos, c. 2 km east of the modern village after which it is named, at the far eastern end of Crete in the province of Lasithi (Fig. 1). The settlement sits c. 200 m from the present-day shoreline of Grandes Bay, at the south-eastern end of a gently undulating coastal plain. Just to the north of Roussolakkos, the flat-topped hill of Kastri, rising to a height of 84 m, forms a small promontory and local landmark between the sandy beaches of Chiona and Kouremenos. The coastal plain continues to the north-west for some 2 km before rising to a plateau where the Toplou monastery is situated. To the south and west of the site the landward view is dominated by a nearby range of hills running east–west. Near the summit of these hills, and 1.5 km south-south-east of the ancient settlement, lies the Minoan peak sanctuary of Petsophas (Bosanquet et al. Reference Bosanquet, Dawkins, Tod, Duckworth and Myres1902; Rutkowski Reference Rutkowski1991).
Map showing position of Minoan town at Roussolakkos and other locations mentioned in the text.

A short distance to the south of the modern village of Palaikastro, the line of hills is broken by a steep-sided valley running north–south, offering the most accessible natural inland route to the Minoan palace at Kato Zakros some 13 km distant. Approximately 3 km inside the entrance to the valley (when approached from Palaikastro), the seasonal Kalogero River begins, which soon after emerging north of the hills curves east and then south-east around the village before continuing north-east towards Grandes Bay.
Today the coastal plain forms a productive agricultural area, dominated by extensive recent olive groves and small fields, while the low phrygana on the steeply rising hillsides provides grazing for sheep and goats. Within a number of gullies to the south of the site the retaining walls of abandoned terraces can be seen in places, suggesting a more extensive agricultural utilisation of the area in the past.
Archaeological background
The site has been the subject of numerous archaeological investigations, under the auspices of the British School at Athens, commencing over a century ago with the excavations of Bosanquet and Dawkins between 1902 and 1906 (Bosanquet Reference Bosanquet1902; Bosanquet et al. Reference Bosanquet, Dawkins, Tod, Duckworth and Myres1902; Dawkins and Currelly Reference Dawkins and Currelly1904; Dawkins, Hawes and Bosanquet Reference Dawkins, Hawes and Bosanquet1905; Bosanquet and Dawkins Reference Bosanquet and Dawkins1923), followed by Sackett and Popham in 1962 and 1963 (Sackett et al. Reference Sackett, Popham, Warren and Engstrand1965; Sackett and Popham Reference Sackett and Popham1970), and Sackett and MacGillivray in the 1980s and 1990s (MacGillivray et al. Reference MacGillivray, Sackett, Driessen and Smyth1987; Reference MacGillivray, Sackett, Driessen, Macdonald and Smyth1988; Reference MacGillivray, Sarpaki, Olivier, Weingarten, Sackett, Driessen, Bridges and Smyth1989; Reference MacGillivray, Sackett, Driessen, Farnoux and Smyth1991; Reference MacGillivray, Sackett, Driessen and Hemingway1992; Reference MacGillivray, Sackett, Driessen, Hatzake and Schoep1998). A geophysical study was undertaken by Boyd and Whitbread in 2001 (Boyd, Whitbread and MacGillivray Reference Boyd, Whitbread and MacGillivray2006). The most recent programme of study of the site and its surrounding environs, Palace and Landscape at Palaikastro (PALAP), was initiated in 2012 (Knappett, Livarda and Momigliano Reference Knappett, Livarda and Momiglianoin press).
From the Final Neolithic, i.e. the end of the fourth millennium BC, there is evidence for settlement of the wider area (see Nowicki Reference Nowicki2014), although the first occupation at Roussolakkos appears to come in the Early Minoan (EM) IIA period (c. 2650 BC). While the EM IIA evidence is very patchy, there is rather more for EM IIB, when the site must have been relatively large already, with a monumental structure beneath Block Chi (Driessen Reference Driessen, Bretschneider, Driessen and Van Lerberghe2007). The settlement appears to be occupied continuously through the late Prepalatial period (EM III and MM IA) and into the early Protopalatial (MM IB and IIA), although there is little architecture to go on. Although it has been suggested that by now the site has an urban character (MacGillivray and Sackett Reference MacGillivray, Sackett and Cline2012, 574), it is not until MM IIB that we really see signs of urban organisation (Knappett and Cunningham Reference Knappett and Cunningham2012, 317). The town saw substantial growth in the early Neopalatial period, during MM IIIA and IIIB (Knappett and Cunningham Reference Knappett and Cunningham2003; Reference Knappett and Cunningham2012), and into the LM I period; after the LM IB destructions that affect the site there is a significant ‘Reoccupation’ during LM II–IIIA2, with the site finally abandoned during LM IIIB (MacGillivray and Sackett Reference MacGillivray and Sackett2019), although some occupation continued nearby at Kastri during LM IIIC until that too was abandoned (c. 1100 BC) (MacGillivray and Sackett Reference MacGillivray, Sackett and Cline2012).
The abundant archaeological record of this site, spanning much of the Bronze Age, provides a rich vantage point from which local and regional long-term trends can be evaluated. The town’s size and coastal location suggest that it may have been an important economic centre, both through its ability to provide agricultural and manufactured goods for export, but also through its own local consumption. Furthermore, its position approximately midway between the palaces of Zakros and Petras may also have made the site a convenient stopping point for both overland and sea routes, as well as a regional node in the political administration of the island. However, in contrast to the latter sites, Palaikastro itself is distinguished as being one of the largest urban Minoan settlements on the island for which there is no evidence, at present, of a palace. The apparent lack of a palace in a site of this size, together with its extreme geographic location away from the centre of Knossian influence, raises a number of interesting questions concerning not only its role in local trade and administration, but also in island-wide economics and geopolitics. Certainly, the periods examined in the present study, stretching from MM IIA to LM IIIA2, witness many significant changes across the island. During the Protopalatial period (c. 1950–1700 BC) there is pronounced regional variation between east Crete and central Crete in various classes of material culture, such as scripts (Linear A v. Cretan Hieroglyphic), seal types, burial customs and pottery (Knappett Reference Knappett1999; Poursat Reference Poursat and Krzyszkowska2010; Cadogan Reference Cadogan2013). With the advent of the Neopalatial period (c. 1700–1450 BC), a different picture presents itself. Now it appears that there is more commonality across the island; in the pottery, one of the strongest expressions of this phenomenon is the ubiquitous appearance of the conical cup (Wiener Reference Wiener, Hägg and Marinatos1984). Moreover, certain dark-on-light decorated styles, such as tortoiseshell ripple, become widespread. Many scholars consider these and other patterns in the material culture to be a sign of Knossian influence; Knossos does appear to undergo a dramatic expansion in the Neopalatial period, seemingly at the expense of Phaistos and Malia (see papers in Macdonald and Knappett Reference Macdonald and Knappett2013). At Palaikastro, we can see these general trends played out: regionalism in the Protopalatial period, with the MM IIA and IIB pottery of easily identifiable east Cretan character, and stronger Knossian connections in the Neopalatial period, especially during MM III and LM IA. One of the aims of our study is to see if these changes are reflected in any way within the pottery found at Palaikastro.
After the island-wide destructions of LM IB, occupation continues in the Final Palatial and Postpalatial periods; Palaikastro provides a fascinating case of continuity while many sites on the island, especially in the centre and the west, come under mainland (‘Mycenaean’) influence. Although there is much debate currently about the exact nature of this mainland involvement (Preston Reference Preston1999; Driessen and Langohr Reference Driessen, Langohr, Galaty and Parkinson2007; Nafplioti Reference Nafplioti2008; D’Agata et al. Reference D’Agata, Girella, Papadopoulou and Aquini2022), it is clear that Palaikastro remains outside the ambit of the new Linear B administration at Knossos (Bennet Reference Bennet1990). What this relative ‘independence’ (see Langohr Reference Langohr2009) means for pottery production and distribution at Palaikastro is another interesting question.
What was pottery production and use like during the Protopalatial, Neopalatial and Postpalatial periods? And how might we understand the changes, if any, from one period to the next? Is it reasonable to assume that we might see some changes in production choices as direct or indirect responses to these shifts in island geopolitics? One factor to consider is the apparent urban expansion of Palaikastro in the early Neopalatial period – a possible effect of Knossian influence as well as a plausible cause of changes in production organisation.
Scientific background
While the causes of historical changes ultimately lie within wider social, economic or environmental realms, they are often visibly manifested in changing patterns of material culture production, distribution and consumption. The close examination of pottery may provide a rich vein of information, wherein changes over time in sources of raw materials used, technology, typology and style may provide some indications of how producers and consumers, and the local economy in general, responded to rapidly occurring events, such as warfare, natural disasters or changes in administration, or more drawn-out social, economic or environmental changes.
Material science analyses of ancient pottery are now well-established means for investigating questions of provenance and production strategies (e.g. Whitbread Reference Whitbread1995; Reference Whitbread, Brothwell and Pollard2001; Reedy Reference Reedy2008; Gauss and Kiriatzi Reference Gauss and Kiriatzi2011; Quinn Reference Quinn2013; Hunt Reference Hunt2017), as well as wider economic and social issues (e.g. Peacock Reference Peacock1977; Day, Relaki and Faber Reference Day, Relaki, Faber, Wiener, Warner, Polonsky and Hayes2006; Kiriatzi and Andreou Reference Kiriatzi, Andreou, Kiriatzi and Knappett2016).Within the study of Minoan pottery, in addition to typological studies, extensive scientific studies have been undertaken utilising a range of analytical techniques, but with a particular emphasis on petrographic analysis and/or bulk chemical analysis (e.g. Wilson and Day Reference Wilson and Day1994; Day Reference Day, Tsipopoulou and Vagnetti1995; Whitelaw et al. Reference Whitelaw, Day, Kiriatzi, Kilikoglou, Wilson, Laffineur and Betancourt1997; Day et al. Reference Day, Kiriatzi, Tsolakidou and Kilikoglou1999; Reference Day, Joyner, Kilikoglou and Gesell2006a; Reference Day, Quinn, Rutter and Kilikoglou2011; Reference Day, Hein, Joyner, Kilikoglou, Kiriatzi, Tsolakidou, Wilson, Davaras and Betancourt2012; Faber et al. Reference Faber, Kilikoglou, Day, Wilson, Kilikoglou, Hein and Maniatis2002; Day, Joyner and Relaki Reference Day, Joyner, Relaki, Barnard and Brogan2003; Poursat and Knappett Reference Poursat and Knappett2005; Broodbank and Kiriatzi Reference Broodbank and Kiriatzi2007; Nodarou Reference Nodarou and Waksman2007; Reference Nodarou2010; Reference Nodarou2011; Reference Nodarou and Tsipopoulou2017; D’Agata and Boileau Reference D’Agata and Boileau2009; Faber, Day and Kilikoglou Reference Faber, Day, Kilikoglou and Quinn2009; Boileau and Whitley Reference Boileau and Whitley2010; Ben-Shlomo, Nodarou and Rutter Reference Ben-Shlomo, Nodarou and Rutter2011; Mentesana et al. Reference Mentesana, Day, Kilikoglou and Todaro2016; Liard Reference Liard2019). In some rare instances analyses have been augmented with data from pottery kilns, thereby providing firm geographical evidence for the provenance of certain fabric types (Buxeda I Garrigos, Kilikoglou and Day Reference Buxeda I Garrigos, Kilikoglou and Day2001; Shaw et al. Reference Shaw, Van de Moortel, Day and Kilikoglou2001; Belfiore et al. Reference Belfiore, Day, Hein, Kilikoglou, Rosa, Mazzoleni and Pezzino2007). As a result of these numerous, often combined, analytical and stylistic studies, the characteristics of pottery from many parts of the island, and from many periods, are now known with some confidence, although limited geochemical variability, repeated occurrences of similar geological environments across the island, pottery production strategies, scarcity of kiln sites, large scale movement of vessels, and post-depositional alteration may all significantly complicate or hinder determinations of the exact geographical locations at which pottery was actually produced (Jones Reference Jones1986; Whitelaw et al. Reference Whitelaw, Day, Kiriatzi, Kilikoglou, Wilson, Laffineur and Betancourt1997; Day, Wilson and Kiriatzi Reference Day, Wilson, Kiriatzi, Laffineur and Betancourt1997; Day and Wilson Reference Day and Wilson1998; Day et al. Reference Day, Kiriatzi, Tsolakidou and Kilikoglou1999; Buxeda I Garrigos, Kilikoglou and Day Reference Buxeda I Garrigos, Kilikoglou and Day2001; Hein et al. Reference Hein, Day, Quinn and Kilikoglou2004; Belfiore et al. Reference Belfiore, Day, Hein, Kilikoglou, Rosa, Mazzoleni and Pezzino2007).
Evidence from Palaikastro
With regard to pottery excavated at Palaikastro, a number of archaeological science studies have previously been undertaken, but these have tended to be constrained to a narrow range of material types, chronological periods, or analytical approaches, and often utilised comparatively small numbers of samples.
The earliest compositional studies, commencing in the 1960s, were undertaken by Catling and colleagues (Catling and Millett Reference Catling and Millett1965; Catling, Richards and Blin-Stoyle Reference Catling, Richards and Blin-Stoyle1963; Catling et al. Reference Catling, Cherry, Jones and Killen1980) using optical emission spectroscopy as part of a wider attempt to determine the provenance of Bronze Age Aegean pottery through the identification of distinctive geochemical compositional groups. In total, 75 samples excavated at Palaikastro, dating from MM III to LM III, were analysed, and although they could be distinguished from pottery attributed to central Crete, they could not be differentiated by this approach from material attributed to west Crete or other east Cretan sites (Jones Reference Jones1986, 250–3). More recent studies have investigated the complexity of identifying the provenance of pottery through bulk elemental analytical techniques both in general and also within Crete, highlighting the influence of geochemical variability, post-depositional alteration, and human agency, but nonetheless noting their utility within more diverse analytical approaches that not only embrace the study of provenance but also pottery production technology and pottery use (e.g. Day et al. Reference Day, Kiriatzi, Tsolakidou and Kilikoglou1999; Hein et al. Reference Hein, Day, Quinn and Kilikoglou2004; Schwedt, Mommsen and Zacharias Reference Schwedt, Mommsen and Zacharias2004; Tite Reference Tite2008; Hein and Kilikoglou Reference Hein and Kilikoglou2017).
Further analysis of pottery recovered from Palaikastro was undertaken by Day as part of a wider doctoral study of pottery production and exchange in Neopalatial east Crete (Day Reference Day1991; Reference Day, Tsipopoulou and Vagnetti1995). In this work, 37 ancient pottery samples recovered from excavations at Palaikastro were sampled, dating from MM III to LM IB, and consisting of a wide range of vessel forms including cups, bowls, jugs, jars, amphorae and pithoi, although Day noted that few cooking vessels were selected (Day Reference Day1991, 142, appendix 3). The samples were analysed by ceramic petrography, together with 10 geological samples of local materials (Day Reference Day1991). Three fabric groups were described, collectively accounting for approximately half of the Palaikastro archaeological pottery samples: ‘Fabric 1’, a fine red fabric consisting of clays from the Kastri Formation, perhaps mixed with aplastic inclusions derived from the Phyllite–Quartzite series, found mainly with smaller vessels such as cups and jars; ‘Fabric 2’, closely related to Fabric 1, but additionally containing larger inclusions from the Phyllite–Quartzite series, found with amphorae and cooking vessels; ‘Fabric 3’, a fine, high-fired fabric with a mottled appearance, seemingly of similar composition to some local Neogene clays, found with two bichrome decorated jars (Day Reference Day1991, 142–5). These fabrics, identified as being compatible with locally available materials, in particular with the sediments of the Kastri Formation and rock fragments from the Phyllite–Quartzite series, were interpreted, together with samples of similar fabrics found at other sites in the region (discussed further below), as evidence for large-scale, specialised pottery production at Palaikastro, with wares being distributed through the region either as tradeable commodities in their own right or as transport containers for other goods (Day Reference Day1991; Reference Day, Tsipopoulou and Vagnetti1995). The additional presence, among the samples selected from Palaikastro, of non-local fabrics from the Mesara Plain, north central Crete, and the Gournia area, represented primarily by amphorae and jars, was viewed as further evidence of Palaikastro’s involvement within a wider, and seemingly well-established, network of production and trade that encompassed eastern and central Crete (Day Reference Day1991; Reference Day, Tsipopoulou and Vagnetti1995).
More recently, 26 sherds of pottery recovered from Palaikastro were included within a study of the production technologies and provenances of MM painted polychrome ware (i.e. Kamares Ware) from seven sites across central and eastern Crete (Faber, Day and Kilikoglou Reference Faber, Day, Kilikoglou and Quinn2009). Details regarding the specific types or shape of vessels sampled were not published, but all appear to have belonged to the fine fabric variant of the ware more commonly associated with cups, jugs and jars. The samples were analysed by ceramic petrography of thin sections together with microstructural analysis of fresh fracture surfaces by scanning electron microscopy (SEM); additional elemental compositional data obtained by neutron activation analysis have not been published in full. From the petrographic analysis, two fine-textured fabric groups were described as originating from the Palaikastro region on account of the presence of phyllite inclusions resembling rock types found in the vicinity of the site (Faber, Day and Kilikoglou Reference Faber, Day, Kilikoglou and Quinn2009, 144). The two fabric groups displayed a similar range of inclusions, but were differentiated by the relative abundance of calcite in the matrix. The ‘calcareous Palaikastro’ polychrome ware fabric group displayed a mottled appearance that was suggested as indicating a possible mixing of calcareous sediments from the Toplou Formation with non-calcareous sediments from the Kastri Formation; the ‘non-calcareous Palaikastro’ fabric group was interpreted as appearing to have been prepared from local outcrops of the Kastri Formation and Phyllite–Quartzite series (Faber, Day and Kilikoglou Reference Faber, Day, Kilikoglou and Quinn2009, 144–5). Of the 26 samples recovered from Palaikastro itself, 18 were assigned to the calcareous fabric group, four to the non-calcareous fabric group, and the remainder to various other non-local fabric groups; in addition, a small number of samples from other sites were also assigned to both Palaikastro fabric groups. All of the samples from the two Palaikastro fabric groups were optically inactive. Faber, Day and Kilikoglou (Reference Faber, Day, Kilikoglou and Quinn2009, 144) further described their ‘calcareous fabric’ as closely resembling the fine Neopalatial Palaikastro ‘Fabric 1’ previously described by Day (Reference Day1991, 142); however, this latter fabric (as noted above) is itself described by Day as a fine, red fabric derived from the Kastri Formation, and, as discussed further below, the sediments of the Kastri Formation appear to be non-calcareous. The description of Day’s ‘Fabric 1’ would instead appear to more closely describe the ‘non-calcareous’ fabric of Faber, Day and Kilikoglou (Reference Faber, Day, Kilikoglou and Quinn2009), and it is suggested here that ‘Fabric 3’ of Day (Reference Day1991, 143), also associated with high-fired decorated wares, may be a better match for the ‘calcareous fabric’ of Faber, Day and Kilikoglou (Reference Faber, Day, Kilikoglou and Quinn2009).
The work of Swann, Ferrence and Betancourt (Reference Swann, Ferrence and Betancourt2000; Ferrence, Swann and Betancourt Reference Ferrence, Swann and Betancourt2001; Ferrence, Betancourt and Swann Reference Ferrence, Betancourt and Swann2002) also examined Kamares Ware from Palaikastro and central Crete from the perspective of production technology and provenance, but on a smaller scale to that of Faber, Day and Kilikoglou (Reference Faber, Day, Kilikoglou and Quinn2009), focusing specifically on the analysis of white paints through the use of particle-induced X-ray emission spectrometry. Five decorated cups and a wheel-made offering table recovered from Palaikastro, dated from EM III to MM II A–B, were analysed (Ferrence, Swann and Betancourt Reference Ferrence, Swann and Betancourt2001, table 1). The results appeared to indicate a consistent preference for a calcium-rich white pigment for decorated pottery from Palaikastro, with a magnesium-rich pigment being used in the Mesara region, prompting the further suggestion that such information could contribute to the identification of the provenance of pottery (Ferrence, Swann and Betancourt Reference Ferrence, Swann and Betancourt2001, 51). Day, Relaki and Faber (Reference Day, Relaki, Faber, Wiener, Warner, Polonsky and Hayes2006) also confirmed the use of calcium white pigments at Palaikastro and other sites for MM polychrome decorated pottery, although they cautioned that further information was needed regarding the distribution of pigment types.
Returning again to petrographic analysis and undecorated vessels, four conical cups recovered from the fill of a well excavated at Palaikastro (MacGillivray, Sackett and Driessen Reference MacGillivray, Sackett and Driessen2007), dated to LM IIIA2, and representing four different macroscopically defined fabrics, were examined to determine whether they differed in composition and if they were locally produced (Doherty Reference Doherty, MacGillivray, Sackett and Driessen2007). The analysis concluded that although three of the cups varied in colour, they were closely related in composition, displaying quartz, phyllite and limestone inclusions derived from the geological formations found adjacent to Palaikastro; furthermore, the fabrics did not appear to have been modified by the addition of temper or refined (Doherty Reference Doherty, MacGillivray, Sackett and Driessen2007). From the presence of angular feldspars and biotite, derived from granitic rock and biotite-schist not found in the Palaikastro environs, the remaining sample was identified as being non-local and probably produced outside of Crete altogether (Doherty Reference Doherty, MacGillivray, Sackett and Driessen2007).
Aside from domestic wares, two groups of metallurgical ceramic crucibles, dating from LM IA and IIIB, recovered from Palaikastro, have been examined by SEM and thin section petrography (Evely, Hein and Nodarou Reference Evely, Hein and Nodarou2012). Two fabric groups were described, both utilising a non-calcareous groundmass and organic tempers, to which were also added additional aplastic tempers: phyllite rock fragments for the Neopalatial samples, and quartzite and quartz for the Postpalatial samples (Evely, Hein and Nodarou Reference Evely, Hein and Nodarou2012). The specific type of organic temper added also varied according to date, with animal hair and vegetal matter being identified respectively. The clay and aplastic inclusions of both fabric groups were identified as being compatible with the local geological environment, as well as resembling those seen in coarse domestic pottery attributed to Palaikastro (Evely, Hein and Nodarou Reference Evely, Hein and Nodarou2012).
While the above studies all argue for pottery production at, or near, Palaikastro itself, and in many cases identify the various Neogene clays and outcrops of metamorphic rocks in the area as the sources of raw materials, there remains little firm, direct, structural archaeological evidence for pottery production at the site, either in the form of workshops, kilns, or large concentrations of misfired kiln wasters. Such paucity of direct evidence is not uncommon within Minoan Crete as a whole, but nonetheless curious given the large scale at which pottery production undoubtably occurred, combined with the large extent of the excavations at the site. At Palaikastro, a circular stone structure with a vitrified clay lining, excavated close to the town, appears to have been connected with some sort of pyrotechnical activity, although opinion is divided as to whether it specifically operated as a pottery kiln or indeed is necessarily of Minoan date (e.g. Day Reference Day1991, 25, contra Davaras Reference Davaras1980; Jones Reference Jones1986, 251). The absence of large quantities of kiln wasters around, or inside, the structure, as might be expected at a pottery kiln, would also appear to argue against this functional interpretation.
Evidence attributed to Palaikastro
In addition to the above studies of pottery recovered at Palaikastro itself, further analytical studies have investigated the regional distribution of pottery exported from this site and others, as part of attempts to understand the extent and character of social and economic networks in central and eastern Crete (Day Reference Day1991; Reference Day, Tsipopoulou and Vagnetti1995; Reference Day and Hagg1997; Nodarou Reference Nodarou and Waksman2007; Reference Nodarou2010; Reference Nodarou and Tsipopoulou2017; Liard Reference Liard2019; Morrison et al. Reference Morrison, Brogan, Nodarou, Sofianou, Driessen and Knappett2022).
The earliest evidence of pottery exported from the Palaikastro region determined by analytical means (as opposed to assessments made on stylistic grounds) appears to be among the Kamares Ware vessels investigated by Faber, Day and Kilikoglou (Reference Faber, Day, Kilikoglou and Quinn2009). Although specific dates for individual samples were not published, this ware is known to originate in the late Prepalatial period but is more prevalent in the Protopalatial period (Faber, Day and Kilikoglou Reference Faber, Day, Kilikoglou and Quinn2009). Four samples assigned to the ‘calcareous’ and ‘non-calcareous’ Palaikastro polychrome fabrics, but recovered from Myrtos Pyrgos and Knossos, seemingly attest to the export of elaborate fine wares from Palaikastro at a comparatively early date for the site (Faber, Day and Kilikoglou Reference Faber, Day, Kilikoglou and Quinn2009, table 1). Further evidence for the possible export of pottery at this time occurs in the form of a cup and jar recovered from a funerary context at Petras; the fine red, high-fired fabric, was identified by Nodarou (Reference Nodarou and Tsipopoulou2017) as probably originating from Palaikastro. Considered together, the evidence from Faber, Day, and Kilikoglou and Nodarou may tentatively be suggested as evidence of the export from Palaikastro of wares associated with ritual activities, although this interpretation is largely a reflection of the nature of the materials and contexts analysed, and further analytical studies of more mundane and utilitarian pottery from domestic contexts are needed to gain a more complete picture of the range of pottery that may have been exported from Palaikastro during the Protopalatial period.
In contrast to earlier periods, the Neopalatial offers evidence for a seemingly substantial and varied export of pottery from Palaikastro. As part of his abovementioned studies of Neopalatial pottery from east Crete, Day identified pottery originating from, or near, Palaikastro at a number of other sites in the region, including Achladia-Platyskinos, Achladia-Riza, Analoukas, Azokeramos, Chochlakies, Petras, Stavros and possibly also Zou (Day Reference Day1991; Reference Day, Tsipopoulou and Vagnetti1995). In a later study of the Neopalatial pottery at Mochlos, Day, Joyner and Relaki (Reference Day, Joyner, Relaki, Barnard and Brogan2003) did not describe any pottery fabrics originating from Palaikastro, perhaps indicating that at this time Palaikastro’s economic activities in this regard did not extend far west of the Sitia Bay region. The coarse- and fine-wares from Palaikastro were described by two fabric groups, ‘Fabric 4’ and ‘Fabric 8’ respectively (Day Reference Day, Tsipopoulou and Vagnetti1995), which, in turn, appear to be synonymous with Palaikastro ‘Fabric 1’ and ‘Fabric 2’ described earlier by Day (Reference Day1991). The range of vessels attested included primarily cooking and storage vessels in ‘Fabric 4’, together with a smaller number of jugs/jars and cups occasionally also of the same coarse fabric but more commonly of ‘Fabric 8’ (Day Reference Day, Tsipopoulou and Vagnetti1995). Many of the larger vessels originating from Palaikastro may have been used for the transportation of goods, as Day suggested was probably the case for similar vessels originating from north and south central Crete (Day Reference Day, Tsipopoulou and Vagnetti1995, 165); however, explanations for the distribution of cooking pots, jugs/jars and cups are more uncertain, and while some may have been exported and traded as commodities in their own right, others may have accompanied the movement of people within the region.
For the Final Palatial period, the available analytical evidence is more restricted, but nonetheless the presence of vessels suggested as originating from Palaikastro at Chrysokamino (Nodarou Reference Nodarou and Waksman2007) and Petras, dated to LM III (Day Reference Day, Tsipopoulou and Vagnetti1995, 165; Nodarou Reference Nodarou and Waksman2007), appears to indicate that pottery continued to be exported to both rural sites and towns in east Crete, as in the Neopalatial period. The geographic distribution even appears to have increased in range and intensity at this time (Day Reference Day and Hagg1997, 224 n. 31) with exports from Palaikastro also reaching Mochlos, as described in two fabrics by Nodarou (Reference Nodarou2010): ‘Fabric 1d’, a coarse to semi-coarse fabric with predominant inclusions of silvery-grey phyllite, represented by a cooking pot and decorated kalathos and krater, and ‘Fabric 10’, a fine red, high-fired fabric, represented by a wide range of vessels types but all with functions related to the use of liquids. This latter fabric closely resembles the imported fabric also reported by Nodarou (Reference Nodarou and Waksman2007) at Petras in the Protopalatial period.
While the available analytical evidence suggests that the geographical distribution of pottery from Palaikastro in the Neopalatial period was largely continued, and expanded on, in the Final Palatial period, there seem to have been more abrupt changes in the types of wares being exported. From the Neopalatial period, the most commonly attested types exported appear to be coarse-ware cooking vessels and storage vessels, with comparatively few cups and pouring vessels (Day Reference Day, Tsipopoulou and Vagnetti1995). By contrast, during the Final Palatial period, the proportions are seemingly reversed, leading to the suggestion that Palaikastro in particular may have become an important regional centre for the export of fine-ware vessels associated with the transport and consumption of liquids (Nodarou Reference Nodarou and Waksman2007, 81). Such differences in the range of exports may, therefore, indicate profound changes over time in the nature of Palaikastro’s involvement within the wider east Cretan economic environment, as well as the manner with which it may have been perceived at other sites. However, such interpretations must be tempered with a degree of caution in recognition of the comparatively small number of Final Palatial sites at which pottery from Palaikastro has been identified. The development of phyllite tempered coarse-ware fabrics at other sites, from at least the Neopalatial period or earlier (e.g. Poursat and Knappett Reference Poursat and Knappett2005; Nodarou Reference Nodarou and Waksman2007; Alberti Reference Alberti and Tsipopoulou2016; Liard Reference Liard2019), may also potentially make identifying cooking vessels and transport/storage vessels exported from Palaikastro by reference to their fabric more difficult; similarly, the provenance of finer-textured fabrics (such as used for cups, bowls and pouring vessels) may also be difficult to confirm from the compositions of the fabrics alone. However, in practice, notwithstanding such potential analytical difficulties, in many instances the identifications of exports from Palaikastro are also frequently supported by distinctive stylistic characteristics of the vessels (e.g. Smith Reference Smith2010; Liard Reference Liard2019; Morrison et al. Reference Morrison, Brogan, Nodarou, Sofianou, Driessen and Knappett2022), highlighting the importance of both stylistic and analytical data when examining regional patterns of pottery exchange.
Comments
As the abovementioned studies demonstrate, pottery recovered at, and/or identified as originating from, Palaikastro has featured in a wide range of analytical studies. However, while these studies individually provide valuable insights, the differences in the specific research question addressed, methodologies applied, and types of material sampled, together with the often small numbers of objects analysed, make it difficult to gain a confident, overarching, impression of the nature of pottery production at Palaikastro during the Middle and Late Bronze Ages.
Of the range of analytical methodologies applied, petrographic analysis has been the most consistently utilised, and appears to offer the greatest potential for the differentiation of the various wares produced and circulated in eastern and central Crete. When combined with geological prospection, it has also been able to suggest potential sources of raw materials, and hence the probable provenance of various wares. In this regard, the pottery described as originating from Palaikastro has most commonly been identified by the presence of phyllite inclusions within a red or pink firing matrix, with outcrops of the Phyllite–Quartzite series and Neogene sediments located near the Minoan town seen as likely sources of raw materials (Day Reference Day1991). However, difficulties may exist in differentiating this ware from other phyllite-bearing wares made at other sites. A fine, red, quartz-rich, high-fired fabric, found with cups and pouring vessels, has also been suggested as originating from Palaikastro (Nodarou Reference Nodarou and Waksman2007; Reference Nodarou2010), although the lack of distinctive inclusions makes it difficult to confirm such a provenance by petrographic analysis alone. Both of these fabrics have been identified in contexts spanning a wide chronological range, from the Protopalatial through to the Final Palatial periods, suggesting a conservative approach to pottery production at Palaikastro, at least with regard to raw materials selection and fabric preparation.
However, despite featuring in a number of studies, it may be noted that only a comparatively small number of vessels have been analysed by thin sections that were recovered from Palaikastro itself and which may be said to relate to everyday activities. The Kamares Ware vessels and metallurgical crucibles sampled by Faber, Day and Kilikoglou (Reference Faber, Day, Kilikoglou and Quinn2009), Swann, Ferrence and Betancourt (Reference Swann, Ferrence and Betancourt2000) and Evely, Hein and Nodarou (Reference Evely, Hein and Nodarou2012), although considered to have been made locally, cannot be considered as indicative of general pottery production at the site, yet together they account for the majority of the analysed samples from the Protopalatial and Final Palatial periods. Aside from these samples, examples of domestic wares for these periods are represented by putative exports found at other sites and a small number of cups (Doherty Reference Doherty, MacGillivray, Sackett and Driessen2007). Prior to the present study, therefore, data regarding the composition of pottery from Palaikastro has relied largely on the Neopalatial samples analysed by Day (Reference Day1991), yet even within this dataset, the absolute number of samples was not substantial, and certain wares, especially cooking vessels, were underrepresented (Day Reference Day1991, 142). In the absence of direct data from Palaikastro itself, putative identifications of exports from the site for the Protopalatial and Final Palatial periods in particular become less certain, and would appear to be implicitly based, to some extent, on extrapolations made from what was known of Neopalatial pottery production.
While diachronic continuities in fabric composition may indeed exist, there is a danger that the extrapolation of results from the Neopalatial period to infer the nature of pottery production in other periods may simply be following a circular line of reasoning. As such, therefore, it may be seen that in order to understand the nature of pottery production at Palaikastro over time, there is a need for a more comprehensive sampling of materials from the site across a wider chronological range.
General geological context and potential pottery raw materials
The area surrounding the archaeological site encompasses a diverse geological environment, offering a range of resources that may be utilised for pottery production. The archaeological site itself presently lies approximately 200 m inland from Bodalaki Beach, situated within the Grandes Bay of east Crete. The coastal zones of this part of the bay are dominated by recent fluviatile and scree deposits formed through the re-deposition of weathered material from marine and terrestrial sediments of the Neogene period and pre-Neogene rocks (Figs 2 and 3).
Map of Neogene and Quaternary deposits (redrawn from Gradstein Reference Gradstein1973, fig. 19).

Geological map (adapted from Papastamatiou et al. Reference Papastamatiou, Vetoulis, Bornovas, Christodoulou and Tataris1959).

To the north and south of the archaeological site can be seen stratified exposures of these Neogene deposits, consisting of the marine Palaiokastron Formation dated to the Pliocene–Miocene periods overlying the terrestrial Kastri Formation of Miocene date (Papastamatiou et al. Reference Papastamatiou, Vetoulis, Bornovas, Christodoulou and Tataris1959; Gradstein Reference Gradstein1973). The Palaiokastron Formation consists of buff to grey organo-clastic or reefal limestones overlying a yellowish sandy or conglomeratic base, with rare fossiliferous marly intercalations. The underlying Kastri Formation consists of massive, laminar bedded, deposits of red-brown to red-purple silts and clays alternating with ill-sorted coarse conglomerates and rare sand intercalations. The conglomerate itself consists of grey limestones, red and grey phyllites, and green altered igneous rocks.
Further inland are extensive exposures of pre-Neogene rocks forming steep escarpments to the south of the archaeological site. The visible exposures consist largely of grey to dark-grey Triassic dolomites of the Tripolitza nappe, while to the south-west of the site are smaller exposures of grey to maroon phyllite and white to grey quartzite of the Permian–Triassic Phyllite–Quartzite series (Papastamatiou et al. Reference Papastamatiou, Vetoulis, Bornovas, Christodoulou and Tataris1959). Further west are extensive compact Miocene conglomerate formations, containing chert, sandstone, metasandstone, dolomite, limestone and rarely serpentinite (Papastamatiou et al. Reference Papastamatiou, Vetoulis, Bornovas, Christodoulou and Tataris1959).
Within the modern landscape a small number of intermittent rivers flow towards the Grandes Bay, depositing sediments derived from the erosion of these formations. At present, the largest of these rivers is the Kalogero River, which flows through the Miocene conglomerate before passing phyllite exposures immediately to the south of the modern village of Palaikastro.
With regard to potential sources of raw materials for pottery production visible today within the immediate vicinity of the archaeological site, the most substantial deposits of clay-rich sediments are found as layers within the aforementioned Kastri and Palaiokastron Formations. Extensive outcrops of the Kastri Formation are seen immediately to the north and south of Roussolakkos, especially in the lower levels of Kastri hill (from where the type section of the formation was described) and the adjacent low cliffs at Bodalaki and Chiona, while additional outcrops are also recorded west of Erimoupolis, and along the Zakros depression (Gradstein Reference Gradstein1973, 531–3). Owing to active coastal erosion, substantial localised deposits of colluvium, derived primarily from beds of the Kastri Formation, are also seen at the base of the cliffs, particularly on the northern side of Kastri hill. The name ‘Roussolakkos’ (Ρουσόλακκος), meaning ‘red pit’, may itself originate from the digging of such local red-coloured sediments that form the Kastri Formation for use as a building material (MacGillivray and Sackett Reference MacGillivray, Sackett and Cline2012, 571), although it is perhaps possible that clay for pottery production was also extracted.
Deposits of fine calcareous clays are found within the strata of the Palaiokastron Formation that form the upper slopes and summit of Kastri hill, and which lie immediately above the Kastri Formation (Gradstein Reference Gradstein1973, 539–41, fig. 19). The clay deposits within this formation are generally relatively small, typically forming strata less than a few tens of centimetres thick; however, larger deposits consisting of strata many metres thick are found 2 km south-east of the town, at Cape Plaka, near the Minoan sandstone quarry at Ta Skaria (MacGillivray et al. Reference MacGillivray, Sackett, Smyth, Driessen, Lyness, Hobbs and Peatfield1984; Papageorgakis, Mourtzas and Orfanoudaki Reference Papageorgakis, Mourtzas, Orfanoudaki, Waelkens, Herz and Moens1992). The lower strata of this outcrop, consisting of fine, grey, calcareous clay, may potentially represent an easterly outcrop of the Achladhia Formation more commonly found in the vicinity of Sitia Bay rather than part of the Palaiokastron Formation (Gradstein Reference Gradstein1973, 540), but nonetheless may also have been suitable for pottery production.
Another, and more removed, potential source of clay-rich sediments for potting may be found within the marine Neogene Toplou Formation. This formation occurs as stratified deposits of conglomerate, sand, silt, clay and limestone, extending from Analoukas eastward towards Palaikastro where it merges gradually with the Kastri Formation (Gradstein Reference Gradstein1973, 535–9). This lateral merging of the formations gives rise to a broad transition zone where the paler calcareous sediments of the Toplou Formation gradually transition to the red-coloured silts and clays of the Kastri Formation (Gradstein Reference Gradstein1973, 537).
In addition to clays, a variety of potential tempering materials are also available within the locality of Roussolakkos. These include sand and gravel available from dry river courses, as well as beach sands. A little distance further away, among the outcrops of phyllite located to the south of Palaikastro, are found deposits of weathered phyllite colluvium, typically consisting of somewhat friable laths generally less than 2 cm in length.
MATERIALS AND SAMPLING STRATEGY
Archaeological sampling
In total, 288 pottery samples were selected for analysis in the context of the current project, dating from MM IIA through to LM IIIA2. Numerous boxes of pottery sherds from dated contexts were strewed and individually examined by eye or with a hand lens. Samples were selected from typical contexts for each main phase of the site’s history so as to encompass the macroscopically discernible variation in style, fabric and technology, and covering all main functional roles (i.e. vessels for storage, transport, cooking, pouring, and drinking) including vessels of large, medium and small size, such as pithoi, cooking pots, amphorae, jugs, jars, bridge-spouted jars, bowls and various types of handled- and handleless-cups (Figs 4 and 5). Stylistic characteristics were considered to determine whether the sherds were of possible local origin (i.e. stylistically compatible with the repertoire of pottery typically found at Palaikastro) or possibly imported from other sites. While the sample selection focused on typical forms, a number of sherds of less common pottery types and/or with fabrics of unusual macroscopic appearance, and accordingly suspected as being imports, were also selected for study although sampling of these was not exhaustive.
A selection of sherds analysed in the study (FG 1–4). See Table A1:1 (Supplementary Material) for further details.

A selection of sherds analysed in the study (FG 5–14). See Table A1:1 (Supplementary Material) for further details.

Table 1 presents a summary of the types of vessels sampled across all periods, grouped according to the broad functional categories previously presented by Knappett and Cunningham (Reference Knappett and Cunningham2012). The prevalence of cups within the sampled assemblage reflects in general terms both the large variety of cup types present at the site and their apparent numerical dominance within the archaeological assemblage (e.g. conical cups in the Neopalatial and early Final Palatial periods).
Frequency of samples selected for analysis, grouped by chronological period and functional group (following Knappett and Cunningham Reference Knappett and Cunningham2012). For full sample details, see Table A1:1 (Supplementary Material).

Consequently, as the archaeological sample selection attempted to reflect the apparent variability of pottery types within each period, and also owing to limitations in the availability of suitable material, the number of samples obtained from each chronological period differed (Table 1). In particular, it may be noted that comparatively fewer samples were selected from contexts dated to MM IIB or LM IIIA2, and there were no samples selected for LM II. This inconsistency in sample numbers generally reflects the relative availability of material that could be studied, as recovered from excavations predating the start of the PALAP project, from which it was not possible to select any samples.
In order to increase the amount of material available for study, samples were taken from a number of different archaeological contexts spread across the excavated sections of the town (Table 2). However, no attempts were made to achieve a representative sampling either across the geographic spread of the site or across the range of functional areas within it. All the contexts from which samples were selected appear to have been associated with domestic habitation (e.g. rooms and refuse sites), and no samples were obtained from obviously industrial areas (e.g. pottery kilns or workshops). Some samples were selected from the fill of two wells (MacGillivray, Sackett and Driessen Reference Driessen, Bretschneider, Driessen and Van Lerberghe2007), but these also contained assemblages of domestic pottery. Further details of the archaeological samples are presented in Table A1:1 (Supplementary Material).Footnote 2
Archaeological contexts from which samples were collected, grouped by chronological period.

The sampling strategy therefore provides a qualitative view of the range of types of pottery used at the site between MM IIA and LM IIIA2, with the exception of LM II, for which no samples were available owing to the limited extent and ephemeral character of the occupation during this period. Owing to the vast quantity of pottery recovered from the site, it was not possible to undertake a randomised sampling strategy in an attempt to provide a more quantitative assessment of the variation in pottery. Despite this limitation, the comparatively large number of samples analysed in this study nonetheless gives some indication of the broad changes occurring in the types of pottery and pottery fabrics used at the site over time.
The selected samples were photographed before sub-samples for analysis were removed using an electric tile saw. The remaining portions of the samples not used for analysis were retained at the site apothiki and additionally marked with the sample identification codes used in the present study.Footnote 3
Geological sampling
In addition to sampling archaeological pottery, an extensive programme of geological prospection and sampling around the site and its wider environs was undertaken in order to gain an understanding of the composition, physical properties, and local availability of potential raw materials that may have been used in pottery production (Fig. 6). A total of 130 samples of rock, colluvium, sand, gravel, clay-rich sediments and soils were collected from locations concentrated within a c. 3 km radius of the archaeological site. The region was first studied with reference to geological maps and reports (Papastamatiou et al. Reference Papastamatiou, Vetoulis, Bornovas, Christodoulou and Tataris1959; Gradstein Reference Gradstein1973), topographical maps (Matsouka and Adamakopoulos Reference Matsouka and Adamakopoulos2007), and satellite images, after which a preliminary vehicle-based prospection of the region was undertaken. Following the initial results from the petrographic analysis of the archaeological samples, further pedestrian prospection enabled the sampling of a wider range of areas inaccessible to vehicles. The sampling process targeted exposures of all the major geological formations around the archaeological site, as well as the main river systems, in order to gain some understanding through the transported sands and gravels of the wider regional geological landscape. Samples of clay-rich sediments and soils were collected for preparation into experimental briquettes. Details of the geological samples are given in Table A1:2 (Supplementary Material). All geological samples are stored at the Fitch Laboratory.
Map showing locations of geological samples. See also Table A1:2 (Supplementary Material).

Whilst the geological prospection attempted to obtain samples reflecting the diversity of materials available within the modern landscape, it is recognised that this may have only partially reflected the materials available during the Bronze Age. In the intervening millennia the region has undergone substantial geomorphological changes, including relative changes in sea level and coastal erosion. In addition, agricultural activities and construction (including, amongst others, the development of extensive irrigated olive plantations, the channelling of stretches of the Kalogero River, and the growth of the villages of Palaikastro and Agathias) have altered the appearance of the landscape, and in the process may also have potentially destroyed or obscured sources of raw materials utilised in the past. Nonetheless, despite those changes that have occurred since the Bronze Age, the overarching geological landscape appears today much the same as it would have then, being dominated by pre-Neogene rocks overlain by Neogene sediments. As such, therefore, while specific Bronze Age quarry sites from which potting materials were extracted may have been lost, the types of raw materials potentially used remains largely unchanged from those seen today.
METHODOLOGY AND ANALYTICAL TECHNIQUES
Archaeological samples
The archaeological pottery samples were initially studied as hand specimens using a stereo microscope before being analysed by petrographic analysis of thin sections, WD-XRF, and re-firing of pottery chips under controlled conditions. Covered thin sections of all 288 pottery sherds were prepared at the Fitch Laboratory and analysed using a Zeiss Axioskop 40 polarising microscope.
Bulk elemental analysis was carried out on all 288 pottery samples at the Fitch Laboratory using a Bruker S8 TIGER 4kW WD-XRF spectrometer with a rhodium excitation source. Samples were measured as glass beads prepared from 1 g of ignited sample and 6 g of a mixture of lithium metaborate/lithium tetraborate with lithium bromide added as a non-wetting agent. Twenty-six major, minor and trace elements were determinedFootnote 4 using a custom calibration based on 43 certified reference materials (Georgakopoulou et al. Reference Georgakopoulou, Hein, Müller and Kiriatzi2017). To identify patterns in the elemental dataset, multivariate statistical analyses (cluster and principal component analyses [PCA]) were performed on log transformed element concentrations (excluding Pb, Cu, P) using the STATISTICA software package. Potential clusters in the elemental dataset were subsequently examined, taking into account petrographic fabrics and macroscopic information.
All pottery samples were subjected to re-firing tests in order to roughly assess the original firing atmosphere and the macroscopic colour of the fabric in relation to the composition of the clay base. Chips from all of the samples, (< 0.5 x 0.5 cm) were fired at 900°C in oxidising conditions using a Naberthem L5/P furnace. The maximum temperature was achieved gradually and held to give a soaking time of one hour. The kiln was then turned off and the samples left to cool overnight. The maximum temperature attained is considered to be equal or above the general firing temperatures of the pottery under study, based on the examination of the clay matrix optical activity in thin sections. The re-firing of all of the pottery samples under the same conditions, preferably at temperatures higher than those of their original firing, was intended to eliminate any colour variation caused by the original firing conditions, the vessel use, and/or burial conditions, and thereby more safely distinguish different compositions of clay pastes or slip/paints as broadly indicated by their colour (Whitbread Reference Whitbread1995, 391; Gauss and Kiriatzi Reference Gauss and Kiriatzi2011, 70).
Geological samples
The geological samples were initially examined and compared by eye or with the aid of a stereo microscope in the Fitch Laboratory, following which a selection was made for further elemental and/or petrographic analysis. In some instances, when there were no clearly discernible differences between samples taken from connected geomorphological features (as for example when sampling different locations along the course of a river) only one or two samples were selected for further analysis. A total of 40 samples were selected for further analysis, including clay-rich sediments, loose coarse sediments and rock samples.
Nineteen clay-rich sediments collected during the geological survey (Table A1:2 [Supplementary Material]) were first individually prepared as briquettes, according to the following process. Approximately 300 g of each sediment was mixed in a beaker with an excess of deionised water and left to rehydrate for 48 hours. The excess water, along with any floating organic debris, was then manually decanted and the remaining slurry mixed before being left to partially dry over a number of days. Once each slurried sediment had reached a suitable consistency, it was mixed again before sub-samples were removed and formed into four briquettes, each of approximately 2 x 2 x 5 cm. These briquettes were then left to dry indoors at ambient room temperature for a number of days, before being fired in an oxidising atmosphere to either 700, 900, or 1050°C. An unfired briquette of each sample, dried to 100°C, was also retained for comparison. After firing, the briquettes were stored indoors in unsealed containers for two weeks in order that any potential spalling might be allowed to occur. Thin sections were then prepared from all 19 samples using the 700°C briquettes, and in some instances also the 900 and 1050°C briquettes. Following petrographic analysis of these briquettes, 12 of these geological samples were then subsequently analysed by WD-XRF using the 900°C briquettes prepared in the same manner as the archaeological samples.
Twenty-one rock samples and coarser grained loose sediments (e.g. beach sand, river gravel, and colluvium) that could not be formed into briquettes were mounted in resin and prepared as thin sections for petrographic analysis only. These included three samples of phyllite rock, which in order to investigate the effects of firing, were first roughly crushed by hand and fired in ceramic crucibles under the same conditions as the clay briquettes.
RESULTS
The macroscopic and petrographic analyses of the archaeological pottery samples provided a range of information concerning the composition, texture, and firing conditions of the ceramic fabrics (Figs 7 and 8). This information served as the basis for an initial clustering of the samples into 14 petrographic fabric groups; fabrics of individual samples that could not be matched with any others within the sample assemblage were designated as ‘ungrouped fabrics’ or ‘fabric loners’. Subsequently, the results of elemental analysis and re-firing tests were used to refine the initial petrographic groupings, and collectively these multiple lines of evidence were used to define and characterise the Palaikastro pottery fabric groups. Moreover, stylistic information was also considered when assessing the variability within these groups, in order to understand related technological choices; such additional information provided the basis for defining fabric sub-groups where consistent associations between compositional variants and pottery forms could be identified. Such contingent definitions of fabric groups and sub-groups aimed to better reflect intentional choices that may have been made by the Minoan potters.
Photographs of fresh fracture surfaces of fabric groups: a) PK 95 (FG 1a); b) PK 10 (FG 1b); c) PK 287 (FG 1c); d) PK 41 (FG 2); e) PK 87 (FG 3); f) PK 14 (FG 4); g) PK 32 (FG 5); h) PK 149 (FG 6); i) PK 165 (FG 7); j) PK 28 (FG 8); k) PK 133 (FG 9); l) PK 96 (FG 10a); m) PK 194 (FG 10b); n) PK 193 (FG 10c); o) PK 127 (FG 11); p) PK 240 (FG 12); q) PK 26 (FG 13a); r) PK 100 (FG 13b); s) PK 222 (FG 13c); t) PK 30 (FG 13d); u) PK 49 (FG 14).

Photomicrographs of thin sections of fabric groups (cross-polarised light): a) PK 95 (FG 1a); b) PK 10 (FG 1b); c) PK 287 (FG 1c); d) PK 41 (FG 2); e) PK 87 (FG 3); f) PK 231 (FG 4); g) PK 32 (FG 5); h) PK 149 (FG 6); i) PK 165 (FG 7); j) PK 28 (FG 8); k) PK 133 (FG 9); l) PK 96 (FG 10a); m) PK 194 (FG 10b); n) PK 193 (FG 10c); o) PK 127 (FG 11); p) PK 240 (FG 12); q) PK 26 (FG 13a); r) PK 100 (FG 13b); s) PK 222 (FG 13c); t) PK 30 (FG 13d); u) PK 49 (FG 14).

In general, close agreements were seen between the analytical groups and the macroscopic appearance of their respective samples. The only significant differences were among the sub-groups of FG 1, and the differentiation of the semi-fine red wares (FG 4 and FG 14). In these cases, differences were not apparent macroscopically, but only identified through subsequent analyses. Brief macroscopic and analytical descriptions of each fabric group are given below, with additional systematic petrographic fabric descriptions for the principal local fabric groups given in Supplementary Appendix 2.
Fabric Group 1 ‘coarse textured phyllite-tempered fabric’ (FG 1; sub-groups FG 1a–c)
Samples:
-
• FG 1a: PK 1, 2, 3, 4, 8, 9, 11, 13, 15, 18, 20, 73, 75, 92, 93, 94, 95, 97, 98, 99, 101, 104, 134, 135, 136, 137, 138, 139, 141, 142, 143, 160, 185, 186, 187, 188, 189, 190, 191, 192, 197, 223, 226, 227, 228, 229, 230, 236, 238, 250, 256, 257, 258, 259, 263, 267, 268, 269, 272, 273, 274, 275, 276
-
• FG 1b: PK 5, 7, 10, 12, 16, 17, 22, 23, 44, 48, 69, 70, 71, 72, 74, 106, 155, 157, 225, 239, 255, 264, 270, 271
-
• FG 1c: PK 125, 183, 184, 195, 217, 218, 237, 286, 287
Date range:
-
• FG 1a: MM IIA–LM IIIA2
-
• FG 1b: MM IIA–LM IIIA2
-
• FG 1c: MM IIIA–LM IB
Brief description:
Fabric Group 1 represents a group of compositionally closely related fabrics, but within which certain consistent variations in composition, grain size distribution, shape and type of inclusions (e.g. dominant inclusion type varies from quartzite or sandstone to phyllite), and fabric texture can be identified, described by three sub-groups: FG 1a, 1b, and 1c. The distinctions between these variants are often subtle and without definite boundaries, and as such they represent tendencies within a spectrum of continuous variation. They are, nonetheless, proposed here for their analytical utility in that through them it is possible to plot broad changes in fabric composition either over time or according to vessel types.
Fabric Group 1a is a coarse textured, very poorly sorted fabric, and in hand specimen (Fig. 7a) displays frequent aplastic inclusions, less than 3.1 mm in length, including pink, grey or buff coloured, elongated inclusions, together with approximately equant-shaped, grey to off-white inclusions, set within an orange to pink, or grey to black, matrix. The elongated inclusions generally display the ‘satin-like lustre’ characteristic of phyllite, and even within a single pottery sample they may appear in a variety of colours. Similar variation is also seen within geological outcrops of phyllite rock and colluvium, but in pottery may also be influenced by firing conditions, as determined from firing experiments using geological samples. In cross-section, the sherds of this group are moderately thick to thick, 4–36 mm, and display an orange matrix evenly throughout, or else orange margins with a grey or black core, especially in thicker samples.
In thin section (Fig. 8a), the fabric displays c. 30–45% inclusions, consisting of dominant to few elongated, fine sand-sized to fine gravel-sized inclusions of phyllite, and sub-angular to rounded, fine to coarse sand-sized inclusions of sandstone, mono- and polycrystalline quartz, meta-sandstones, red-brown clay pellets, and rare, occasionally absent, red siltstone, microcrystalline calcite, and mica, in a non-calcareous matrix.
In terms of elemental composition, FG 1a is a low-calcareous fabric sub-group, also with low Cr and Ni content (Table 3). As with the thin sections, the elemental composition shows some internal variability within this fabric sub-group, reflected in the respective relative standard deviations.
Mean elemental compositions (oxides in wt% and elements in ppm) and relative standard deviation (rsd) in % of FG 1a, FG 1b and FG 1c.

Sub-group FG 1b appears very similar to FG 1a but, in addition to phyllite and sandstone inclusions etc., FG 1b is distinguished by also containing sand-sized inclusions of microcrystalline calcite and, more rarely, microfossils (Figs 7b and 8b). In hand specimen these additional inclusions may be visible as rounded, off-white, coarse sand-sized particles, often with a soft, powdery appearance. Vessels of FG 1b exhibit similar variations in wall thickness (4–36 mm) and cross-section colouration to those of FG 1a. With regard to elemental composition, the additional inclusions of microcrystalline calcite result in consistently higher CaO, but otherwise this fabric is very similar to FG 1a (Table 3).
Fabric Group 1c also closely resembles FG 1a but is distinguished from the latter by having a somewhat finer appearance typified by slightly smaller and less frequent inclusions. The fabric is poorly sorted, containing common fine to coarse sand-sized inclusions of the same types and appearances as seen in FG 1a (Figs 7c and 8c). In contrast to FG 1a and FG 1b, vessels of FG 1c are of thin to moderate wall thickness, 3–9 mm, and in hand specimen commonly display an orange matrix evenly throughout the cross-section, and only rarely orange margins with a grey or black core. In its elemental composition, FG 1c is also very similar to FG 1a (Table 3).
In terms of firing, within FG 1 as a whole, there is significant variation in the optical activity and colour of the clay matrix even within the same thin section, indicating a lack of consistency in firing conditions. Firing temperatures appear to have ranged from c. 750 to 950°C, and with variable, but predominantly oxidising, atmospheric conditions.
Fabric Group 2 ‘fine textured calcareous fabric’ (FG 2)
Samples: PK 31, 33, 34, 35, 36, 37, 39, 40, 41, 43, 50, 51, 52, 53, 54, 55, 56, 58, 59, 60, 61, 63
Date range: MM IIA–B
Brief description:
Fabric Group 2 represents a homogenous group of fine-textured, well-sorted fabrics, and in hand specimen (Fig. 7d) displays few approximately equant-shaped inclusions (rarely elongated or curvilinear), less than 0.6 mm in length, white to off-white, grey, orange, or purple in colour, or translucent, with either glassy, powdery, or dull appearances, set within a pale orange to buff-coloured matrix. Vessels of FG 2 are all of moderate wall thickness, c. 4–10 mm, and commonly display a buff matrix evenly throughout the cross-section or, less frequently, narrow buff margins with a pale orange core.
In thin section (Fig. 8d), the fabrics display c. 15–25% inclusions, rounded to sub-rounded, silt-sized, consisting of dominant to common monocrystalline quartz/feldspar (generally too small to allow confident differentiation) and microcrystalline calcite, few to rare clay pellets and mica laths, and very rare microfossils and shell fragments, within a calcareous matrix. Very rare elongated and rounded phyllite rock fragments, and rounded sandstone/polycrystalline quartz may also be seen in some, although not all, samples. Thin sections display predominantly low optical activity, although occasionally moderate to high optical activity can be seen. Based on this evidence, initial firing seems to have taken place primarily in oxidising, or rarely poorly oxidising, conditions with temperatures usually exceeding c. 800–850°C, although some vessels were obviously fired at lower temperatures.
As with FG 1, FG 2 has low Cr and Ni content (Table 4), but differs from the former in a slightly higher Si:Al ratio and an increased CaO and Sr content, likely reflecting a different clay matrix and/or finer texture. The relatively high variability in P2O5 and Mn content in FG 2 is introduced by samples PK 61 and PK 63 (both MM IIB), which have elevated contents of both elements, possibly due to alteration during use and/or burial.
Mean elemental compositions (oxides in wt% and elements in ppm) and rsd in % of FG 2 (n = 22).

Fabric Group 3 ‘semi-fine textured pale pink fabric’ (FG 3)
Samples: PK 46, 47, 62, 64, 65, 66, 67, 80, 87, 117, 122, 124, 131, 132, 156, 182, 234, 280, 281
Date range: MM IIA–LM IB
Brief description:
Fabric Group 3 is a cluster of moderately to poorly sorted fabrics, which in hand specimen (Fig. 7e) displays common, approximately equant-shaped, inclusions, less than 1.9 mm in length, white or grey in colour, or translucent, often with a glassy appearance, and off-white with a powdery surface, together with few to rare, rounded, red-brown inclusions with a dull appearance, purple elongated and rounded inclusions, and off-white curvilinear inclusions. The matrix appears pale orange to buff, or pale brown. Vessels of FG 3 are of thin to moderate wall thickness, 3–9 mm, and generally display an even pale orange to buff, or pale brown matrix throughout the cross-section.
In thin section (Fig. 8e), the fabrics display c. 20–30% inclusions, rounded to sub-angular, silt-sized to fine sand-sized, consisting of dominant to few monocrystalline quartz/feldspar and microcrystalline calcite, and few to very rare polycrystalline quartz/sandstone and phyllite rock fragments, clay pellets, microfossils, and mica laths. Thin sections display predominantly low optical activity, indicating firing temperatures exceeding 800–850°C, and only rarely high optical activity reflecting lower firing temperatures. Oxidising, or weakly oxidising, conditions prevailed during firing.
FG 3 is similar to FG 2 in terms of elemental composition (Table 5), having also noticeably low Cr and Ni. Again, as with FG 2, there is very high variability in P2O5 content, with all five MM IIB samples (PK 62, 64–67) showing high levels. Significantly, these five samples, together with PK 61 and PK 63 of FG 2, were all recovered from the same excavation context (Area 6, ES85), suggesting that the high P2O5 content may be due to local burial conditions. Sample PK 131, assigned to this group on petrographic grounds, shows some differences in elemental composition, with elevated CaO (c. 12.5%) and MgO (c. 6.4%) levels.
Mean elemental compositions (oxides in wt% and elements in ppm) and rsd in % of FG 3 (n = 19).

Fabric Group 4 ‘semi-fine textured pink-orange fabric’ (FG 4)
Samples: PK 14, 38, 45, 76, 77, 79, 81, 82, 83, 84, 85, 86, 88, 89, 91, 109, 110, 111, 112, 113, 114, 116, 118, 119, 120, 121, 123, 130, 145, 147, 148, 150, 152, 153, 154, 158, 159, 161, 162, 163, 164, 166, 167, 169, 170, 171, 172, 173, 174, 175, 176, 177, 178, 179, 180, 181, 198, 199, 201, 202, 203, 204, 205, 206, 207, 208, 209, 210, 211, 212, 213, 214, 215, 219, 220, 221, 224, 231, 232, 233, 235, 242, 245, 246, 249, 251, 252, 253, 254, 266, 278, 279, 282, 283, 284, 285, 288
Date range: MM IIA–LM IIIA
Brief description:
Fabric Group 4 is a cluster of moderately to poorly sorted fabrics, which in hand specimen (Fig. 7f) displays common, approximately equant-shaped (rarely elongated), inclusions, less than 1.6 mm in length, predominantly white or grey in colour, or translucent, often with a glassy appearance, and few to rare grey, brown, off-white, red-brown or purple inclusions, set within an orange to light orange, or rarely grey, matrix. The vessels of FG 4 are of thin to moderate wall thickness, c. 3–10 mm, or very rarely thick-walled, c. 13–15 mm, and predominantly display an orange to light orange matrix evenly throughout the cross-section, or very rarely thick orange margins with a narrow, slightly grey tinted, core, suggesting firing in oxidising conditions.
In thin section (Fig. 8f), the fabrics display c. 20–30% inclusions, rounded to sub-rounded, sand-sized, consisting of dominant to frequent monocrystalline quartz, common to few polycrystalline quartz, sandstone, microcrystalline calcite, clay pellets/textural concentration features, and rare to very rare phyllite, serpentinite, and mica, within a low calcareous matrix. Thin sections display predominantly high to moderate optical activity, indicating firing temperatures not exceeding c. 750–800°C, and only rarely low optical activity reflecting higher temperatures.
As with FG 1–3, FG 4 also has low levels of Cr and Ni (Table 6). The mean CaO level of FG 4 is similar to that of FG 1 as a whole, and lower than that of FG 2 and FG 3, albeit with relatively high variability between samples.
Mean elemental compositions (oxides in wt% and elements in ppm) and rsd in % of FG 4 (n = 97).

This group is readily distinguished from FG 2 and FG 3 in hand specimen by its coarser texture and the more reddish colouration of the matrix. It is also distinguished from FG 1a and 1b by the relative scarcity of large phyllite inclusions. In hand specimen, thin section, and elemental composition, FG 4 most closely resembles FG 1c, and although the latter tends to include a larger proportion of more angular phyllite inclusions, in some instances the distinction may be difficult to make, and it is possible that FG 1c could alternatively be regarded as an endmember of FG 4.
As a group, FG 4 displays wide variation in the proportion of microcrystalline calcite inclusions, as seen in thin sections, as well as variation in the levels of CaO detected by bulk elemental analysis (minimum = 0.2, maximum = 6.1%). This variation is greater than that seen in either FG 1a or 1c, and more closely resembles that seen in FG 1 as a whole. However, unlike within FG 1, no correspondence could be discerned within FG 4 between vessel type and proportions of CaO, and hence no fabric sub-groups were defined.
Fabric Group 5 ‘very fine textured, low calcareous fabric’ (FG 5)
Samples: PK 32, 57
Date range: MM IIA
Brief description:
Fabric Group 5 represents a pair of samples with fine-textured, well-sorted fabrics, which in hand specimen (Fig. 7g) displays very few, approximately equant-shaped, inclusions, less than c. 0.9 mm in length, light grey, off-white, and orange in colour, within a pale orange matrix. The vessels of FG 5 are both of moderate wall thickness, c. 4–11 mm, and in cross-section are evenly coloured throughout, and appear to have been fired in an oxidising atmosphere.
In thin section (Fig. 8g), the fabrics display c. 2–5% inclusions, sub-rounded, silt- to fine sand-sized, consisting of predominantly monocrystalline quartz/feldspar and clay pellets, together with very rare, medium to coarse sand-sized inclusions of polycrystalline quartz or phyllite. The thin sections of both samples display moderate optical activity throughout.
Both samples of FG 5 have intermediate levels of CaO and low Cr and Ni (Table 7). Compared to the previous fabric groups they differ in their comparatively high MgO levels, and a low Si:Al ratio.
Elemental compositions (oxides in wt% and elements in ppm) of samples PK 32 and PK 57 assigned to FG 5.

Fabric Group 6 ‘semi-fine-textured pale orange fabric with textural concentration features’ (FG 6)
Samples: PK 126, 149, 168
Date range: MM IIIB–LM IA
Brief description:
Fabric Group 6 represents a small group of samples with medium- to fine-textured, moderately sorted fabrics, which in hand specimen (Fig. 7h) displays frequent, approximately equant-shaped, inclusions, less than c. 6 mm in length, dominantly orange in colour, and rarely light grey or off-white, set within a pale orange matrix. The vessels of FG 6 are of thin to moderate wall thickness, c. 2–12 mm, and display a pale orange matrix evenly throughout the cross-section, suggesting firing in oxidising conditions.
In thin section (Fig. 8h), the fabrics display c. 30–40% inclusions, rounded to sub-angular, coarse silt to fine gravel-sized, consisting of dominant textural concentration features (usually homogenous, occasionally with quartz interclasts), few monocrystalline quartz, and rare to very rare or absent polycrystalline quartz, phyllite rock fragments, microcrystalline calcite, and mica laths, within a non-calcareous matrix. The thin sections display high to moderate optical activity, suggesting firing below c. 800°C.
FG 6 has low levels of CaO, and elevated Zr and Th compared to other groups (Table 8), although overall has a similar composition to FG 1 and FG 4. However, sample PK 168 differs from the other two in a number of elements, notably with higher levels of Co, Zn and Mn.
Elemental compositions (oxides in wt% and elements in ppm) of samples PK 126, 149 and 168 assigned to FG 6.

Fabric Group 7 ‘medium-coarse-textured pale orange fabric with carbonates and phyllite’ (FG 7)
Samples: PK 165, 196
Date range: LM IA
Brief description:
Fabric Group 7 represents a pair of samples with medium-coarse, poorly sorted fabrics, which in hand specimen (Fig. 7i) display frequent, approximately equant-shaped (rarely elongated), inclusions, less than c. 20 mm in length, grey, off white, and orange in colour, set within a pale orange matrix. The vessels of FG 7 are both of moderate wall thickness, 4–9 mm, and display a pale orange matrix evenly throughout the cross-section, and appear to have been fired in an oxidising atmosphere.
In thin section (Fig. 8i), the fabrics display c. 30–50% inclusions, rounded, silt to coarse sand-sized, consisting of dominant microcrystalline calcite, common to few mono- and polycrystalline quartz, sandstone, clay pellets/textural concentration features, and phyllite rock fragments, and rare microfossils, set within a calcareous matrix. The thin sections display either high (PK 165) or low optical activity, indicating different firing temperatures.
Both samples have high CaO levels and, compared to the previous groups, elevated Cr and Ni, and a high Si:Al ratio, and low Zr content (Table 9).
Elemental compositions (oxides in wt% and elements in ppm) of samples PK 165 and 196 assigned to FG 7.

Fabric Group 8 ‘coarse-textured orange fabric with purple siltstone’ (FG 8)
Samples: PK 21, 28, 105, 265, 277
Date range: MM IIA–LM IIIA
Brief description:
Fabric Group 8 represents a small group of poorly sorted fabrics, which in hand specimen (Fig. 7j) display frequent, elongated to equant, inclusions, less than c. 2.3 mm in length, dominantly purple, grey, black, and white in colour, set within an orange to grey or black matrix. The vessels of FG 8 are of moderate to thick wall thickness, 6–17 mm, and generally display an orange matrix throughout the cross-section, or orange margins and a grey to black core (where many of the larger inclusions also appear grey or black), especially across thicker parts of the samples. From this, it appears that firing occurred in an oxidising atmosphere, but with short durations.
In thin section (Fig. 8j), the fabrics display c. 30–50% inclusions with a bimodal size distribution: the coarse fraction consists of dominant, angular to rounded, coarse sand to fine gravel-sized inclusions of sedimentary origin ranging from siltstone to strongly laminated sandstone, together with mono- and polycrystalline quartz; the fine fraction consists of common, rounded to angular, coarse silt- to fine sand-sized inclusions of mono- and polycrystalline quartz, and clay pellets, within a low calcareous matrix. The thin sections display high to moderate optical activity and low optical activity in the thicker walled pots, indicating rather consistent firing conditions and relatively low temperatures (less than c. 750–800°C).
In elemental composition, FG 8 has low levels of CaO and Sr, and a high Si:Al ratio (Table 10). There is high internal variability in Cr and Ni content, introduced by considerably elevated values in the two MM IIA samples (PK 21 and 28).
Mean elemental compositions (oxides in wt% and elements in ppm) and rsd in % of FG 8 (n = 5).

Fabric Group 9 ‘semi-fine-textured buff to light orange fabric with rare metamorphic rock fragments and biotite’ (FG 9)
Samples: PK 128, 129, 133, 144, 247, 248
Date range: MM IIIB–LM IIIA
Brief description:
Fabric Group 9 represents a small group of semi-fine-textured, well-sorted fabrics, which in hand specimen (Fig. 7k) display few, equant-shaped, inclusions, less than c. 1 mm in length, light grey, off white, and orange in colour, set within a buff to light orange, or rarely light pink or grey, matrix. The vessels of FG 9 are of moderate wall thickness, 4–9 mm, and display a buff, light orange, or light pink matrix throughout the cross-section, or rarely light orange or pink margins with a light grey core, suggesting that firing occurred in an oxidising atmosphere.
In thin section (Fig. 8k), the fabrics display c. 5–15% inclusions, rounded, silt to coarse sand-sized, consisting of monocrystalline quartz, microcrystalline calcite, clay pellets, and rare to absent polycrystalline quartz, sandstone, metamorphic rock fragments (partially altered; amphibolite, serpentine), and muscovite and biotite laths, set within a calcareous matrix. The thin sections commonly display high optical activity, indicating firing temperatures not exceeding c. 750°C, or rarely are optically inactive.
In bulk elemental composition, FG 9 has an intermediate CaO content, and elevated levels of MgO, Cr, Ni and Co (Table 11). In addition, Fe2O3, V and Zn are elevated compared to the previously discussed fabrics, while Zr is lower than in most other fabrics.
Mean elemental compositions (oxides in wt% and elements in ppm) and rsd in % of FG 9 (n = 6).

Fabric Group 10 ‘coarse-textured orange fabric with granodiorite rock fragments’ (FG 10; sub-groups 10a–c)
Samples:
-
• FG 10a: PK 29, 96
-
• FG 10b: PK 146, 194
-
• FG 10c: PK 193
Date range:
-
• FG 10a: MM IIA–IIIA
-
• FG 10b: LM IA
-
• FG 10c: LM IA
Brief description:
Fabric Group 10 represents a broad cluster of fabrics sharing certain distinct compositional features, suggesting possible similar, or partially overlapping, geological origins (but not necessarily a common precise geographical provenance), but nevertheless, certain differences can be seen in the coarseness and grain size distribution of the inclusions, and in the texture and composition of the matrices. In addition, notwithstanding the small number of samples available, differences in composition appear to correspond to typological/functional differences among the samples. Accordingly, the samples are described by three sub-groups: FG 10a, 10b and 10c.
Fabric Group 10a consists of a pair of samples with coarse, very poorly sorted fabrics, which in hand specimen (Fig. 7l) display frequent, approximately equant-shaped, inclusions, less than c. 2 mm in length, white, grey, black, and black and white in colour, set within a pale to dark orange, or light grey-brown, matrix. The two vessels of FG 10a show moderate to large wall thickness, 6–20 mm, and in cross-section display narrow, dark orange margins, with either a slightly paler orange or light grey-brown core, suggesting firing in an oxidising atmosphere, but for a short duration.
In thin section (Fig. 8l), the fabrics of FG 10a display c. 30–50% inclusions, angular to sub-angular, silt to coarse-sand-sized, consisting of monocrystalline quartz, plagioclase feldspar, alkali feldspar and granodiorite rock fragments, set within a low calcareous matrix. Both analysed samples show high optical activity, reflecting low firing temperatures, not exceeding c. 750°C.
Fabric Group 10b represents somewhat finer-textured fabrics than those of FG 10a, yet nonetheless, in hand specimen they display inclusions of similar appearance but with an additional component of orange-coloured inclusions, less than 5 mm in length. The two samples of FG 10b are of moderate wall thickness, 8–13 mm, and show a light orange matrix evenly throughout the cross-section. Compared to FG 10a, the matrix appears slightly paler, but more even in colour, with the latter suggesting that the vessels were fired in fully oxidising conditions.
In thin section (Fig. 8m), FG 10b can be seen to differ from FG 10a by having a lower proportion of inclusions, but with the additional presence of rounded, up to fine-gravel-sized, textural concentration features (red in PPL [plane polarised light]), as well as a more calcareous matrix. The samples show lower optical activity to those of FG 10a, indicating a higher firing temperature of between c. 800–1000°C.
Fabric Group 10c is represented by a single sample within the assemblage, and in hand specimen (Fig. 7n) appears coarser than FG 10b and with fewer orange inclusions. The sample has a moderate wall thickness, 7–9 mm, with a pale orange matrix throughout the cross-section.
In thin section (Fig. 8n), FG 10c displays more inclusions than FG 10b, but with fewer textural concentration features, and more inclusions associated with the weathering of granodiorite rock. With regard to firing conditions and temperature, the single sample of FG 10c more closely resembles the samples of FG 10b than of FG 10a.
In terms of elemental composition, FG 10 also shows considerable variation between samples (Table 12). Compared to the other samples of this group, the two FG 10a samples have low CaO, MgO and Ni, while the FG 10b samples have low Na2O, SiO2, and Zr, and high CaO, MgO, K2O, V, Fe2O3, Co, Ni, Zn, and Rb. For most elements, including CaO, the composition of the single sample of FG 10c falls within the ranges of FG 10a and b.
Elemental compositions (oxides in wt% and elements in ppm) of samples assigned to FG 10.

Fabric Group 11 ‘semi-fine-textured buff / pale orange fabric with volcanic rock fragments and chert’ (FG 11)
Sample: PK 107, 127
Date range: MM IIIB
Brief description:
Fabric Group 11 represents a pair of samples with semi-fine-textured, poorly sorted fabrics, displaying in hand specimen (Fig. 7o) common, approximately equant-shaped, inclusions less than c. 1.9 mm in length, grey, white, black, and orange in colour, set within an orange to grey matrix. Both vessels of FG 11 show moderate wall thickness, c. 9–16 mm, and in cross-section show a light orange exterior margin and a grey undifferentiated core/interior margin, suggesting firing within an oxidising atmosphere, but with oxygen to the interior of the vessel restricted.
In thin section (Fig. 8o), the fabric displays c. 40% inclusions, with a bimodal size distribution: the coarse fraction consists of angular, very fine to very coarse sand-sized inclusions of plagioclase feldspar (occasionally zoned), polycrystalline quartz, and less often monocrystalline quartz, radiolarian chert, biotite (laths and columnar), and rarely weathered fragments of intermediate composition volcanic rock, grains of hornblende and clinopyroxene, fine grained schist/phyllite, sandstone, and rare microfossils/shell fragments, as well as very rare grains of epidote; the fine fraction consists of up to silt-sized inclusions of quartz/feldspar and textural concentration features. Both samples display varied optical activity, from high to very low. The firing conditions must have been oxidising with temperatures not exceeding 750–850°C; the increased vitrification towards the interior margin can be explained by the lack of oxygen reaching the vessels’ interior during firing, presumably caused by the closed shape of the vessels and/or their placement within the kiln during firing.
In terms of bulk elemental composition, both samples display low CaO content, but with comparatively high K2O and Rb content (Table 13).
Elemental compositions (oxides in wt% and elements in ppm) of samples PK 107 and 127 assigned to FG 11.

Fabric Group 12 ‘semi-fine-textured pale orange fabric with igneous rock fragments, chert, microcrystalline calcite and microfossils’ (FG 12)
Samples: PK 240, 241, 243, 244
Date range: LM IIIA
Brief description:
Fabric Group 12 represents a small group of samples with semi-fine-textured, moderate to poorly sorted fabrics, which in hand specimen (Fig. 7p) display common, approximately equant-shaped, inclusions, less than c. 2 mm in length, white, grey, and purple in colour, set within a pale orange matrix. The vessels of FG 12 are of moderate wall thickness, c. 5–10 mm, and in cross-section display orange margins with a pale orange to light grey core, suggesting firing in oxidising conditions.
In thin section (Fig. 8p), the fabric displays c. 20–30% inclusions, angular to sub-angular, silt to coarse sand-sized, consisting of monocrystalline and polycrystalline quartz (rarely with micas), plagioclase feldspar, microfossils (mostly foraminifera), microcrystalline calcite, chert, and textural concentration features, rarely biotite mica, very rarely fragments of quartz-feldspar containing igneous rock, in one case with myrmekite texture (granite or granodiorite), as well as highly altered volcanic rock of basic composition (basalt?) and epidote. PK 240 appears coarser than the other samples of the group. The thin sections display varied optical activity ranging from high to very low, suggesting inconsistent firing temperatures.
This is a relatively tight group in terms of elemental composition, with high CaO and elevated Cr, Ni and Sr content (Table 14).
Mean elemental compositions (oxides in wt% and elements in ppm) and rsd in % of FG 12 samples (n = 4).

Fabric Group 13 ‘coarse-textured light orange fabrics with sand temper’ (FG 13; sub-groups 13a–d)
Samples:
-
• FG 13a: PK 26, 102
-
• FG 13b: PK 27, 100
-
• FG 13c: PK 103, 140, 222
-
• FG 13d: PK 30
Date range:
-
• FG 13a: MM IIA–IIIA
-
• FG 13b: MM IIA–IIIA
-
• FG 13c: MM IIIA–LM IB
-
• FG 13d: MM IIA
Brief description:
Fabric Group 13 represents a cluster of coarse to semi-fine textured fabrics displaying rounded to sub-angular inclusions with a strong bimodal size distribution, most probably reflecting the use of similar types of raw materials and similar processing techniques. Although there are significant similarities in the mineralogy of all these fabrics and in their appearance in hand specimen, there are also obvious differences in the composition of the coarse fraction and the type of clay base used. Accordingly, the samples are described by four sub-groups: FG 13a, 13b, 13c, and 13d.
In hand specimen (Figs 7q–t), the samples display common, approximately equant or rarely elongated, inclusions, predominantly less than 2 mm in length or very rarely up to 7 mm, grey, white, and orange in colour, set within an orange, pale orange, or rarely light grey matrix. The samples display moderate wall thickness, 6–14 mm, and in cross-section display an orange or pale orange matrix throughout, or rarely orange margins with a pale orange core (PK 102), or a pale orange exterior margin with a light grey undifferentiated core/interior margin (PK 222).
In thin section, subtle differences between the samples are more apparent:
-
FG 13a (Fig. 8q): silty clay base, rich in carbonate material including foraminifera; inclusions comprise fragments of igneous rocks of basic composition (mostly basalt, at various stages of alteration), siltstone to sandstone, and polycrystalline quartz occasionally strained and with mica. The matrix appears moderately to slightly optically active.
-
FG 13b (Fig. 8r): silty clay base, rich in carbonate material rarely including microfossils; inclusions comprise various types of sedimentary rocks ranging from siltstone to sandstone, polycrystalline quartz including chert, strained polycrystalline quartz with mica (fine-grained schist?), and rare to very rare serpentinite. Matrix appears moderately optically active.
-
FG 13c (Fig. 8s): silty to fine-sandy clay base, poor in carbonate material, and very rare microfossils; inclusions comprise various types of sedimentary rocks ranging from siltstone to sandstone, with few to very rare grains of polycrystalline quartz including chert, and highly altered igneous rocks of basic composition. Matrix appears highly to moderately optically active.
-
FG 13d (Fig. 8t): very fine clay base; inclusions comprise igneous rock fragments of basic composition (mostly basalt), sedimentary rock fragments ranging from siltstone to sandstone, quartz-biotite schist, polycrystalline quartz, serpentinite and epidote-rich rock. Matrix is moderately optically active.
Samples assigned to FG 13 all share elevated Cr, Ni and Co content, but the sub-groups differ in their CaO and Sr content with FG 13a and FG 13b having higher levels than FG 13c and FG 13d (Table 15). In addition, variation can be seen between individual samples, in particular in levels of MgO and V.
Elemental compositions (oxides in wt% and elements in ppm) of samples assigned to FG 13.

Fabric Group 14 ‘semi-fine-textured orange fabric with high chromium and nickel’ (FG 12)
Samples: PK 42, 49
Date range: MM IIA
Brief description:
Fabric Group 14 represents a pair of samples with semi-fine textured, well-sorted fabrics, which in hand specimen (Fig. 7u) display few, equant-shaped, inclusions, less than 3 mm in length, orange, white, and grey in colour, set within an orange to grey matrix. The samples have thin to moderate wall thickness, c. 3–5 mm, and display orange margins with a grey core (PK 42), or an orange matrix evenly throughout the cross-section (PK 49), indicating firing in oxidising conditions.
In thin section (Fig. 8u), the fabrics display c. 10–15% inclusions, rounded to sub-rounded, up to coarse-sand-sized (rarely very-fine-gravel-sized), consisting of predominantly mono- and polycrystalline quartz, textural concentration features, and very rare microcrystalline calcite. The thin sections of both samples display moderate optical activity throughout.
With regard to elemental composition, the samples are generally similar to each other, except for CaO and Sr, which are both substantially higher in PK 42 (Table 16), and together are most readily distinguished from other semi-fine fabrics (e.g. FG 4) by their high Cr and Ni content.
Elemental compositions (oxides in wt% and elements in ppm) of samples PK 42 and PK 49 assigned to FG 14.

Non-grouped sample fabrics
In addition to the 14 fabric groups described above, a further 15 samples could not be grouped with any others within the sample assemblage (Table 17 and Table A1:3 [Supplementary Material]).
Summary of non-grouped fabrics of non-local or uncertain provenance.

Samples: PK 6, 19, 24, 25, 68, 78, 90, 108, 115, 151, 200, 216, 260, 261, 262
Date range: MM IIA–LM IIIA2
DISCUSSION
What is local? Comparing results with the geological samples
The absence of confirmed pottery kilns or kiln wasters associated with the Minoan town precluded the identification of pottery wares and fabric groups known with certainty to have been produced in, or near, the site. However, through comparisons with geological samples it was possible to determine that certain identified archaeological pottery fabrics were compatible with the resources available within the landscape of Palaikastro. Consequently, the term ‘local’ is not necessarily restricted to the immediate vicinity of the archaeological site, but rather refers to the wider geographic distribution of certain geological formations. Nonetheless, the abundance of seemingly suitable raw materials outcropping close to the site and the vast quantities of pottery that were certainly used there make a compelling case to suggest that much of the pottery must have been made in or near the prehistoric settlement of Palaikastro.
From the petrographic and elemental analyses of selected geological samples, a number of groups of sediments could be seen to closely resemble certain archaeological pottery fabric groups. Accordingly, the four most numerous fabric groups represented within the archaeological assemblage, FG 1, 2, 3 and 4, together amounting to 81% of the pottery samples, could be associated entirely, or partially, with a small number of geological formations (and their probable derivatives) that outcrop close to the archaeological site.
Elemental analysis of geological samples
In addition to petrographic analysis, 12 samples of sediments collected during the geological survey and prepared as briquettes were also analysed by WD-XRF (GSPK 8–11, 13, 15–18, 25, 33, 39). In these instances, only the briquettes fired to 900°C were analysed. These samples displayed a broad compositional range but all have low Cr and Ni values, apparently characteristic of clayey sediments from the far east of Crete (Table A1:4 [Supplementary Material]; see also Hein et al. Reference Hein, Day, Quinn and Kilikoglou2004). From the PCA analysis of the elemental data, several geological samples (GSPK 15, 17 and 25) appear to fall into the field of archaeological pottery fabric groups FG 1 and FG 4, while GSPK 10 plots most closely with the pottery attributed to FG 2 (Fig. 9; see also Table 18). All other analysed geological samples plot outside the field of pottery samples, due in most instances to a much higher Ca content than that seen in the archaeological material.
Results of principal component analysis (PCA) performed on all pottery and geological samples analysed, plotting principal component 1 against principal component 2 and showing loadings for variables included in PCA. Shown are pottery samples assigned to the four main fabrics FG 1–4 of presumably local origin, as well as geological samples collected in the environs of the site.

Mean elemental compositions (oxides in wt% and elements in ppm) and rsd in % of FG 1–4 and composition of comparative geological samples.

Fabric Groups 1 and 4
Kastri Formation and associated materials
According to the petrographic analysis, FG 1 and FG 4 were differentiated principally by the additional presence of frequent, large, angular inclusions of phyllite, sandstone, and polycrystalline quartz within the former. However, both groups appeared to share a common base clay, which closely resembled fired briquettes prepared from sediments collected directly from outcrops of the terrestrial Neogene Kastri Formation (GSPK 15, 16, 21, 22, 25), as well as from closely associated recent colluvium (GSPK 24, 26).
Extensive outcrops of the Kastri Formation are visible today close to the archaeological site, including at Roussolakkos itself, but most clearly exposed at Kastri hill (Fig. A1:1 [Supplementary Material]) and in the low cliffs at the neighbouring Bodalaki and Chiona beaches, and through much of the valley running between Palaikastro and Zakros (Fig. 2). These outcrops display numerous strata of varying thickness, texture and composition, but consisting predominantly of layers of deep-red, friable, clay-rich sediments interspersed with sandy or pebbly beds (Gradstein Reference Gradstein1973, 531–4). At its greatest extent the thickness of this formation is estimated at c. 100 m (Gradstein Reference Gradstein1973, 531). Samples were taken from exposed beds at Kastri hill (GSPK 21–23), from Bodalaki (GSPK 25), and from a ridge immediately to the south of the archaeological site (GSPK 15, 16). In thin section, the fired briquettes prepared from the clay-rich sediments displayed a red-brown matrix (in PPL) with few rounded to sub-rounded inclusions of mono- and polycrystalline quartz, phyllite, sandstone, and red/brown argillaceous inclusions, as well as variable amounts of microcrystalline calcite (Fig. 10). With regard to elemental composition, of the three geological sediment samples selected for measurement, GSPK 15 and 25 plot among the low calcareous members of FG 1 and FG 4; however, GSPK 16 contains generally higher CaO and MgO, and lower Cr and Ni, than the archaeological samples and plots some distance from these groups (Fig. 9). The difference seen in the elemental composition between GSPK 16 and the other two geological samples may be due to the natural heterogeneity within the Kastri Formation, reflected also by the distinct layers visible within the outcrops.
Photomicrograph of thin section of 700°C briquette of GSPK 21 (Kastri Formation), cross-polarised light, x25.

Notwithstanding the difficulties presented by the variability within the Kastri Formation, the generally close similarities seen between the geological sediment samples and archaeological pottery samples of FG 4 suggest that such sediments may indeed have been those used, with little or no modification, to produce pottery. The Kastri Formation sediments also appear to be closely related to FG 1, although lacking the coarse, texturally less mature, inclusions of the latter, suggesting that FG 1 and FG 4 may have been made using the same sediments but with additional aplastic inclusions added as temper during the preparation of the former.
The stratified nature of the Kastri Formation deposits may also provide an explanation for the observed differences between fabric sub-groups FG 1a and FG 1b. These two fabric sub-groups are distinguished by the additional presence of microcrystalline calcite inclusions within the latter, and may reflect natural variations in the composition of the strata that form the Kastri Formation. Such subtle differences between strata may have been recognised by the Minoan potters, enabling them to select raw materials deemed suitable for certain types of vessels.
A potential additional, or alternative, source for the base clay of FG 1 and FG 4 may have been deposits of colluvium formed through the erosion of outcrops of the Kastri Formation. Today, such material is found on the seaward side of Kastri hill where debris has accumulated to a height of over 2 m (GSPK 24; Fig. A1:1 [Supplementary Material]), as well as smaller accumulations at the nearby Bodalaki beach (GSPK 26). In the case of the former, the simultaneous weathering of outcrops of the Palaiokastron Formation that form the upper strata of Kastri hill may have contributed an additional calcareous component to the colluvium. Nonetheless, despite this mixing of the two formations, when examined in thin section the Kastri hill colluvial sediments could not be readily differentiated from the more calcareous-rich strata occurring within the Kastri Formation.
Such naturally occurring deposits of unconsolidated clay-rich material may have been more easily worked by Minoan potters than the beds of the Kastri Formation itself, and therefore may have represented an attractive source of raw materials. Conversely, however, the mixed nature of the colluvial deposits would not have enabled potters to select raw material from layers with different compositions, as may have been practised with regard to FG 1a and FG 1b. Alternatively, some combination of sources may have been used, with the colluvium used for FG 1b and more carefully selected strata quarried for FG 1a.
In conclusion, based on the combined evidence of the petrographic and elemental analyses, the Kastri Formation (and associated colluvial deposits) appears to offer a potential source of raw materials for pottery of FG 4 and the base clay of FG 1. Regarding their composition, there is little to differentiate the clay-rich sediments selected directly from the exposed outcrops with those from the loose colluvium, and either, or both, of these potential sources may have been used by the potters of Palaikastro. However, the more stratified nature of the Kastri Formation, offering greater opportunities for discrimination between individual deposits, may have enabled the Minoan potters to select raw materials more suited to certain types of vessels. The colluvium, by contrast, whilst seemingly more homogenous in composition and appearance than the Kastri Formation, may have been easier to exploit owing to its less consolidated form and ease of access. It is also possible that both sources were used at different times, or simultaneously, by different potters or to meet different needs.
Upper phyllites of the Permian–Triassic metamorphic series of Sitia
The frequent, coarse, angular inclusions of phyllite, polycrystalline quartz and sandstone that differentiate FG 1 from FG 4 appear to have been added as a deliberate temper to clay-rich sediments collected from the Kastri Formation. The most likely geological source of these inclusions is the Triassic Upper Phyllites of the metamorphic series of Sitia, which in addition to phyllite is described as also containing intercalations of sandstone, conglomerate, limestone and marble (Papastamatiou et al. Reference Papastamatiou, Vetoulis, Bornovas, Christodoulou and Tataris1959). Within the Palaikastro region, outcrops of this series are visible today extending south-east from the modern village of Palaikastro towards Plakalona, and north from Cape Tenda towards Vai. Additional outcrops occur north-west of Lidhia, c. 2 km west of Palaikastro village, as well as north from Toplou Monastery along the west of the peninsular (Fig. 3).
Each of these outcrops exhibits signs of erosion and the formation of localised deposits of angular, often elongated, gravel rock fragments, varying in colour from grey to pink and maroon, and more rarely buff to orange, and very rarely green. The outcrops at Cape Tenda and in the region of Toplou Monastery also appear to be eroded by the passage of adjacent, small, seasonal rivers, resulting in the transport of sand and gravel derived from these, and other, outcrops towards the bay of Maridhati, while other contiguous regions of these outcrops are cut by numerous other small seasonal streams running to the east or west coast of the peninsular. Similarly, the outcrops in the vicinity of Palaikastro and Lidhia appear to be eroded by the seasonal Kalogero River and its tributaries, which ultimately disgorge into Kouremenos Bay. In the region of Plakalona, the eroding outcrops are cut by the upper reaches of the Katsara Gorge running south-east towards Schinias.
Numerous samples of rock and colluvium from the Upper Phyllite series, as well as associated sediments and gravel from adjacent river channels and beaches, were collected from near Palaikastro (GSPK 6, 29–34, 37, 39–76, 112–130), Cape Tenda (GSPK 95–105), Toplou Monastery (GSPK 110), and Lidhia (GSPK 77–92). From visual examination of hand specimens and petrographic analysis of selected samples, a range of rock types were observed, including not only phyllite, sandstone, and quartzite, but also limestone and very rare rounded green pebbles (altered igneous rocks?); these latter materials probably derive from the adjacent conglomerate formation. Taken as a whole, all of the outcrops of the Upper Phyllites series sampled closely resembled each other in physical appearance and composition, and could not be readily differentiated from each other. Nonetheless, the similarities between the geological samples and the temper seen in pottery fabric group FG 1 appear to confirm the Upper Phyllites series as the ultimate geological source of the temper. This series also appears to have been the source of the natural, smaller and more mature, inclusions found in the Kastri Formation sediments, as well as FG 1 and FG 4.
Although it was not possible to identify a precise geographic origin for the temper in FG 1, localised scree deposits found adjacent to eroding outcrops of the Upper Phyllites series may have presented a convenient source of naturally aggregated material suitable for use as a pottery temper. This may have been used directly or, more probably, after some additional crushing and/or sieving. The scree deposits closest to the Roussolakkos site today are located immediately south of Palaikastro and at Cape Tenda, both c. 2 km from the archaeological site, and therefore also in close proximity to the potential sources of clay used for FG 1. However, a further potential source for the tempering material, located closer to the Roussolakkos site, may have been the coarse sands and gravels that form the bed of the seasonal Kalogero River (GSPK 6). In its lower reaches this river today cuts through the Palaikastro outcrop of the Upper Phyllites series, from which it transports debris towards Kouremenos Bay. Accordingly, such sands and gravel may perhaps have been selected in preference to other types of temper, largely for their convenience and close proximity to both potential clay sources as well as any putative workshops near the Minoan town.
Fabric Group 2
Palaiokastron Formation and associated formations
Pottery Fabric Group 2 represented a group of fine textured calcareous fabrics. However, within the Palaikastro region today, visible sources of calcareous clay-rich sediments suitable for making pottery are comparatively scarce and seemingly confined to outcrops of the marine Neogene Palaiokastron Formation and potential associated formations.
The type section of the Palaiokastron Formation is located in the upper layers of Kastri hill, overlying the Kastri Formation, and consists of strata of coral limestone merging with calcareous yellow fossiliferous marls, locally extending to a total thickness of c. 9 m (Gradstein Reference Gradstein1973, 539–41). Further outcrops attributed to this formation are scattered across the far east of Crete, from Cape Mavros to Zakros, often exhibiting local variations in composition, including the additional presence of grey marls, sand, breccias and conglomerates, and reaching a maximum thickness of c. 40 m (Gradstein Reference Gradstein1973). Within the study region, in addition to the Kastri hill outcrop, exposures of varying extents and thicknesses may be seen at Chiromandhres (c. 1 km north of Palaikastro village; GSPK 108, 109), between Plakalona and Schinias (GSPK 33, 38), and at Cape Plaka near the Minoan stone quarry at Ta Skaria (c. 2 km east of Roussolakkos; GSPK 8–14).
As with the type section, the outcrops at Chiromandhres and Plakalona/Schinias appear as eroding strata of limestone, with seemingly comparatively small intercalations of sandy or marly yellow sediments. These outcrops appear today to offer limited potential as sources of clay-rich sediments suitable for pottery manufacture on a large scale. At Cape Plaka, however, the formation appears more substantial, consisting of beds of limestones, sands, and fossiliferous marls, of a combined thickness of c. 18 m (Fig. A1:2 [Supplementary Material]). The upper strata, cut by the coastal track, display limestones and silty yellow to light brown sediments (GSPK 8–10) that in places may have become mixed with more red-coloured soils eroding from nearby slopes. Beneath these are seen thick beds of buff-yellow marl (GSPK 11) overlying grey marl (GSPK 12, 13). According to Gradstein (Reference Gradstein1973, 540), these grey fossiliferous marls appear very similar to those of the Miocene Achladhia Formation. This latter formation, otherwise identified further west, close to Sitia, consists of beds of grey or bluish-grey fossiliferous marls, commonly containing foraminifera, of up to c. 80 m in thickness (Gradstein Reference Gradstein1973, 550–3).
Some indication that at least some of the deposits of clay-rich sediments found in the Palaiokastron/Achladhia(?) Formations at Cape Plaka may be suitable for use in pottery is provided by the fired briquettes prepared from GSPK 8–13 and 33. All of the samples tested withstood firing at 700°C, and most also withstood firing at 900 and 1050°C. Of the samples that did not remain intact during firing, GSPK 11 showed cracking at 900°C, while GSPK33 disintegrated entirely at 900°C and showed cracking at 1050°C.
From the petrographic analysis of fired briquettes, the yellow to light brown upper sediments (GSPK 8–10), together with the buff (GSPK 11) and grey marls (GSPK 12, 13) sampled from Cape Plaka, are all fine-textured sediments containing frequent silt-sized inclusions of microcrystalline calcite, common monocrystalline quartz/feldspar and red-brown clay pellets, and rare microfossils, set within a buff to pale orange matrix. As such, therefore, these sediments appear to closely resemble the fabrics of pottery fabric group FG 2. If these outcrops did provide raw materials for FG 2, the rare additional presence of small rounded phyllite and sandstone/polycrystalline quartz inclusions observed in some samples of this pottery fabric group may have originated from a small adjacent outcrop of the Kastri Formation (Fig. 2).
However, due to the fine texture of the fabrics concerned, petrographic analysis may not be able to distinguish differences between ostensibly similar samples. This difficulty is highlighted by the PCA analysis of the elemental compositional data, according to which only one sample, GSPK 10, from the upper strata, plots within the range of the pottery samples of FG 2, whereas GSPK 8, 13, 9 and 11 respectively plot at increasingly greater distances, mainly due to much higher CaO levels (Fig. 9, Table 1 and Table A1:4 [Supplementary Material]). While this may appear to confirm that at least certain strata of the Palaiokastron Formation have a composition consistent with that of FG 2, the apparent degree of geochemical variability within this formation also urges some caution regarding the interpretation of these results. This difficulty is emphasised further with the addition of GSPK 33, another sample attributed to the Palaiokastron Formation but from a separate outcrop located near Schinias, which shows even further separation from the other samples of this formation. Nonetheless, the high degree of elemental variability seen within the outcrops at Cape Plaka does not necessarily preclude the use of these sediments, or similar outcrops of the Palaiokastron and/or Achladhia Formations, for pottery production, as CaO content in particular can vary greatly between strata and may also be affected by raw material processing strategies.
The PCA results of the Cape Plaka and Schinias geological samples also illustrate potential difficulties in differentiating sediments from the Palaiokastron and Achladhia Formations, as GSPK 13 (which, based on its appearance in the field, may belong to the Achladhia Formation) plots close to samples more clearly attributed to the Palaiokastron Formation (GSPK 8–11 and 33). Such potential difficulty in differentiating between clay-rich sediments from these formations may further complicate the identification of pottery imported to, and exported from, Palaikastro, as outcrops of the Achladhia Formation are also found in the vicinity of other Minoan sites, such as Petras. However, analysis of further, more confidently identified, outcrops of the Achladhia Formation, especially those to the south and west of Sitia Bay, are still required.
Notwithstanding these difficulties, there are some grounds for suggesting that the pottery of FG 2 may have been produced using clay-rich calcareous sediments obtained from outcrops of the Palaiokastron Formation (and possibly the Achladhia Formation) found within the Palaikastro region. In addition to the composition and physical properties of clays from individual sources, the absolute volume of clay available within each deposit may also have been an important factor in determining not only which specific outcrops were exploited, but also the scale of production, as well as its ultimate longevity. Here again, therefore, the thick beds of marl at Cape Plaka may have represented a more attractive source of raw materials than the comparatively small deposits interspersed among layers of limestone seen at other outcrops of the Palaiokastron Formation. It is also possible that a range of sources were used, with perhaps those located closer to the town first utilised, and exhausted, before attention shifted to other, more distance sources, such as at Cape Plaka.
The Cape Plaka region also appears to have represented an important local source of building stone during the Bronze Age, as witnessed by the quarries at Ta Skaria, adjacent to the exposures of marl beds visible today (MacGillivray et al. Reference MacGillivray, Sackett, Smyth, Driessen, Lyness, Hobbs and Peatfield1984, 143–9; Papageorgakis, Mourtzas and Orfanoudaki Reference Papageorgakis, Mourtzas, Orfanoudaki, Waelkens, Herz and Moens1992). The presence of quarries at this site not only increases the likelihood that the nearby clay deposits may also have been known at this time, but also that there may have been a synergy between the extraction of stone and clay. In this regard a range of potential areas of cooperation might be imagined, including the utilisation of a common workforce, or shared means of transport for both stone and clay. However, contrary to such a hypothesis, Papageorgakis, Mourtzas and Orfanoudaki (Reference Papageorgakis, Mourtzas, Orfanoudaki, Waelkens, Herz and Moens1992, 22) note that pottery found within the quarries may be dated to MM III/LM I. If this age range is indicative of the entire period of Minoan exploitation of the site, then the stone quarries would appear to post-date the production of pottery of FG 2.
Fabric Group 3
Natural or artificial mixing of the Kastri and Palaiokastron Formation, and the Toplou Formation (?)
From both the petrographic and elemental analysis, as well as its appearance in hand specimen, FG 3 appears similar to FG 2, but is distinguished by its more reddish colour and grittier texture resulting from the greater abundance of aplastic inclusions. From the elemental analysis, FG 3 shows similar mean levels of CaO to FG 2 but over a wider range (FG 2: μ=7.32 %, σ=1.17; FG 3: μ=6.35%, σ=2.31). Accordingly, in the PCA analysis of the elemental data the two groups overlap, but with the FG 3 samples showing a greater dispersion. In addition to similarities with FG 2, FG 3 also shares features with FG 4, with both fabric groups sharing similar types of aplastic inclusions.
Based on its appearance in thin sections, and similarities to other fabrics, FG 3 may potentially represent an intentional or accidental mixing of clay-rich sediments derived from the Palaiokastron and Kastri Formations. If these formations were indeed, separately, the sources of raw materials for FG 1/FG 4 and FG 2, respectively, then the possibility of the deliberate mixing of sediments to produce FG 3 may appear more plausible. Additionally, as noted above, outcrops of both formations occur at the same locations within the Palaikastro region, specifically at Chiromandhres, Kastri hill, and Cape Plaka (Gradstein Reference Gradstein1973, fig. 19), giving rise to the possibility of some degree of natural mixing of the sediments as the outcrops erode.
An alternative potential source of the raw material for FG 3 may have been the clay-rich beds found within the Toplou Formation (Gradstein Reference Gradstein1973, 535–9). Outcrops of this Miocene formation are found to the west and north of the village of Palaikastro, and consist of stratified beds of conglomerates, sands, silts, clays and limestones, of a total thickness of up to c. 200 m, and appear to have been deposited at broadly the same time as the Kastri Formation formed further east (Gradstein Reference Gradstein1973, 535–9). However, no distinct boundary is present between the Toplou and Kastri Formations, but rather they appear to gradually merge with each other across a broad transition zone of c. 2 km west of Palaikastro village, with the deep-red-coloured sediments of the Kastri Formation becoming increasing paler and more yellow across this zone (Gradstein Reference Gradstein1973, 537).
Two geological samples, GSPK 17 and 18, were collected from within this transitional zone, from deep cuttings formed by the Sitia–Palaikastro road, 5 and 4 km west of the Roussolakkos site respectively. Both samples consisted of clay-rich sediments, with GSPK 17 a pale buff colour and GSPK 18 pale pink/brown (Fig. A1:3, dried at 100°C [Supplementary Material]). Both sediments withstood firing at incremental temperatures to 1050°C, with the fired briquettes displaying shades of pale pink and pale orange similar to those seen in the pottery samples of FG 3. In elemental analyses, GSPK 17 displayed CaO content of 4.59%, and in the PCA analysis plotted within the range of FG 3. GSPK 18 displayed very high levels of CaO (17.41%) and plotted outside of the elemental compositional range of FG 3. In thin section, the samples displayed fine-textured calcareous fabrics, but with comparatively few inclusions of the types that might have been expected from the Kastri Formation as it merged with the Toplou Formation. Accordingly, while the elemental analysis of GSPK 17 suggests a possible link with FG 3, the petrographic analysis does not show the types of inclusions typically found with this fabric group. However, the geological sampling of this formation was very limited, in both the number of samples obtained from each location and the number of locations sampled, and as with other formations in the region, the Toplou Formation displays considerable internal variation. Following Gradstein’s observations, it is probable that outcrops located further east, closer and more accessible to the archaeological site, might display a greater proportion of inclusions of the types present in both the Kastri Formation sediments and FG 3. As noted above with regard to FG 2, sources of calcareous sediments suitable for making pottery appear to be comparatively limited within the Palaikastro region, and therefore the calcium-rich matrix seen in FG 3, if manufactured within the Palaikastro region at all, must seemingly have been derived from some particularly clay-rich deposits within either the Toplou or Palaiokastron (/Achladhia[?]) Formations.
Minor fabric groups and non-grouped fabrics
Pottery fabric groups FG 5 to 14, together with the 15 non-grouped sample fabrics, constitute 19% of the entire archaeological sample assemblage, with most of the (sub-)fabric groups each represented in the assemblage by fewer than three samples. On the basis of frequency alone it may be argued that such comparatively poorly attested fabric groups must represent either exceptional examples of experimentation in pottery recipes at Palaikastro, or else are the product of workshops based in other regions. The comparatively large number of sherds sampled in the present study, together with the considerably larger number of sherds strewed and examined by eye during the selection process, reduce the likelihood that the small population size of these minor fabric groups is the result of sampling biases. For many of the samples attributed to these fabric groups, a non-local origin is also suggested by the forms of vessels themselves, and/or styles of decoration or technological traits. However, for other samples, the surviving sherds are often too small, or too generic in shape and decoration, to provide corroborative evidence as to their origins.
In some instances, although a close parallel with local geological samples could not be found, the possibility of a local origin for minor fabric groups or loners cannot be excluded altogether. In the case of pottery fabric groups FG 5 and 6, the fabrics either are too fine or lack distinctive types of inclusions to enable firm parallels with geological samples to be identified through petrographic analysis. With regard to elemental composition, FG 5 and 6 both display low levels of Cr and Ni, suggestive of an east Cretan origin (Hein et al. Reference Hein, Day, Quinn and Kilikoglou2004) and plot close to FG 1–4 in the PCA analysis (Fig. 11). A local origin is also possible, based on the style of the sherds, although this may also reflect somewhat wider regional patterns.
Results of principal component analysis performed on all pottery and geological samples analysed, plotting principal component 1 against principal component 2, and showing loadings for variables included in PCA. Highlighted and shown in colour are pottery samples assigned to the minor fabric groups FG 5–14, while samples assigned to FG 1–4 are in grey.

For FG 7, the aplastic inclusions of phyllite and sandstone, as well as microfossils, resemble those seen in various combinations in FG 1 to 4. However, the two samples of FG 7 contain noticeably higher levels of Cr and Ni, and do not plot close to the main fabric groups, suggesting that they may not have originated from eastern Crete. Nonetheless, stylistically, as far as may be discerned from the few sherds available, FG 7 resembles forms seen in the main fabrics. Considered together, therefore, the samples of FG 5, 6 and 7 all display some similarities, primarily stylistic, with the main fabric groups found at Palaikastro. Such similarities suggest the existence of additional workshops to those that supplied the bulk of pottery to the site, perhaps located within east Crete (or beyond, in the case of FG 7), and working within a similar stylistic repertoire.
Pottery fabric group FG 8 is distinguished by the presence of coarse inclusions of purple siltstone. No geological samples were found in the Palaikastro region to match this material, but fabrics of similar appearance in hand specimen were seen in the Sitia Museum among pithoi from Zakros. In addition, a similar fabric seen in samples at Petras, but identified as originating from Zakros, has also been described by Nodarou (Reference Nodarou and Tsipopoulou2021, 135). In the PCA analysis of the elemental data, some samples of this fabric group plot close to samples of FG 1 and 4, suggesting a possible overlap in the origins of these fabrics. In this regard, it may be noted that large deposits of the Kastri Formation are also found close to Zakros, within the valley running between Palaikastro and Zakros (Gradstein Reference Gradstein1973, 532–3). However, the potential source of the purple siltstone was not identified in the geological sampling conducted in this study, but has previously been reported as occurring the Zakros region (Nodarou Reference Nodarou and Tsipopoulou2021, 135). From a stylistic perspective, in general, many of the same types of pottery are found at both Palaikastro and Zakros, and among the samples of FG 8, all are consistent with forms found at both sites. Of these, the strongest stylistic connection to Zakros is shown by sample PK 105, from a pithos with dark-on-light decoration and added white paint, which represents a type more commonly found at Zakros, although examples are also found at Palaikastro.
Pottery fabric groups FG 9 and 13 plot close to each other in the PCA analysis, which, together with their appearance in thin section, suggests that they may represent fine- and coarse-textured fabrics derived from a common source. While no parallels for either fabric groups were found during the geological prospection undertaken in this study, both contain high levels of Cr and Ni, suggesting an origin from outside east Crete (Hein et al. Reference Hein, Day, Quinn and Kilikoglou2004). More specifically, however, FG 13, with its large, rounded inclusions of mixed rock types, resembles the calcareous, coarse sand-tempered fabrics of the ‘South Coast’ tradition (Whitelaw et al. Reference Whitelaw, Day, Kiriatzi, Kilikoglou, Wilson, Laffineur and Betancourt1997, Nodarou Reference Nodarou, Oddo and Chalikias2022) and western Mesara Plain (Shaw et al. Reference Shaw, Van de Moortel, Day and Kilikoglou2001; Belfiore et al. Reference Belfiore, Day, Hein, Kilikoglou, Rosa, Mazzoleni and Pezzino2007; Day, Relaki and Faber Reference Day, Relaki, Faber, Wiener, Warner, Polonsky and Hayes2006; Day et al. Reference Day, Quinn, Rutter and Kilikoglou2011; Nodarou Reference Nodarou, Karetsou and Girella2015). While both of these fabric traditions are found along the south coast of central and eastern Crete, other calcareous, sand-tempered fabrics also appear to have been produced elsewhere on the island, including north-east Crete (Liard Reference Liard2018). The differences seen within FG 13 (attested by four fabric sub-groups) also accord well with the variability described in the southern Cretan fabrics, resulting from the mineralogical heterogeneity of the flysch deposits of the region (Whitelaw et al. Reference Whitelaw, Day, Kiriatzi, Kilikoglou, Wilson, Laffineur and Betancourt1997; Shaw et al. Reference Shaw, Van de Moortel, Day and Kilikoglou2001; Nodarou Reference Nodarou, Karetsou and Girella2015; Reference Nodarou, Oddo and Chalikias2022). The eight samples attributed to FG 13 all represent large vessels (five amphorae, two bridge-spouted jars, and a beaked jug). Of these, PK 26, from its relatively narrow base (6.5 cm diameter) and the rounded lower body with dark bands, closely resembles amphorae from the Mesara. Similarly, PK 100 also resembles Mesaran amphorae through its relatively short neck and slightly flattened (rather than completely round) handle with dark paint and white piping. For PK 27, although the shape of the surviving sherd is not diagnostic beyond indicating a bridge-spouted jar, the use of a coarser-textured fabric for the spout is a technological trait typical of vessels produced in the Mesara.
Based on the apparent similarities in elemental composition between FG 13 and FG 9, the latter fabric group may represent the untempered base clay used in FG 13, and therefore by extension may potentially correspond to a fine, calcareous, fabric variant of the potting traditions of central and eastern southern Crete. However, against such a potential identification, it should be noted that, unlike the calcareous ‘South Coast’ fabrics, microfossils were not observed in the thin sections of the six samples assigned to FG 9.
Fabric Group 10 was recognised in hand specimen, from the distinctive black-and-white inclusions, as corresponding to the granodiorite tempered fabrics from the Mirabello region (Betancourt Reference Betancourt1984; Haggis and Mook Reference Haggis and Mook1993; Day Reference Day, Tsipopoulou and Vagnetti1995; Nodarou and Moody Reference Nodarou, Moody, Molloy and Duckworth2014). The petrographic analysis confirms this non-local identification, with FG 10a corresponding to the low-calcareous ‘Mirabello red’ fabric, while FG 10b and 10c closely resemble the ‘calcareous Mirabello’ fabric variant (Day Reference Day, Tsipopoulou and Vagnetti1995, 159–61). In the PCA analysis of the elemental composition, the samples of this group do not cluster tightly, and overlap to some extent with the samples of FG 9 and 13 but only marginally with FG 1b. Some of this variability may be due to the comparatively coarse texture of the fabrics and the small number of samples analysed. From the perspective of style, the sherds are not sufficiently distinctive to suggest likely places of origin, although they do not appear to resemble forms local to Palaikastro. Nonetheless, in terms of use, the samples from Palaikastro agree with the reported characteristic features of the ‘Mirabello’ fabrics (Day Reference Day, Tsipopoulou and Vagnetti1995; Whitelaw et al. Reference Whitelaw, Day, Kiriatzi, Kilikoglou, Wilson, Laffineur and Betancourt1997), with the two samples of FG 10a representing low-fired cooking pots, while the three samples of FG 10b and 10c are high-fired.
Fabric Group 11 features inclusions derived from volcanic rocks of intermediate composition, which with the exception of small intrusions of andesite at Aghios Ioanis (Vai) are not seen in the wider geological landscape of the Palaikastro region (Papastamatiou et al. Reference Papastamatiou, Vetoulis, Bornovas, Christodoulou and Tataris1959) or of Crete overall. Accordingly, it seems probable that this fabric is not local, and most probably originated from outside of Crete altogether. In the PCA analysis of the elemental data, the two samples of FG 11 plot close to each other and at the margins of the FG 1 and 4 clusters; nonetheless, despite such proximity, they may be differentiated by the higher levels of Cr, Ni, Zn, Rb, Sr and Ba in FG 11, as well as by the presence of coarse volcanic rock fragments seen in thin sections. The two samples of FG 11 are both dated to MM IIIB and belong to small, but thick-walled, vessels with conical profiles, tentatively identified as unguent jars. Such vessels are unusual at Palaikastro but resemble vessels from the North Lustral Basin at Knossos suggested to have originated from volcanic areas within the Dodecanese (Knappett, Macdonald and Mathioudaki Reference Knappett, Macdonald and Mathioudaki2023). Fabrics of broadly similar composition and attributed to the south-east Aegean (especially Kos) have also recently been described by Morrison, Nodarou and Cutler (Reference Morrison, Nodarou, Cutler, Murphy and Morrison2022), and as ‘Petrographic Fabric 2’ in Hilditch and Krijnen (Reference Hilditch, Krijnen and Nikolakopoulou2022).
The four samples of FG 12 contain inclusions mostly originating from igneous rocks of acid or intermediate composition (granite/granodiorite). They are characterised by high levels of Cr and Ni, and also plot close to each other in the PCA results, but at a greater distance from the main ‘local’ fabrics. Therefore, both the mineralogical and elemental composition of FG 12 appears to support a non-local provenance. The four samples of this fabric group are simple conical cups, and therefore difficult to assign an origin on stylistic criteria alone, but are all dated to LM IIIA. Accordingly, in both their composition and appearance, they appear to represent a coherent group, of non-local origin, although their exact provenance remains undetermined. This fabric appears to correspond to fabric ‘PK1’ described by Doherty (Reference Doherty, MacGillivray, Sackett and Driessen2007) from a single LM IIIA2 conical cup, and identified as probably originating from outside Crete.
The two samples of FG 14, both dated to MM IIA but representing different types of cups, closely resemble forms typically seen at Palaikastro, and macroscopically and in thin section this fabric group is difficult to distinguish from the predominant cup fabric, FG 4. The types of inclusions, and their relatively small size, which characterise FG 14, are non-diagnostic of its origin; but although the mineralogy of this fabric group is not incompatible with the local geology of Palaikastro, it lacks the rare phyllite inclusions seen in FG 4, and appears to be derived from a more mature sediment to that used in FG 4. However, with regard to elemental composition, although the two samples of FG 14 show some difference in Ca and Sr levels, they both show high levels of Cr and Ni, in marked contrast to the low levels seen in FG 4. While a possible local origin for these samples cannot be ruled out altogether, high Cr and Ni levels seem to be more commonly observed in sediments outside of east Crete (Hein et al. Reference Hein, Day, Quinn and Kilikoglou2004), whereas analysed sediments from within east Crete (including the geological samples examined in the present study) have low values. Assuming that a non-local origin is accepted for FG 14 on the basis of its elemental composition, these samples highlight the potential difficulty of otherwise recognising certain types of imported wares, particularly when they occur as vessels with relatively simple shapes in fine or semi-fine textured fabrics.
Variations in the use of fabric groups according to time and intended function
Through the large number of samples analysed in the present study, some information may be gained regarding how the prevalence and intended use of pottery fabrics varied over time. Such changes not only reflect changes in local pottery fashions, but may also reveal something of the responses of the potters and community of Palaikastro to the varied external political, social, economic, technological and cultural changes that punctuate the history of Crete during the Bronze Age.
Fabric Group 1
Fabric Group 1 accounts for 33% of the archaeological sample assemblage and, based on macroscopic observations of its distinctive phyllite inclusions, appears to represent the main coarse ware fabric at Palaikastro. Collectively, FG 1 is present in all of the periods sampled; however, variations in the use and occurrence of the sub-groups within the sample assemblage can be discerned through time, seemingly indicating changes in the production strategies and preferences of the Minoan potters.
When viewed as a whole, FG 1 is found in a wide variety of forms, commonly including medium- to large-sized vessels such as jugs and jars, cooking pots and baking plates, amphorae and pithoi, but also comparatively rarely in smaller forms such as cups and bowls. Accordingly, FG 1 appears to represent a versatile fabric, suitable for vessels of diverse sizes, shapes, and functions (Fig. 12a). Such seemingly relaxed attitudes towards the use of FG 1 are further exemplified by the variety of fabric sub-groups found with vessels associated with the pouring of liquids (i.e. jugs and jars), where all sub-groups of FG 1 are attested. A similar impression is also provided by the fabrics chosen for storage vessels (pithoi and amphorae) and bowls, where despite the obvious differences in size and function, and presumably also regarding forming techniques and firing, both of the coarse-textured-fabric sub-groups, FG 1a and 1b, were used.
Relative frequencies of archaeological samples, according to fabric group, date, function, decoration and firing.

However, the reverse situation is also seen, with certain consistent associations suggesting, at times, a more intentional matching of fabric with form and function. Such selective choices appear most apparent at Palaikastro with regard to vessels associated with cooking functions (i.e. cooking pots and baking plates). Of the 23 cooking vessels within the sample assemblage, 20 are made with the low-calcareous-fabric sub-group FG 1a, with the remaining vessels seemingly of non-local origin (two of FG 10a, and one with a fabric rich in quartz-mica schist inclusions; see Table A1:1 [Supplementary Material]). The preference for low-calcareous fabrics, or more specifically for red-firing non/low calcareous clay matrices, for cooking vessels is mirrored elsewhere and seems to characterise most of the regional Cretan traditions throughout the Bronze Age (e.g. Day Reference Day, Tsipopoulou and Vagnetti1995; Whitelaw et al. Reference Whitelaw, Day, Kiriatzi, Kilikoglou, Wilson, Laffineur and Betancourt1997; Wilson and Day Reference Wilson and Day1999; Belfiore et al. Reference Belfiore, Day, Hein, Kilikoglou, Rosa, Mazzoleni and Pezzino2007; Mentesana et al. Reference Mentesana, Day, Kilikoglou and Todaro2016; Liard Reference Liard2019). At Palaikastro, however, in addition to the use of a low calcareous clay, there also appears to have been a deliberate choice to avoid calcareous inclusions within the fabric. By contrast, for vessels not associated with cooking (e.g. pithoi and amphorae), the closely related FG 1b, containing large microcrystalline calcite inclusions, was deemed suitable. This apparent avoidance of calcareous inclusions in cooking vessels at Palaikastro is interesting, especially as elsewhere, by contrast, cooking pots with low calcareous base clays are recorded as containing calcareous inclusions (e.g. cooking pots of the coarse variant of ‘Fabric 1’ found at Malia and Sissi [Liard Reference Liard2019]). While such inclusions may have been avoided in order to reduce the risk of vessels being damaged by lime spalling during firing, it is unclear why such precautions would be applied more stringently to cooking vessels than other types. Similarly, as most cooking vessels were also low fired, there would appear to have been little risk that lime spalling would have occurred. Instead, therefore, this practice may represent an idiosyncratic behaviour of potters at Palaikastro, perhaps reflecting perceived requirements associated with cooking activities, as opposed to risks associated with the firing of vessels.
Despite the association between FG 1a and cooking vessels, FG 1a should not be regarded exclusively as a ‘cooking vessel fabric’, as it was also used, to varying extents, for every other functional category of vessels. Indeed, with the exception of cooking functions, the uses of FG 1a and 1b appear to have been the same, suggesting that in many roles these two coarsely tempered fabric sub-groups were interchangeable. In this regard, the use of such red-firing fabrics for large vessels beside cooking pots (e.g. pithoi and amphorae) at Palaikastro differs noticeably from that of other sites on the island, where such vessels are generally made with a calcareous, buff-firing fabric.
A further example of an apparent intentional link between fabric and function is found with FG 1c. Although never especially common within the sample assemblage, this variant of FG 1 appears to have been used primarily for cups,Footnote 5 although unlike cooking vessels, cups were also more commonly made using other fabrics (see further discussion according to function below).
The overall picture that emerges, therefore, regarding the functional uses of FG 1 and its sub-groups, appears to be one of relaxed pragmatism coupled with certain definite prescribed roles. Accordingly, despite the ostensive similarities between the various phyllite-tempered sub-groups of FG 1, the Minoan potters were able to discern differences in the composition of raw materials and able to prepare fabrics deemed suitable for the manufacture, and intended function, of specific vessel types. However, where the choice of fabric was not dictated by certain perceived necessities, they were able to exercise greater freedom over the use of the sub-groups of FG 1.
Further patterns of variation in the use of FG 1 and its sub-groups are also seen when examined from a diachronic perspective. While FG 1 as a whole is present across all periods within the sample assemblage, differences are seen over time in the relative proportions of its sub-groups. Fig. 12b shows the relative temporal distribution of the sub-groups of FG 1, considering all types of vessels together. The abundance of each fabric sub-group is expressed as a percentage of the total number of samples of FG 1 within the sample assemblage in each chronological phase. From this chart it can be seen that during the Protopalatial period samples of FG 1a and 1b occur with approximately equal frequency, but thereafter FG 1a appears as the dominant variant and FG 1b is rarely seen. FG 1c is never especially common, and appears to be restricted to the Neopalatial period within the sampled assemblage.
With regard to the use of the sub-groups of FG 1, the transition between the end of the Protopalatial and the beginning of the Neopalatial periods appears to represent a significant moment of change, seeing both the emergence of the low-calcareous FG 1a as the dominant coarse-textured fabric in the sample assemblage, as well as the apparent introduction of the finer textured phyllite-tempered variant, FG 1c. The subsequent transition between the Neopalatial and Final Palatial periods does not appear to witness as abrupt a change, with FG 1a continuing as the predominant fabric sub-group, but FG 1c disappearing altogether.
As far as it is possible to discern from the sample assemblage analysed in the present study, the apparent decline in the use of FG 1b after the Protopalatial period in favour of FG 1a appears to reflect the adoption of a more standardised practice of production, and a more selective use of raw materials. This may have been linked to attempts, together with improved firing (see below), to reduce incidences of spalling during firing through the selection of fabrics low in calcareous inclusions. Such reductions in calcareous inclusions might have been achieved by more selective procurement strategies, for instance by focusing on the quarrying of beds of clay-rich sediment visibly lacking these inclusions.
In a similar manner, the deliberate use of the more finely textured FG 1c for thin-walled cups again appears to indicate the exercising of a greater level of control in the selection and preparation of raw materials, as well as greater discretion in how prepared fabrics were utilised for specific purposes after the Protopalatial period. However, unlike FG 1a in particular, which remained the dominant fabric for larger utilitarian vessels throughout the Neopalatial period, FG 1c appears only ever to have represented a minor component of all Neopalatial cup fabrics (see discussion below). As such, it may represent something of an experimental fabric, or else perhaps was rejected in favour of fabrics that required less effort to prepare (e.g. FG 4).
In addition to subtle changes in the use and composition of fabrics, apparent changes within the sample assemblage can also be seen over time in the firing of FG 1. An indication of the relative firing temperature can be gleaned from the optical activity of the matrix of pottery samples when viewed in thin section, where the level of optical activity is inversely proportional to firing temperature. During the Protopalatial period, FG 1 displays considerable variation in the levels of optical activity, with 56% of the sample assemblage displaying moderate or low activity and 44% high activity (Fig. 12c), indicating a corresponding variability in firing temperatures. In general, such variability does not appear to correspond strongly to function, except for cooking vessels, which all appear optically active, which suggests that in most other instances firing may not have been closely controlled. In this regard, the level of vitrification of the matrix achieved during firing is more difficult to control for low/non-calcareous fabrics, such as FG 1, than for calcareous fabrics (Maniatis and Tite Reference Maniatis and Tite1981). Alternatively, the variability may indicate that multiple practices/technologies for firing (e.g. different types of kilns or fuels) were used during this period.
During the following Neopalatial period, however, 87% of samples display high optical activity, suggesting a change in pottery firing practices and/or technology after the Protopalatial period, resulting in more consistent firings at a lower temperature and a reduction in the proportion of vessels fired (presumably accidentally) to a high temperature. This apparent change in firing practices coincides with the increased prevalence of the low-calcareous fabric sub-group FG 1a after the Protopalatial period, and both changes together may have been primarily aimed at reducing incidences of spalling caused by the partial thermal decomposition of calcareous inclusions at high temperatures. Such apparently greater control over firing exhibited by the Minoan potters during the Neopalatial period may have been achieved through technological innovations (e.g. changes in kiln design) and/or changes in firing practices (e.g. choice of fuel or monitoring of firing), although more direct physical evidence for this at Palaikastro remains elusive. Considered together, these seemingly co-occurring changes in firing processes and fabric composition appear to indicate the use of more controlled, and presumably more efficient, pottery production strategies during the Neopalatial period than had been practised previously, born out of greater understandings of the properties of materials and how to manipulate them.
During the Final Palatial period, a further change is seen, with the proportion of the sample assemblage displaying moderate or low optical activity, 57%, returning to the level previously seen in the Protopalatial period. While such change appears to indicate more variability in firing temperatures than that seen in the Neopalatial period, it does not necessarily imply a total return to the practices of the Protopalatial period. In this regard it is perhaps significant that the change in firing during the Final Palatial period is not also accompanied by a reduction in the use of FG 1a to earlier levels (Fig. 12b). Instead, as FG 1a remains the predominant fabric during the Final Palatial period, the differences in firing between the Neopalatial and Final Palatial periods may perhaps reflect a considered choice, whereby a probable increased failure rate resulting from a reduction in the control of firing temperatures was offset against possible gains due to reductions in effort expenditure or increases in overall speed/volume of production.
Fabric Groups 2, 3 and 4
In contrast to FG 1, which was primarily used for larger, utilitarian vessels, FG 2, 3 and 4 were used exclusively for finer wares associated seemingly with the serving and consuming of liquids, and together account for 48% of the archaeological sample assemblage. While these fabric groups all appear to have fulfilled similar roles, variations in their forms, decoration, and occurrence over time nonetheless indicate changing preferences in the production of such vessels, as well as in the manner in which they may have been used and regarded.
Within the sample assemblage, FG 2, 3 and 4 collectively are found in a comparatively restricted range of forms, most commonly in various types of cups, and a smaller proportion of pouring vessels (jugs and jars), or very rarely bowls (Fig. 12a). However, while the functional categories represented are broadly the same, differences can be seen within each fabric group in the relative proportions of vessel types (Fig. 12d). More specifically, the ratios of the number of cups to pouring vessels are broadly similar for FG 2 and 3, at 2.7 and 3.5 respectively, whereas among FG 4 the ratio is substantially higher at 11.0. Assuming that the use of such cups and pouring vessels was directly linked, then the apparent differences in their relative abundance suggests that the manner in which vessels of FG 2 and 3 were used may have differed from that of FG 4.
Further differences are also apparent among the various categories of cups present, with FG 2 displaying nearly twice as many handled cups as handleless cups, whereas for FG 3 and 4 the proportions are reversed with approximately four times as many handleless cups to handled cups. For the latter two fabrics, but especially FG 4, this change is primarily due to the preponderance of conical cups during the Neopalatial and Final Palatial periods, although handled straight-sided and hemispherical cups also persist in the Neopalatial Period (Table A1:1 [Supplementary Material]). The presence or absence of handles might not only affect the manner with which cups were used, but, and perhaps more significantly, the absence of handles would have enabled cups to be made more easily and quickly.
The relative cost of production may also account for differences in the proportion of painted vessels, in particular painted cups, among FG 2, 3 and 4 within the sample assemblage. The proportion of pouring vessels in each fabric group displaying painted decoration is relatively high, at 50, 75 and 63%, respectively; however, significant differences are seen among cups, with 88% of the cups of FG 2 decorated, but only 36% and 16% of FG 3 and 4 respectively (Fig. 12e). When considered together, therefore, FG 2 appears commonly associated with more effort-intensive painted pouring vessels and handled cups, whereas the situation is largely reversed for FG 3 and 4, where although pouring vessels are also decorated to the same extent, cups are predominantly undecorated and lacking handles.
When considered across all chronological periods, it is apparent that the relative proportions of each fabric group within the sample assemblage, and hence also the prevalence of cup handles and decoration, varies significantly over time (Fig. 12f). During the Protopalatial period, FG 2 represents the dominant fabric for pouring vessels and cups, with FG 3 accounting for a smaller but nonetheless significant proportion of the assemblage, whereas FG 4, although present, is attested by only very few samples. During the Neopalatial period, however, considerable differences are seen, with FG 4 now representing the predominant fabric group, and only a minor proportion of samples accounted for by FG 3, while FG 2 is absent entirely. The predominance of FG 4 continues into the Final Palatial period, where it represents the only attested local fabric group of the three.
From this relative distribution it appears that between the end of the Protopalatial period and the advent of the Neopalatial period abrupt changes occur among the local fine-ware fabrics of Palaikastro. Yet, even among these profound changes, the presence, albeit in different proportions, of FG 3 and 4 in both periods represents a significant element of continuity. Consequently, although the eventual dominance of FG 4 constitutes a considerable departure from the previously prevailing traditions of the Protopalatial period, it nonetheless may be seen to have emerged from alongside earlier local traditions. In this regard, the presence of painted decoration on both of the vessels of FG 4 in the sample assemblage dated to the Protopalatial periodFootnote 6 seemingly attests to the integration of this fabric group within the prevailing styles of the period, such as dominated vessels of FG 2.
The transition between the Neopalatial and Final Palatial periods, by contrast, does not see such an abrupt change in the relative proportions of the fine-ware fabrics of Palaikastro. Nonetheless, the seemingly gradual decline in FG 3 over the proceeding periods appears to reach its nadir in the Final Palatial period, leaving FG 4 as the only local tableware fabric (Fig. 12f).
Considering these varied lines of evidence together, it appears that it is with the Neopalatial period that the most significant changes in the production and use of cups and pouring vessels are associated. Notwithstanding evident elements of continuity with the preceding Protopalatial period, the principal developments of this period, as shown above, include a switch between FG 2 and FG 4 as the dominant fabric group for such types of vessels, and a sharp decline in the occurrence of handles and painted decoration on cups. However, it is not immediately apparent, from the perspective of the production and use of pottery, what the driving forces responsible for such changes may have been. One possibility is that the switch from the buff coloured fabric of FG 2 to the darker and redder colour of FG 4 may in turn have stimulated the decline in painted decoration, as the darker colour of FG 4 may have reduced the effectiveness of the visual contrast of dark coloured red, brown and black paints. Or conversely, a general decline in the demand for painted vessels may itself have facilitated a change in fabrics, with the removal of the need for light-coloured fabrics. However, against such arguments, it is noteworthy that within the sample assemblage many pouring vessels and drinking vessels (in particular, straight-sided cups and ogival cups), made of FG 4, continued to be painted, albeit in some cases with the addition of a paler coloured slip; accordingly, the difference in fabric colour does not appear to explain the change in fabrics seen from FG 2 to FG 4.
An alternative explanation for such changes may be linked to increases in the efficiency of production. One common trend running through the various differences between the pottery of the Protopalatial and Neopalatial periods, and continuing into the Final Palatial period, appears to be an overall reduction in the relative effort expended in the production of vessels. This is particularly evident among cups, as witnessed by the decreased frequency of cups with handles and/or painting, and a simultaneous increase in undecorated, handleless, conical cups. The change from FG 2 to FG 4 may also have been driven by a similar motivation, if, as argued above, FG 4 was procured directly from local outcrops of the Kastri Formation, and required little or no preparation or tempering. Furthermore, as the Kastri Formation sediments were already also being utilised in the Protopalatial period for the predominant coarse-ware fabric, FG 1, the increase in the use of FG 4 in the Neopalatial period may represent the expansion of an existing industry, with potential greater economies of scale. In this context, therefore, with an apparent reduction in the cost of production of cups in particular (and also, implicitly, a reduction in procurement costs for the eventual users of the finished vessels), one possible explanation may be found for the lower ratio of pouring vessels to cups in FG 4, compared to that of FG 2 and 3. Such a reduction in the cost of producing cups may have resulted in them being used in greater numbers, and more readily disposed of after a shorter use-life, whereas pouring vessels may have retained a greater inherent value, as evidenced by their continued decoration, and may have remained in use for longer periods of time.
The changes seen over time in the use of local fabrics may also reflect changes in the organisation of pottery production at Palaikastro. During the Protopalatial period there are profound differences between the production of larger utilitarian wares and smaller serving vessels, most noticeably in the very different types of fabrics used (namely FG 1 and 2), and in the use of painted decoration, both of which in turn may also have required different approaches to firing. Such differences may suggest the existence of independent workshops, working with different materials and techniques, and producing distinct types of wares. By contrast, during the Neopalatial period, the use of closely related fabric groups, FG 1 and 4, indicates greater material and technical alignment in the production of large and small vessels, which may have arisen from more closely integrated, and perhaps centrally organised, modes of production.
However, while a model of increased efficiency and reduced costs may represent a plausible explanation for many of the changes seen within the processes of pottery production, it does not in itself account for why such changes occurred at the specific times, and in the manners, in which they did. In part, such changes might be linked to wider changes in stylistic preferences or commensal activities, yet an important local factor may also have been the urban expansion of Palaikastro during MM IIB and especially MM IIIA. An increase in the population of the town may have increased the demand for vessels, in turn exerting greater pressure on local raw materials and consumables (e.g. fuels) and favouring adaptations towards more efficient modes of production.
Minor fabric groups and non-grouped fabrics
Collectively, 54 samples are assigned to the ‘minor’ fabric groups FG 5–14 and the non-grouped fabrics, accounting for 19% of the total sample assemblage. However, the small number of samples within each group, or the isolated nature of the non-grouped samples, makes it difficult to confidently identify meaningful patterns in their occurrence or use. Nonetheless, although the aim of the present project is to characterise the predominant local wares, some tentative observations may still be made concerning the uses of these less common fabrics, and the possible range and character of the contacts between Palaikastro and other regions.
Across all chronological periods, the samples of the minor fabric groups and non-grouped fabrics represent a wide array of forms and functions, of which 26% represent storage vessels (or in this context ‘transport’ vessels) and 67% represent cooking or pouring vessels, bowls and cups (Fig. 12g). The presence of non-local transport containers appears to bear direct witness to some level of economic engagement between Palaikastro and other sites on the island. Of the 14 non-local transport vessels sampled, five belong to amphorae of FG 13 originating from the Mesara or south-central Crete, two amphorae and a pithos of FG 8 probably come from Zakros, while one sample of a pithos is of the calcareous ‘Mirabello’ fabric. While such transport vessels are perhaps best interpreted in terms of the transport of various consumable products, the comparatively high proportions of cups (37%) and pouring vessels (19%) among the non-local fabric groups suggests that these vessels themselves may have been transported and valued in their own right. The movement of such items may, in turn, suggest that tangible links with other sites in the island also had an important role during consumption activities, particularly drinking.
With regard to geographic origin of the non-local pottery found at Palaikastro, some broad diachronic features may be observed. Contacts with Zakros and the Mesara/south-central Crete are attested in the Protopalatial, Neopalatial and Final Palatial periods, as indicated by vessels of FG 8 and collectively FG 9 and 13, whereas material from the Mirabello region (indicated by FG 10) appears more limited, seemingly occurring in only the Protopalatial and Neopalatial periods. However, in this latter instance, the apparent absence of vessels dated to the Final Palatial period may be due to the comparatively smaller number of samples from this period in the sample assemblage as a whole. Contacts with yet more distant regions, potentially even beyond Crete itself, are also hinted at during the Neopalatial and Final Palatial periods by the unusual fabrics of FG 11 (represented by two possible unguent jars) and FG 12 (four conical cups), although their precise provenances have not yet been established.
Other technological features
Forming techniques
The forming techniques of pottery from Palaikastro dated to MM II–LM IA have previously been studied by Jeffra (Reference Jeffra2011; Reference Jeffra2013), who concluded that all vessels were made using coil-fashioning techniques (i.e. coil-building followed by secondary wheel-shaping) or, more rarely, hand-building techniques. Accordingly, forming techniques were not systematically re-examined. Nonetheless, macroscopic observations made during the course of the present study confirm the use of a wheel at some stage of production for most vessels. A small number of vessels, usually larger vessels, appear to have been made using hand-building techniques only, without the use of a wheel.
Firing conditions for ‘local’ pottery fabric groups
In addition to information on potential raw materials, the petrographic analysis of briquettes of geological samples fired under controlled conditions also provides an indication of the firing temperature ranges for the archaeological pottery, based on qualitative comparisons of the degree of optical activity seen within the thin sections. Optical activity reflects the degree of vitrification of the fabric, which is itself affected by the proportion of calcium carbonate in the fabric, as well as atmosphere of the firing (Maniatis and Tite Reference Maniatis and Tite1981). For the clay-rich geological samples discussed above, the thin sections of the briquettes fired in an oxidising atmosphere to 700 or 900°C displayed optically active groundmasses, while those fired to 1050°C displayed inactive groundmasses.
Within the archaeological assemblage as a whole, significant variability in optical activity and firing atmosphere is seen between samples, suggesting firing temperature ranging from below 750 to above 950°C. In many instances, variation is also seen within individual samples, especially thick-walled samples that show oxidised margins and reduced (black or grey) cores. Such variability raises questions as to the type(s) of firing structures used, and the ability of the Minoan potters to control the effects of firing. In this regard, fabrics FG 1 (including FG 1b, in which calcite appears as large lumps rather than evenly disseminated throughout the fabric) and FG 4 may have posed particular challenges as, unlike calcareous clays, non-calcareous clays do not form an intermediate vitrification stage that is stable over a wide range of temperatures (Maniatis and Tite Reference Maniatis and Tite1981). To achieve consistent quality, therefore, a good control of temperature is much more important for these, low calcareous, pastes.
CONCLUSIONS
The analysis undertaken in this study provides a characterisation of the predominant types of pottery fabrics in use at the Minoan town of Palaikastro at Roussolakkos, together with an assessment of how their occurrence changed over time between the Protopalatial and Final Palatial periods, and according to the presumed intended primary function of vessels. From this information it is possible to speculate further regarding how changes in the production and use of pottery fabrics may reflect on wider social and economic aspects of life in the town, and how these changed between historical periods.
The majority (81%) of the pottery sampled can be assigned to one of four principal fabric groups (FG 1–4), all of which, through close similarities with clay-rich sediments and aggregates found within a small number of geological formations present within a radius of c. 2 km from the Roussolakkos site, appear to be of local origin. A further 10 fabric groups (FG 5–14) and 15 non-grouped fabric samples together account for only 19% of the sample assemblage, and appear to have been imported to the site, although in some instances the possibility of a local origin cannot be excluded altogether.
Local fabrics: continuity and change
Utilitarian wares
When considered as a whole, the pottery from Palaikastro appears to display notably little substantive variety with regard to fabrics. This apparent conservatism is most evident among larger, utilitarian, vessels, with all local cooking and storage vessels made with either of two closely related variants of a coarse-textured, phyllite/sandstone/quartzite tempered fabric, FG 1a and FG 1b. The dominance of FG 1 for utilitarian wares throughout all periods seemingly represents the clearest indication of continuity in a technological tradition at Palaikastro between different archaeological periods, and across the varied cultural, social, and political boundaries these ultimately reflect. With regard to FG 1 alone, this technological continuity itself reflects discernible continuity in a number of specific choices and practices undertaken by potters, such as the selection and quarrying of sediments from local outcrops of the Kastri Formation, the addition of temper derived from the Upper Phyllite series (via natural scree deposits or river gravel), and in the selective matching of fabric sub-groups with specific types of vessel function.
However, notwithstanding these overarching similarities, a number of subtle but technologically significant differences can be seen between the Protopalatial and Neopalatial, as witnessed in particular by the greatly increased use of a fabric sub-group lacking calcareous inclusions (FG 1a), together with more consistent firings at lower temperatures. Together these changes appear to indicate the exercising of a greater level of control both over the selection of raw materials and in the manner of firing. Such changes may have been intended to reduce incidences of lime spalling, either by excluding calcareous inclusions altogether or by avoiding exposing such inclusions to temperatures at which they would undergo the partial thermal decomposition that ultimately leads to spalling. Taken together, the changes implemented in the Neopalatial period may reflect not only a deliberate effort to decrease rates of failure due to spalling, but also seemingly a detailed practical knowledge of the behaviour of materials.
Conversely, it may also be suggested that these changes were made independently of each other, as the reduction in calcareous inclusions alone may have been sufficient to reduce spalling. The consistently lower firing temperature used for vessels of FG 1 during the Neopalatial period may instead have been driven by a need for more efficient use of fuel. While the exact nature of the fuels used for pottery firing at Palaikastro remains unknown, recent analysis of charcoal recovered from domestic settings indicates that various materials, including olive wood and by-products, were used as fuels (Picornell-Gelabert Reference Picornell-Gelabertin press). The growth of Palaikastro as an urban centre at this time may have increased not only the demand for pottery, but also the demand for fuels in general, thereby potentially putting pressure on its availability for use in kilns. Yet again, it may be argued that a growth in agricultural production concomitant with an increasing population may have provided a cheap and readily available source of by-products for use as fuel.
While an exact relationship between pottery firing temperatures and fuel types may be difficult, or impossible, to ascertain, the availability of different fuels may nonetheless have represented a critical issue in the production process, which ultimately affected both the processes of firing as well as the fired pottery itself. It is perhaps also in this context that the changes seen in the Final Palatial period, when there is a return to more inconsistent firing temperatures but retaining FG 1a as the dominant fabric, should be viewed. As such, therefore, while attempts to reduce spalling may have been maintained in both the Neopalatial and Final Palatial periods through the use of a fabric with fewer calcareous inclusions (FG 1a), the observed differences in firing temperatures may ultimately reflect differences between these periods concerning the availability, and use, of different types of fuel. While the specific nature of these changes may be difficult to determine from the pottery alone, they nonetheless bring to attention the potential interdependence between pottery production, population size, land use, and environmental resources, as well as human responses to meet changing conditions.
Tableware
While the coarser utilitarian wares from Palaikastro display only subtle variations in composition over time, more overt changes are readily seen among the finer tableware. Within the sample assemblage, bowls, jugs, jars, and especially cups are predominantly found in one of three fabric groups: FG 2, 3, or 4. Within the sample assemblage the relative proportions of these fine or semi-fine fabric groups vary over time, with FG 2 dominating in the early Protopalatial period, before declining sharply in MM IIB with a concomitant rise in FG 3. From the beginning of the Neopalatial period there is an abrupt increase in FG 4, which dominates from MM IIIA through to the early Final Palatial period (LM IIIA), with FG 3 reverting to a minor component of the assemblage and FG 2 disappearing altogether after MM IIB.
The variety of fabrics seen among the finer tablewares stands in marked contrast to that seen among the more conservative utilitarian wares, in particular during the Protopalatial period when, although dominated by FG 2, vessels of FG 3 and 4 are also found. Such variation in the fabrics of tablewares reflects more profound differences among production strategies and techniques, with the utilisation of different raw materials derived from different locations within the landscape, in turn potentially also necessitating different modes of clay preparation, vessel forming techniques, and firing. When considered alongside utilitarian wares, the appearance of diversity within pottery production as a whole during the Protopalatial period is further emphasised, with the marked contrast between the two dominant fabrics groups in use: the red, coarse-textured, fabrics of cooking pots and storage vessels (FG 1a and 1b), and the buff, fine-textured fabrics of cups and pouring vessels (FG 2). Such fundamental differences might indicate the presence of multiple, co-existing, but largely separate, traditions, with potters from each tradition initially working independently of the other.
This diversity in fabrics, and implicitly in working practices too, seen in the Protopalatial period appears to stand in contrast with that which emerges, seemingly rapidly, with the Neopalatial period and continues with little change through to the early Final Palatial period. The sudden dominance of FG 4, and decline of FG 2 and 3, not only indicates a reduction of variation in the production of tablewares, but also, through the close similarities in composition between FG 4 and 1, represents a significantly closer alignment between the production of tablewares and utilitarian wares. In this regard, the similarities between FG 1 and 4 include not only a shared source of raw materials (i.e. the Kastri Formation), but also potential similarities in the manner in which raw materials were extracted, processed and fired. Consequently, the seemingly abrupt increase of FG 4 at the beginning of the Neopalatial period may best be understood not so much as the introduction of a new fabric for tablewares, but rather as the expansion and modification of the already well-established technological tradition of FG 1. The presence of FG 4, albeit as a minor component, within the sample assemblage as early as MM IIA at least confirms that this fabric group does not originate de novo with the Neopalatial period, and that its later expansion is grounded on local traditions, whether or not indeed conceptually linked to FG 1.
In addition to the increase in FG 4, the beginning of the Neopalatial period also appears to be marked by the significant disappearance of FG 2 from the sample assemblage. Such a synchronism may seem to indicate that the factors that led to the transition to the Neopalatial period across the island may also have impacted on the production of pottery at Palaikastro, and on FG 2 specifically. However, as with FG 4, the changes in FG 2 may have their origins sometime before the Neopalatial period, with a seemingly significant decrease in FG 2 in the sample assemblage between MM IIA and IIB. As such, therefore, the changes seen in the fabrics of tablewares at Palaikastro may have developed over a long period of time, perhaps in response to sustained pressures from local factors, rather than suddenly as part of wider, island-wide, changes.
It is perhaps in the context of the potential interplay between the growth of FG 4 and the decline of FG 2 that FG 3 may be best interpreted. In both its distribution and its composition FG 3 appears to represent a transition between FG 2 and 4. Although present in nearly all the periods examined, the peak in its relative distribution within the sample assemblage, in MM IIB, falls midway between the peak of FG 2 in MM IIA and the initial peak of FG 4 in MM IIIA. Similarly, in physical appearance FG 3 is commonly a slightly darker coloured, less calcareous, and sandier-textured fabric than FG 2, although not as pronounced in these characteristics as FG 4. The possible origin of FG 3 as an intentional mixture of the raw materials otherwise used for FG 2 and 4 increases the impression of FG 3 as representing the merging of technological traditions. The fact that both the Palaiokastron and Kastri Formations were already being exploited simultaneously as raw material sources for FG 2 and FG 1 respectively, and that both formations occur at the same geographic locations (at Kastri hill and Cape Plaka), makes the potential mixing of clays for the production of FG 3 appear more plausible.
However, while it may be a simple convenience, with the benefit of hindsight, to view FG 3 as an intermediary fabric in this manner, its predominance in MM IIB cannot in itself be seen to herald inevitably the subsequent dominance of FG 4. If, instead of representing a mixing of the Palaiokastron and Kastri Formations, FG 3 is derived from the Toplou Formation, or from the broad transitional zone in which the Toplou and Kastri Formations merge, then in both conception and practice it would represent a more abrupt departure from either of the pre-existing traditions of FG 1 and FG 2. The exploitation of the Toplou Formation would have necessitated shifting the location(s) of extraction, and also perhaps the actual site(s) of pottery production, further west of those of the Palaiokastron and Kastri Formations, in turn decreasing potential overlaps with the earlier dominant traditions. As such, therefore, the use of the Toplou Formation would potentially represent not only the development of a new pottery fabric group, but the development of a new pottery tradition, with its own modes of production and styles.
While it remains unclear whether FG 3 originates from the Palaiokastron/Kastri Formations or the Toplou Formation and therefore whether it represents a merging of, or departure from, the pre-existing dominant traditions of FG 1 and FG 2, the reasons that led to its use, seemingly at the expense of FG 2, may also have been ultimately shared by FG 4. That is to say, although FG 3 and FG 4 may (or may not) represent entirely different fabrics and potting traditions, nonetheless they may have benefitted both as responses to the same underlying pressures on production, and, therefore, the eventual dominance of the latter can potentially be seen to have its origins with those pressures, long before the transition to the Neopalatial period.
Further evidence of the nature of these pressures may perhaps be seen with the decline in painted decoration and handles on cups, which occurred alongside the changes in fabric groups. Considered together, these changes seemingly reflect a consistent pattern towards a reduction in the cost of production of cups of FG 3 and 4 compared to cups of FG 2, as measured in terms of time and effort required for forming, assembly, and decoration, and gathering raw materials for decoration. Seen in this light, the shift towards the greater use of the Kastri Formation sediments, already a staple for the production of utilitarian wares, for tablewares either as a component of FG 3 or as FG 4 in its entirety, may also be regarded as part of a trend towards the reduction of production costs. The increase in FG 4, if seen as an expansion of the pre-existing potting tradition represented by FG 1, may have benefitted from various economies of scale throughout production, notably in that the same source of raw material could be quarried for both utilitarian wares and tablewares, and also potentially benefitting from the use of existing kilns used for vessels of FG 1.
The stimulus for such increases in the efficiency of production may in turn be linked to the contemporaneous urban growth of Palaikastro, beginning in earnest in MM IIB and continuing into the Neopalatial period. The concomitant increase in the population of the town may have resulted in a greater demand for pottery, as well as for pottery of cheaper forms. Significantly, it may also be noted that the growth of Palaikastro, as with the various changes in pottery production, begins before the Neopalatial period, and as such appears to arise from local factors rather than be driven by the eventual increase of the influence of Knossos in eastern Crete.
In addition to such largely economic explanations, the changes seen in pottery production and consumption at Palaikastro may also have been influenced by wider social or aesthetic factors, which may perhaps more directly reflect the changes seen in the decoration of pottery. When viewed as a whole, the transition to the Neopalatial period sees a sharp reduction in the proportion of local-fabric (FG 1–4) cups, bowls, and pouring vessels with painted decoration, from 64% in the Protopalatial period to 18% in the Neopalatial, largely coinciding with the change from FG 2 to 4. However, when examined more closely by functional group, the decline in painted decoration occurs primarily among cups, with 85% of cups in the Protopalatial period decorated but only 12% in the Neopalatial (largely due to the predominance of plain conical cups); conversely, a substantial proportion of pouring vessels are painted during both periods (33% and 43% respectively), despite changes in fabric. More generally, it appears that at least some vessels of FG 4 were painted both during the Protopalatial (represented in the sample assemblage by two cups) and Neopalatial periods (especially pouring vessels and straight-sided cups), suggesting that in fact the darker colouration of this fabric alone might not have been responsible for the overall decline in decoration. Instead, it appears that the change in the prevalence of the painting of vessels may follow wider chronological trends (such as the shift from white-on-dark to dark-on-light), perhaps governed by changes in aesthetic values independent of changes in fabric.
The apparent divergence between pouring vessels and cups (in particular handleless cups) that emerges with the Neopalatial period regarding the presence of painted decoration may also indicate a change in the manner in which these vessels were valued and used, and in turn, changes in the social activities for which they may have been used. However, whatever the nature of these changes may have been regarding the use of cups, the pouring vessels, which were presumably used alongside them, appear to retain a stronger connection with earlier traditions. Nonetheless, it may be noted that the decline in decoration on cups alone marks one of the few instances where a change in pottery production appears to coincide solely with the transition to the Neopalatial period and cannot be seen to have originated in earlier periods.
Non-local wares
As noted above, a comparatively small number of samples in this study could not be placed within one of the four principal, probably local, fabric groups, and were instead either assigned to minor fabric groups or identified as non-grouped samples. Of these, a number were identified as having been imported to Palaikastro, either due to similarities with other documented fabrics or on the basis of the probable incompatibility of their compositions with the geology of the region. While it is difficult to discern meaningful patterns of change in production among such a small and disparate body of samples, nonetheless some broad, and necessarily tentative, observations may be made concerning the nature of imported pottery at Palaikastro.
Perhaps one of the most striking features of the non-local pottery in this study is the apparent relative scarcity of pottery that could be attributed to nearby centres, such as Zakros and Petras, whereas pottery from more distant locations, such as the Mirabello and Mesara regions, is attested in all, or most, of the chronological periods examined. In part this discrepancy may be attributed to the comparative distinctiveness of fabrics from the latter regions, which in some instances can be readily identified by eye in hand specimen, potentially leading to a preferential bias during sample selection over less visually distinctive imports. The identification of imports from nearby locations may also have been hampered by a lack of geological variation over the region. In this regard it may be noted that extensive deposits of the Kastri Formation are also present along much of the valley between Palaikastro and Zakros (Gradstein Reference Gradstein1973, fig. 19), but which were not sampled in the course of the geological proposition undertaken for this study. While the proximity of outcrops of this formation adjacent to the Roussolakkos site argues in favour of local production there, it remains possible, at least theoretically, that some material may have been made elsewhere and imported to the site.
Notwithstanding such potentially significant methodological difficulties, the seemingly comparatively small proportion of imports within the sample assemblage may reflect the relative isolation, or independence, of Palaikastro. In this respect, the proportion of imported vessels, or number of identified sources, does not appear to increase significantly during either the Neopalatial or Final Palatial periods, and may indicate that in some regards Palaikastro was only marginally influenced by the changes occurring at Knossos and elsewhere on the island.
Closing remarks
The study of the pottery from Palaikastro reveals aspects of both continuity and change over time. Differences are most readily recognised between MM IIB and IIIA, particularly among the fine and semi-fine textured tablewares, while the transition between the Neopalatial and Final Palatial periods is less clearly discernible in the pottery fabrics. Nonetheless, in nearly all instances, the changes that can be recognised seem to have technological antecedents in preceding periods, and as such very rarely appear to represent the intrusion of entirely new fabric recipes. Consequently, while the transition to the Neopalatial period in particular appears to have coincided with many changes within pottery production, these changes may ultimately have resulted from processes, such as urban growth, already well underway locally. Similarly, with regard to pottery fabrics, the transition to the Final Palatial period is even less pronounced, seemingly showing a continuation of Neopalatial traditions. As such, therefore, while the advent of the Neopalatial and Final Palatial periods may have represented significant social and political turning points in the history of the island, their material influence on the economic activities at Palaikastro may, perhaps, have been less profound.
SUPPLEMENTARY MATERIAL
The supplementary material for this article can be found at http://doi.org/10.1017/S0068245425000036.
ACKNOWLEDGEMENTS
The authors would like to thank the Hellenic Republic Ministry of Culture for permission to sample pottery from Palaikastro (permit number: ΥΠΠΟΑ/ΣΥΝΤ/Φ44/129921/2792) and the Ephorate of Antiquities of Lasithi for its assistance. We are grateful to Zoe Zgouleta, Michalis Sakalis and Athena Konstandara of the British School at Athens for preparing the samples for WD-XRF and petrographic analysis and providing additional photomicrographs; and to Katalin Bajnok of the HUN-REN Centre for Energy Research for assistance in preparing the maps. Funding was provided by the British School at Athens, the Institute for Aegean Prehistory, and the University of Toronto. John Gait especially thanks the British School at Athens for their support whilst the Williams Fellow in Ceramic Petrology between 2013 and 2017, during which time the petrographic analysis and fieldwork for this project were undertaken, and also Florence Liard (University of Louvain) and Eleni Nodarou (Institute for Aegean Prehistory), who generously provided access to their own materials. Finally, the authors are indebted to two anonymous reviewers for their constructive feedback and for kindly sharing their time and expertise.


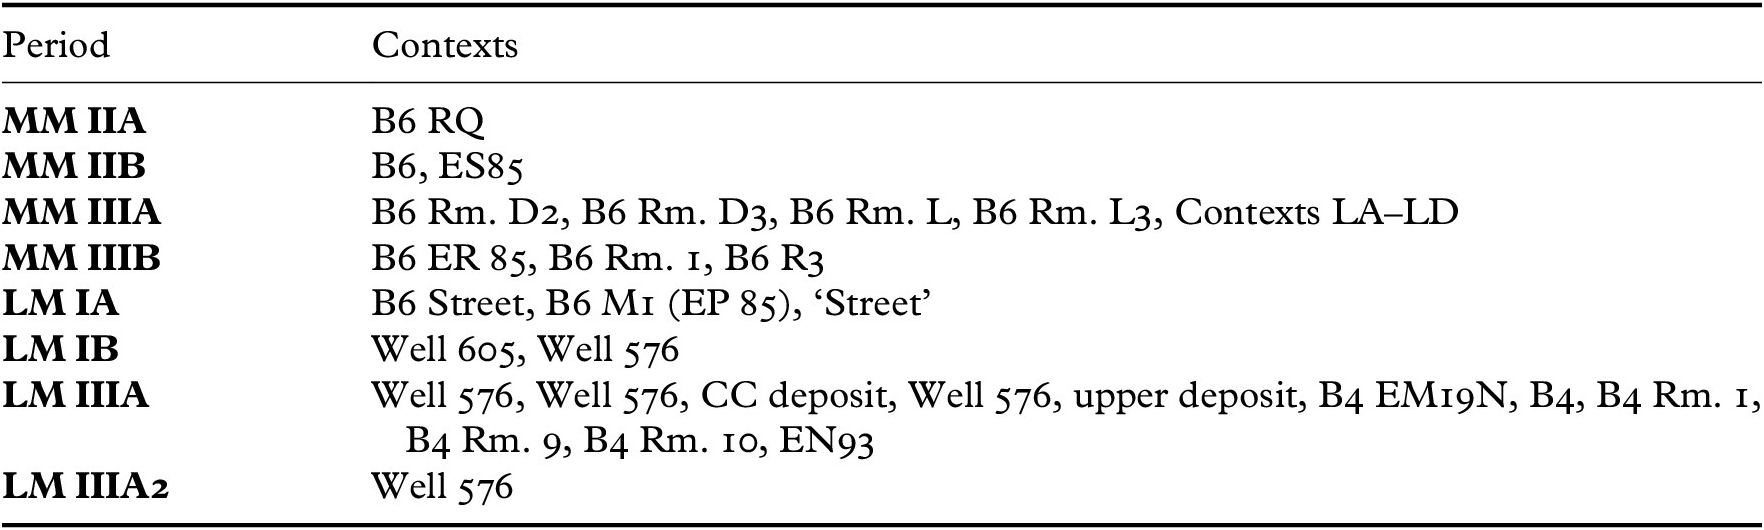


 Open access