


The obesity epidemic has led to an increased incidence of obesity-related glomerulopathy (ORG), which is pathologically characterised by glomerular basement membrane thickening, podocyte injury, glomerular hypertrophy and focal segmental glomerulosclerosis, resulting in proteinuria and progressive loss of renal function(Reference D’Agati, Chagnac and de Vries1). About 30 % of ORG patients develop progressive renal failure or end-stage renal disease. Despite considerable efforts to characterise the pathophysiology of ORG, therapeutic approaches are very limited. Renin–angiotensin–aldosterone system inhibition and weight loss are the only two methods that are proven effective, but renin–angiotensin–aldosterone system inhibitors have contraindications, and their nephroprotective effects on ORG may be short term, while weight loss is often challenging for patients with obesity(Reference Martinez-Montoro, Morales and Cornejo-Pareja2). Therefore, exploring alternative or additive therapies is necessary for the improvement of kidney prognosis in ORG.
The relationship between gut microbiota and chronic kidney diseases is referred to as the ‘gut–kidney axis’(Reference Stavropoulou, Kantartzi and Tsigalou3). In recent years, a link between a contraction of SCFA-producing bacteria and kidney diseases has been proposed. SCFA, mainly acetate, propionate and butyrate, are the end products of the fermentation of dietary fibres by the gut microbiota(Reference van der Hee and Wells4). Consumption of high dietary total fibre intake is associated with a lower risk of inflammation and all-cause mortality in patients with chronic kidney diseases(Reference Su, Qin and Yang5). Consistently, reduced SCFA-producing bacteria are observed in end-stage renal disease patients(Reference Wong, Piceno and DeSantis6). Germ-free mice, which have very low levels of SCFA, are more susceptible to renal injury, whereas conventionalisation with bacteria in diet confers protection against renal injuries(Reference Campbell, Kandalgaonkar and Golonka7,Reference Gharaie, Lee and Newman-Rivera8) .
Among the SCFA, butyrate stands out because it might have the potential in alleviating obesity and related metabolic complications(Reference Coppola, Avagliano and Calignano9). For demonstration, a lower abundance of butyrate-producing microbes in humans has been associated with an increased risk of metabolic disease, showing its strength in mitigation of the metabolic disturbances of obesity(Reference Stoeva, Garcia-So and Justice10). Actually, a couple of studies have reported beneficial effects of butyrate on high-fat diet (HFD)-induced obesity and glucolipid metabolism(Reference Hong, Jia and Pan11,Reference Peng, Dong and Luo12) . Regarding its renal effects, butyrate has been shown to be able to ameliorate kidney oxidative damage, inflammation, apoptosis, fibrosis, pathological changes and proteinuria in animal models of ischaemia-reperfusion injury, diabetic nephropathy and immune-related chronic kidney disease(Reference Sun, Zhou and Chen13–Reference Liu, Gu and Cui15). However, the mechanism of butyrate on kidney diseases and whether it has a renoprotective effect on ORG remain to be elucidated.
Mitochondrial damage and dysfunction have been identified to play a critical role in the occurrence of ORG. Mitochondrial fragmentation, decreased ATP content and increased production of mitochondrial reactive oxygen species (ROS) are observed in the kidneys of HFD-fed mice and ob/ob mice(Reference Prem and Kurian16,Reference Munusamy, Do and Hosler17) . Furthermore, mitochondria-targeted therapy, for example, SS31, has been demonstrated to be beneficial for preventing renal damages induced by an HFD(Reference Szeto, Liu and Soong18). These results highlight that targeting mitochondria may offer a potential strategy for the treatment of ORG. Previous studies have shown that butyrate improves kidney mitochondrial function in db/db diabetic mice, but the underlying mechanism remains largely unknown(Reference Yu, Jia and Li19). An in-depth investigation of the molecular mechanism underlying its effects on mitochondrial biology and pathology is essential to the discovery of more specific and efficacious approaches to target mitochondria for renoprotection.
The present study observed the effects of butyrate on proteinuria, kidney pathological changes, podocyte damages and mitochondrial dysfunction in mice ORG model induced by HFD feeding and explored the underlying molecular mechanisms involved in palmitic acid (PA) treated-mouse podocyte cell line (MPC5) cells in vitro. Our present findings indicated the use of butyrate may hold promise for the prevention and treatment of ORG.
Materials and methods
Animals
Five-week-old male C57BL/6 mice were obtained from the Hunan SJA Experimental Animal Company. After a 1-week acclimation, the mice were fed a normal chow diet (12 % fat, 22 % protein and 66 % carbohydrate, 3·5 kcal/g) or HFD (60 % fat, 20 % protein and 20 % carbohydrate, 5·24 kcal/g, purchased from Research Diets, Inc.) for 16 weeks. After the initial 8 weeks’ feeding, normal chow diet-fed mice and HFD-fed mice received either sterilised vehicle (NC group or HC group, n 8) or sodium butyrate (NaB, Sigma-Aldrich 303410, 300 mg/kg per d) (NB group or HB group, n 8) by gavage once daily for the subsequent 8 weeks(Reference Sun, Jia and Hong20). Body weight and food intake were recorded weekly. At the end of the 16th week, mice were fasted overnight and then sacrificed. Blood samples were harvested for biochemical analysis. After isolation of the kidneys, a transverse slice was fixed in 4 % paraformaldehyde, and portions of the kidney cortex were fixed with 2·5 % glutaraldehyde for subsequent pathological and transmission electron microscopy analysis. The remaining kidney tissue was frozen at –80°C until further analysis. All animals were housed under a 12-h light/dark cycle at a constant temperature.
Cell culture
A conditionally immortalised MPC5 was purchased from BeNa Culture Collection and cultured as described previously(Reference Ni, Saleem and Mathieson21). Briefly, podocytes were grown in RPMI-1640 medium (Gibco) supplemented with 10 % fetal bovine serum (Gibco) and mouse recombinant interferon-γ (Sigma-Aldrich, 10 U/ml) at 33°C and subsequently differentiated in RPMI-1640 without interferon-γ at 37°C. PA solution was prepared as described previously(Reference Sweet, Vasudevan and Fan22). Briefly, PA powder (Sigma-Aldrich, P0500) was dissolved in DMSO to a concentration of 10 mM. PA was then conjugated in DMEM with 1 % fatty acid-free BSA to a final concentration of 0·3 mM. Podocytes were incubated with 0·3 mM PA for 24 h(Reference Kaewin, Changsorn and Sungkaworn23) and subsequently treated with or without sodium butyrate (But) (1 mM, APExBIO, B1835) or 3-TYP (TYP, the inhibitor of Sirt3) (50 μM, TOPSCIENCE, T4108) or GLPG0974 (GLPG, the inhibitor of GPR43) (10 μM, R&D Systems, 5621/10) for another 24 h, and then cells were lysed for mRNA and protein analysis.
Urinary albumin determination
24 h of urine excretion was collected using metabolic cages at the 12th and 16th week. Urinary albumin levels were measured by mouse microalbuminuria ELISA kit (JL20486, Jianglaibio) according to the manufacturer’s instructions.
Intraperitoneal glucose tolerance test and insulin tolerance test
Intraperitoneal glucose tolerance test and insulin tolerance test were performed at the 15th week. Mice were fasted overnight prior to the intraperitoneal glucose tolerance test or 5 h prior to the insulin tolerance test. Glucose levels were measured sequentially from the tail vein at 0, 30, 60 and 120 min, after intraperitoneal injection of either glucose (2 g/kg body weight) or insulin (0·5 UI/kg body weight). AUC for intraperitoneal glucose tolerance test and insulin tolerance test were calculated to evaluate glucose tolerance and insulin tolerance.
Biochemical assays
Blood urea nitrogen, serum creatinine, uric acid, TG, total cholesterol, LDL-cholesterol and HDL-cholesterol were measured by commercial reagents (Serotec Co.) on an automatic biochemical analyser (Hitachi) according to the manufacturer’s recommendations.
Serum butyrate measurement
Serum butyrate was measured using the HPLC-MS/MS method as previously described(Reference Li, Li and Li24). Briefly, butyrate was extracted from serum samples using acetonitrile and derivatized with 3-nitrophenylhydrazine and then analysed on a Jasper HPLC coupled to a Sciex 4500 MD system. Octanoic acid-1–13C1 (Sigma-Aldrich, 605832) and Butyric-2,2-d2 (CDN Isotopes, 19136-92-6) were used as internal standards.
Serum 3-hydroxybutyrate assay
3-Hydroxybutyrate levels were measured by an enzymatic 3-hydroxybutyrate dehydrogenase-based assay kit (MEIKANG Bio Inc) according to the manufacturer’s instructions.
Histology staining
Kidneys were fixed in 4 % paraformaldehyde and then embedded in paraffin (4 µm thickness). Sections were stained with haematoxylin and eosin or periodic acid-Schiff or Masson trichrome. All tissue assessments were performed in a blinded fashion. Semi-quantitative evaluation was performed with Image J software.
Immunohistochemical and immunofluorescence staining
Immunohistochemical staining was performed with paraffin-embedded kidney tissues. Sections were deparaffinized and heated in citrate buffer for 20 min for antigen retrieval and then sequentially incubated with peroxide and goat serum for blocking. The sections were then incubated with anti-Wilm’s tumour 1 (WT-1) antibody (Abcam, ab267377) at 4°C overnight and subjected to immunohistochemical analysis.
Frozen kidney sections were used for immunofluorescence staining. After the slices were incubated with an anti-WT1 antibody or anti-GPR43 antibody (Proteintech, 19952-1-AP) or anti-Sirt3 antibody (Abcamab, 246522) overnight at 4°C, an IgG antibody conjugated to fluorescein was used as a secondary antibody. Nuclei were stained with 4’,6-diamidino2-phenylindole (DAPI), and images were captured using Leica DM2500 fluorescence microscopy.
Transmission electron microscopy
Kidney cortex or podocytes were fixed in 2·5 % glutaraldehyde and embedded in resin according to standard procedures. Ultrathin sections were stained with uranyl acetate/lead citrate and examined under an electron microscope (JEOL, JEM1400).
Western blot analysis
The renal cortex tissues or podocyte samples were lysed in RIPA lysis buffer. Subsequently, denatured proteins were separated by SDS-PAGE electrophoresis and transferred to a PVDF membrane (Merck Millipore). After blocking by BSA solution for 1 h, the membranes were then incubated with primary antibodies overnight at 4°C, followed by corresponding horseradish peroxidase-conjugated antibody for 1 h and detection by chemiluminescence. The primary antibodies used were as follows: anti-GAPDH (Proteintech, 10494-1-AP), anti-beta actin (Proteintech, 81115-1-RR), anti-WT-1 (Abcam, ab267377), anti-PGC1-α (Proteintech, 66369-1-Ig), anti-GPR43 (Proteintech, 19952-1-AP) and anti-Sirt3 (Abcamab, 246522). Quantification was performed by measuring the grey value with the Image Lab software.
Real-Time RT-PCR
Total RNA was extracted from kidney or podocytes with Total RNA Isolation Kit (Foregene, RE-03011/03111) and reverse-transcribed into cDNA using HiFiScript cDNA Synthesis Kit (CWBIO, CW2569M) following the manufacturer’s protocol. The cDNA samples were diluted 20-fold, and a real-time PCR reaction was carried out using SYBR Green PCR Pre-mixed Solution (Thermo Fisher, 4309155). Amplifications were performed in a QuantStudio 7 Real-Time PCR System (Thermo Fisher Scientific). All standards and samples were assayed in triplicate. The sequences of the primer pairs are listed in online Supplementary Table S1.
Assay of oxidant markers
Kidney cortex and podocyte lysates were collected for estimating malondialdehyde, glutathione (GSH) and total superoxide dismutase (T-SOD), by using each Assay Kit (Nanjing Jiancheng, A003-1-2/A006-1-1/A001-1-2) according to the manufacturer’s recommendations.
Cell viability assessment
The viability of MPC5 cells was determined using a Cell Counting Kit-8 (TOPSCIENCE, C0005). Briefly, cells were inoculated onto a 96-well plate and incubated with different concentrations of PA or butyrate for 24 h or 48 h. Then, 10 µl per well Cell Counting Kit-8 solution was added to the culture medium, and the absorbance value was measured at 450 nm. Results were shown as the percentage of Cell Counting Kit-8 reduction, and the absorbance of the control group was set at 100 %.
ATP assay
ATP levels were measured using the ATP Assay Kit (Beyotime, S0026) according to the manufacturer’s protocol. Briefly, podocyte lysates were centrifuged at 12 500 g for 5 min at 4°C to get the supernatants. Treated samples were mixed with ATP reaction mix in 96-well plates, and the luminescence was measured by LuminMaxC Luminometer (Promega, GLOMAX-MULTI).
Reactive oxygen species assay
ROS generation was detected by the ROS assay kit (Beyotime, S0033S) according to the manufacturer’s instructions. Podocytes were seeded into 6-well plates, and after various treatment conditions, cells were incubated with fluorescent probe 2’,7’-dichlorodihydrofluorescein diacetate (DCFH-DA) for 20 min at 37°C. Then the fluorescence intensity was examined with a flow cytometer (Attune CytPix, Thermo Fisher) to assess ROS generation.
MitoTracker staining
Mitochondria were stained by fluorescent probe MitoTracker Green (Beyotime, C1048). After each treatment condition, podocytes were incubated with MitoTracker Green for 30 min at 37°C. Images were taken under a fluorescence microscope (Leica, DM2500). Two replicates were performed for each biological sample.
Statistical analysis
Data are presented as mean (sem). Statistical analysis was performed using the IBM SPSS Statistics 22·0. For normally distributed data, the differences among groups were evaluated by a one-way ANOVA followed by the Bonferroni post hoc test (assuming equal variances) or Tamhane’s T2 post hoc test (without the assumption of equal variances). Kruskal–Wallis test with Dunn’s test was used for non-normally distributed data. P values less than 0·05 were considered statistically significant.
Results
Sodium butyrate ameliorated high-fat diet-induced metabolic disorders
The HC group had increased body weight than the NC group. The HB group exhibited lower body weight than the HC group from the 13th week onwards, and no difference in food intake was noted between HC and HB groups (Fig. 1(a) and (b)). Compared with the NC group, the HC group demonstrated impaired glucose tolerance and insulin sensitivity, increased visceral fat and higher serum total cholesterol, LDL-cholesterol and HDL-cholesterol levels. HB mice exhibited alleviated glucose tolerance and improved insulin sensitivity and decreased serum total cholesterol level in comparison with HC group (Fig. 1(c)–(f)). There was a decreased tendency of relative visceral fat weight in the HB group v. the HC group (P = 0·06) (Fig. 1(e)). There were no significant differences in body weight, glucolipids or insulin resistance between the NC and NB groups (Fig. 1(a)–(f)).
Sodium butyrate administration ameliorated HFD-induced metabolic disorders. (a) Energy intake and (b) body weight of mice during 16 weeks’ experiment. (c) Blood glucose levels during IPGTT and AUC analysis at week 15. IPGTT, intraperitoneal glucose tolerance test. (d) Blood glucose levels during ITT and AUC analysis at week 15. ITT, insulin tolerance test. (e) Relative visceral fat content (visceral fat weight/body weight). (f) Serum lipids. TG: triglyceride; TC, total cholesterol. All values are shown as the means (sem). n 6–8 each group. (a), (c)–(f) a1 P < 0·05, a2 P < 0·01 v. NC group; b1 P < 0·05, b2 P < 0·01 v. NB group; c1 P < 0·05, c2 P < 0·01 v. HC group; (b) *P < 0·05, **P < 0·01 when HB group v. HC group; (c), (d) *P < 0·05 v. NC group; #P < 0·05 v. HC group. Statistical significances were determined by one-way ANOVA.

Serum butyrate and 3-hydroxybutyrate
Compared with ND-fed mice, HFD-fed mice had a significantly decreased concentration of serum butyrate. And butyrate gavage led to significant increases in serum butyrate in both ND-fed and HFD-fed mice (Fig. 2(a)).
Serum butyrate and 3-hydroxybutyrate. (a) Serum butyrate levels. (b) Serum 3-hydroxybutyrate levels. (a)–(b) a1 P < 0·05, a2 P < 0·01 v. NC group; b1 P < 0·05, b2 P < 0·01 v. NB group; c1 P < 0·05, c2 P < 0·01 v. HC group. Statistical significances were determined by one-way ANOVA.

Butyrate was also rapidly metabolised by the liver to 3-hydroxybutyrate, which might have beneficial effects on organismal metabolism. For this reason, we also measured the levels of serum 3-hydroxybutyrate. The results showed that levels of 3-hydroxybutyrate significantly increased in HFD-fed mice but were not impacted by butyrate treatment in both ND-fed and HFD-fed mice (Fig. 2(b)).
Sodium butyrate administration prevented high-fat diet-induced kidney injury
HFD led to renal dysfunction, as evidenced by increased serum creatinine levels and urinary albumin excretion in HC mice. Compared with the HC group, the HB group had decreased serum creatinine and urinary albumin excretion (Fig. 3(a) and (b)). Pathologically, HC mice displayed increases in glomerular diameter and deposition of glycogen and collagen fibres in the glomerular region, while HB mice exhibited less glomerulomegaly, mesangial expansion and renal fibrosis (Fig. 3(c)–(e)).
Sodium butyrate administration prevented high-fat diet-induced kidney injury. (a) Serum creatinine levels. (b) Urinary albumin excretion levels at the 12th and 16th week. (c) Representative pictures of haematoxylin and eosin (HE) staining, (d) periodic acid-Schiff (PAS) staining and (e) Masson staining of kidney tissue. Scale bars, 20 μm. All values are shown as the means (sem). n 6–8 each group. (a)–(d) a1 P < 0·05, a2 P < 0·01 v. NC group; b1 P < 0·05, b2 P < 0·01 v. NB group; c1 P < 0·05, c2 P < 0·01 v. HC group. Statistical significances were determined by one-way ANOVA.

Collectively, these data indicated that butyrate ameliorated HFD-induced obesity, insulin resistance, glucolipid dysmetabolism and renal injuries in mice.
Sodium butyrate administration ameliorated high-fat diet-induced podocyte damage
Given the crucial roles of podocytes in the maintenance of the structure and filtration capacity of glomeruli(Reference Kopp, Anders and Susztak25), we then assessed the impacts of butyrate on podocyte damage. Transmission electron microscopy revealed that podocytes in HC mice had irregular shapes with diffuse foot process fusion and glomerular basement membrane thickening, and butyrate treatment led to improvements in podocyte foot process effacement and reduced glomerular basement membrane (Fig. 4(a)). Also, we detected podocyte density by immunohistochemical staining of WT-1, the marker for podocytes. Compared with NC mice, podocyte density in the glomerular area of the HC mice was significantly decreased, assessed by WT-1 positive area and increased in HB group v. HC group; these results were further confirmed by western blot analysis of renal cortex (Fig. 4(b) and (c)).
Sodium butyrate administration ameliorated high-fat diet-induced podocyte damage. (a) TEM of podocyte foot processes and glomerular basement membrane in the kidney of mice treated with or without butyrate. Scale bars, 2 μm. n 6 each group. (b) Immunohistochemistry assays and (c) Western blots assays for the expression of Wilm’s tumour 1 (WT-1) in the renal cortex of mice treated with or without butyrate. n 6–8 each group. (d) Relative mRNA levels of WT-1, nephrin and podocin determined by RT-PCR in the MPC5 cells incubated with or without butyrate. (e) Western blots assays of WT-1 in the MPC5 cells incubated with or without butyrate, GLPG0974 or 3-TYP. TEM, transmission electron microscopy; PA, palmitic acid; But, butyrate; GLPG, GLPG0974, the inhibitor of GPR43; TYP, 3-TYP, the inhibitor of Sirt3. All values are shown as the means (sem). (b)–(c) a1 P < 0·05, a2 P < 0·01 v. NC group; b1 P < 0·05, b2 P < 0·01 v. NB group; c1 P < 0·05, c2 P < 0·01 v. HC group. (d)–(e) a1 P < 0·05, a2 P < 0·01 v. Control group; b1 P < 0·05, b2 P < 0·01 v. PA group; c1 P < 0·05, c2 P < 0·01 v. PA + But group. Statistical significances were determined by one-way ANOVA.

To clarify whether there were direct effects of butyrate on the podocytes, we conducted in vitro experiments in MPC5 cells. To mimic podocyte damage of HFD-induced renal injury, we treated cultured MPC5 cells with PA. According to the Cell Counting Kit-8 cell viability assay, cell viability was decreased with 0·3 mM PA treatment, and treatment with 1·0 mM butyrate significantly increased cell viability in PA-treated MPC5 cells (online Supplementary Fig. S1a–c). Thus, we selected 0·3 mM PA and 1·0 mM butyrate for the following experiments(Reference Yu, Jia and Li19,Reference Kaewin, Changsorn and Sungkaworn23) .
Consistent with in vivo results, expressions of WT-1, nephrin and podocin were significantly decreased with PA-treated MPC5 cells, and butyrate increased the expressions of these podocyte markers (Fig. 4(d) and (e)).
Sodium butyrate partially reversed high-fat diet-induced oxidative stress and mitochondrial damage
Since oxidative stress and mitochondrial dysfunction are key molecular events in the pathogenesis of ORG(Reference Wei, Li and Yu26), we then explored the effects of sodium butyrate on oxidative stress and mitochondrial damage in vivo and in vitro. HC mice had lower GSH and higher malondialdehyde in renal tissues v. NC mice. Compared with HC mice, HB mice had lower malondialdehyde in renal tissues (Fig. 5(a) and (b)). Transmission electron microscopy revealed mitochondrial swelling and cristae fracture or loss in HC mice, and these changes were ameliorated in HB mice (Fig. 5(c)).
Sodium butyrate partially reversed high-fat diet-induced oxidative stress and mitochondrial damage. (a) GSH and (b) MDA content in the kidney of mice treated with or without butyrate. n 6–8 each group. (c) TEM of mitochondrial morphology in the kidney of mice treated with or without butyrate. Scale bars, 1 μm. n 6 each group. (d) T-SOD and (e) GSH content in the MPC5 cells incubated with or without butyrate, GLPG0974 or 3-TYP. (f) Cellular reactive oxygen species production was detected by flow cytometry after DCFH-DA staining. (g) Western blot assays of PGC1-α in the MPC5 cells incubated with or without butyrate, GLPG0974 or 3-TYP. (h) ATP content in the MPC5 cells incubated with or without butyrate, GLPG0974 or 3-TYP. (i) Mitochondria were stained by MitoTracker Green and imaged by fluorescence microscope. Scale bars, 50 μm. (j) TEM of mitochondrial morphology in the MPC5 cells incubated with or without butyrate. Scale bars, 1 μm. GSH, glutathione; MDA, malondialdehyde; T-SOD, total superoxide dismutase; TEM, transmission electron microscopy; PA, palmitic acid; But, butyrate; GLPG, GLPG0974, the inhibitor of GPR43; TYP, 3-TYP, the inhibitor of Sirt3. All values are shown as the means (sem). (a)–(b) a1 P < 0·05, a2 P < 0·01 v. NC group; b1 P < 0·05, b2 P < 0·01 v. NB group; c1 P < 0·05, c2 P < 0·01 v. HC group. (d)–(f), (h) a1 P < 0·05, a2 P < 0·01 v. Control group; b1 P < 0·05, b2 P < 0·01 v. PA group; c1 P < 0·05, c2 P < 0·01 v. PA + But group. Statistical significances were determined by one-way ANOVA.

In PA-treated MPC5 cells, there were decreases in antioxidant scavengers such as T-SOD and GSH and an increase in ROS. Butyrate intervention led to increases in T-SOD and GSH and a decrease in ROS (Fig. 5(d)–(f)).
Effects of sodium butyrate on mitochondria were also observed in MPC5 cells in vitro. We found that expression of Nrf-1, TFAM, PGC-1α and electron transporter chain-related genes (Ndufa1, COX IV, ATP5o) were downregulated by PA stimulation, while butyrate intervention upregulated expression of these genes, indicating increased mitochondrial biogenesis and mitochondrial integrity of podocytes with butyrate treatment (Fig. 5(g), online Supplementary Fig. S2a, b). ATP levels were measured to assess the effect of butyrate on mitochondrial function. ATP levels were decreased in PA-treated MPC5 and were better preserved after butyrate intervention (Fig. 5(h)). Further, we analysed mitochondrial mass by MitoTracker staining and the ultrastructural of mitochondria using electron microscopy. Mitochondrial mass was significantly lower with PA stimulation, while treatment with butyrate largely preserved mitochondrial mass (Fig. 5(i)). And transmission electron microscopy analysis displayed PA-treated MPC5 cells with swollen mitochondria and disorganised and fragmented cristae, while butyrate intervention preserved a relatively normal structure of mitochondria (Fig. 5(j)). Collectively, these results showed that butyrate improved the morphology and function of podocyte mitochondria.
Sodium butyrate ameliorated podocyte injury via the activation of GPR43-Sirt3 pathway
GPR43 is one of the main receptors for SCFA(Reference Kimura, Ichimura and Ohue-Kitano27). Here we found that GPR43 expressed and co-localised with WT-1 in the glomerular region of the kidney in mice by double immunofluorescent staining, indicating that GPR43 is present in podocytes (Fig. 6(a)). The expression of WT-1 and GPR43 were decreased in renal tissue of the HC group v. the NC group, while the HB group had increased WT-1 and GPR43 expressions v. the HC group. Western blot further confirmed this result (Fig. 6(a) and (b)). Consistently, our data show that protein levels of GPR43 were downregulated upon exposure to PA in MPC5 cells and were upregulated by butyrate treatment (Fig. 6(d)). To further elucidate whether GPR43 is involved in the protective effect of butyrate on podocytes, we downregulated GPR43 by GLPG0974, an antagonist of GPR43, and found GLPG0974 overrode butyrate-mediated increases in WT-1 and PGC-1α protein in podocytes (Fig. 4(e) and 5(g)). Moreover, GLPG0974 effectively blocked the butyrate-mediated increases of T-SOD and GSH as well as ATP production in MPC5 cells, suggesting that the protective effects of butyrate on podocytes were GPR43-dependent (Fig. 5(d), (e), (h)).
Sodium butyrate ameliorated podocyte injury via the activation of the GPR43-Sirt3 pathway. (a) Immunofluorescence of kidney sections stained with WT-1 (red) and GPR43 (green). Nuclei were counterstained with DAPI (blue). Scale bars, 20 μm. n 6 each group. (b) Western blot assays for the expression of GPR43 in the renal cortex of mice treated with or without butyrate. n 6–8 each group. (c) Immunofluorescence of kidney sections stained with Sirt3 (red). Nuclei were counterstained with DAPI (blue). Scale bars, 20 μm. n 6 each group. (d) Western blot assays of GPR43 and Sirt3 in the MPC5 cells incubated with or without butyrate, GLPG0974 or 3-TYP. PA, palmitic acid; But, butyrate; GLPG, GLPG0974, the inhibitor of GPR43; TYP, 3-TYP, the inhibitor of Sirt3. All values are shown as the means (sem). (b) a1 P < 0·05, a2 P < 0·01 v. NC group; b1 P < 0·05, b2 P < 0·01 v. NB group; c1 P < 0·05, c2 P < 0·01 v. HC group. (d) a1 P < 0·05, a2 P < 0·01 v. Control group; b1 P < 0·05, b2 P < 0·01 v. PA group; c1 P < 0·05, c2 P < 0·01 v. PA + But group. Statistical significances were determined by one-way ANOVA.

Next, we explored possible signalling molecules involved in the protective effects of butyrate on podocytes. Sirt3 is a crucial metabolic sensor that regulates mitochondrial homeostasis(Reference Morigi, Perico and Benigni28). As revealed by immunofluorescent staining assays, glomerular expression of Sirt3 was lower in HFD-fed mice, and butyrate supplementation markedly recovered its expression (Fig. 6(c)). In PA-treated MPC5 cells, downregulated Sirt3 was restored by butyrate, and both GLPG0974 and 3-TYP (the inhibitor of Sirt3) suppressed the expression of Sirt3, while 3-TYP failed to affect GPR43 expression, indicating that Sirt3 acts downstream of GPR43 (Fig. 6(d)). Further, 3-TYP treatment inhibited butyrate-induced increases in expression of WT-1, PGC-1α and levels of ATP, T-SOD and GSH in MPC5 cells (Fig. 4(e), Fig. 5(d), (e), (g), (h)). Taken together, these results suggested that the GPR43-Sirt3 pathway was involved in the renal protective effects of butyrate.
Discussion
Obesity is regarded as a major and independent risk factor for the development of chronic kidney disease. With the increased prevalence of obesity worldwide, ORG has become a global issue(Reference Xu, Sheng and Yao29). A retrospective study that evaluated native kidney biopsy samples received at Columbia University reported a 10-fold increase in the incidence of ORG from 0·2 % in 1986–1990 to 2·0 % in 1996–2000, with a further rise to 2·7 % in 2001–2015(Reference D’Agati, Chagnac and de Vries1,Reference Kambham, Markowitz and Valeri30) . Further, a recent study in China showed that the annual incidence of ORG increased from 0·86 % in 2009 to 1·65 % in 2018(Reference Hu, Quan and Wang31). However, there are currently limited effective treatment options for ORG. Here, paralleled with the gut–kidney axis theory, our experiments suggest that butyrate, an intestinal metabolite, prevents proteinuria, glomerulomegaly, mesangial expansion and renal fibrosis in HFD-fed mice, indicating its protective effects on ORG. Podocyte dysfunction is a prominent mediator in the pathogenesis of ORG(Reference D’Agati, Chagnac and de Vries1). Also, we found that butyrate increased podocyte density and improved its morphology and function in vivo and in vitro. To the best of our knowledge, this is the first report that explored the effects of butyrate on ORG.
Metabolic dysfunctions, such as hyperlipidaemia and insulin resistance, contribute to renal injury in ORG(Reference Wei, Li and Yu26). Insulin resistance leads to glomerular hyperfiltration and excessive sodium reabsorption, ultimately causing renal damage, endothelial dysfunction, increased vascular permeability and renal hypertrophy(Reference De Cosmo, Menzaghi and Prudente32). Lipid overload causes mitochondria damage and decreased AMPK activity, resulting in podocyte apoptosis(Reference Gao, Yin and Zhang33). Our data demonstrated the beneficial effects of butyrate on metabolic dysfunction in HFD mice without significant impact on food intake, indicating that the protective effects of butyrate on ORG are associated with its metabolic effects.
Kidneys are organs with continuous high-energy consumption. Mitochondrial injury plays a critical role in HFD-induced podocyte damage(Reference Szeto, Liu and Soong18). Here, we found that sodium butyrate supplementation inhibited oxidative stress and ameliorated mitochondrial damage in the kidneys of HFD mice. Also, in PA-induced MPC5, our data confirmed that butyrate increased mitochondrial biogenesis, maintained the integrity of the mitochondrial electron transport chain and protected mitochondrial function in podocytes. The roles of butyrate in regulating mitochondrial biogenesis have been reported in both skeletal muscle and brown adipose tissue(Reference Hong, Jia and Pan11,Reference Gao, Yin and Zhang33) . The present experiment provided the first evidence illustrating the effects of butyrate on mitochondrion in podocytes.
GPR43, also known as free fatty acid receptor 2, is one of the primary receptors for butyrate. The involvement of GPR43 in the mechanism of butyrate on kidney diseases has been suggested. Huang W et al. reported that butyrate inhibited renal fibrosis and mesangial matrix accumulation in diabetic nephropathy via GPR43-mediated inhibition of oxidative stress(Reference Huang, Man and Gao34). Of note in our experiment, GPR43 was demonstrated to be expressed in podocytes, and butyrate markedly increased the expression of GPR43 in HFD mice kidney and podocytes in vitro. In addition, the protective effects of butyrate on podocytes were compromised by a GPR43 inhibitor, suggesting that GPR43 is required for butyrate to exert a nephroprotective effect.
We then sought to elucidate the molecular effects downstream of GPR43. Sirt3 is known to regulate mitochondrial oxidative stress and is linked to kidney diseases(Reference Morigi, Perico and Benigni28). Wang Q et al. reported that Sirt3 overexpression alleviated renal ischaemia-reperfusion injuries through enhancing mitochondrial fusion(Reference Wang, Xu and Li35). Our results show that butyrate upregulated the expression of Sirt3 in PA-induced MPC5 cells and that mitochondrial-protective effects of butyrate were significantly offset by Sirt3 antagonist, supporting the notion that Sirt3 plays a critical role in the actions of butyrate on mitochondrial homeostasis in podocytes. Further, the GPR43 inhibitor decreased the expression of both GPR43 and Sirt3, indicating that Sirt3 may act as a mediator downstream of GPR43. Given the renoprotective activity of Sirt3 in counteracting mitochondrial dysfunction in podocytes, Sirt3-activator compounds, such as silybin, resveratrol and curcumin, may have a renoprotective effect on ORG.
Interestingly, our results showed that the concentration of serum butyrate in mice was about 1 μM∼10 μM, which is much lower than that we used in the MPC5 experiments (1·0 mM). The major discrepancy can be explained by several reasons. First, there are big differences between in vitro experiments and in vivo studies. The in vitro tests are not the same as actual cells or tissues and are used to simulate the real phenomenon. Second, we used MPC5 cell lines, a conditionally immortalised mouse podocyte clone(Reference Mundel, Reiser and Zuniga36). Such transformed cells may not act like normal physiological cells, so we could not expect the normal physiological response to butyrate. Third, the distribution of butyrate varies among different tissues(Reference Li, Li and Li24). For these reasons, it is inaccurate to extrapolate the dose levels we used in the MPC5 experiments to physiological butyrate levels. Nevertheless, the MPC5 experiments assist to discover the underlying molecular mechanisms of butyrate.
This study is not without limitations. Previous studies have shown the beneficial effects of butyrate on several renal diseases, with butyrate doses ranging from 100 mg/kg per 48 h to 1 g/kg per d(Reference Huang, Man and Gao34,Reference Du, Yang and Tang37) . Our study adopted a single dose of 300 mg/kg per d and found a renoprotective effect on ORG. Further researches are needed to determine whether there is a dose-dependent effect of butyrate on ORG. Furthermore, in addition to activating G protein-coupled receptors, butyrate also acts as an important regulator of histone acetylation and promotes histone acetylation by inhibiting histone deacetylase. It has been reported that butyrate prevents obesity-induced cognitive impairment by epigenetically enhancing H3K18ac(Reference Ge, Zheng and Hu38). Here our study discovered the involvement of GPR43 in the mechanism of butyrate on ORG, whether the epigenetic mechanisms are also involved in the renoprotective effect of butyrate remains to be explored.
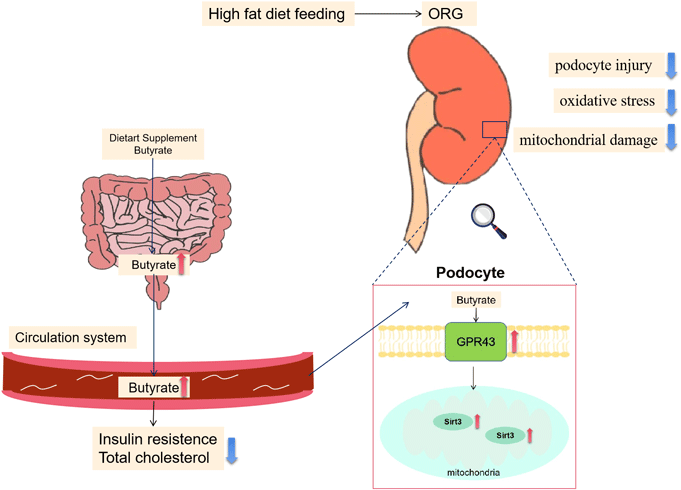
In conclusion, this study identified a novel mechanism that butyrate regulated mitochondrial function and protected podocyte injury via the GPR43-Sirt3 signalling pathway. These findings also suggest that therapeutic approaches, such as butyrate and other Sirt3 activators targeting podocytes, may have the potential for the treatment of ORG. On the other hand, the renoprotective effect of butyrate, one of the SCFA produced by gut microbiota, also revealed a close connection between the gut and the kidney. Therefore, interventions aimed at regulating metabolites of gut microbiota may provide therapeutic strategies for the treatment of ORG.
Acknowledgements
The work is supported by the National Natural Science Foundation of China (no. 82070884) and the Natural Science Foundation of Hunan Province (no. 2024JJ5550).
Y. S.: methodology, investigation, writing – original graft; L. X.: investigation; R. Z.: investigation; X. L.: investigation; F. Y.: methodology; X. X.: methodology; A. Q.: methodology; J. X., methodology; R. R.: writing – review and editing; D. Z.: conceptualisation, writing – review and editing, funding acquisition.
The authors declare that they have no financial/commercial conflicts of interest.
The datasets used and/or analysed during the present study are available from the corresponding author upon reasonable request.
All animal experiments in this study were conducted with the approval of the Animal Ethics Committee of the Xiangya Medical College of Central South University (no. 2021sydw0119).
Supplementary material
For supplementary material/s referred to in this article, please visit https://doi.org/10.1017/S0007114524002964.


