

The COVID-19 pandemic has exposed food system vulnerabilities and exacerbated household food insecurity. Underexplored in current literature are the vulnerabilities and insecurities that have manifested differently by geography. In 2019, food insecurity was highest among urban (12·4 %) and rural households (12·1 %), compared to suburban households (8·3 %), according to the US Department of Agriculture(Reference Coleman-Jensen, Rabbitt and Gregory1). Early estimates in the pandemic (May 2020) projected 54 million Americans (16 %) would experience food insecurity in 2020(Reference Gundersen, Hake and Dewey2).
Food insecurity is a complex public health issue shaped by socio-economic conditions, infrastructure and available resources – all of which vary by spatial contexts(Reference Piontak and Schulman3). Before the pandemic, for example, existing economic opportunities remained stagnant in rural compared to urban areas; lower population density in rural areas limited growth of supermarkets, whereas in urban areas, supermarket redlining worsened access to affordable healthy food; and insufficient transportation infrastructure hindered people’s ability to travel to available food sources in both urban and rural communities(Reference Cromartie, Dobis and Krumel4–Reference Zhang and Ghosh7).
The geographic patterns of food insecurity during the pandemic and their relationships with economic and mobility barriers across urbanicity are not well understood. While short-term food aid has mitigated some acute food supply chain and economic disruptions, long-term solutions are imperative to address the root causes of food insecurity. Failure to plan for long-term solutions will perpetuate pre-existing disparities in barriers to food acquisition that are likely to vary by levels of urbanicity. This study aims to address these knowledge gaps in the geographic patterns of food insecurity by investigating acquisition and mobility experiences of food-insecure individuals across urbanicity levels (i.e., urban, suburban, rural) in the early months of the COVID-19 pandemic.
Methods
We fielded a national survey to investigate food-related experiences among 2011 US adults (18 years or older) from June 17 to 29 2020 through the Harris Poll online omnibus survey panel (participation rate 90 %), an online platform that collects public opinion data monthly from millions of adults worldwide who are considered trusted panel partners and who have agreed to participate in survey research(8). Data were weighted using raking to reflect nationally demographic proportions (gender, age, race/ethnicity, education, marital status, income, household size, region) based on the US Census Bureau’s 2019 Current Population Survey(9), and propensity score weighting was used to adjust for respondents’ propensity to be online. A propensity score, developed by Harris Poll (email communication from Harris Poll staff in March 2021), allows researchers to adjust for attitudinal and behavioural differences between those who are online v. those who are not, those who join online panels v. those who do not and those who responded to this survey v. those who did not.
Food insecurity was determined by adapting the 2-item Hunger Vital Sign screening tool to ask about experiences in the COVID-19 pandemic(Reference Hager, Quigg and Black10). Respondents were categorised as food insecure if they responded affirmatively (often true or sometimes true v. never true) to either: (1) ‘In the past 30 days of the COVID-19 pandemic, I/we worried whether food would run out before getting money to buy more’ and (2) ‘In the past 30 days of the COVID-19 pandemic, the food I/we bought just didn’t last and I/we didn’t have enough more to get more’. Using questions designed by the authors, respondents also reported on one or more food sources where food was acquired, barriers to food acquisition and the most likely mode of transportation used when travelling to/from food sources. Socio-demographic characteristics, including urbanicity (resides in an urban area or city area; in a suburban area next to a city; in a small town or rural area) were self-reported.
Using chi-squared tests, we compared food insecurity across urbanicity levels (i.e., urban, suburban, rural) as well as food acquisition experiences and mobility across urbanicity levels among food-insecure adults. For measures related to where food was acquired, barriers to food acquisition and mobility to food sources, we calculated proportions and 95 %CI using Stata version 14.2.
Results
Almost half of respondents (n 922, 45·8 %) experienced food insecurity a couple of months after the coronavirus was declared a national emergency on13 March 2020. Food insecurity was most prevalent among households with an income below $35 000 (64·8 %; P < 0·001). By race, 69·3 % of Latinx and 62·2 % of Black respondents experienced food insecurity compared to 43·4 % of Asian and 37·7 % of White respondents (P < 0·001). The prevalence of food insecurity was highest among adults in urban (n 411, 62·3 %) areas, followed by rural (n 156, 40·5 %) and suburban (n 355, 36·7 %) areas (P < 0·001).
Food sources across urbanicity levels
In rural areas, a greater proportion of food-insecure adults acquired food from supercentres (61·5 %; 95 % CI 50·4 %, 72·5 %; P < 0·05), relative to food-insecure adults in suburban areas (42·4 %; 95 % CI 35·2 %, 49·6 %) (Fig. 1). Home or community gardens (14·5 %; 95 % CI 9·8 %, 19·2 %; P < 0·01) and food assistance programmes, such as food banks, (23·1 %; 95 % CI 16·9 %, 29·3 %; P < 0·01) were a more common source of food for food-insecure adults in urban areas compared to food-insecure adults in suburban areas where 4·6 % (95 % CI 2·4 %, 6·9 %) acquired food from gardens and 11·5 % (95 % CI 7·1 %, 16·0 %) acquired food from food assistance programmes. Locally sourced foods, comprising retail food cooperatives, local farms or farmers markets, were less common among food-insecure adults in rural areas (6·9 %; 95 % CI 0·01 %, 13·0 %) compared to urban areas (19·8 %; 95 % CI 14·3 %, 25·4 %; P < 0·01).
Sources of food for food-insecure adults by urbanicity (n 921). Error bars denote 95 % CI. * signifies significant difference from suburban. • signifies significant difference from rural. ![]() , urban (n 411);
, urban (n 411); ![]() , suburban (n 355);
, suburban (n 355); ![]() , rural (n 156)
, rural (n 156)

Barriers to food acquisition
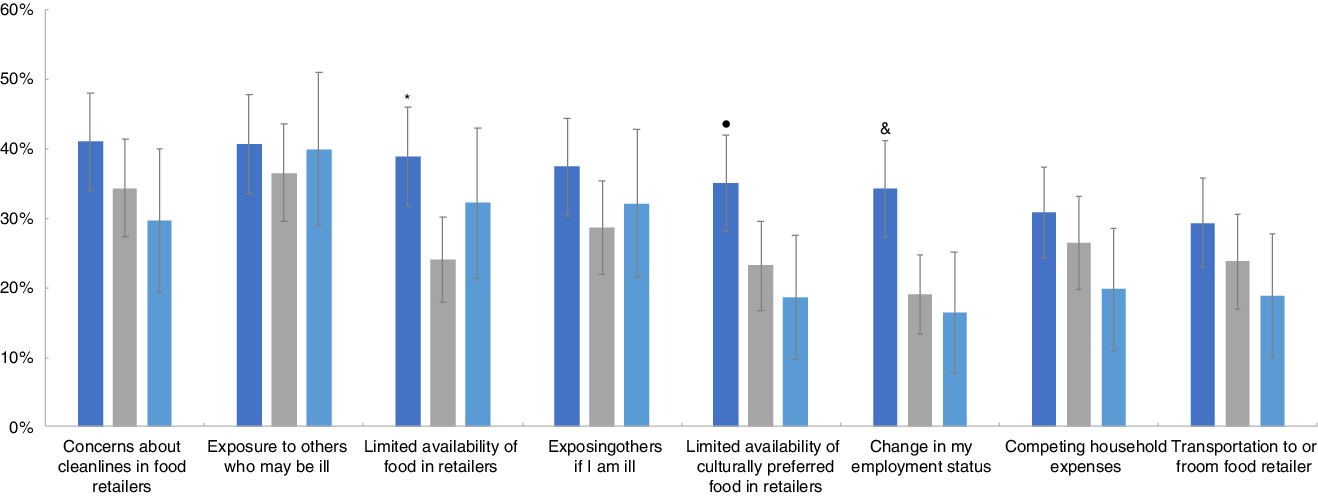
Regarding factors affecting individuals’ ability to acquire food, 34·2 % (95 % CI 27·2 %, 41·1 %; P < 0·0001) of food-insecure adults in urban areas reported change in employment status as a barrier, compared to 19·1 % (95 % CI 13·4 %, 24·8 %) in suburban and 16·3 % (95 % CI 7·6 %, 25·0 %) in rural areas (Fig. 2). Limited availability of food in retailers affected more food-insecure adults in urban areas (38·8 %; 95 % CI 31·7 %, 45·9 %; P < 0·001) compared to suburban areas (24·0 %; 95 % CI 18·0 %, 30·1 %). Food-insecure adults in urban areas (35·1 %; 95 % CI 28·2 %, 42·0 %; P < 0·0001) were also more constrained by limited availability of culturally preferred foods, relative to food-insecure adults in rural areas (18·7 %; 95 % CI 9·8 %, 27·5 %). Overall, about one in four food-insecure adults reported transportation as a limitation to food acquisition, though this barrier did not vary significantly by urbanicity.
Food acquisition barriers for food-insecure adults by urbanicity (n 921). Error bars denote 95 % CI. * signifies significant difference from suburban. • signifies significant difference from rural. & signifies significant difference from suburban and rural. ![]() , urban (n 411);
, urban (n 411); ![]() , suburban (n 355);
, suburban (n 355); ![]() , rural (n 156)
, rural (n 156)
Mobility to food sources
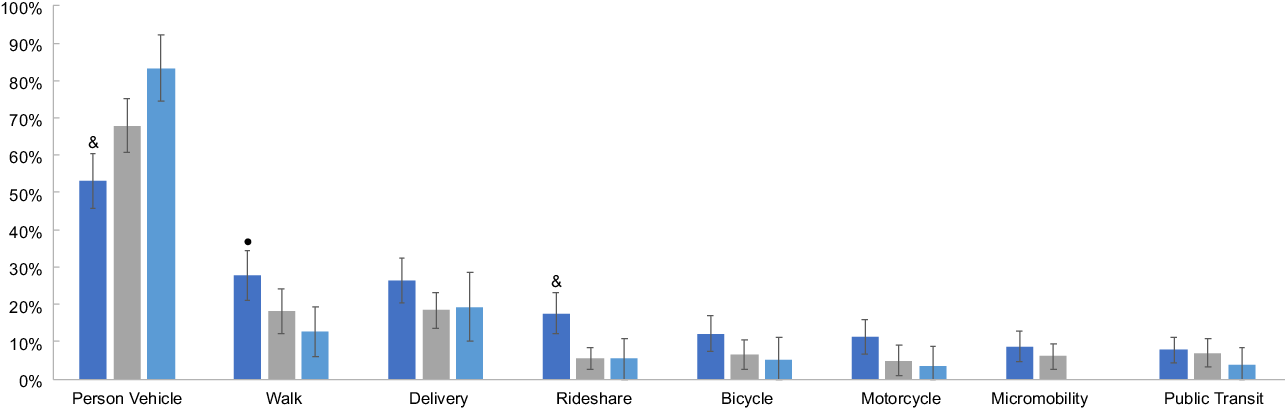
Food-insecure individuals reported utilising a range of transportation modes to acquire food from any food source. Across urbanicity, the use of a personal vehicle was the most common mode overall, and less common among food-insecure adults in urban areas (53·0 %; 95 % CI 45·7 %, 60·3 %; P < 0·0001) compared to those in suburban (68·0 %; 95 % CI 60·8 %, 75·1 %) and rural areas (83·3 %; 95 % CI 74·3 %, 92·2 %) (Fig. 3). Food-insecure adults in urban areas reported walking to a food source more commonly (27·8 %; 95 % CI 21·2 %, 34·3 %) than those in rural areas (5·9 %; 95 % CI 5·9 %, 19·4 %; P < 0·01). Rideshares to food sources were more common among food-insecure adults in urban areas (17·5 %; 95 % CI 12·1 %, 23·0 %; P < 0·01) compared to suburban (5·6 %; 95 % CI 2·7 %, 8·4 %) and rural areas (5·3 %; 95 % CI 0·0 %, 10·7 %). Delivery, bicycle, motorcycle, micromobility and public transit were less common modes of transportation to acquire food and did not vary significantly across urbanicity.
Mode of transportation used by food-insecure adults to acquire food by urbanicity (n 921). Error bars denote 95 % CI. • signifies significant difference from rural. & signifies significant difference from suburban and rural. ![]() , urban (n 411);
, urban (n 411); ![]() , suburban (n 355);
, suburban (n 355); ![]() , rural (n 156)
, rural (n 156)
Discussion
The results of this study further quantify acquisition and mobility challenges of food-insecure Americans during the COVID-19 pandemic, with important differences by urbanicity levels. We extend the literature on how food insecurity is shaped by socio-economic, spatial and infrastructure inequalities, which has important implications for integrated solutions to promote food security from urban to rural areas.
Our findings on the acquisition and barriers to food in urban and rural areas are consistent with previous literature. In rural areas, food-insecure individuals commonly reported food acquisition from supercentres (e.g., Walmart), reinforcing prior reports of the declining presence of local and independently owned grocery stores in rural towns in favour of the consolidation of large grocers on which rural residents rely(Reference Cho and Volpe11,Reference Palmer, Bonanno and Clancy12) . Importantly, fewer food stores also mean greater distances between stores in rural areas, suggesting that for some food-insecure individuals, limited access to a personal vehicle or public transportation is likely to exacerbate food insecurity(Reference Piontak and Schulman3). Relative to urban areas, locally sourced food was also less common in rural areas. Consistent with prior studies, our findings suggest that the growth for local food (e.g., farmers markets) in urban areas outpaces those in rural areas(Reference Low, Adalja and Beaulieu13). To address this gap, food advocates in the federal government, private sector and civil society have increased access to local food in the past decade by investing in produce incentives at farmers markets and supermarkets, the acceptance of the Supplemental Nutrition Assistance Program’s Electronic Benefits Transfer cards at farmers markets, and transportation infrastructure through new distribution systems, like mobile markets, that deliver locally sourced food to families with limited transportation(Reference Whittaker and Hodgson14,15) . This research points to opportunities for future work to explore solutions that could further strengthen food economies and address the underlying economic and infrastructural challenges of rural food insecurity.
Change in employment and limited availability of culturally preferred foods especially constrained food-insecure individuals in urban areas. These challenges underscore a need to expand understanding of food access towards one that is inclusive, enables greater agency and leverages income generation opportunities in various sectors of community food systems. Across the country, a growing number of farmers are providing culturally preferred foods to ethnically diverse populations in their respective city and surrounding region. One member organisation of Buffalo’s Seeding Resilience is Providence Farm Collective where Somali Bantu refugees resettled in Buffalo grow their heritage foods on land that is 20 miles outside the city(Reference Dewey16). Meanwhile, a network of Freedom Gardens is expanding backyard and front yard food production among Black, Indigenous and People of Colour in the City of Buffalo(Reference Raja17). In the Minneapolis-St. Paul area, Hmong farmers supply culturally preferred foods like long beans, bitter melon and amaranth greens in farmers markets serving the Twin Cities region(Reference Holt18). At the retail level, a food landscape study in a low-income urban neighbourhood of San Diego, with a diverse immigrant population, found that out of eighty-two food stores nearly half were ethnic markets providing access to fresh, affordable and culturally preferred foods(Reference Joassart-Marcelli, Rossiter and Bosco19).
Although our research generated new and important findings on food insecurity experiences across urbanicity, there are some limitations. The Harris Poll was not a probability-based panel and may be subject to selection bias towards individuals with internet access; however, its recruitment was national in scope and applied survey sampling weights to generate nationally representative estimates. The panel consisted of adults who were invited and agreed to participate online, which may have resulted in selection bias towards people with internet access and undercounting of some groups (e.g., individuals with lower income or living in rural areas); however, Harris Poll adjusted for respondents’ likelihood to be online using a propensity score weight. Responses were self-reported(Reference Bottino, Rhodes and Kreatsoulas20); however, our food insecurity measure was based on the previously validated 18-item US Department of Agriculture Household Food Security Survey, which limits the possibility of social desirability bias(Reference Hager, Quigg and Black10). Reports of locally sourced food and acquisition from home or community gardens may be underreported as data were collected early in the growing season. We performed a cross-sectional study and could not assess causal relationships between the pandemic and food-related experiences.
Conclusions
A planning approach that links urban and rural areas increases opportunities for food production, transportation and food distribution, building towards a more resilient and equitable food system for all Americans(Reference Mui, Khojasteh and Judelsohn21). In the wake of the pandemic, a more integrated food system can benefit food-insecure families and food producers by shortening supply chains, creating a reliable source of nutritious food and supporting economic development through the re-circulation of community income(22).
Proposed solutions will be most successful when they engage multiple sectors. Tackling socio-economic, spatial and infrastructure inequalities tied to food security will require public health public health advocates to band together with other disciplines, professions and sectors, including producers, distributors, retailers, economic development, transportation and government(Reference Mui, Khojasteh and Hodgson23). Future research should not only examine how these sectors can build synergy in advancing food security but also develop inclusive planning and decision-making processes to promote agency among those who are food insecure in urban, suburban and rural spaces.
Acknowledgements
Acknowledgements: The authors extend our gratitude to Kate Clancy for her insights and thoughtful review. Financial support: This research was supported in part by the Bloomberg American Health Initiative, Johns Hopkins Institute for Health and Social Policy and Johns Hopkins Center for Injury Research and Policy. Conflict of interest: There are no conflicts of interest. Authorship: Concept and study design: Y.M., K.P.P.; statistical analysis: Y.M., G.H.; interpretation of data: all authors; drafting of the manuscript: Y.M.; revision of the manuscript for critical intellectual content: all authors; supervision: Y.M., K.P.P. Ethics of human subject participation: This study was conducted according to the guidelines laid down in the Declaration of Helsinki, and all procedures involving human subjects/patients were approved by the Johns Hopkins Bloomberg School of Public Health Institutional Review Board (IRB No. 12644). Electronic consent was obtained from all subjects/patients who agreed to be screened to complete the survey, but prior to beginning the survey.


 Open access