


Introduction
The 10-item Autism-Spectrum Quotient (AQ10; Allison et al., Reference Allison, Auyeung and Baron-Cohen2012) is a popular measure of autistic traits used internationally in research (e.g., Taylor et al., Reference Taylor, Livingston, Callan, Hanel and Shah2021) and clinical practice (e.g., Weir et al., Reference Weir, Allison and Baron-Cohen2020). Recently, however, the AQ10 has attracted scrutiny, with research challenging its validity and utility. First, research has reported psychometric concerns with the measure, notably in studies published in Experimental Results. Taylor et al. (Reference Taylor, Livingston, Clutterbuck and Shah2020) found the AQ10 had low inter-item correlations and internal consistency, which also suggested that it was tapping into a myriad of constructs. Following Taylor et al. (Reference Taylor, Livingston, Clutterbuck and Shah2020), Bertrams (Reference Bertrams2021) found the AQ10 had low internal consistency and homogeneity, but that changing its scoring system from a 4- to 6-point response scale marginally improved its psychometric properties. Second, the AQ10’s cutoff—indicative of a clinically significant level of autistic traits—has been incorrectly applied. Waldren et al. (Reference Waldren, Clutterbuck and Shah2021) recently reported that the National Institute for Health and Care Excellence (NICE) had, for almost a decade, recommended the incorrect AQ10 cutoff value to screen for autism (≥7 instead of ≥6, based on Allison et al., Reference Allison, Auyeung and Baron-Cohen2012). This error has generated confusion among researchers and clinicians who administer the AQ10 in their work, with evidence of several studies (e.g., Payne et al., Reference Payne, Maras, Russell and Brosnan2020; Rahman et al., Reference Rahman, Kessler, Apperly, Hansen, Javed, Holland and Hartwright2021) using the incorrect cutoff value (see Waldren et al., Reference Waldren, Livingston, Clutterbuck, Callan, Walton and Shah2022).
NICE has now corrected their guidance (NICE, 2021), and Bertram’s 6-point response scale has potential to improve the AQ10, together helping to improve the measure’s psychometric validity and utility. This is critical given that the AQ10 is deeply entrenched in both research and clinical practice. Adding to this research, the current study aims to further investigate the AQ10, toward providing users with insights about the utility of its individual items. Previous research on the AQ10 has focussed on overall AQ10 scores, where the measure is administered as a standalone instrument. In practice, however, certain AQ10 items are used as tools to structure clinical interviews and inform referrals and clinical formulation, rather than all items being administered rigidly and treated equally (NICE, 2021; Weir et al., Reference Weir, Allison and Baron-Cohen2020). While this flexible use of the AQ10 can itself be problematic, it reflects the concerns with the utility of overall AQ10 scores (e.g., Ashwood et al., Reference Ashwood, Gillan, Horder, Hayward, Woodhouse, McEwen, Findon, Eklund, Spain, Wilson, Cadman, Young, Stoencheva, Murphy, Roberston, Charman, Bolton, Glaser, Asherson, Simonoff and Murphy2016) and, equally, points toward the benefit of an individualized approach in time-limited clinical sessions. For example, alongside total AQ10 scores, zooming in on items most relevant to an individual’s profile might help inform further assessments and/or interventions. The potential utility of item-specific use of the AQ10 has, however, not been well investigated.
We propose that a closer inspection and better understanding of the individual items in the AQ10—specifically the interrelationships between them—will speak to enhancing the utility of the measure. To this end, network analysis offers a powerful tool to examine the unique relationships between items and the influence each item has over the larger network. A network consists of nodes (i.e., circles), which represent the individual items in the network, and edges (i.e., connecting lines), which represent the unique conditional relationship between two nodes when accounting for all other relationships in the network. Using this approach, the strongest/weakest connections between AQ10 items can be identified and the relative importance of each AQ10 item for the network examined (Borsboom et al., Reference Borsboom, Deserno, Rhemtulla, Epskamp, Fried, McNally, Robinaugh, Perugini, Dalege, Costantini, Isvoranu, Wysocki, van Borkulo, van Bork and Waldorp2021; Epskamp et al., Reference Epskamp, Borsboom and Fried2018; Hevey, Reference Hevey2018). To our knowledge, this will be the very first network analysis of AQ10 data, which follows increasing and innovative use of this approach for understanding neurodivergent traits (e.g., Farhat et al., Reference Farhat, Brentani, de Toledo, Shephard, Mattos, Baron-Cohen, Thapar, Casella and Polanczyk2021).
Methods
Ethical approval was granted by the local ethics committee (Project code: 19-025). Utilizing open-access data from Gollwitzer et al. (Reference Gollwitzer, Martel, McPartland and Bargh2019), the current dataset included binarized AQ10 item responses from 6,595 nonclinical participants (AQ10: M = 3.01, SD = 1.71). We maintained binarized scoring to reflect the scoring system used most widely in clinical settings (see Allison et al., Reference Allison, Auyeung and Baron-Cohen2012). Analyses were performed in R 4.1.3 (R Core Team, 2022).
To investigate the interrelationships and influence of each item within the AQ10, a weighted, nondirectional network was created, whereby each node represents one AQ10 item, and each edge represents the unique conditional relationship between two items (IsingFit, van Borkulo et al., Reference van Borkulo, Epskamp and Robitzsch2016). Logistic regression was used to assess the association between AQ10 items and LASSO regularization was implemented to ensure only significant associations were retained in the final model (Barber & Drton, Reference Barber and Drton2015; Epskamp et al., Reference Epskamp, Borsboom and Fried2018).
Nonparametric bootstrapping (1,000 resamples), with 95% confidence intervals (CIs), assessed the accuracy of the network’s edge weights. Differences in edge weight were statistically compared using the bootstrapped edge weight difference test (bootnet, Epskamp et al., Reference Epskamp, Borsboom and Fried2018). To investigate the relative importance of each node in the network, multiple centrality measures were inspected. One-step Expected Influence indicates the strength of a node’s connections through the sum of its edge weights when accounting for association direction. Closeness indicates the proximity of a node’s connections through the shortest path length (number of edges) needed to connect with all nodes in the network. Betweenness indicates the influence of a node over other associations, characterizing the frequency it falls within the shortest path of other nodes (Bringmann et al., Reference Bringmann, Elmer, Epskamp, Krause, Schoch, Wichers, Wigman and Snippe2019; Robinaugh et al., Reference Robinaugh, Millner and McNally2016). Centrality stability was assessed through case-drop bootstrapping (1,000 resamples), with resultant correlation stability coefficients (CS) of >0.50 (minimum CS > 0.25) indicating sufficient stability (Epskamp et al., Reference Epskamp, Borsboom and Fried2018).
Results
There were no missing data and the distribution of AQ10 scores is provided in Supplementary Figure S1. Of the 45 possible edges, 28 (62.22%) showed nonzero associations with a mean edge weight of 0.24 (Figure 1). Estimated edge weights were largely positive (N = 23, 82.14%, Range [0.03, 1.66]), with 5 (17.86%) edges representing negative associations (Range [−0.33, −0.11]).
Network analysis of the 10-item Autism-Spectrum Quotient (AQ10) items. Each node (circle) represents its corresponding numeric AQ10 item, colored to its subscale membership. Edges (lines) represent the nonzero conditional relationships between two nodes when accounting for all others in the network. Association direction (blue = positive, red = negative) and strength (line thickness) are shown (qgraph, Epskamp et al., Reference Epskamp, Cramer, Waldorp, Schmittmann and Borsboom2012).
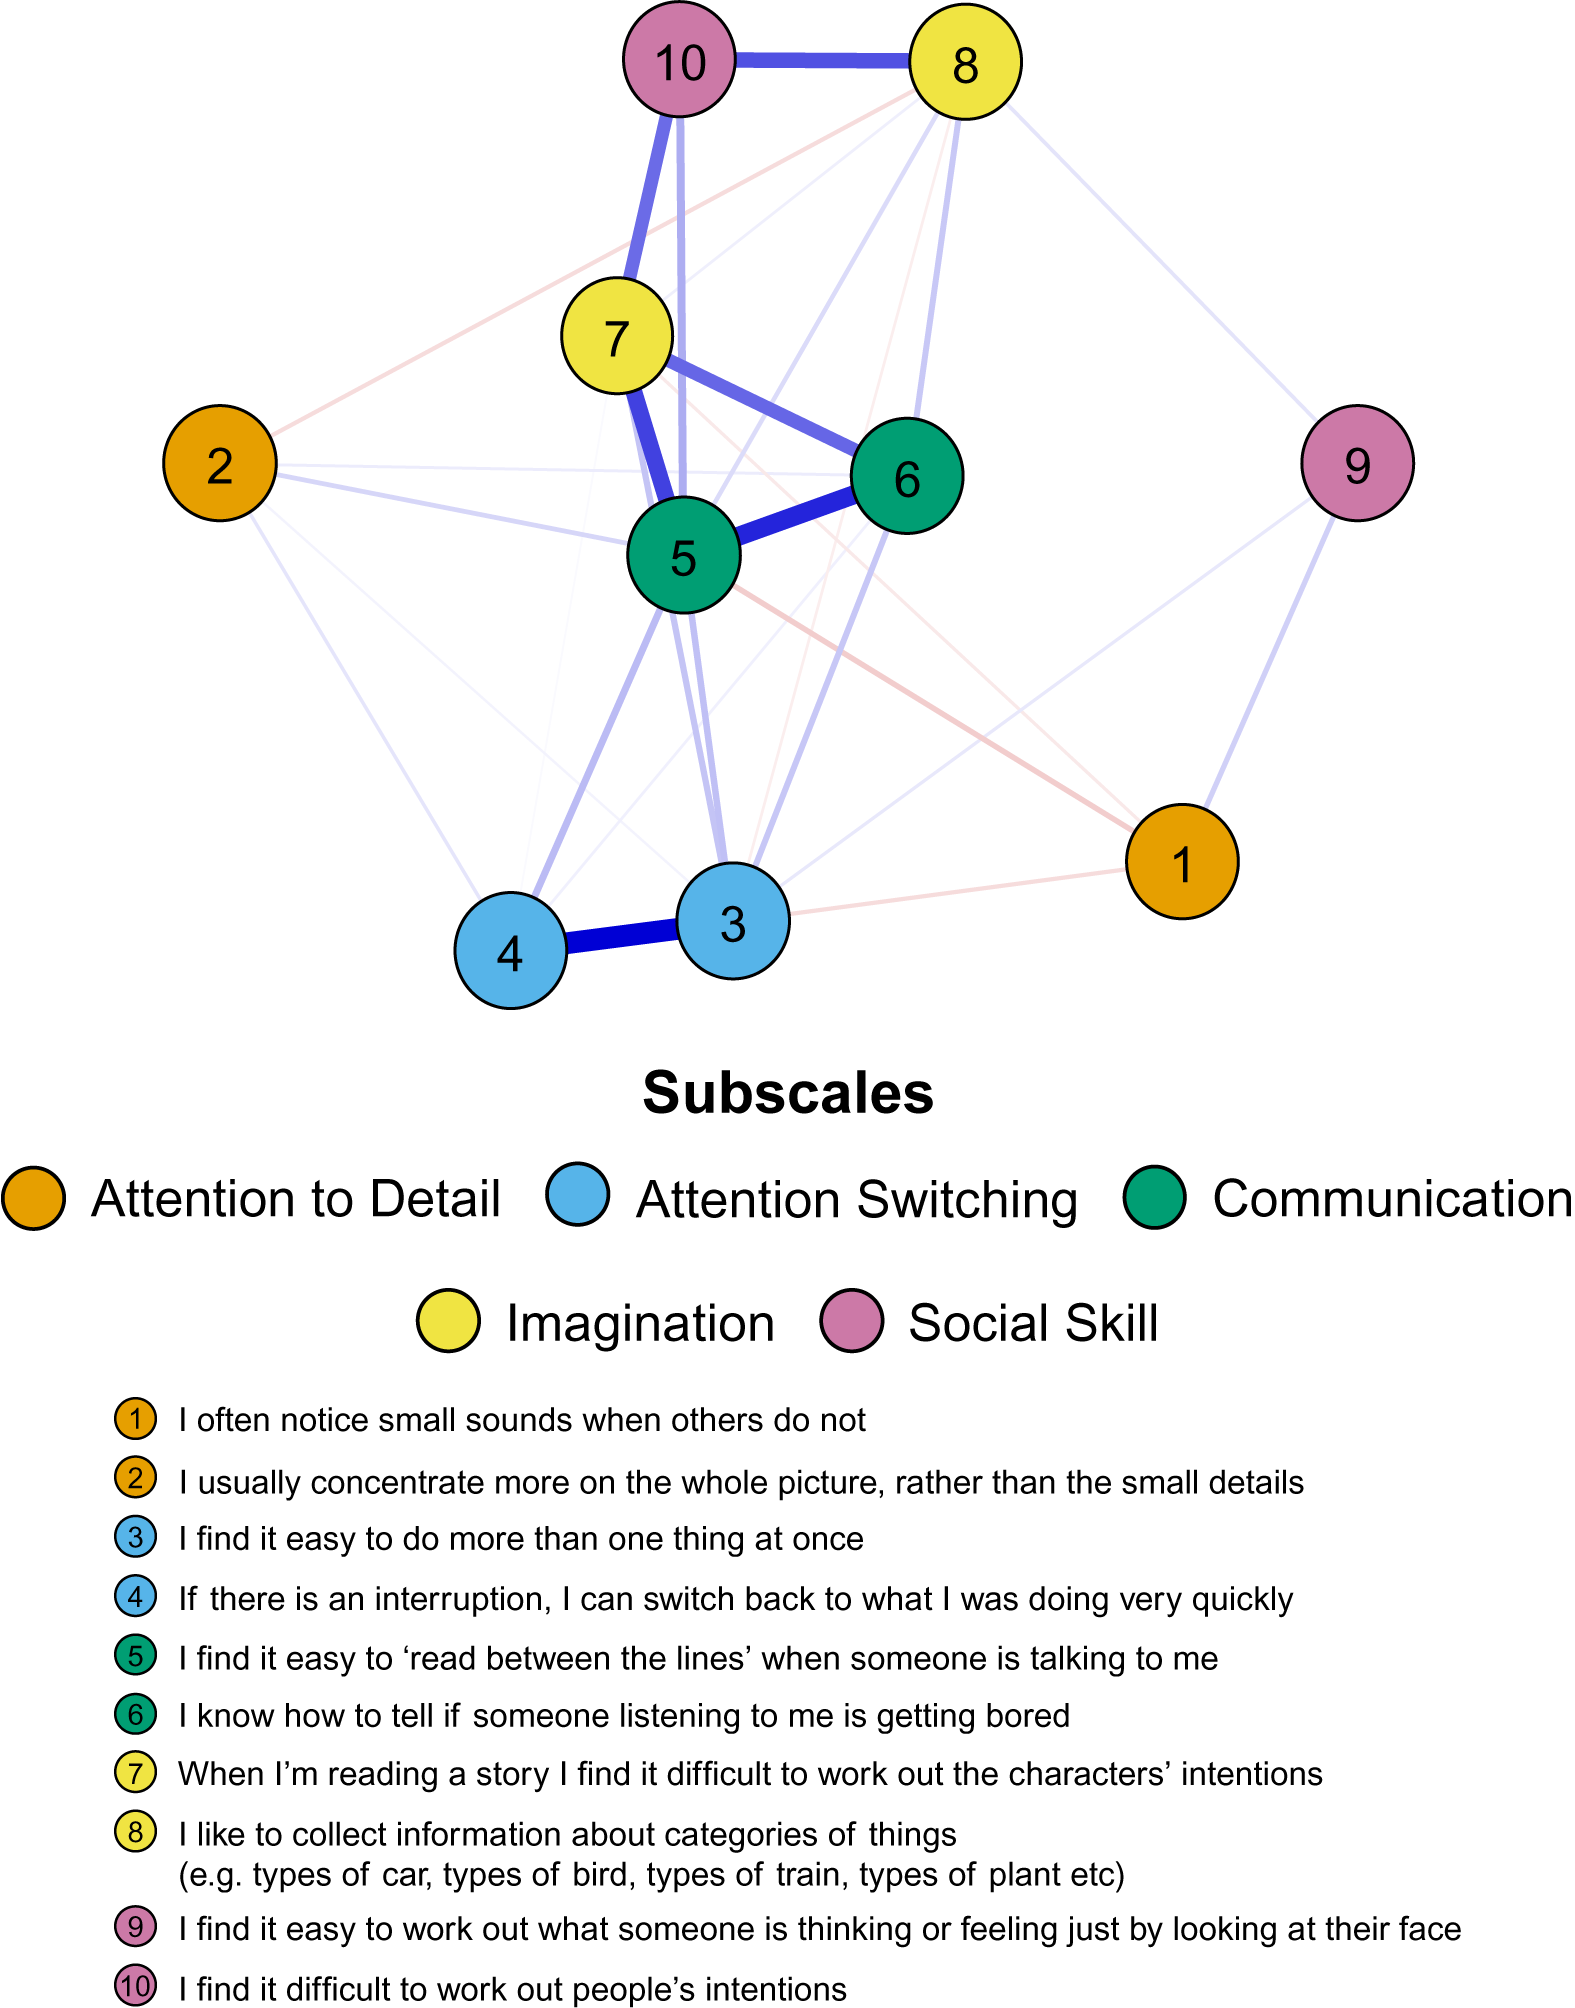
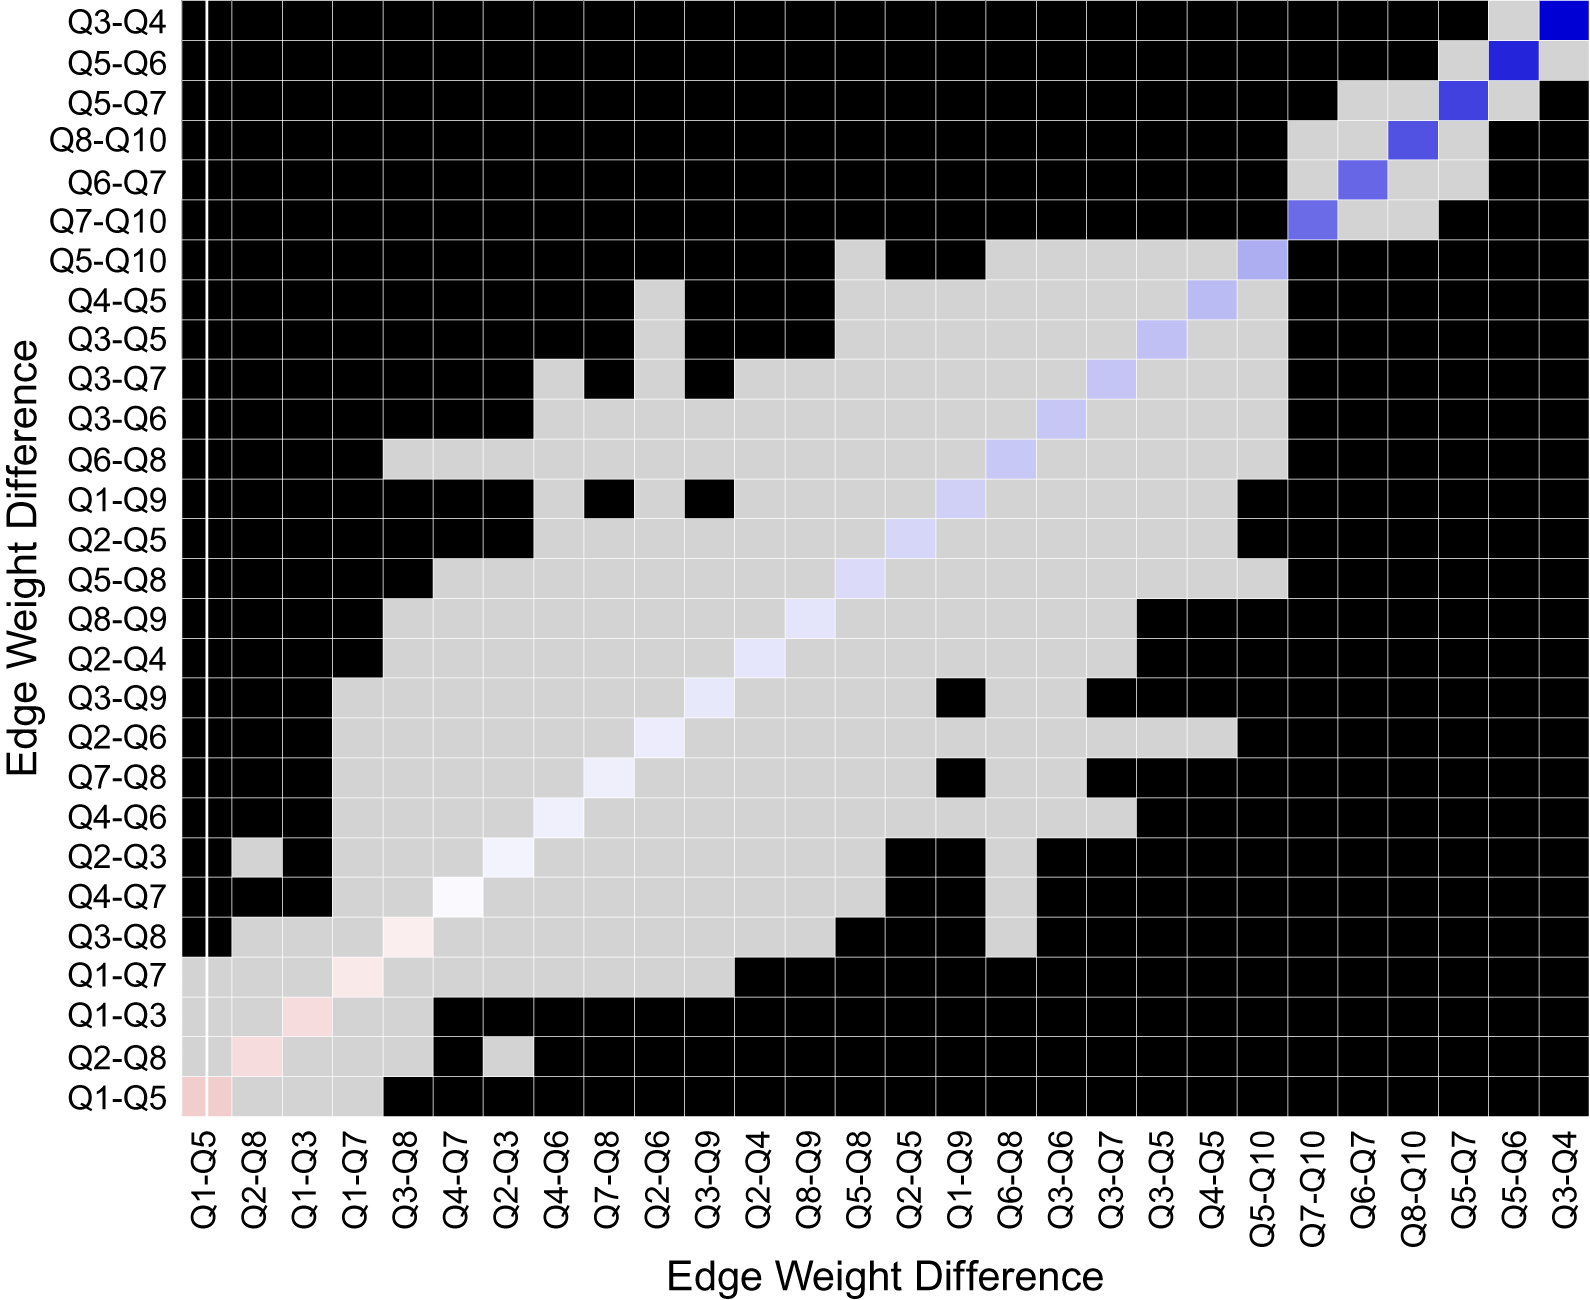
Nonparametric bootstrapping suggested that edge weights were determined with acceptable accuracy (Supplementary Figure S2). The strongest relative associations were found within the attention switching (Item3–Item4 = 1.66) and communication (Item5–Item6 = 1.42) subscale items, with strong associations also found between (a) communication and imagination (Item5–Item7 = 1.24; Item6–Item7 = 1.00) and (b) social skill and imagination (Item8–Item10 = 1.13; Item7–Item10 = 0.97) subscale items (see Supplementary Table S1 for all edge weight values). Edge weight difference tests found that the abovementioned six associations were significantly larger than most others in the network (Figure 2). The two strongest within subscale associations (i.e., the association between the attention switching items and the association between the communication items) did not significantly differ in edge weight (95% CIs [−0.48, 0.05]). However, they were still larger than the greatest associations between subscales (see Supplementary Table S2).
Edge weight difference test using 95% confidence interval bootstrapping with 1,000 resamples. Black squares indicate a significant difference between the edge weights, and gray squares indicate no significant difference. Edges are arranged in order of association strength (pink = weak association, blue = strong association).
Case-drop bootstrapping indicated that, while measures of closeness (CS = 0.28) and betweenness (CS = 0.36) met the minimal levels of acceptance, they did not reach the preferred stability level of CS > 0.50 (Supplementary Figure S3). When considered in addition to research questioning the appropriateness of these measures in psychological research (Bringmann et al., Reference Bringmann, Elmer, Epskamp, Krause, Schoch, Wichers, Wigman and Snippe2019), we only report expected influence (CS = 0.75), with metrics for closeness and betweenness centrality available in Supplementary Figure S4 and Table S3. Item5 (z = 1.39), Item7 (z = 0.96), and Item6 (z = 0.82) showed the greatest expected influence across the network, while Item1 (z = −1.67) and Item2 (z = −1.13) showed the least expected influence across the network (Figure 3, see Supplementary Table S3 for centrality values).
Expected influence centrality (z-score) for each AQ10 item, colored to their associated subscale.

Discussion
The current study investigated the AQ10 at the individual item level using network analysis, toward informing the utility of the measure. The resulting network showed largely positive and well-connected associations, with the strongest connections found between intra-subscale items. The strongest inter-subscale associations were found between communication, social skill, and imagination items, which also showed the strongest expected influence centrality (i.e., the strongest connections with other nodes in the network).
The network showed widespread connectivity after accounting for network sparsity (Epskamp et al., Reference Epskamp, Borsboom and Fried2018). Strong associations between intra-subscale items, specifically attention switching and communication, suggest that individuals may typically show multiple autistic traits within a trait domain. Strong connections between social skill and communication items also align with the social communication differences inherent to autism (American Psychiatric Association, 2013). While Item7, within the imagination subscale, also connected strongly to social skill and communication items, a closer inspection of the item wording—“When I’m reading a story, I find it difficult to work out the characters’ intentions”—demonstrates it too reflects social communication challenges. Moreover, this follows the latest autism diagnostic criteria, where imagination differences fall under the broader “social communication and interaction” criterion (American Psychiatric Association, 2013). Overall, the current edge weight associations indicate items reflecting social communication differences are strongly interconnected within the AQ10. This suggests that the various socially relevant autistic traits might feed into one another and, potentially, that clinical intervention with one might have knock-on consequences for others.
When investigating network centrality, Item5—“I find it easy to ‘read between the lines’ when someone is talking to me”; Item6—“I know how to tell if someone listening to me is getting bored”; and Item7—“When I’m reading a story, I find it difficult to work out the characters’ intentions” showed greatest expected influence, indicating that these items are most connected to other nodes in the network. Such information could in turn inform clinical practice, for it may be likely that an individual scoring highly on these particular items will also have an overall higher total AQ10 score because of this greater connectivity to items across the network. Items 5, 6, and 7 also tap into challenges with theory of mind (ToM), the ability to understand others’ minds. Interestingly, these items with greatest centrality in the AQ10 broadly correspond with the Four-Item Mentalising Index, a recently developed self-report measure of ToM (Clutterbuck et al., Reference Clutterbuck, Callan, Taylor, Livingston and Shah2021; Reference Clutterbuck, Livingston and Shah2022). Our findings suggest the possibility that ToM-associated differences are key markers for indicating overall levels of autistic traits, aligning with theories that ToM differences are crucial for understanding autism (Livingston et al., Reference Livingston, Carr and Shah2019; Reference Livingston, Shah, White and Happé2021; Livingston & Happé, Reference Livingston, Happé, Ferguson and Bradford2021).
We investigated the AQ10 as scored in the binary manner used in clinical settings; however, the network relationships may differ with continuous scoring, including the recently proposed 6-point Likert scale (Bertrams, Reference Bertrams2021). The 6-point scale was not available in the current open-access dataset, but further investigation of this AQ10 scale, using network analysis, would be an interesting avenue for future research. Given its brevity, the AQ10 also measures a limited range of autistic traits. Therefore, our study may have overlooked other clinically important traits (e.g., sensory differences). Further evaluation of the AQ10, in comparison to emerging autism trait measures (e.g., The Comprehensive Autistic Trait Inventory; English et al., Reference English, Gignac, Visser, Whitehouse, Enns and Maybery2021), will of course be required to continually assess the AQ10’s utility in both research and clinical practice.
Conclusions
The current research aimed to extend efforts to inform the utility in the AQ10 by focussing on the interrelationships between its items through network analysis. The network showed strong interrelationships between items pertaining to communication, imagination, and social differences, and the items with greatest influence on the network conceptually corresponded to ToM differences. Our findings align with common cognitive models of autism and suggest that the utility of the AQ10 could be enhanced by focusing on specific items—as part of a system of autistic traits—in addition to the overall AQ10 score.
Supplementary Materials
To view supplementary material for this article, please visit http://doi.org/10.1017/exp.2022.7.
Data availability statement
Data are available at https://osf.io/4pd2m/?view_only=db1650b2e86240ddb7a6158a96f6abf5.
Funding statement
L.H.W. is supported by a doctoral studentship from the Economic and Social Research Council. L.A.L. is supported by a fellowship from The Waterloo Foundation.
Conflicts of interest
The authors have no conflicts of interest to declare.
Authorship contributions
Conceptualization (Equal): L.H.W.and P.S.; Conceptualization (Supporting): L.A.L.; Data curation (Lead): L.H.W.; Formal analysis (Lead): L.H.W.; Formal analysis (Supporting): F.Y.N.L. and P.S.; Funding acquisition (Supporting): L.H.W. and L.A.L.; Funding acquisition (Lead): P.S.; Investigation (Lead): L.H.W.; Investigation (Supporting): F.Y.N.L. and P.S.; Methodology (Lead): L.H.W.; Methodology (Supporting): F.Y.N.L. and P.S.; Project administration (Supporting): L.A.L.; Project administration (Lead): P.S.; Resources (Lead): P.S.; Software (Lead): L.H.W.; Supervision (Supporting): L.A.L.; Supervision (Lead): P.S.; Visualization (Lead): L.H.W.; Visualization (Supporting): F.Y.N.L.; Writing—original draft (Lead): L.H.W.; Writing—original draft (Supporting): P.S.; Writing—review and editing (Equal): L.A.L. and F.Y.N.L.


 Open access
Comments
Comments to the Author: The submission presents an extremely well written article in which researchers describe network analysis of AQ10 in a large sample. This approach is an appropriate framework to evaluate item-level characteristics of the AQ10 and the authors were able to clearly indicate this in their Introduction. The findings also stimulated an interesting discussion. I do not have comments for those sections.
Regarding the Methods/Results, I would welcome it if authors could clarify the following points:
1)The AQ10 is an ordinal scale, but here authors opted to dichotomize answers. It would be important to indicate what answers were coded as 1/0 and why authors opted to do this instead of using the ordinal variable.
2)Because of the large sample size and small number of variables, regularization is likely not necessary and there has been a recent simulation study corroborating that unregularized approaches are optimal for datasets such as yours https://pubmed.ncbi.nlm.nih.gov/34843277/ I think setting the tuning parameter to 0 would be an acceptable approach to address this point (e.g., as a sensitivity analysis).
3)Please clearly indicate what packages were used for network estimation and plotting. Does qgraph estimate IsingFit networks?
4)The 95% CI (pages 5-6) are not interpretable because of lasso; I suggest authors present the estimated edge weight instead.
5)Change word ‘significant edge weights’ to ‘estimated edge weights’