In recent years, an increasing number of studies have been conducted on the relationship between thyroid function and bone health. Such studies are mainly carried out from two aspects. One direction is regarding the relationship between thyroid hormones (THs) and bone health. Some studies recognized that THs play a critical role in bone development and bone maintenance, and the increase of THs is a risk factor for decreases in bone mineral density (BMD)(Reference Bassett and Williams1–Reference Baran3). In the second direction, increasing evidence shows that thyroid stimulating hormone (TSH) can directly act on bone. TSH binds to TSH receptors on the osteoblast and osteoclast precursors, and mediates skeletal remodeling, osteoblastic bone formation, and osteoclastic bone resorption(Reference Abe, Marians and Yu4–Reference Kim, Khang and Koh6). Recent studies have begun to explore the correlation between thyroid status and bone health from a novel perspective: sensitivity to thyroid hormone. Studies have found that the sensitivity to thyroid hormone is strongly associated with the prevalence of osteoarthritis(Reference Chen, Sun and Zhou7). Other studies found an approximate U-shaped relationship between the sensitivity to thyroid hormone indices and osteoporosis risk in euthyroid patients with type 2 diabetes mellitus(Reference Wu, Zhai and Chang8).
From the above content we know that thyroid function plays significant roles in the growth and development of bone, and an imbalance of thyroid function can impair bone homeostasis. The nutrient with a direct impact on thyroid function is iodine. Iodine is a micronutrient that is essential for the production of THs. Iodine is mainly absorbed through food and water to meet the need of the human body(Reference O’Kane, Mulhern and Pourshahidi9). The iodine nutrition status of the body can significantly affect thyroid function through two ways. Iodine deficiency can significantly increase the prevalence of hyperthyroidism and hypothyroidism(Reference Zimmermann and Boelaert10,Reference Laurberg, Cerqueira and Ovesen11) . In addition, the relationship between excess iodine and thyroid function should not be ignored. Excess iodine exposure can cause hyperthyroidism and is also a risk factor for subclinical hypothyroidism and hypothyroidism(Reference Leung and Braverman12). Moreover, excess iodine may cause subclinical hypothyroidism to develop into permanent hypothyroidism(Reference Li, Teng and Ba13).
Iodine affects thyroid function and thyroid function affects bone health. Therefore, what is the relationship between iodine and bone health? Therefore, this study proposes the following hypotheses: iodine nutrition (iodine deficiency and iodine excess) is associated with bone metabolism and bone health (BMD and the prevalence of osteopenia and osteoporosis). Some studies have explored the effects of iodine intake on bone disease, but there are few studies on the relationship between iodine nutrition status and bone health in Chinese residents. China is a developing country with a complicated geographical distribution. In most areas of China, the median water iodine concentration (MWIC) is low (<10 µg/l), with iodine in the environment not meeting the needs of the human body. In such areas, residents have been severely affected by iodine deficiency disorders. After nearly 30 years of Universal Salt Iodization (USI), we sought to assess what the bone health status of residents in these areas are. A total of 40·65 million residents live in areas with iodine excess (MWIC > 100 µg/l)(Reference Zhou, Liu and Jin14). The iodine nutrition of residents in those areas mainly comes from drinking water. Does long-term residence in iodine excess areas have any effect on bone metabolism among residents? Considering that thyroid dysfunction may act as a confounding factor in the association between iodine nutrition and bone health. So, we controlled for thyroid dysfunction as a confounding factor in our study. In summary, the main objective of this study was to explore the relationships between iodine nutrition status, bone metabolism and bone diseases in thyroid disease-free adults in China.
Materials and methods
Survey areas and subjects
According to recent data from national iodine deficiency disorder surveillance and water iodine surveillance efforts in China(Reference Wang, Wan and Liu15), we chose three areas with different water iodine concentrations in Shandong province to conduct an epidemiological study in 2020. As shown in Fig. 1(a), a multi-stage stratified random sampling method was used in this study. In the first stage, three districts/counties were randomly selected based on the three different water iodine regions in Shandong Province (Mudan District, Jiaxiang County, and Weishan County). In the second stage, 1–2 villages were randomly selected from each district/county. In the final stage, eligible individuals who met the inclusion criteria were randomly selected and stratified by age and sex. Information on the investigated areas was shown in Fig. 1(b). The detailed classification of the three areas was as follows: (1) Dongtan and Qianlv villages in Jiaxiang County located in Jining City were selected as iodine fortification areas (IFA) with MWIC ≤ 10 µg/l and a rate of qualified iodized salt > 90 %. These areas were iodine-deficient areas until the implementation of universal salt iodization in 1995, the concentration of iodized salt in these areas at the time of the survey was 25 mg/kg (fluctuation range ± 30 %). (2) Liuxiangzhuang and Dongding villages in Weishan County of Jining City were selected as iodine adequate areas (IAA) with 40 ≤ MWIC ≤ 100 µg/l and non-iodized salt supplied. (3) Jieyuanji village in Mudan District of Heze City was selected as iodine excess areas (IEA) with MWIC > 100 µg/l and non-iodized salt supplied.
Geographical distribution map of survey areas and subjects. (a) Selection process of the survey areas; (b) The details of the location of the survey areas.

The sample size was computed using the following formula: N = Z2 α/2P(1–P)/d2 (α = 0·05, d = 0·05), and a national epidemiological survey showed the prevalence of osteoporosis was 32·1 %(16). Based on the calculation, this study required a sample size of approximately 335 adults in each water iodine area, as determined with PASS (version 11). The inclusion criteria for subjects were as follows: (1) aged 18 years or older; (2) resided in the survey area for at least 5 years; (3) euthyroidism. The exclusion criteria were as follows: (1) pregnant or lactating females; (2) incomplete data or samples were not available; (3) ongoing use of medications or therapy that may interfere with thyroid function tests or bone metabolism, such as anti-thyroid medications, calcium, and vitamin D supplements; (4) study subjects with thyroid dysfunction, positive thyroid peroxidase antibodies (TPOAb) or thyroglobulin antibodies (TGAb), or a family history of thyroid or bone disease. According to the inclusion and exclusion criteria, a total of 1207 subjects (835 females and 372 males) participated in the study, including 391 eligible people from IFA, 395 people from IAA, and 421 from IEA.
In this study, a standard questionnaire was designed to acquire demographic information from survey subjects, including sociodemographic and lifestyle characteristics. Questionnaires were collected by investigating staff who had passed their performance assessment and were supervised by members of the Steering Committee. The basic information of the subjects was recorded including gender (male and female); age; education (less than high school, high school, and more than high school); family per capita annual income (<10 000 yuan, 10 000–30 000 yuan and >30 000 yuan); Smoking status was categorized into two groups: no or yes (an individual is a smoker if he/she smokes at least 1 cigarette per day for > 1 month)(17,Reference Kann, Steven and Barbara18) ; Alcohol consumption was divided into two groups: no or yes (if a person drinks at least once a week for > 1 year, the individual is considered an alcohol consumer)(Reference Im, Wright and Ling19,Reference Im, Millwood and Chen20) ; The body mass index (BMI; height/weight2 [kg/m2]) was classified according to the Chinese Public Health Standards as follows: underweight, BMI < 18·5 kg/m2; normal weight, 18·5 ≤ BMI < 24·0 kg/m2; overweight, 24·0 ≤ BMI < 28·0 kg/m2; and obese, BMI ≥ 28·0 kg/m2(Reference Chen, Zhao and Yang21,Reference Wan, Qu and Wu22) . The diseases history of the subjects was recorded including thyroid related diseases, tumor, hypertension, diabetes; hyperuricemia, parathyroid diseases and stroke. Endorsed informed consent was acquired from each participant, and the study protocol was approved by the Ethics Review Committee of Harbin Medical University (hrbmuecdc20200320).
Thyroid function testing
Venous blood was collected from participants after fasting for 8 h. free triiodothyronine (FT3), free thyroxine (FT4), TSH, TPOAb and TGAb were measured using chemiluminescent immunoassays (Siemens Healthcare Diagnostics Inc., Tarrytown, NY, USA). According to the kit manufacturer’s instructions, the reference ranges of thyroid function were as follows: 0·27 mIU/l < TSH < 4·20 mIU/l; 12·0 pmol/l < FT4 < 22·0 pmol/l; 2·8 pmol/l < FT3 < 7·1 pmol/l. Thyroid antibodies were detected when they were above specific levels (TPOAb ≥ 60·0 IU/ml; TGAb ≥ 60·0 IU/ml).
Measurement of nutritional iodine status
According to the sampling method of iodine in residential drinking water. Two parallel samples were collected from east, west, south, north, and central locations with a dispersed water supply (IFA). For central water supply areas (IAA and IEA), two parallel tap water samples were collected. Each water sample was at least 15 ml and stored at 4°C. The MWIC was determined using the As3–-Ce4+ catalytic spectrophotometry method, as recommended by the National Reference Laboratory for Iodine Deficiency Disorders (NRLIDD) and the Chinese Center for Disease Control and Prevention. Internal quality control samples for water iodine were provided by the Chinese NRLIDD.
Urine samples were collected in the morning and measured using the As3+-Ce4+ catalytic spectrophotometry method, according to the China Health Standard (WS/T107·1–2016). According to the World Health Organization (WHO)/United Nations International Children’s Emergency Fund (UNICEF)/Iodine Global Network (IGN), a median urine iodine concentration (UIC) < 100 μg/l was defined as iodine deficiency; 100 μg/l ≤ UIC ≤ 199·99 μg/l was defined as iodine adequacy; 200 μg/l ≤ UIC ≤ 299·99 μg/l was defined as iodine above the requirements, and a UIC ≥ 300 μg/l was defined as iodine excess. Serum iodine concentration (SIC) was measured using inductively coupled plasma mass spectrometry. According to the WHO, the normal rage of SIC was 45–90 μg/l(Reference Jin, Jiang and Liu23).
Determination of the levels of serum Ca2+, PO43– and alkaline phosphatase (ALP)
A HITACHI 3110 biochemical analyzer (Hitachi Ltd, Tokyo, Japan) was used to measure the levels of Ca2+, PO43–, and ALP. The normal reference ranges of bone metabolic parameters were as follows: 2·0 ≤ Ca2+ ≤ 2·5 mmol/l; 0·90 ≤ PO43– ≤ 1·34 mmol/l; ALP for male: 45–125 U/l, for female: 35–100 U/l (20–49 years), 50–135 U/l (>50 years).
Criteria for grading BMD
According to the manufacturer’s instructions, BMD was evaluated on the calcaneus or heel bone of the right foot using an ultrasonic bone densitometer (Sahara, Hologic Inc., USA) operated by trained personnel(Reference Yang, Xu and Mei24,Reference Qin, Gao and Zhang25) . BMD T-value was used to classify the severity of osteoporosis in patients. T ≥ –1 sd was considered normal; −2·5 sd < T < –1·0 sd was considered to indicate osteopenia (reduced bone mass), and T ≤ –2·5 sd was considered to indicate osteoporosis(Reference Kanis, McCloskey and Johansson26,Reference Tsai, Fang and Wu27) .
Statistical analysis
Database management and statistical analyses were performed using SPSS (version 25·0, SPSS, Inc., Chicago, IL, USA) and EpiData 3·1. Data conforming to a normal distribution were expressed in terms of the mean ± sd ( $\bar x$
±S). Arithmetic means were compared using the one-way ANOVA, and the LSD-t test was used for multiple comparisons. Non-normally distributed data were described by the median and 25th and 75th percentiles. For multiple comparisons, the medians were compared using the Mann–Whitney U test and Kruskal–Wallis H test. The chi-square (
$\bar x$
±S). Arithmetic means were compared using the one-way ANOVA, and the LSD-t test was used for multiple comparisons. Non-normally distributed data were described by the median and 25th and 75th percentiles. For multiple comparisons, the medians were compared using the Mann–Whitney U test and Kruskal–Wallis H test. The chi-square ( ${\chi ^2}$
) test was used to compare the rates between groups with categorical outcomes. The associations between the BMD and SIC, Ca2+, PO43– and ALP were analyzed using Pearson correlations. The associations between the BMD and UIC and thyroid function were analyzed using Spearman’s rank correlations. A multivariate linear regression analysis was performed to determine the association between BMD and variables. Binary logistic regression models were used to test whether MWIC and bone metabolic parameters were associated with T < –1·0 sd (osteopenia and osteoporosis), after adjusting for confounding factors. The results were reported as adjusted odds ratios (OR) with 95 % CI. A P < 0·050 was considered statistically significant.
${\chi ^2}$
) test was used to compare the rates between groups with categorical outcomes. The associations between the BMD and SIC, Ca2+, PO43– and ALP were analyzed using Pearson correlations. The associations between the BMD and UIC and thyroid function were analyzed using Spearman’s rank correlations. A multivariate linear regression analysis was performed to determine the association between BMD and variables. Binary logistic regression models were used to test whether MWIC and bone metabolic parameters were associated with T < –1·0 sd (osteopenia and osteoporosis), after adjusting for confounding factors. The results were reported as adjusted odds ratios (OR) with 95 % CI. A P < 0·050 was considered statistically significant.
Results
Description of the participants
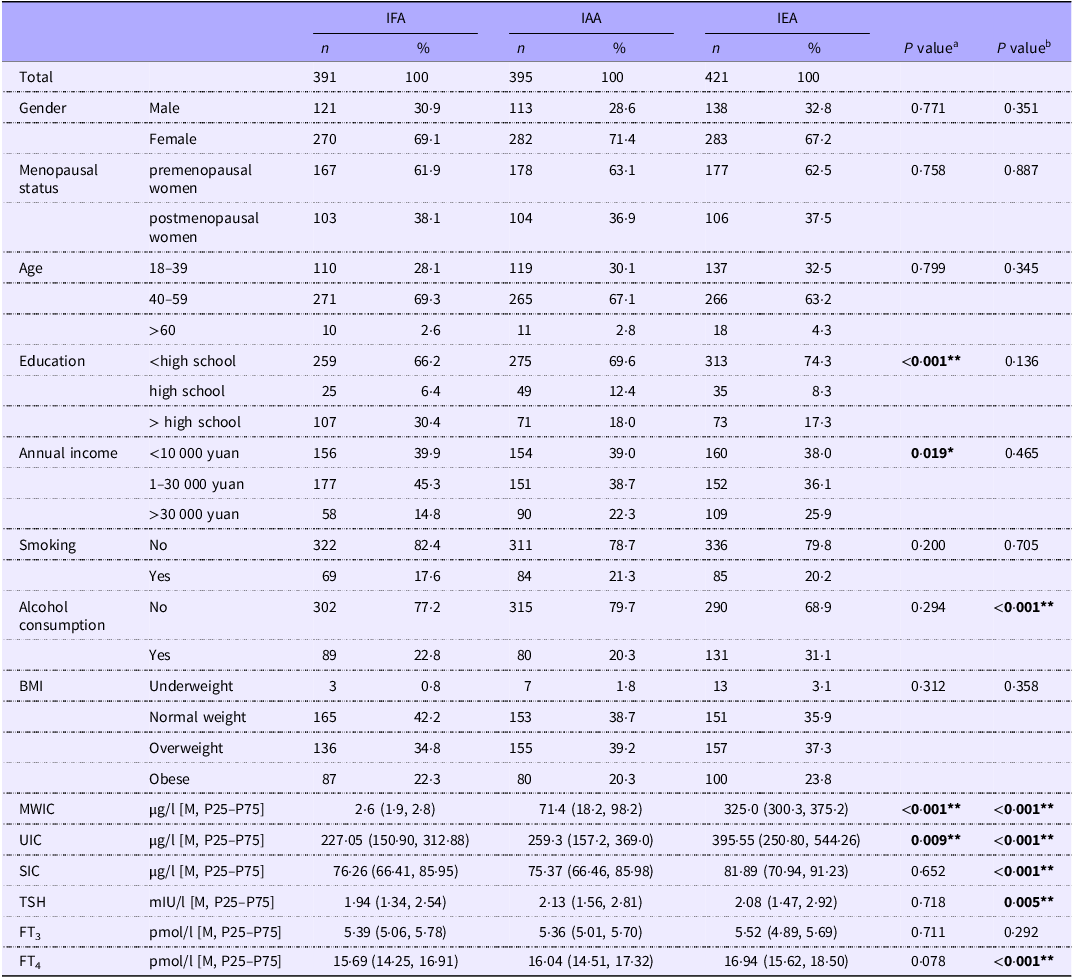
The sociodemographic and lifestyle characteristics of the study subjects from three different areas are summarized in Table 1. Regarding education and annual income, subjects living in IFA were significantly different from those living in IAA (P < 0·001 and P = 0·019, respectively). Regarding alcohol consumption, subjects living in IEA were significantly higher than those living in IAA (P < 0·001). The MWIC and iodine nutrition status of subjects from three areas are also shown in Table 1. In IEA, the levels of MWIC, UIC, and SIC were significantly higher than those in IAA (all P < 0·010). The levels of MWIC and UIC in IFA were significantly lower than those in IAA (both P < 0·010). The results of thyroid function in subjects from three areas are also shown in Table 1. The levels of TSH in IEA were significantly lower than those in IAA (P = 0·005), while the levels of FT4 were higher (P < 0·001).
Sociodemographic and clinical characteristics of study subjects from three areas

IFA, Iodine fortification areas; IAA, iodine adequate areas; IEA, iodine excess areas; BMI, body mass parameters, underweight, BMI < 18.5 kg/m2; normal weight, 18.5 ≤ BMI < 24.0 kg/m2; overweight, 24 ≤ BMI < 28.0 kg/m2; and obese, BMI ≥ 28.0 kg/m2. MWIC, median water iodine concentration; UIC, urinary iodine concentration; SIC, serum iodine concentration; TSH, thyroid-stimulating hormone; FT3, free triiodothyronine; FT4, free thyroxine. P valuea indicates IFA compared with the IAA; P valueb indicates IEA compared with the IAA. * indicates P < 0.050; ** indicates P < 0.010.
Bone metabolism parameters and BMD, stratified by sociodemographic and lifestyle characteristics
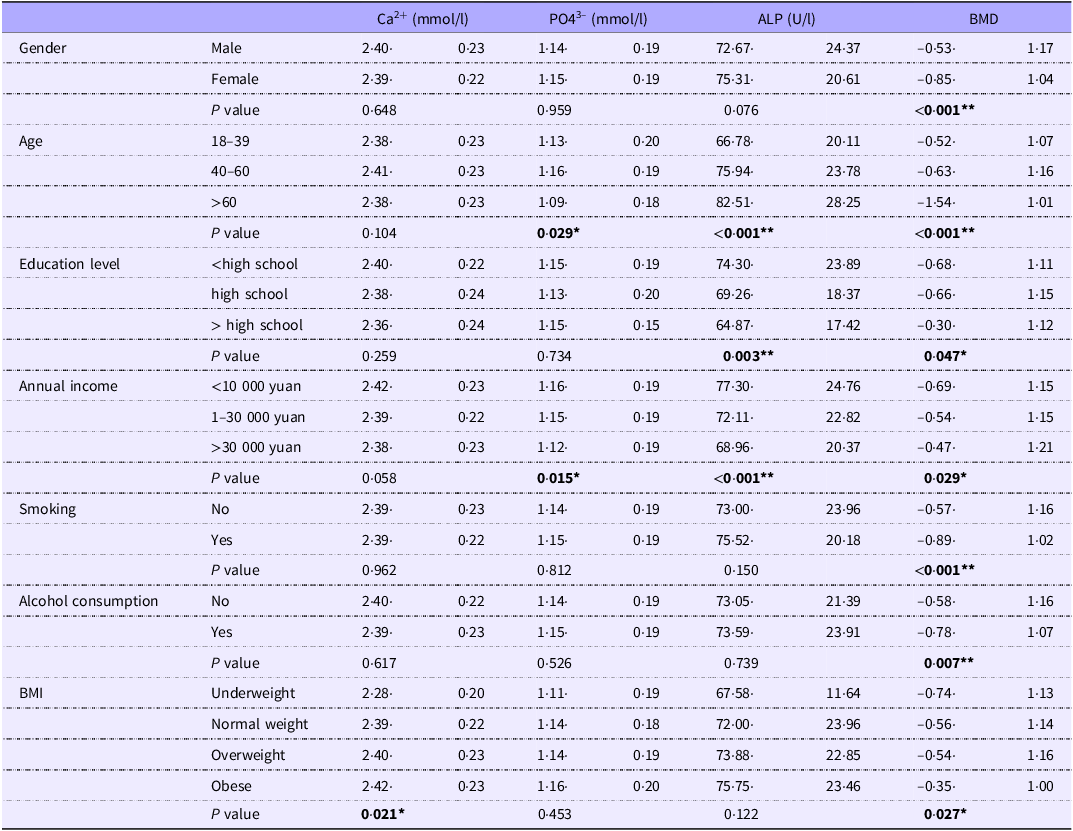
As shown in Table 2, bone metabolism parameters and BMD were stratified by sociodemographic and lifestyle characteristics. Significant differences were found in the levels of Ca2+ based on the body mass index (BMI) of study subjects (P = 0·021). There were also significant differences in the levels of PO43– for subjects in different age and annual income groups (both P < 0·050). The levels of ALP were significantly different in groups with different ages, education levels, and annual incomes (all P < 0·010). The levels of BMD were significantly different between subjects stratified by all sociodemographic and lifestyle characteristics (all P < 0·050).
Bone metabolism parameters and BMD stratified by sociodemographic and lifestyle

ALP, alkaline phosphatase; BMD, bone mineral density; BMI, body mass parameters, underweight, BMI < 18.5 kg/m2; normal weight, 18.5 ≤ BMI < 24.0 kg/m2; overweight, 24 ≤ BMI < 28.0 kg/m2; and obese, BMI ≥ 28.0 kg/m2. * indicates P < 0.050; ** indicates P < 0.010.
Bone metabolism parameters and BMD stratified by three areas in study subjects after gender, age and Menopausal status stratification
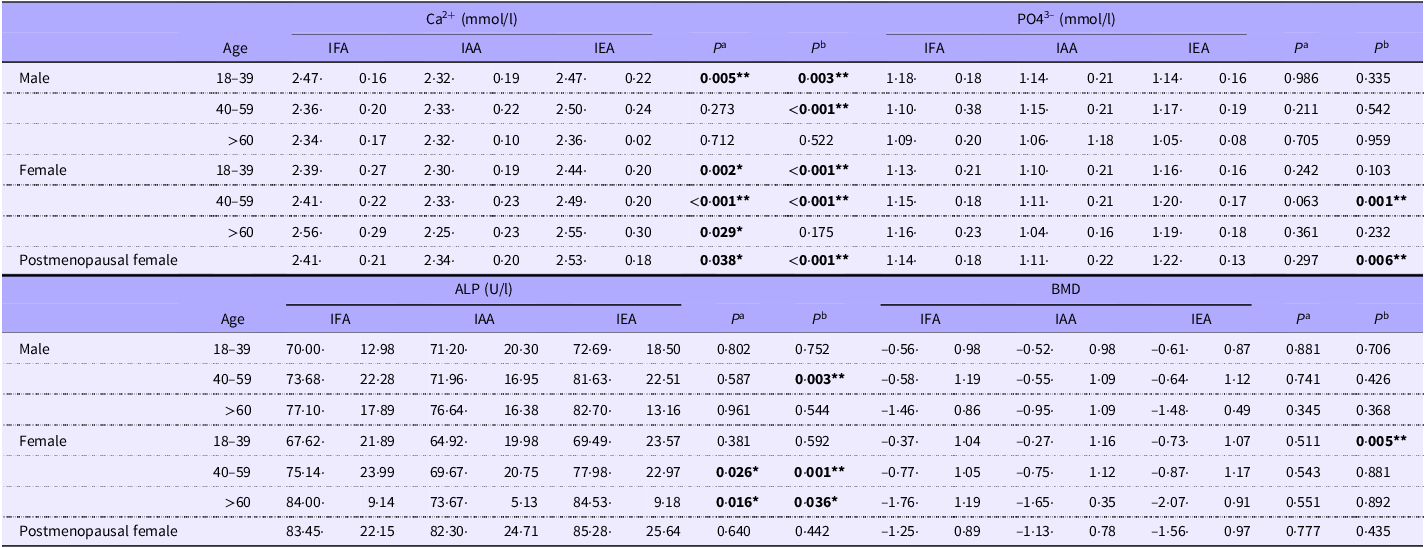
Bone metabolism parameters and BMD stratified by three areas after gender, age and Menopausal status stratification are shown in Table 3. Regarding the levels of Ca2+, compared with IAA, males (18–39 years) in IFA and IEA had higher levels, and males (40–59 years) in IEA had a higher level as well (all P < 0·010). Whereas in females, compared with IAA, all females in different age groups in IFA had higher levels and females (18–59 years) in IEA had higher levels as well (all P < 0·050). Regarding the concentrations of PO43–, females (40–59 years) in IEA had a higher level than those in IAA (P < 0·001). Regarding the concentrations of ALP, males (40–59 years) in IEA had a higher level than those in IAA (P = 0·003). Whereas in females, compared with IAA, females (≥ 40 years) in IFA and IEA had higher levels (all P < 0·050). Compared to IAA females, females (18–39 years) in IEA had a lower BMD (P = 0·005). In Table 3, we also stratified the levels of bone metabolism parameters and BMD in postmenopausal females by three areas. The levels of Ca2+ in postmenopausal females from IAA were significantly lower than those in IFA and IAA females (both P < 0·050). The levels of PO43– in postmenopausal females from IEA were significantly higher than those in IAA females (P = 0·006).
Bone metabolism parameters and BMD stratified by three areas after gender, age and menopausal status stratification

IFA, Iodine fortification areas; IAA, iodine adequate areas; IEA, iodine excess areas; ALP, alkaline phosphatase; BMD, bone mineral density. P valuea indicates IFA compared with the IAA; P valueb indicates IEA compared with the IAA. * indicates P < 0.050; ** indicates P < 0.010.
Bone metabolism parameters and BMD stratified by MWIC and iodine nutrition status
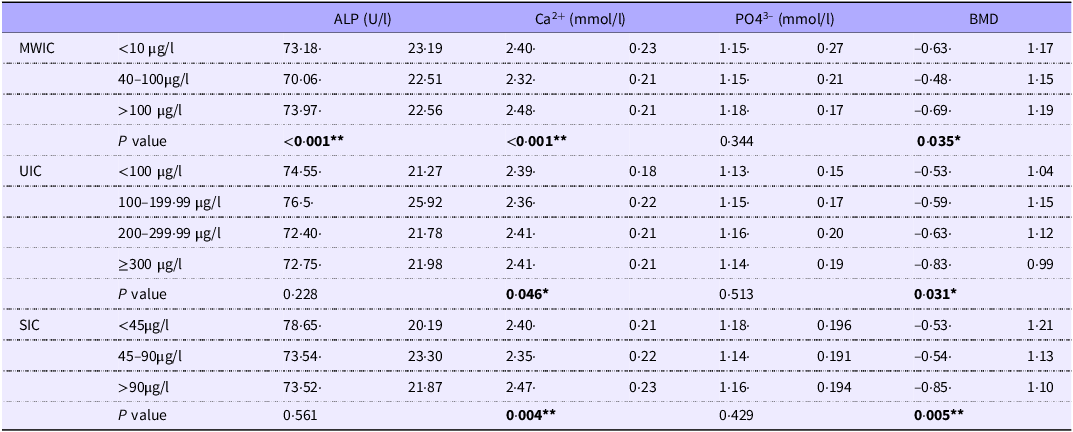
As shown in Table 4, we stratified the bone metabolism parameters and BMD according to different MWIC and iodine nutrition status. The results showed that BMD and Ca2+ levels were significantly different under different iodine nutrition levels (MWIC, UIC, SIC) (all P < 0·050), while BMD decreased with increases in iodine nutrition level (UIC and SIC). The levels of ALP were significantly different between areas with different MWIC (all P < 0·050).
Bone metabolism parameters and BMD stratified by MWIC and iodine nutritional status

MWIC, median water iodine concentration; BMD, bone mineral density; UIC, urinary iodine concentration; SIC, serum iodine concentration; ALP, alkaline phosphatase. * indicates P < 0.050; ** indicates P < 0.010.
Correlations among iodine nutrition status, bone metabolism parameters, and BMD
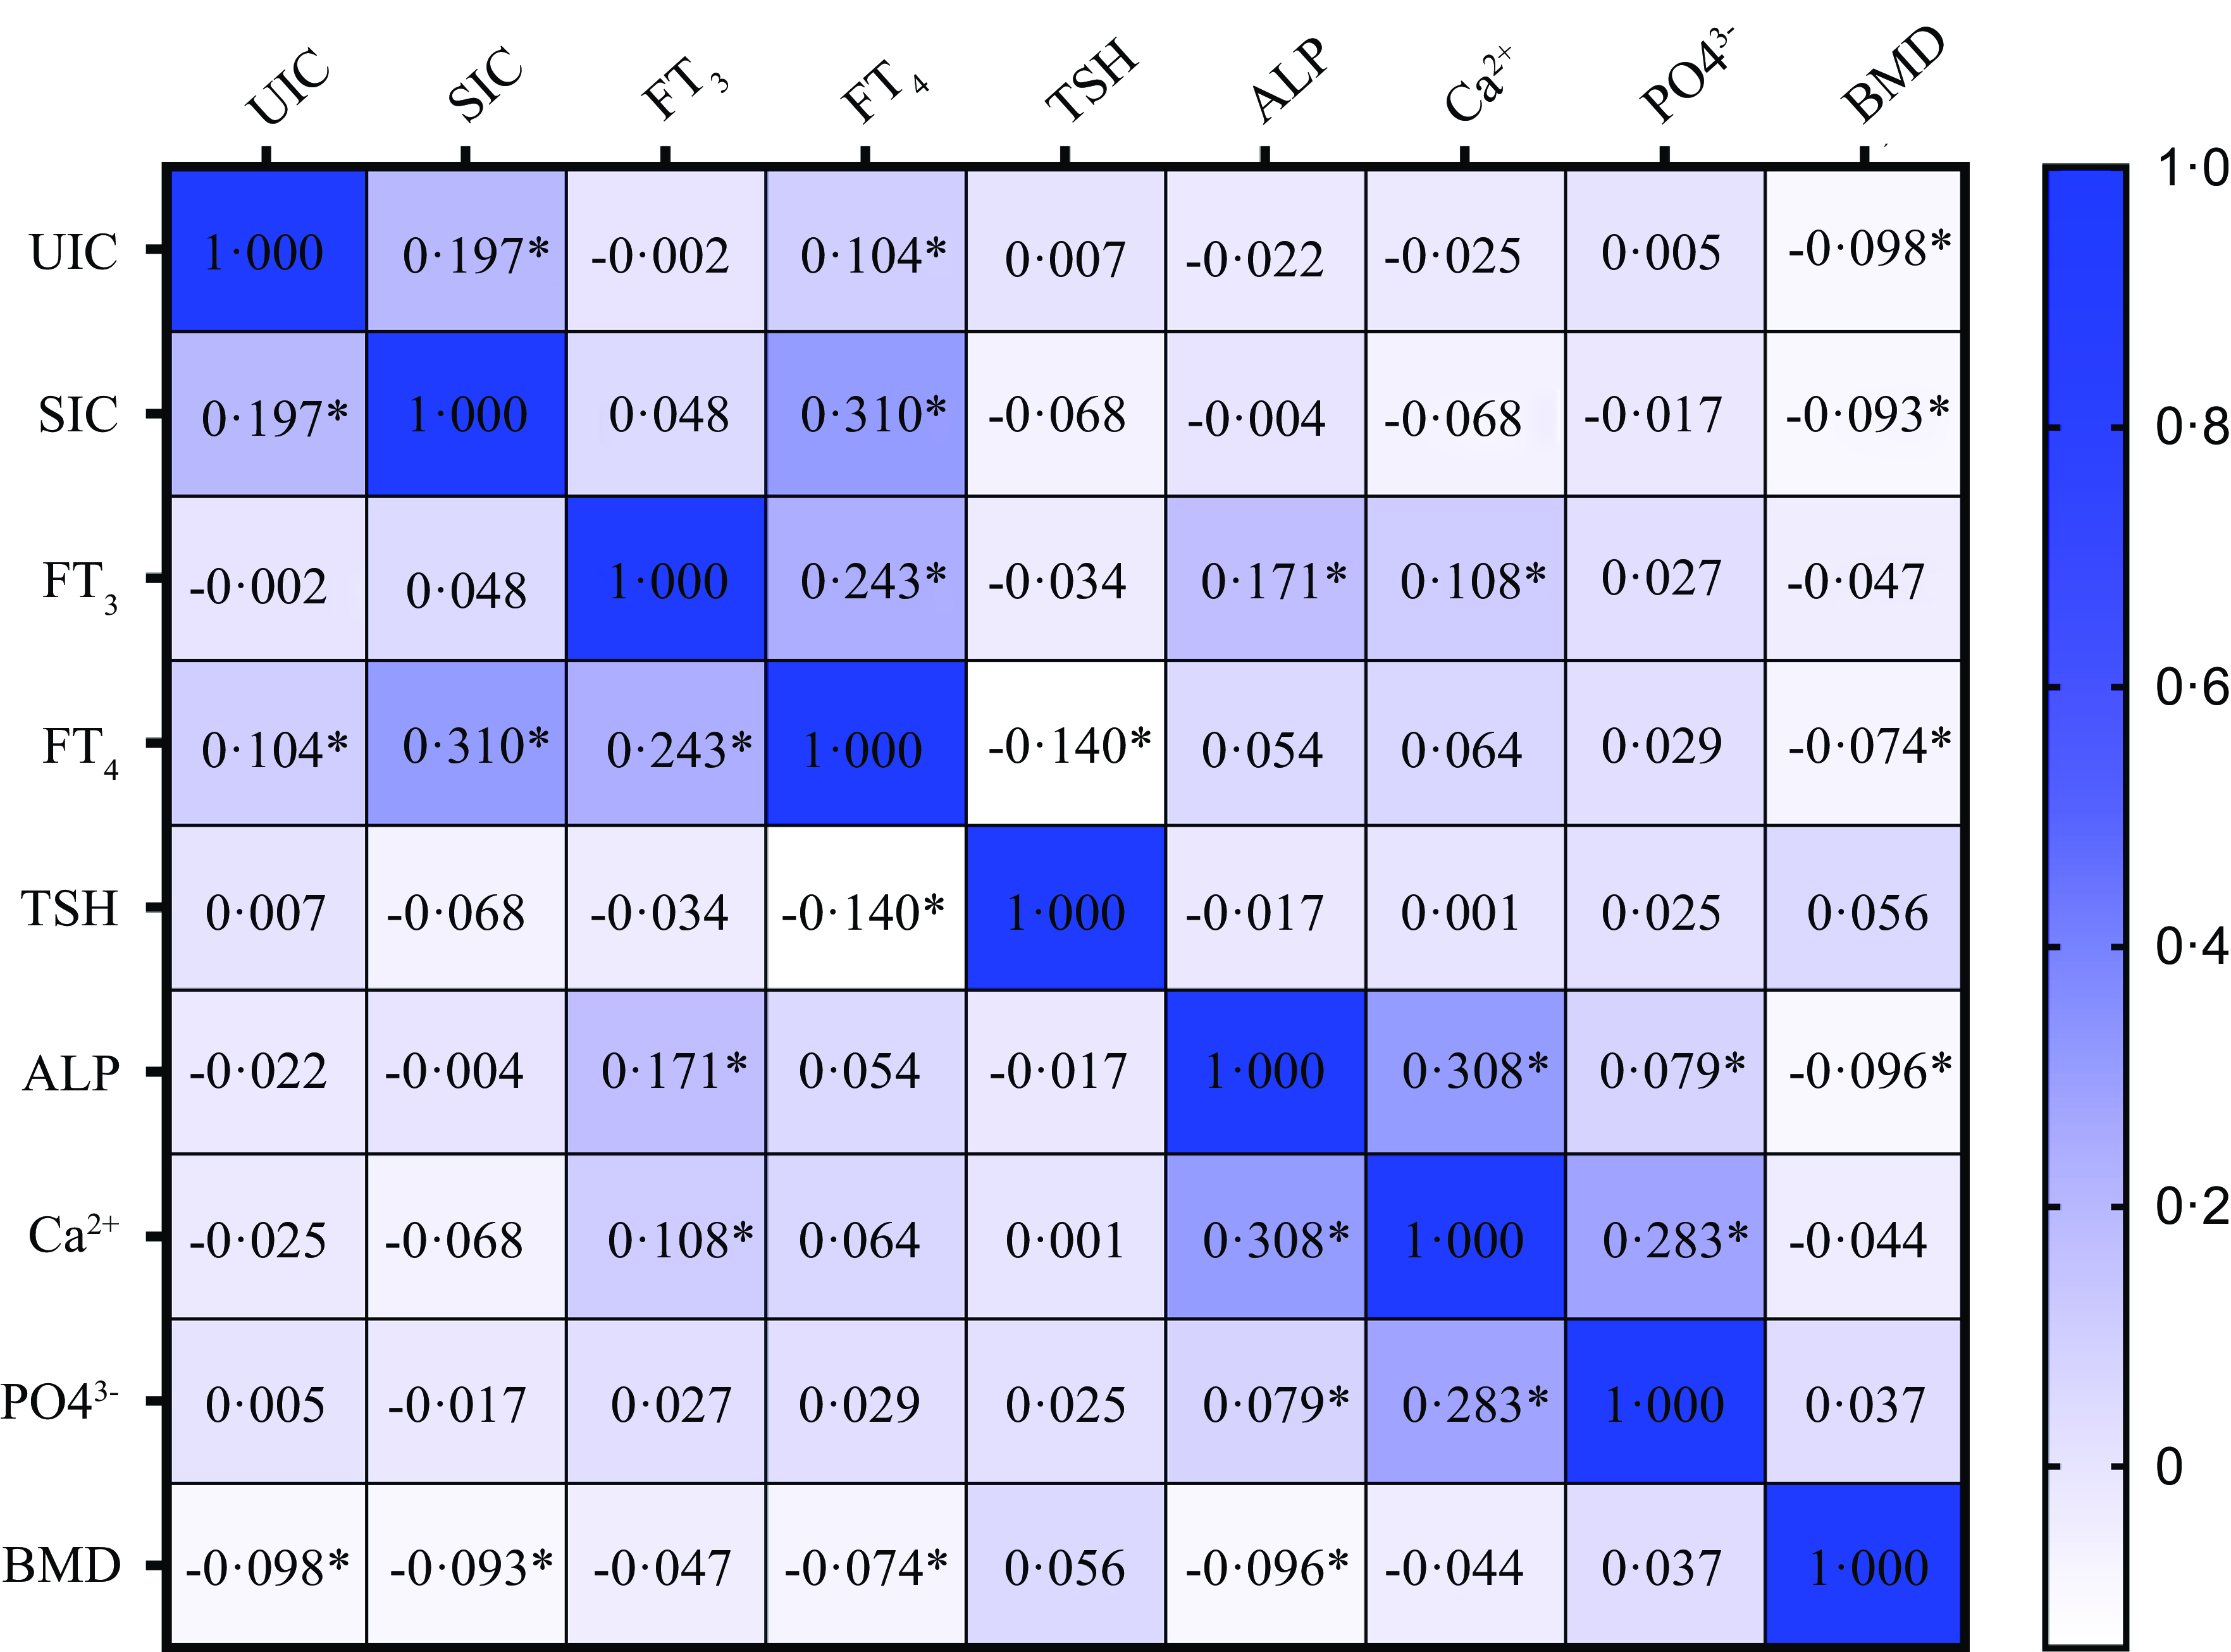
As shown in Fig. 2, we analyzed the relationship between iodine nutrition status, thyroid function, bone metabolism parameters, and BMD. We found that the levels of BMD were negatively correlated with UIC (r = –0·098, P = 0·047), SIC (r = –0·093, P = 0·025), FT4 (r = –0·074, P = 0·017) and ALP (r = –0·096, P = 0·006). The levels of PO43– were positively correlated with ALP (r = 0·079, P = 0·023) and Ca2+ (r = 0·283, P < 0·001). The levels of Ca2+ were positively correlated with FT3 (r = 0·108, P = 0·002) and ALP (r = 0·308, P < 0·001). The levels of ALP were positively correlated with FT3 (r = 0·171, P < 0·001). The levels of FT4 were negatively correlated with TSH (r = –0·140, P < 0·001). The levels of FT4 were positively correlated with UIC (r = 0·104, P = 0·003), SIC (r = 0·310, P < 0·001), and FT3 (r = 0·243, P < 0·001). The levels of SIC were positively correlated with UIC (r = 0·197, P < 0·001).
Heat map of correlations among iodine nutrition status, bone metabolism parameters, and BMD. *Indicates P < 0·050.

Relationship between BMD and other variables
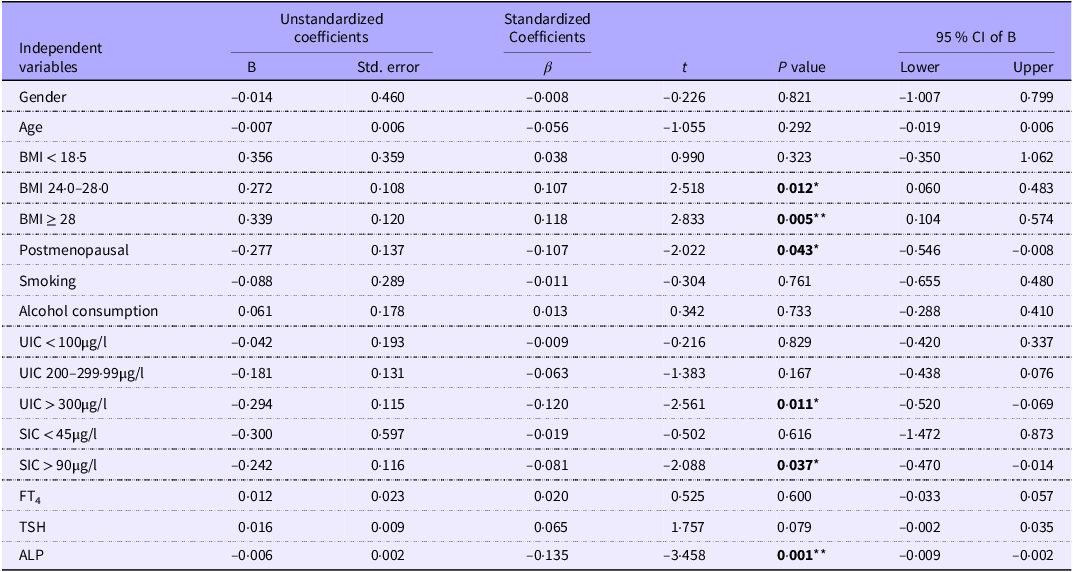
As shown in Table 5, a multivariate linear regression analysis was performed to assess the association between BMD and other variables. First, we used univariate linear regression to explore independent variables in the model. The factors that we included were: MWIC, gender, age, BMI, menopausal status, iodine nutrition status, thyroid function, annual income, education level, alcohol consumption, and bone metabolism parameters. The results of univariate linear regression showed that gender, age, BMI, menopausal status, smoking status, alcohol consumption, UIC, SIC, FT4 TSH, and ALP were associated with BMD. The final multiple linear regression model was statistically significant (F = 6·145, P < 0·001). The results showed that BMD levels in overweight (BMI 24·0–28·0) and obese individuals (BMI ≥ 28·0) group were significantly higher than that in BMI < 18·5 group (P = 0·012 and P = 0·005); In addition, BMD level in postmenopausal females was significantly lower than that in premenopausal females (P = 0·043); BMD level in UIC ≥ 300 μg/l group was significantly lower than that in UIC 100–199·99 μg/l group (P = 0·011); BMD level in SIC > 90 μg/l group was significantly lower than that in SIC < 45 μg/l group (P = 0·037). The levels of BMD decreased with the increasing levels of ALP (P = 0·001).
Multivariate linear regression analysis with BMD

BMD, bone mineral density; UIC, urinary iodine concentration; SIC, serum iodine concentration; ALP, alkaline phosphatase; TSH, thyroid-stimulating hormone; FT4, free thyroxine; ALP, alkaline phosphatase. * indicates P < 0.050; ** indicates P < 0.010.
Relationship between the prevalence of osteopenia and osteoporosis, and iodine nutrition status
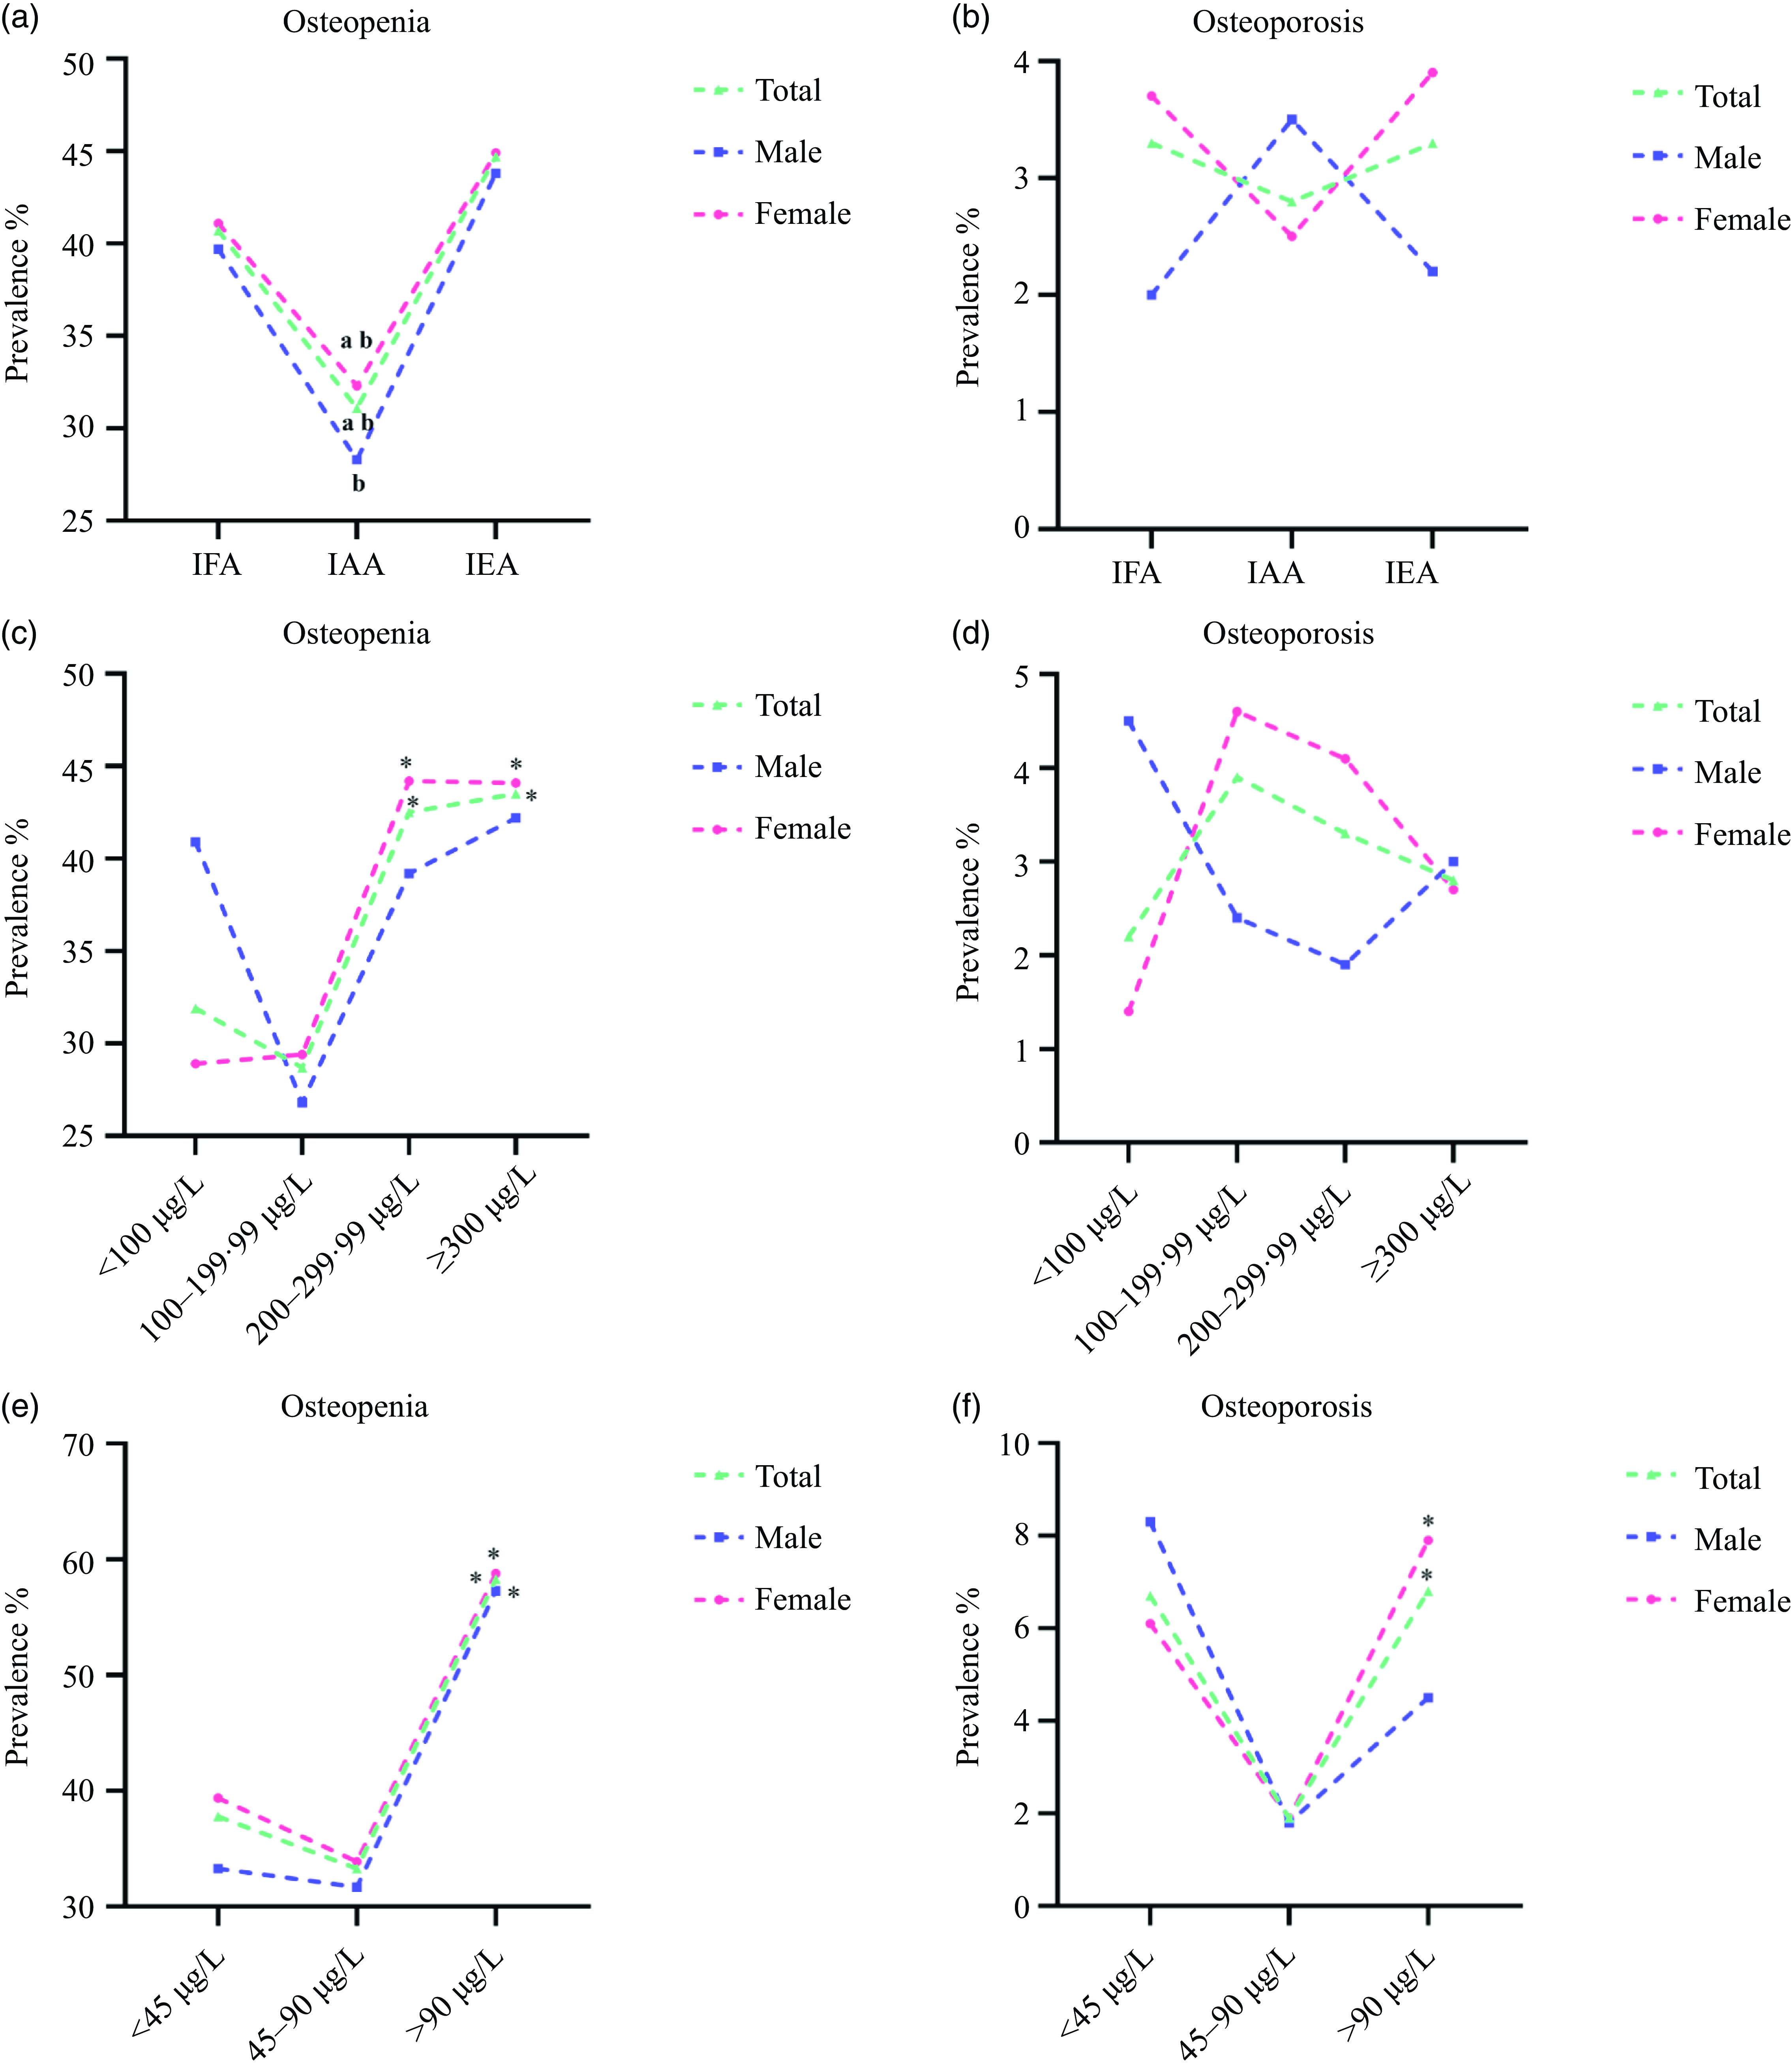
Figure 3 shows the relationship between different iodine nutrition status and the prevalence of osteopenia and osteoporosis. Figure 3(a–b) and online Supplementary Table S1 show the prevalence of osteopenia and osteoporosis in three areas. Compared to IAA, the overall population in IFA and IEA had higher prevalences of osteopenia (both P < 0·001). After gender stratification, males in IEA had a higher prevalence of osteopenia compared to that in IAA (P = 0·010). Females in IFA and IEA had higher prevalences of osteopenia as well (both P < 0·050). Compared to IAA, the prevalence of osteoporosis in IFA and IEA were not statistically different. Figure 3(c–d) and online Supplementary Table S2 show the prevalence of osteopenia and osteoporosis at different UIC levels. Compared with UIC 100–199·99 μg/l, the prevalence of osteopenia in overall population and females was significantly higher when UIC 200–299·99 μg/l and UIC ≥ 300 μg/l (all P < 0·050). There was no significant difference in the prevalence of osteoporosis at different UIC levels. Figure 3(e–f) and online Supplementary Table S3 show the prevalence of osteopenia and osteoporosis at different SIC levels. For overall population, male and female, compared to SIC 45–90 μg/l, the prevalence of osteopenia was higher when SIC > 90 μg/l (all P < 0·050). For overall population and female, compared to SIC 45–90 μg/l, the prevalence of osteoporosis was significantly higher when SIC > 90 μg/l (all P < 0·050).
The relationship between different iodine nutrition status and the prevalence of osteopenia and osteoporosis. (a) The prevalence of osteopenia in different areas; (b) The prevalence of osteoporosis in different areas; (c) The prevalence of osteopenia in different levels of UIC; (d) The prevalence of osteoporosis in different levels of UIC; (e) The prevalence of osteopenia in different levels of SIC; (f) The prevalence of osteoporosis in different levels of SIC. a, indicates compared with IFA, P < 0·050; b, indicates compared with IEA, P < 0·050; * indicates compared with UIC 100–199·99 μg/l and SIC 45–90 μg/l, P < 0·050.

Logistic regression models for the association between iodine nutrition status, bone metabolism parameters, and T < –1·0 sd
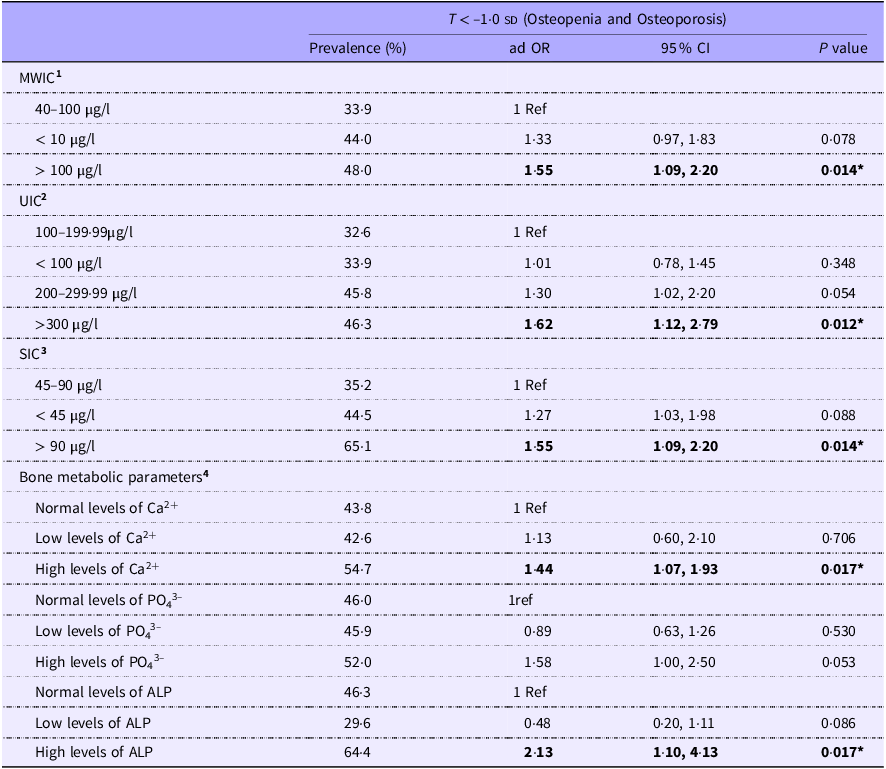
As shown in Table 6, after adjusting for confounding factors, we found that the OR for MWIC > 100 µg/l was 1·55 (95 % CI 1·09, 2·20; P = 0·014), indicating that it was a risk factor for T < –1·0 sd. The OR for UIC ≥ 300 µg/l was 1·62 (95 % CI 1·12, 2·79; P = 0·012), indicating that it was a risk factor for T < –1·0 sd. The OR for SIC > 90 µg/l was 1·55 (95 % CI 1·09, 2·20; P = 0·014), indicating that it was a risk factor for T < –1·0 sd. Furthermore, the OR for high levels of Ca2+ and ALP were 1·44 (95 % CI 1·07, 1·93; P = 0·017) and 2·13 (95 % CI 1·10, 4·13; P = 0·017), respectively, which indicated that they were risk factors for T < –1·0 sd.
The association between iodine nutrition status, bone metabolism parameters and T < –1·0 sd

MWIC, median water iodine concentration; ALP, alkaline phosphatase; OR, odds ratio; 95 % CI, 95 % confidence interval. Model 1 adjusted by sociodemographic and lifestyle characteristics, thyroid function, Bone metabolic parameters, UIC and SIC. Model 2 adjusted by sociodemographic and lifestyle characteristics, thyroid function, Bone metabolic parameters, MWIC and SIC. Model 3 adjusted by sociodemographic and lifestyle characteristics, thyroid function, Bone metabolic parameters, MWIC and UIC. Model 4 adjusted by sociodemographic and lifestyle characteristics, thyroid function, and iodine nutrition status. * indicates P < 0.050; ** indicates P < 0.010.
Discussion
Both iodine nutrition monitoring and bone health are important public health issues for Chinese residents. The pathogenesis of bone disease is complex. Bone health is not only a health issue in China but also an urgent problem worldwide. Therefore, this study sought to further explore whether different iodine nutrition statuses (iodine deficiency and iodine excess) in the population are associated with bone metabolism and bone health.
In this study, the iodine exposure mainly refers to the water iodine content (drinking) and the use of iodized salt in the population because these are the main sources of iodine nutrition for Chinese residents. The results of nutrition and health monitoring of Chinese residents show that the average dietary iodine intake of Chinese adults is only between 27·9 and 44·5 μg/d, therefore, dietary iodine intake was not discussed in this study. We investigated 1207 adults in 5 villages from three areas. According to the recommendations from WHO/UNICEF/IGN, the iodine status in IFA and IAA were above the requirements (UIC 227·05 μg/l and UIC 259·3 μg/l), whereas that in IEA was excessive (UIC 395·55 μg/l). UIC may reflect iodine intake at the population level, but it is not an accurate indicator of an individual’s iodine status. Therefore, to more accurately understand the individual iodine nutrition status of the survey subjects, we also measured the SIC of the survey subjects. Compared with the UIC, SIC is an important biomarker of iodine metabolism. SIC can truly reflect the body’s recent iodine nutrition status, and the iodine nutrition status of the study population reflected by the SIC may be more stable than UIC(Reference Keating and Albert28). Some studies also found that the iodine nutrition status of the population reflected by the SIC may be more stable than UIC(Reference Jin, Jiang and Liu23). If SIC was used to evaluate the iodine nutritional status of the population of this study, the iodine nutritional status in the IFA was lower than that in IEA, but higher than that in IAA. In any case, our results indicated that after the 29-year USI policy, the iodine nutritional status of residents in IFA in China has significantly improved and stabilized. It is no doubt about the overall benefits of USI and our research provides support for further implementation of USI.
So far, we have clarified the iodine nutrition status of residents in each survey area. Next, we will discuss the relationship between iodine nutrition and bone metabolism indexes. In this study, we selected three key markers of bone metabolism: Ca2+, PO43– and ALP. As we all know bone growth and metabolism are modulated by trace elements, such as Ca2+ and PO43–. Ca2+ is essential for the development, growth, and maintenance of bone, and for the stability of the cellular cytoskeleton. When the body has bone metabolism disorder or bone mass loss, the level of Ca2+ in the serum will increase(Reference Zaneta, Karolina and Danuta29). Next to Ca2+, PO43– is the second basic component of bone tissue, and the appropriate level of PO43– is crucial for the activity of osteoblasts and osteocytes in the process of matrix mineralization. The levels of PO43– in patients with osteopenia and osteoporosis are higher than normal(Reference Magne, Bluteau and Faucheux30). For ALP, it is not only an important marker of bone formation but also plays a vital biological role in the process of bone formation. When the metabolism of osteoblasts and osteoclasts is disturbed, the level of ALP in serum will increase(Reference Mathias, Giuseppe and Simona31). In this study, we observed the relationship between iodine nutrition and these three key markers of bone metabolism, however, we only found an association between iodine nutrition (UIC and SIC) and Ca2+ levels, but no association was found with ALP and PO4 3–. Our results suggest that both iodine deficiency and iodine excess can cause Ca2+ levels to rise. It is well known that severe iodine deficiency can cause growth and development problems, the most typical example is cretinism (short stature, slow bone development), However, the relationship between mild iodine deficiency and iodine excess and bone metabolism remains unclear. The relationship between iodine deficiency and bone metabolism is controversial. On the one hand, some studies suggest that iodine deficiency is harmful to bone metabolism. Researchers have found that bone growth retardation, chondrocyte layer irregularity, and a thinner proliferation layer of growth plate cartilage in rats treated with a low iodine diet obtained from iodine deficiency areas of China(Reference Guo, Guo and Zuo32,Reference Guo, Wang and Zhang33) . Studies also found that iodine deficiency affected the differentiation of chondrocytes and the growth of cartilage in two generations of rats(Reference Ren, Guo and Zhang34). On the other hand, studies have also come to different conclusions, suggesting that iodine deficiency does not affect growth in rats, and may even attenuate bone mass loss in rats(Reference Moreno-Reyes, Egrise and Boelaert35). Although previous studies have explored the relationship between iodine deficiency and bone metabolism, they have been limited to animal experiments. Our study extends the data from the population and provides a theoretical basis for future research. Animal studies have found that high iodine can affect bone metabolism, but no human studies have been conducted. Studies have been performed in which experimental dogs were fed high iodine diets, and the results showed that Ca2+ and PO43– metabolism in the experimental dogs was disturbed, and pathological changes occurred in the cartilage(Reference Castillo, Pisarev and Lalia36). Other studies found that with the increase of iodine intake, the ALP staining of osteoclasts became lighter and the expression decreased, indicating that high iodine affected the activity of osteoclasts(Reference Banovac and Koren37). These findings are consistent with our results. In addition, in this study, none of the subjects had PTH-axis related diseases (mainly parathyroid diseases), so we excluded the possible influence of this confounding factor on bone metabolism.
BMD is an important indicator of bone health, and the decrease of BMD will increase the risk of fracture(Reference Angelo38). We innovatively explored the relationship between iodine nutrition and BMD. First, we found that BMD was significantly reduced in both IFA and IEA residents. On the one hand, before USI (1995), the residents in IFA experienced many years of iodine deficiency, followed by approximately 29 years of iodine supplementation. Our study suggests that the changes in iodine nutrition may have a potential impact on BMD, but this result needs to be confirmed by a large number of subsequent data. On the other hand, iodized salt was not provided in IEA, the iodine intake was mainly from drinking water, therefore the residents in IEA have been exposed to iodine excess for many years. Chinese government should gradually improve the drinking water of residents in IEA to change the iodine nutritional status of the residents in IEA. At the same time, the iodine nutritional status and bone health status of the residents in these areas should be monitored. Secondly, we found a negative correlation between the levels of BMD and iodine nutrition (UIC and SIC). That finding indicated that the levels of BMD were more likely to be low when the iodine nutrition status was ‘excess’.
Multiple studies have shown a connection between iodine intake and metabolic disorders, at the same time, bone diseases are closely related to metabolic abnormalities(Reference Nancy39). With the aging population, bone diseases have already become an increasingly significant public health problem. Therefore, it is particularly important to explore the relationship between iodine nutrition and bone diseases. A study investigating iodine nutrition status in postmenopausal females with osteoporosis found that postmenopausal females with osteopenia and osteoporosis had significantly lower iodine nutrition statuses than healthy postmenopausal females, and UIC also exhibited a significant linear relationship with BMD(Reference Arslanca, Korkmaz and Arslanca40). The subjects in that study were limited to postmenopausal females, but our study investigated the relationship between osteopenia and iodine deficiency in the overall population. We found that although the prevalence of osteopenia was significantly increased in residents of IFA, there was no change in the prevalence of osteopenia or osteoporosis in UIC < 100 μg/l and SIC < 45 μg/l groups. At the same time, we did not find an association between iodine deficiency (MWIC < 10 μg/l, UIC < 100 μg/l, and SIC < 45 μg/l) and T < –1·0 sd in the regression model. Although studies have proposed that oxidative damage, secondary to iodine deficiency, may be one of the mechanisms leading to the development of osteoporosis(Reference Altindag, Erel and Soran41). However, our data do not prove that iodine deficiency increases osteopenia and osteoporosis. Further expansion of the sample size is needed to explore the relationship between iodine deficiency and bone diseases. Our study also found that iodine excess (MWIC, UIC, SIC) can lead to a significant increase in the prevalence of osteopenia and is a risk factor for T < –1·0 sd. A recent study found that chronic iodine overconsumption could lead to an increase in the bone marrow cavity area and a decrease in bone mass in rats, thereby increasing the risk of osteoporosis, it can also decrease the biomechanical properties of the femur and cause abnormal bone tissue metabolism in rats, inhibiting bone reconstruction, which triggers osteoporosis(Reference Zhang, Zhao and Shan42). Another study found that iodine excess caused structural damage to articular cartilage and epiphyseal growth plates, increasing the risk of osteoarthritis, such damage became more obvious with the increasing dose and duration of iodine intake(Reference Zhang, Zhao and Zhao43). The above findings are consistent with the conclusion of the current study, and the reason may be that excess iodine can affect the activity of osteoblasts and osteoclasts, leading to changes in bone metabolism(Reference Yang, Xu and Hou44). Our research suggests that there is an association between iodine levels and bone health. Based on the results of our study and previous related studies(Reference Zhang, Zhao and Zhao43,Reference Yang, Xu and Hou44) , we speculated that there may be the following potential mechanisms for the effect of iodine excess on bone metabolism: excessive iodine can lead to changes in the expression of osteoclast-related genes (MMP-9 and CtsK), as well as significantly upregulation of MMP-13 and Col II mRNA expression, and ultimately decrease the activity of osteoclasts, resulting in abnormal bone metabolism and osteoporosis. During the process of iodine nutrition monitoring, we should also monitor bone health indicators. The water improvement project may be important in preventing osteoporosis and osteopenia in IEA.
Studies have confirmed that abnormal thyroid function can seriously affect bone health(Reference Mazziotti, Porcelli and Patelli45,Reference Van Rijn, Pop and Williams46) . In this study, thyroid function was measured in all subjects, which helped us to exclude patients with thyroid dysfunction (in this study, we excluded 6 patients with overt hyperthyroidism, 6 patients with subclinical hyperthyroidism, 7 patients with overt hypothyroidism, and 146 patients with subclinical hypothyroidism), the aim was to avoid the influence of thyroid dysfunction on the prevalence of bone disease. In national epidemiological surveys of Chinese adults, the prevalence of osteoporosis is 32·1 % among females (above 50 years old), which was significantly higher than that in Europe and America. Moreover, the prevalence of osteopenia is up to 46·4 % among people over 50 years in China(Reference Wang, Tao and Hyman47). Confounding factors are known to affect the relationship between exposure and outcome, so we chose to control thyroid dysfunction as a confounding factor. However, even after controlling for thyroid dysfunction as a confounding factor, the prevalence of osteopenia remained consistently high in the IFA (38·9 %) and IEA (44·7 %), suggesting a possible link between iodine and bone health. Although we excluded patients with thyroid dysfunction, in this study we also explored the relationship between thyroid function, bone metabolism, and bone mineral density. Controlling for thyroid dysfunction, we still found a linear relationship between thyroid hormone and bone metabolism and BMD. This also indicates that thyroid hormone does have an effect on bone metabolism, and our study provides basic population data for this conclusion.
Our study has several strengths. First, to our knowledge, this is the first epidemiologic study investigating the possible links between iodine exposure levels and the risk of BMD and bone metabolism in a population. Second, we conducted a cross-sectional survey in areas with different MWIC, which is in line with the actual situation of Chinese residents and facilitates an understanding of the iodine nutrition status of residents in various areas. This study also had several limitations. First, this was a cross-sectional study, which made it difficult to determine the cause-effect relationship, and thus, the demonstration of causality was weak. At the same time, the results of this study were based on the results of population epidemiological studies, but we did not study the molecular functional mechanism in depth. Thus, more experiments in animals and more molecular mechanism research are needed to extend the results of this study in the future. Secondly, the demographic information of the standard questionnaire will cause the information bias. At last, given the specific limitations of gold standard DXA (large size of the equipment, limited availability) and the inconvenience of on-site investigations, a more portable instrument such as ultrasonic bone densitometer was used to measure bone density.
Conclusion
In conclusion, iodine deficiency was associated with bone metabolism and BMD, but had no significant relation with the prevalence of osteopenia or osteoporosis. Iodine excess can not only lead to changes in bone metabolism parameters and BMD, but is also a risk factor for osteopenia and osteoporosis. Residents living in IEA should not only monitor their iodine nutrition status, but also consider screening for bone diseases in this population. Drinking water renovation must also be implemented to improve the iodine nutrition and bone health status of residents in this area.
Supplementary material
For supplementary material/s referred to in this article, please visit https://doi.org/10.1017/S0007114525000790
Acknowledgements
We are grateful for the assistance provided by the Institute for Prevention and Treatment of Endemic Disease of Shandong Province for collecting epidemiological data and samples, and contributions and support from all participants.
The contribution of each author is as follows: Methodology, Z. Z. and B. L.; Software, Z. Z. and J. L.; Validation, Y. C., B. R. and Y. H. Investigation, Z. Z., L. L., M. J., S. W., Y. C. and B. R.; Writing – Review & Editing, Z. Z., Q. W. and J. L.; Visualization, Z. Z., and Q. W.; Funding Acquisition, H. S. and L. L. Z. Z. and J. L. have contributed equally to this work. All authors revised the report and approved the final version before submission.
This study was supported by grants from the National Natural Science Foundation of China (82373696 and 82073490).
The authors declare that there is no conflict of interest that could be perceived as prejudicing the impartiality of this study.
All procedures performed in studies involving human participants were in accordance with the 1964 Helsinki Declaration and its later amendments or comparable ethical standards. This project was approved by the Ethical Review Board of Harbin Medical University. This project was approved by the Ethical Review Board of Harbin Medical University.
Dataset available on request from the authors.