

INTRODUCTION
For the late Pleistocene (i.e., the last 129 ka), δ18O variations in planktonic fossils from oceanic cores have been used as a proxy for the continental ice volume (Emiliani, Reference Emiliani1955; Shackleton, Reference Shackleton1987), reflecting global paleoclimatic variations and defining marine isotope stages (MIS). Ice cores from Greenland (Grootes et al., Reference Grootes, Stulver, White, Johnsen and Jouzel1993) and Antarctica (Petit et al., Reference Petit, Jouzel, Raynaud, Barkov, Barnola, Basile and Bender1999) have also provided high-resolution temperature reconstructions mainly from ice isotopic records. From these paleoclimate proxies, it was shown that late Pleistocene temperature minima occur during MIS 4 and mainly during MIS 2 (Bond et al., Reference Bond, Broecker, Johnsen, McManus, Labeyrie, Jouzel and Bonani1993; Lisiecki and Raymo, Reference Lisiecki and Raymo2005). The last glacial maximum (LGM), which occurred during MIS 2, between 26.5–19 ka (Clark et al., Reference Clark, Dyke, Shakun, Carlson, Clark, Wohlfarth, Mitrovica, Hostetler and McCabe2009) or between 30–16.5 ka (Lambeck et al., Reference Lambeck, Rouby, Purcell, Sun and Sambridge2014), refers to the most recent cold period when the global ice sheet volume reached its maximum.
In the marginal areas of the European Alps, morainic complexes have been recognized and well mapped (Penck and Brückner, Reference Penck and Brückner1909; Ehlers et al., Reference Ehlers, Gibbard and Hughes2011, and references therein), indicating the large extent of the Alpine late Pleistocene glaciers that formed broad piedmont lobes. Two main glacier advance phases have been recorded during the LGM in the European Alps. The first one occurred between 24 and 22 ka in the Italian foreland (Monegato et al., Reference Monegato, Ravazzi, Donegana, Pini, Calderoni and Wick2007; Gianotti et al., Reference Gianotti, Forno, Ivy-Ochs and Kubik2008, 2015; Ravazzi et al., Reference Ravazzi, Badino, Marsetti, Patera and Reimer2012; Fontana et al., Reference Fontana, Monegato, Zavagno, Devoto, Burla and Cucchi2014; Scapozza et al., Reference Scapozza, Castelletti, Soma, Dall'Agnolo and Ambrosi2014; Ivy-Ochs et al., Reference Ivy-Ochs, Lucchesi, Baggio, Fioraso, Gianotti, Monegato, Graf, Akçar, Christl and Carraro2018; Braakhekke et al., Reference Braakhekke, Ivy-Ochs, Monegato, Gianotti, Martin, Casale and Christl2020; Kamleitner et al., Reference Kamleitner, Ivy-Ochs, Monegato, Gianotti, Akçar, Vockenhuber, Christl and Synal2022) and in the northern Swiss foreland (Ivy-Ochs et al., Reference Ivy-Ochs, Schäfer, Kubik, Synal and Schlüchter2004; Akçar et al., Reference Akçar, Ivy-Ochs, Kubik and Schlüchter2011; Reber et al., Reference Reber, Akçar, Ivy-Ochs, Tikhomirov, Burkhalter, Zahno, Lüthold, Kubik, Vockenhuber and Christian2014; Graf et al., Reference Graf, Akçar, Ivy-Ochs, Strasky, Kubik, Christl, Burkhard, Wieler and Schlûchter2015; Ivy-Ochs, Reference Ivy-Ochs2015), followed by a simultaneous retreat of the northern Swiss foreland lobes from their maximum positions (Ivy-Ochs et al., Reference Ivy-Ochs, Schäfer, Kubik, Synal and Schlüchter2004; Akçar et al., Reference Akçar, Ivy-Ochs, Kubik and Schlüchter2011; Reber et al., Reference Reber, Akçar, Ivy-Ochs, Tikhomirov, Burkhalter, Zahno, Lüthold, Kubik, Vockenhuber and Christian2014; Graf et al., Reference Graf, Akçar, Ivy-Ochs, Strasky, Kubik, Christl, Burkhard, Wieler and Schlûchter2015; Ivy-Ochs, Reference Ivy-Ochs2015). The second glacier advance phase happened ca. 21–19 ka on the northern and southern sides of the Alps (Jorda, Reference Jorda1988; Lister, Reference Lister1988; Monegato et al., Reference Monegato, Ravazzi, Donegana, Pini, Calderoni and Wick2007; Starnberger et al., Reference Starnberger, Rodnight and Spötl2011; Federici et al., Reference Federici, Granger, Ribolini, Spagnolo, Pappalardo and Cyr2012, Reference Federici, Ribolini, Spagnolo, Hughes and Woodward2016; Ravazzi et al., Reference Ravazzi, Badino, Marsetti, Patera and Reimer2012; Fontana et al., Reference Fontana, Monegato, Zavagno, Devoto, Burla and Cucchi2014; Reber et al., Reference Reber, Akçar, Ivy-Ochs, Tikhomirov, Burkhalter, Zahno, Lüthold, Kubik, Vockenhuber and Christian2014; Ivy-Ochs, Reference Ivy-Ochs2015; Ivy-Ochs et al., Reference Ivy-Ochs, Lucchesi, Baggio, Fioraso, Gianotti, Monegato, Graf, Akçar, Christl and Carraro2018; Braakhekke et al., Reference Braakhekke, Ivy-Ochs, Monegato, Gianotti, Martin, Casale and Christl2020; Kamleitner et al., Reference Kamleitner, Ivy-Ochs, Monegato, Gianotti, Akçar, Vockenhuber, Christl and Synal2022).
For the western French Alps, until recently, only scarce radiocarbon dates were available (Loebell, Reference Loebell1980; Evin et al., Reference Evin, Marechal and Marien1985; Mandier, Reference Mandier1988; Mandier and Piegay, Reference Mandier and Piegay1991; Bossuet et al., Reference Bossuet, Ruffaldi and Magny1996; Bintz and Evin, Reference Bintz and Evin2002; Mandier et al., Reference Mandier, Evin, Argant and Petiot2003; Doyen et al., Reference Doyen, Vannière, Rius, Bégeot and Millet2015), and two hypotheses were proposed for the chronology of the Late Pleistocene maximum glacier extent, mainly based on a correlation with isotopic data from Greenland. The first hypothesis proposes a glacial maximum ca. 27 ka and the second hypothesis suggests a glacial maximum ca. 22 ka (Schoeneich, Reference Schoeneich1998). Studies of the LGM paleogeography of the western French Alps glaciers were then mainly based only on a morpho-stratigraphical approach (Enay, Reference Enay1981; Mandier, Reference Mandier1984; Monjuvent, Reference Monjuvent1988; Kerrien and Monjuvent, Reference Kerrien and Monjuvent1990), and are not supported by quantitative chronology. More recently, an earlier timing for the glacial maximum has been proposed in the western French foreland (Gribenski et al., Reference Gribenski, Valla, Preusser, Roattino, Crouzet and Buoncristiani2021). The deposits dated using optically stimulated luminescence (OSL) techniques are well-developed glacio-fluvial sediments that are still preserved today and geomorphologically connected to the morainic landforms associated with the Late Pleistocene maximum glacier advances (Mandier, Reference Mandier1984; Roattino et al., Reference Roattino, Crouzet, Buoncristiani and Tissoux2021). The results indicate two geometrically similar maximum advances during MIS 4 and late MIS 3, whereas MIS 2 ages were not recorded (Gribenski et al., Reference Gribenski, Valla, Preusser, Roattino, Crouzet and Buoncristiani2021). Finally, numerical simulations of the last glacial cycle (120–0 ka) in the European Alps indicated the absence of glacier advance on the western French Alps foreland during the LGM (Seguinot et al., Reference Seguinot, Ivy-Ochs, Jouvet, Huss, Funk and Preusser2018), or that the glacier may have spread to a limited extent without reaching the maximum MIS 4/late MIS 3 configurations (Becker et al., Reference Becker, Seguinot, Jouvet and Funk2016; Mey et al., Reference Mey, Scherler, Wickert, Egholm, Tesauro, Schildgen and Strecker2016; Višnjević et al., Reference Višnjević, Herman and Prasicek2020).
The current lack of quantitative data for the LGM period raises the question of glacier paleogeography in the western French Alps foreland during this period. In the western French Alps, 10Be surface-exposure dating spanning the late glacial and the Holocene period has only been applied on the inner valleys (Coutterand and Nicoud, Reference Coutterand and Nicoud2005; Cossart et al., Reference Cossart, Braucher, Fort, Bourlès and Carcaillet2008, Reference Cossart, Fort, Bourlès, Braucher, Perrier and Siame2012; Perret, Reference Perret2014; Wirsig et al., Reference Wirsig, Zasadni, Christl, Akçar and Ivy-Ochs2016; Le Roy et al., Reference Le Roy, Deline, Carcaillet, Schimmelpfenning and Ermini2017; Schwartz et al., Reference Schwartz, Zerathe, Jongmans, Baillet, Carcaillet, Audin, Dumont, Bourlès, Braucher and Lebrouc2017; Protin, Reference Protin2019; Protin et al., Reference Protin, Schimmelpfenning, Mugnier, Ravanel, Le Roy, Deline, Favier and Buoncristiani2019; Prud'homme et al., Reference Prud'homme, Vassallo, Crouzet, Carcaillet, Mugnier and Cortés-Aranda2020) and not in the foreland area.
In this context, this study aims to address two main questions: Did the glacier reached the foreland during the LGM? And if yes, was the LGM advance similar or significantly less extensive than the earlier advances recorded in the Lyon foreland during the last glacial period? Here we present new 10Be surface exposure dating results that, in concert with geomorphological evidence, we used to define the LGM paleogeography of the western French Alps foreland.
GEOLOGICAL SETTING
Geography and bedrock geology
This study focuses on the western French Alps foreland (east of the city of Lyon, Fig. 1). The highest topographic reliefs in this area belong to the southern Jura (~1100 m asl), Chat Mountain (~1400 m asl), and the subalpine Chartreuse massif (~1800 m asl). The Rhône Valley is a wide valley that separates the southern Jura and Chat Mountain before reaching the foreland. In the southern part of the foreland (Terres Froides, Fig. 1), the highest hills reach ~800 m asl and are comprised of Miocene molasses. The rest of the foreland topography is a low-relief area with an average elevation of 300 m asl, which is formed mainly by Miocene sandstone and conglomerate and by the monoclinal limestone series of the Crémieu plateau (Gigout et al., Reference Gigout, Enay, Pierre and Rampnoux1976; David et al., Reference David, Enay and Mangold1978; Monjuvent et al., Reference Monjuvent, Combier and Michel1980; Elmi et al., Reference Elmi, Enay, Mangold and Mongereau1986; Kerrien and Monjuvent, Reference Kerrien and Monjuvent1990).
Topographic map showing main relief, rivers, and geomorphological sectors of the study area. Mapping of the western morainic domain (black ridges), intermediate morainic domain (brown ridges), and eastern morainic domain (green ridges) is synthesized from previous work in the area (Steinfatt, Reference Steinfatt1975; Mandier, Reference Mandier1984; Monjuvent, Reference Monjuvent1988; Monjuvent and Nicoud, Reference Monjuvent and Nicoud1988; Kerrien and Monjuvent, Reference Kerrien and Monjuvent1990; Steiner, Reference Steiner2020; Roattino et al., Reference Roattino, Crouzet, Buoncristiani and Tissoux2021). Locations of the available radiocarbon ages presented in Table 1 are identified with white dots. Locations of the OSL dating (Gribenski et al., Reference Gribenski, Valla, Preusser, Roattino, Crouzet and Buoncristiani2021) are marked by the red triangles for the late MIS 3 ages and by the green triangles for the MIS 4 ages. The inset in the lower left corner shows the main European Alpine ice lobes during their maximal extent (updated from Ehlers et al., Reference Ehlers, Gibbard and Hughes2011). The study area is delimited by a black square and the catchment of the Lyonnais ice lobe is demarcated by the red polygon with the main accumulation areas (MB: Mont Blanc; B: Beaufortain, T: Tarentaise, M: Maurienne).
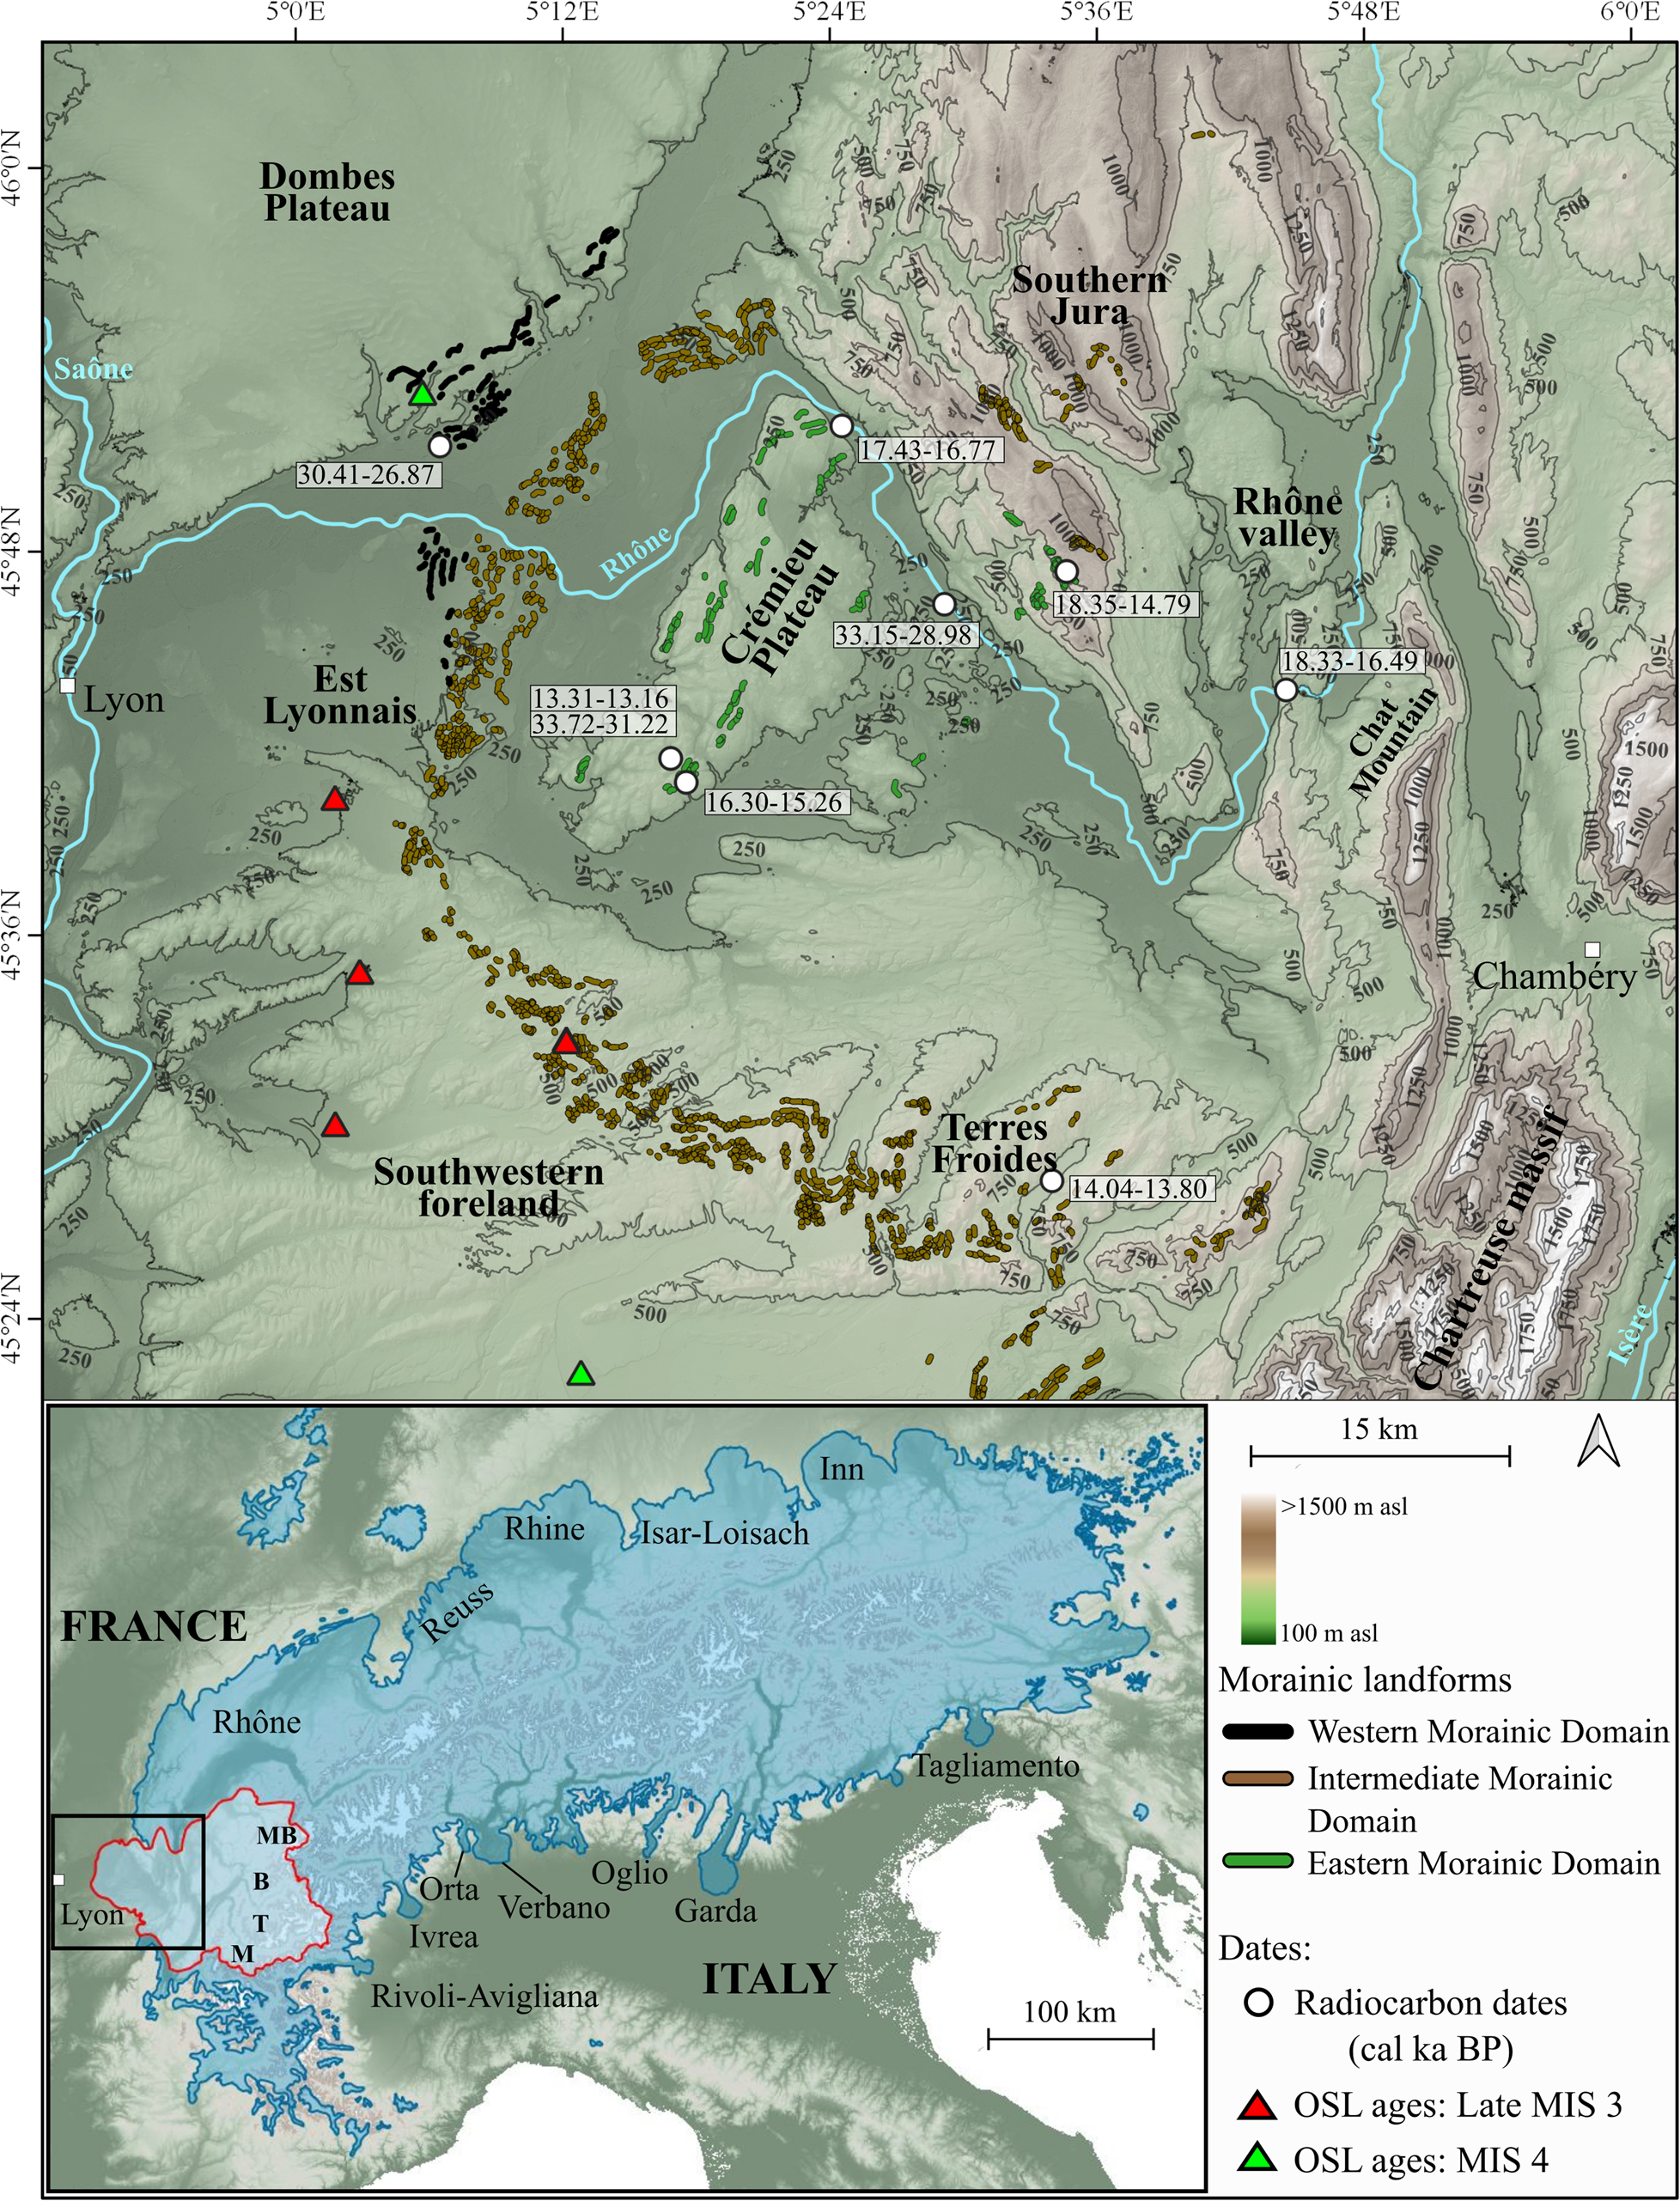
Summary of the radiocarbon dates available in the study area. Ages taken from previous studies are given in ka. These data are calibrated into ka Cal BP with the IntCal 20 calibration curve (Reimer et al., Reference Reimer, Austin, Bard, Bayliss, Blackwell, Ramsey and Butzin2020) along with the associated uncertainty. For each location, the oldest reliable age is presented.
Glacial geomorphology and paleogeography
The last glacial cycle maximum extent in the study area is characterized by a range of moraine landforms known as the Internal Moraine Complex (IMC) (Buoncristiani and Campy, Reference Buoncristiani, Campy, Ehlers, Gibbard and Hughes2011), delimiting the extent of a wide piedmont lobe, which is called the Lyonnas ice lobe. At the scale of the Lyonnais ice lobe, three main morainic domains can be distinguished. The western morainic domain close to the Dombes plateau, the intermediate morainic domain mainly constituted by the IMC, and the eastern morainic domain located in the Crémieu Plateau and southern Jura (Fig. 1).
A new geomorphological map (Fig 1) of the morainic domains was constructed using high-resolution digital elevation model (DEM) RGE ALTI® with 5 m resolution from French National Institute of Geographic and Forest Information (IGN®), in southern Jura, Terres Froides, Southwestern foreland, Est Lyonnais (Steiner, Reference Steiner2020; Roattino et al., Reference Roattino, Crouzet, Buoncristiani and Tissoux2021).
According to the provenance of the pebbles, the Lyonnais ice lobe is fed by glaciers flowing from Mont-Blanc, Beaufortain (Mandier et al., Reference Mandier, Evin, Argant and Petiot2003; Buoncristiani and Campy, Reference Buoncristiani, Campy, Ehlers, Gibbard and Hughes2011), Tarentaise, and part of the Maurienne accumulation zone (Mandier et al., Reference Mandier, Evin, Argant and Petiot2003; Coutterand et al., Reference Coutterand, Schoeneich and Nicoud2009; Coutterand, Reference Coutterand2010) (Fig. 1). Before reaching the piedmont, the ice flowed through the Rhône Valley between the southern Jura and Chat Mountain (Coutterand, Reference Coutterand2010).
During its maximum extent, the Lyonnais ice lobe was ~55 km wide and stretched >40 km into the piedmont. It was bounded to the north by the southern part of the Jura Mountains and to the south by the Terres Froides where the ice flowed in narrow valleys (Fig. 1). In southern Jura, the moraine deposits are mainly arcuate with multiple ridges characteristic of ice marginal deposits. In this area, several longitudinal ridges correspond to lateral and frontal moraines (Kerrien and Monjuvent, Reference Kerrien and Monjuvent1990). In Terres Froides, the morphology of the moraines is constrained by local topography (Fig. 1). Overall, several arcuate moraine ridges can be observed, reflecting several episodes of marginal glacial deposition (Steinfatt, Reference Steinfatt1975). In the foreland plain, the Lyonnais ice lobe has built well-preserved moraines in the Est Lyonnais area (Fig. 1). These glacial landforms are constituted by several sets of crests highlighting several glacial stages of the Lyonnais ice lobe that have been identified and correlated from morpho-stratigraphic and pedological points of view (Mandier et al., Reference Mandier, Evin, Argant and Petiot2003; Steiner, Reference Steiner2020; Roattino et al., Reference Roattino, Crouzet, Buoncristiani and Tissoux2021).
In the southern Jura, glacial retreat moraines were recognized as frontal and arcuate frontal moraines in valleys behind or topographically below the morainic front attributed to the IMC (Kerrien and Monjuvent, Reference Kerrien and Monjuvent1990). During the retreat phases of the Lyonnais ice lobe, several series of morainic landforms, generally oriented NE-SW, with single, multiple, long-linear ridges were also deposited on the Crémieu plateau (Fig. 1) (Monjuvent, Reference Monjuvent1988; Steiner, Reference Steiner2020).
Available chronological data
Available ages, obtained in an attempt to date glacier advances in the study area, come from radiocarbon and OSL techniques. Sampling has focused only on glacio-fluvial and postglacial deposits, and no direct dating of the moraines exists (Loebell, Reference Loebell1980; Vilain et al., Reference Vilain, Evin, Drevon and Marechal1988; Mandier and Piegay, Reference Mandier and Piegay1991; Bossuet et al., Reference Bossuet, Ruffaldi and Magny1996; Bintz and Evin, Reference Bintz and Evin2002; Gribenski et al., Reference Gribenski, Valla, Preusser, Roattino, Crouzet and Buoncristiani2021) mainly due to the general lack of in-place boulders on moraine crests, especially along the IMC margins in the Lyon foreland.
OSL dating of glacio-fluvial outwash terraces associated with the most external IMC moraines reveal two geometrically similar glacier extents. The earliest of these two glacier extents happened between ca. 70 and 60 ka (MIS 4) and is found locally in the Est Lyonnais area and Southwestern foreland. The youngest of these two glacier advances occurred between ca. 42 and 29 ka (late MIS 3) (Gribenski et al., Reference Gribenski, Valla, Preusser, Roattino, Crouzet and Buoncristiani2021), consistent with radiocarbon dating collected above the till near the Dombes plateau (Fig. 1) (Evin et al., Reference Evin, Marechal and Marien1985; Vilain et al., Reference Vilain, Evin, Drevon and Marechal1988).
Radiocarbon ages in the study area have been found for the postglacial lacustrine, fluvial, and karst deposits (Table 1). In Est Lyonnais, near the Dombes plateau (Fig. 1), sampled peat deposits above the outer IMC moraine provided a radiocarbon age of 30.41–26.87 cal ka BP (Evin et al., Reference Evin, Marechal and Marien1985; Vilain et al., Reference Vilain, Evin, Drevon and Marechal1988). In the Eastern Crémieu plateau, radiocarbon dating was performed at a depth of 66 m within a lacustrine deposit (Mandier, Reference Mandier1988), yielding a radiocarbon age of 33.15–28.98 cal ka BP. Other organic samples (Fig. 1) below lacustrine deposits of Moras Lake provided radiocarbon ages of 33.72–31.22 cal ka BP (Mandier et al., Reference Mandier, Evin, Argant and Petiot2003).
A radiocarbon age for human occupation remains yielded an age of 16.30–15.26 cal ka BP (Bintz and Evin, Reference Bintz and Evin2002). In the northeastern part of the Crémieu plateau, radiocarbon dating within a fluvial terrace yielded an age of 17.43–16.77 cal ka BP (Mandier and Piegay, Reference Mandier and Piegay1991). In southern Jura, a lacustrine deposit yielded radiocarbon ages of 18.35–14.79 cal ka BP (Bossuet et al., Reference Bossuet, Ruffaldi and Magny1996). Other lacustrine deposits in the Terre Froides and Crémieu areas provided radiocarbon ages of 14.04–13.80 cal ka BP and 13.31–13.16 cal ka BP, respectively (Doyen et al., Reference Doyen, Vannière, Rius, Bégeot and Millet2015). Lastly, in the very inner zone (Rhône Valley, Fig. 1), radiocarbon dating suggested the first human settlements at 18.33–16.49 cal ka BP (Table 1).
MATERIALS AND METHODS
Sites and sampling strategy for terrestrial cosmogenic nuclide analyses
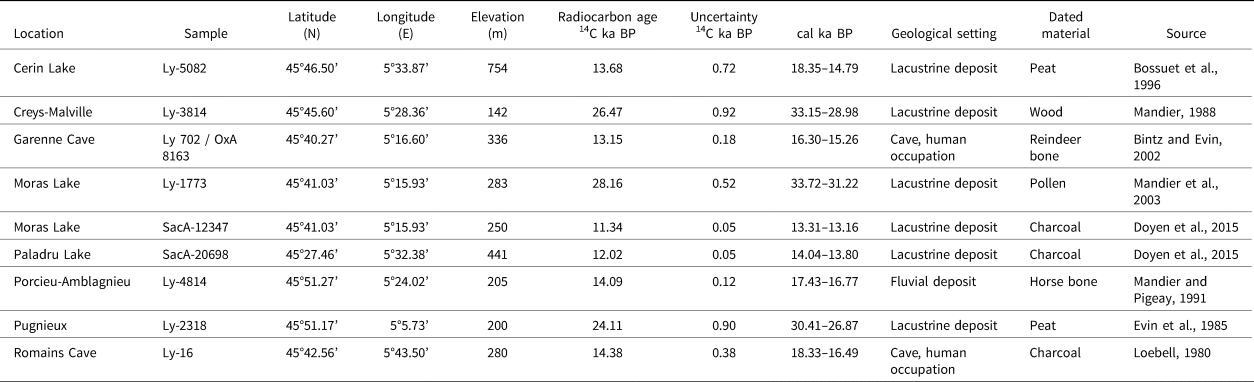
Timing of the glaciations was determined by cosmogenic exposure dating on erratic and glacial boulders using terrestrial cosmogenic nuclide 10Be. Nine glacial boulders and 12 erratic boulders were described and sampled with the aim to track the LGM glacial deposits. On this basis, the investigated areas are located on the intermediate and eastern morainic domains, and in more internal regions of the foreland (Fig. 1). However, on the Southwestern foreland and Est Lyonnais sectors, glacial and erratic boulders for 10Be exposure dating are very scarce. Indeed, the dense urbanization and agriculture in this area are probably responsible for the destruction or displacement of boulders, which further reduces opportunities for sampling. Only one large boulder (ART 18-01) is still preserved within the intermediate morainic domain and is located in the Southwestern foreland (Figs. 1, 2). Better preserved glacial morphologies and/or boulders were surveyed in less anthropized areas: the southern Jura, the Terres Froides, and the Rhône Valley (Fig. 3). Nevertheless, large boulders (>1 m3) are sparse, which limited the number of samples per location and required selecting the best boulders. In the field, the biggest, well-anchored, and quartz-rich boulders were chosen preferentially to minimize potential late remobilization, post-abandonment displacement, as well as sustainable burial. The glacial boulders sampled are located on moraine ridges, while erratic boulders are located on bedrock or till deposits (Figs. 2, 3). A hammer, chisel, and angle grinder were used to sample rock chips measuring 4 cm thick. Sampling strategy targeted the top of the boulders to minimize the effect of snow and/or sediment burial through time. Topographic shielding values were measured using a clinometer and a compass.
Examples of sampled boulders on the southern Jura: INN 18-04 (A); Rhône Valley: CUL 20-01 (B) and CRV 20-01 (C); Crémieu plateau: TRE 18-01 (D); Southwestern foreland: ART 18-01 (E); and Terres Froides: MIR 20-02 (F).
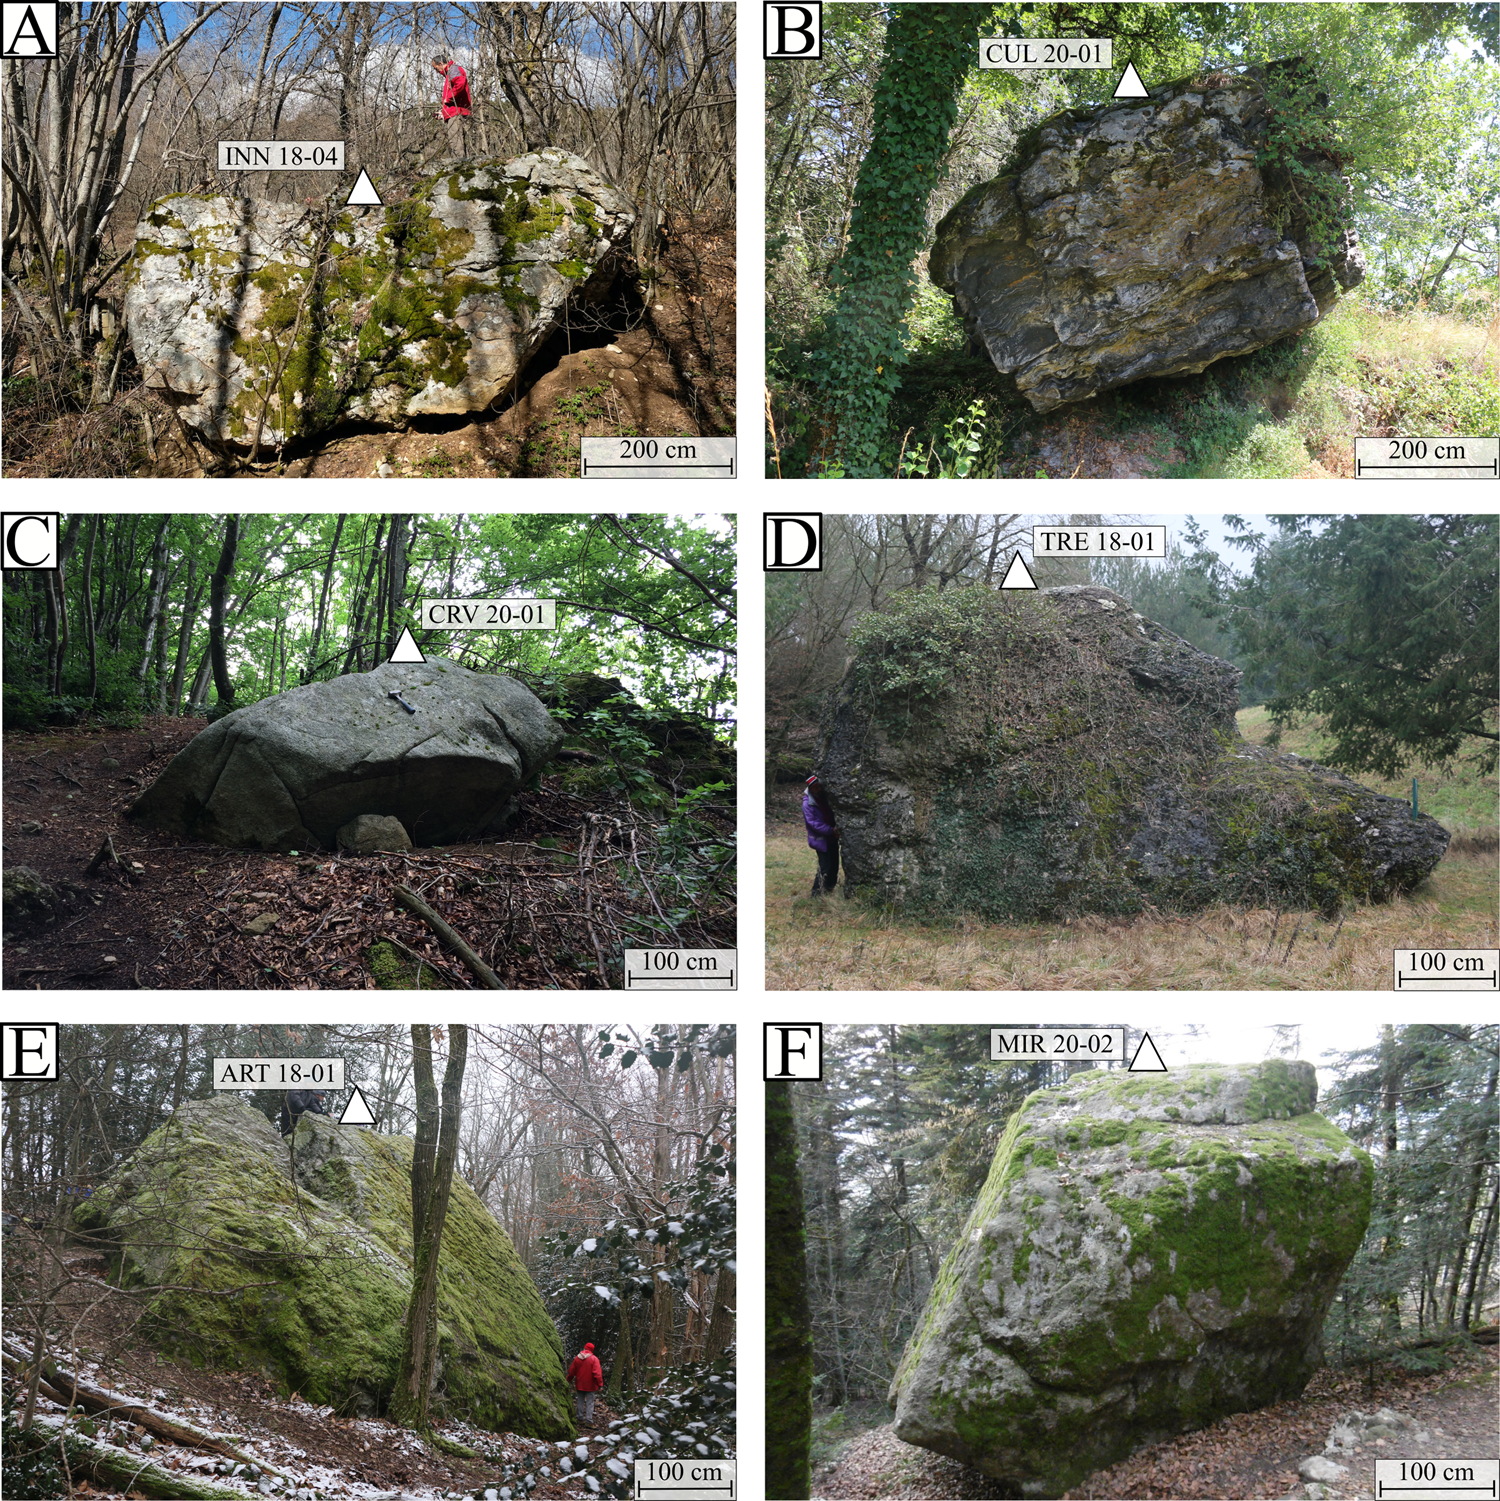
Simplified geological map with Quaternary units from the French Geological Survey (BRGM) (Gigout et al., Reference Gigout, Enay, Pierre and Rampnoux1976; David et al., Reference David, Enay and Mangold1978; Monjuvent et al., Reference Monjuvent, Combier and Michel1980; Elmi et al., Reference Elmi, Enay, Mangold and Mongereau1986; Kerrien and Monjuvent, Reference Kerrien and Monjuvent1990) and location of the western morainic domain (black), intermediate morainic domain (brown), and eastern morainic domain (green), annotated with sampling locations (white circles, with their respective labels and 10Be surface-exposure ages). Locations of figure 4A–E indicated by black squares. Topographical cross-sections A-A’ and B-B’ show the main sampling sectors and locations of the moraines.
Analytical procedure
Rock samples were prepared at the GTC platform (ISTerre, Grenoble, France). Samples were crushed and sieved to keep the grain size between 200 and 500 μm. The magnetic fraction was isolated using a Frantz© magnetic separator, then quartz was isolated from the other minerals by selective dissolution with several etchings by a mixture H2SiF6 (2/3) and HCl (1/3). Quartz grains were etched three times with concentrated hydrofluoric acid (HF) in order to remove the atmospheric 10Be fraction. Approximately 0.5 g of the Be standard solution was used to spike the quartz samples (see Table 3 for details).
The 10Be target was prepared following the protocol of Brown et al. (Reference Brown, Edmond, Raisbeck, Yiou, Kurz and Brook1991), modified by Merchel and Herpers (Reference Merchel and Herpers1999). After total dissolution by concentrated HF, 10Be was extracted using chromatography techniques using anionic and cationic exchange resins (Dowex 1X8 and Dowex 50WX8). Before conditioning for the AMS analysis, the Be target was oxidized to beryllium oxide (BeO) by heating to 900°C. The beryllium ratio (10Be/9Be) was measured using accelerator mass spectrometry at the ASTER AMS facility (Aix en Provence, France) (Arnold et al., Reference Arnold, Merchel, Bourlès, Braucher, Benedetti, Finkel, Aumaître, Gottdang and Klein2010). The 10Be/9Be ratio was normalized with in-house CEREGE standard reference material (called STD-11; Braucher et al., Reference Braucher, Guillou, Bourlès, Arnold, Aumaître, Keddadouche and Nottoli2015) with a theoretical ratio of 1.191/1011.
Age calculation
The online calculator Cosmic Ray Exposure Program (CREP) (Martin et al., Reference Martin, Blard, Balco, Lavé, Delunel, Lifton and Laurent2017) was used to calculate the surface 10Be exposure ages. The production rate scaling scheme used is the LSD model (Lifton et al., Reference Lifton, Sato and Dunai2014), with the ERA-40 database (Uppala et al., Reference Uppala, Kållberg, Simmons, Andrea, Da Costa Bechtold, Fiorino and Gibson2005), used to calculate an atmospheric pressure and the VDM geomagnetic record described by Lifton (Reference Lifton2016). Scaled production rate based on the Chironico landslide production rate calibration was used (Claude et al., Reference Claude, Ivy-Ochs, Kober, Antognini, Salcher and Kubik2014). These parameters were corrected for sample thickness (4 cm) and sample density (2.65 g/cm3), and were scaled with the sample elevation, latitude, longitude, and topographic shielding correction (Table 2). Surface-exposure ages were calculated with the null erosion rate; therefore, the ages are the minimum estimates. No correction for snow effect was applied since no information about the snow cover record over time is available for the studied area. The present-day snow-covered period at the study area is short (1–2 weeks) and insignificant (<20 cm). Therefore, the snow effect on the surface-exposure ages can be considered as negligible.
Geographic coordinates, site information, and apparent size of sampled boulders.

RESULTS
Exposures ages are grouped into fives sectors: Southern Jura, Terres Froides, Southwestern foreland, Crémieu plateau, and Rhône Valley (Fig. 4). We obtained 21 terrestrial cosmogenic nuclides dates, 20 of them distributed between 23.8 ± 1.1 ka and 2.9 ± 0.2 ka, with one much older sample at 496.9 ± 19.2 ka (Table 3).
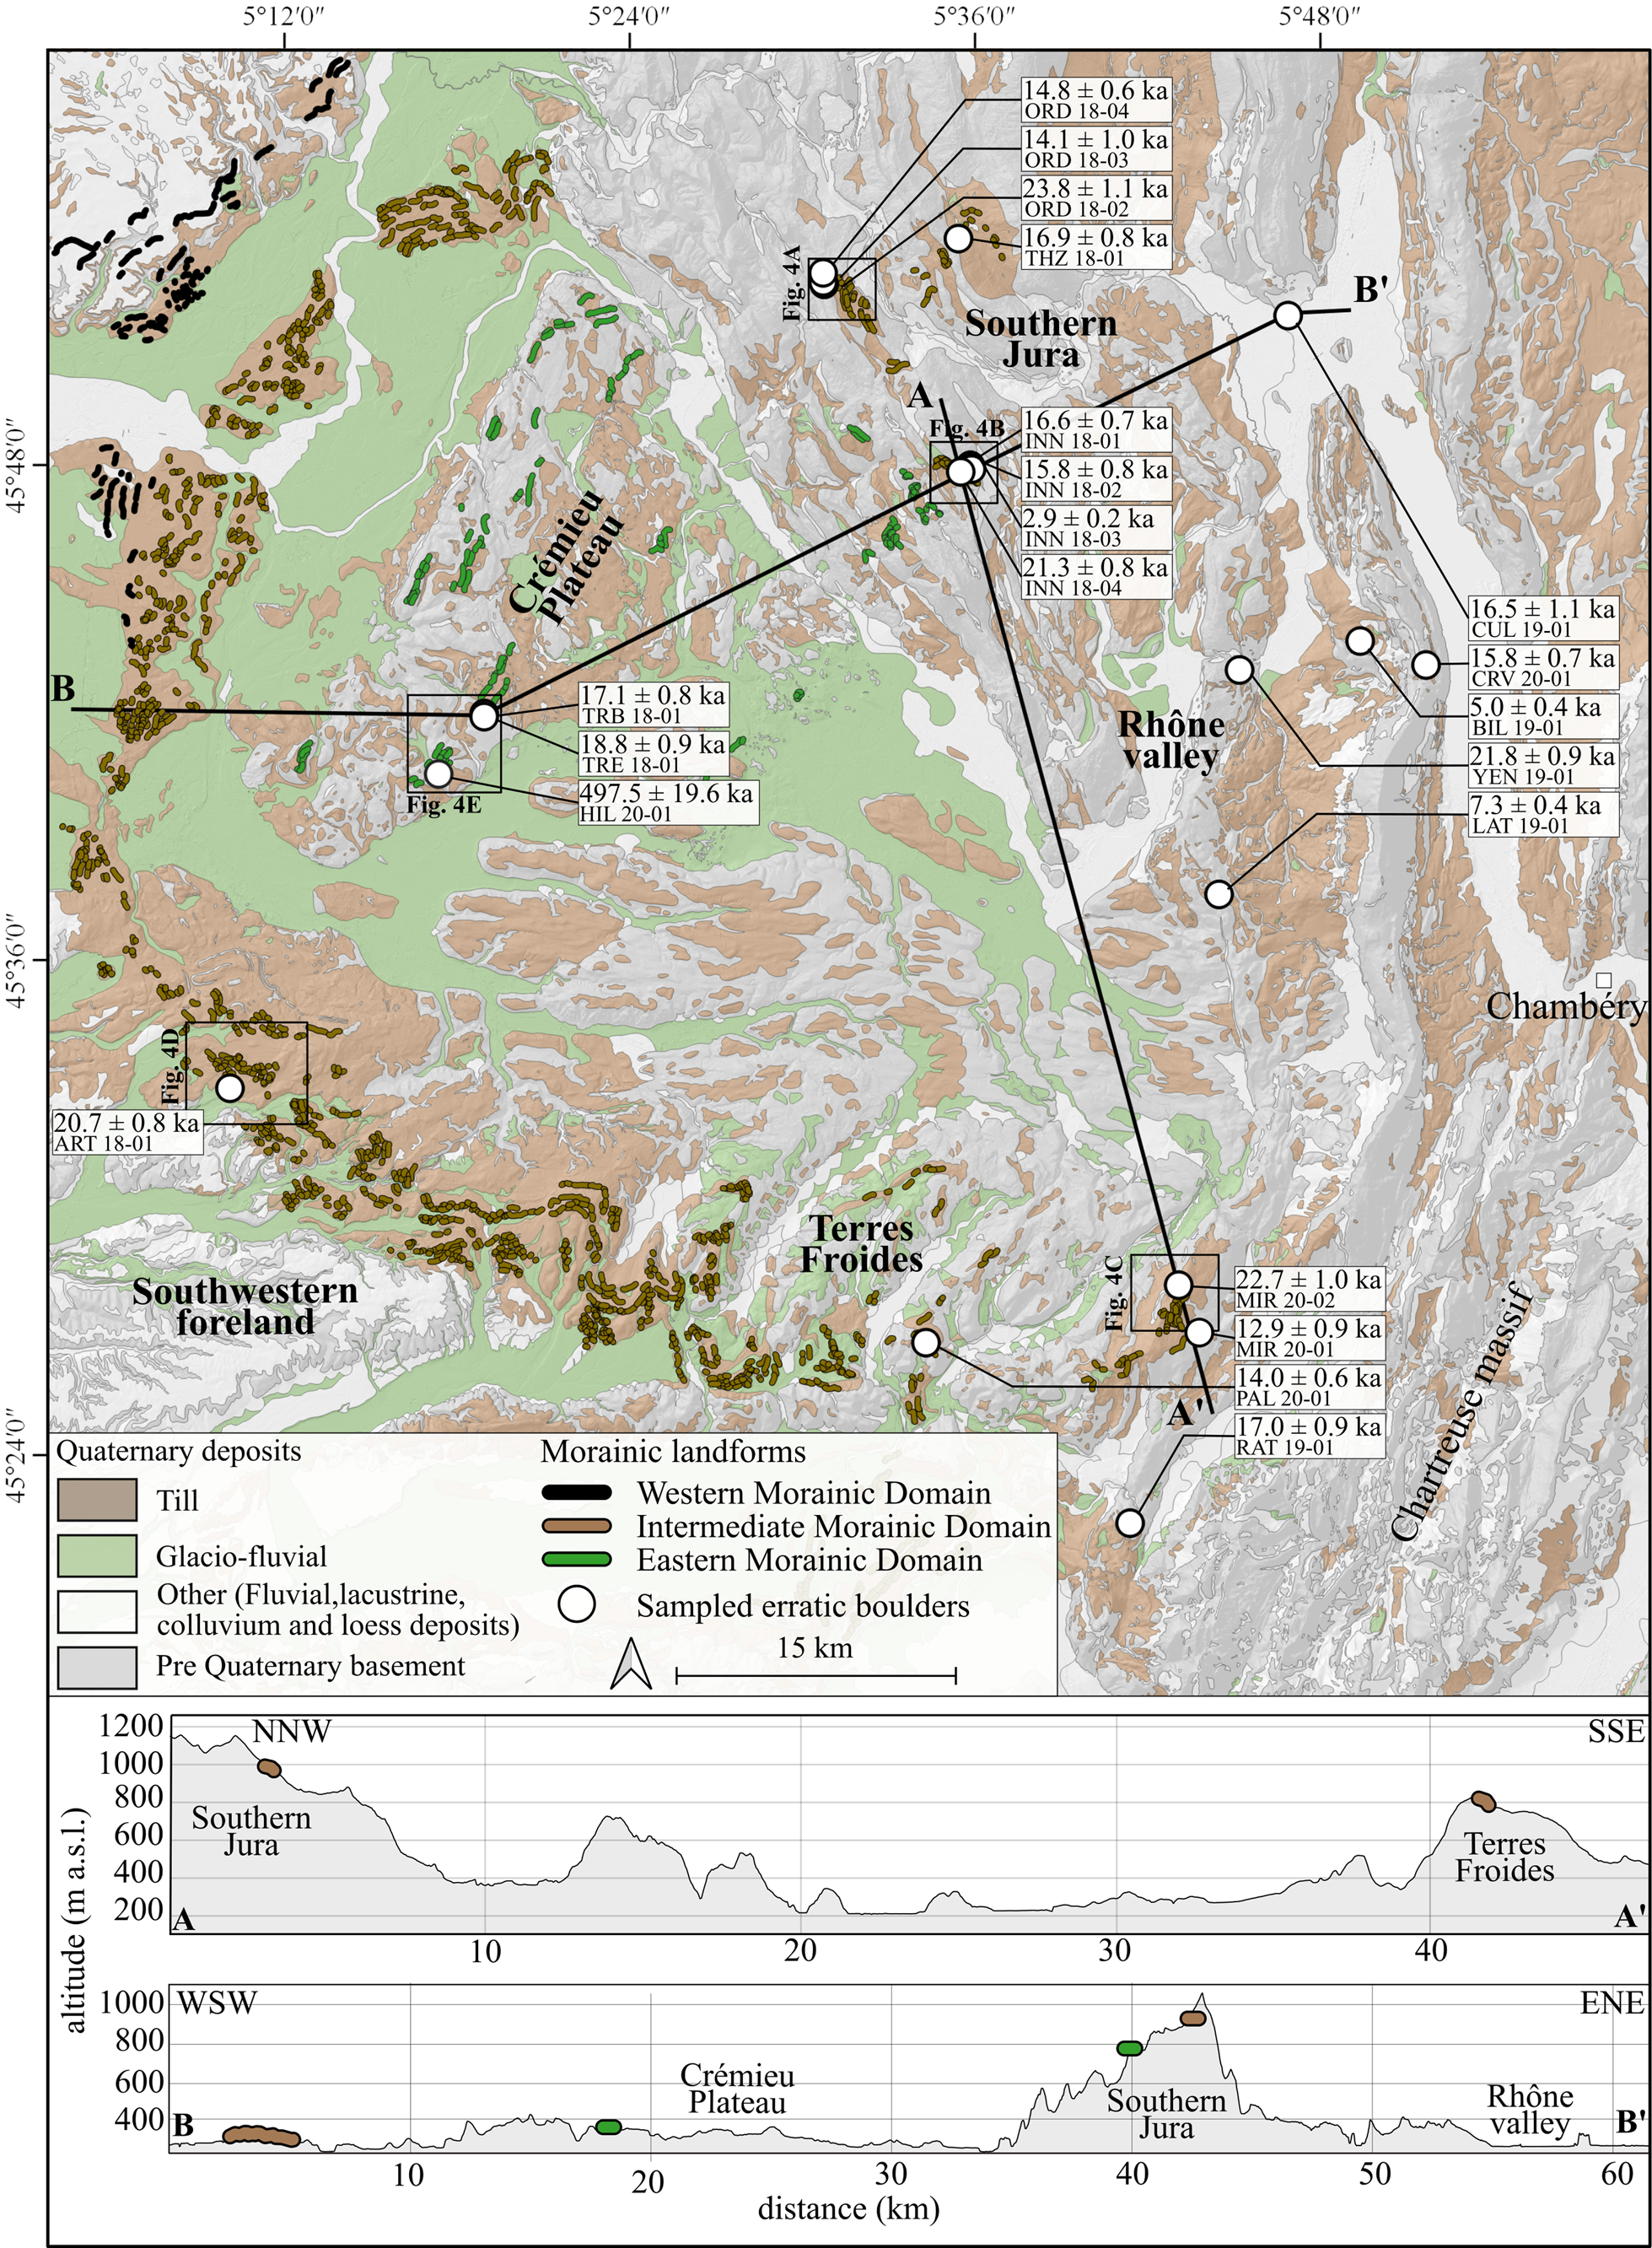
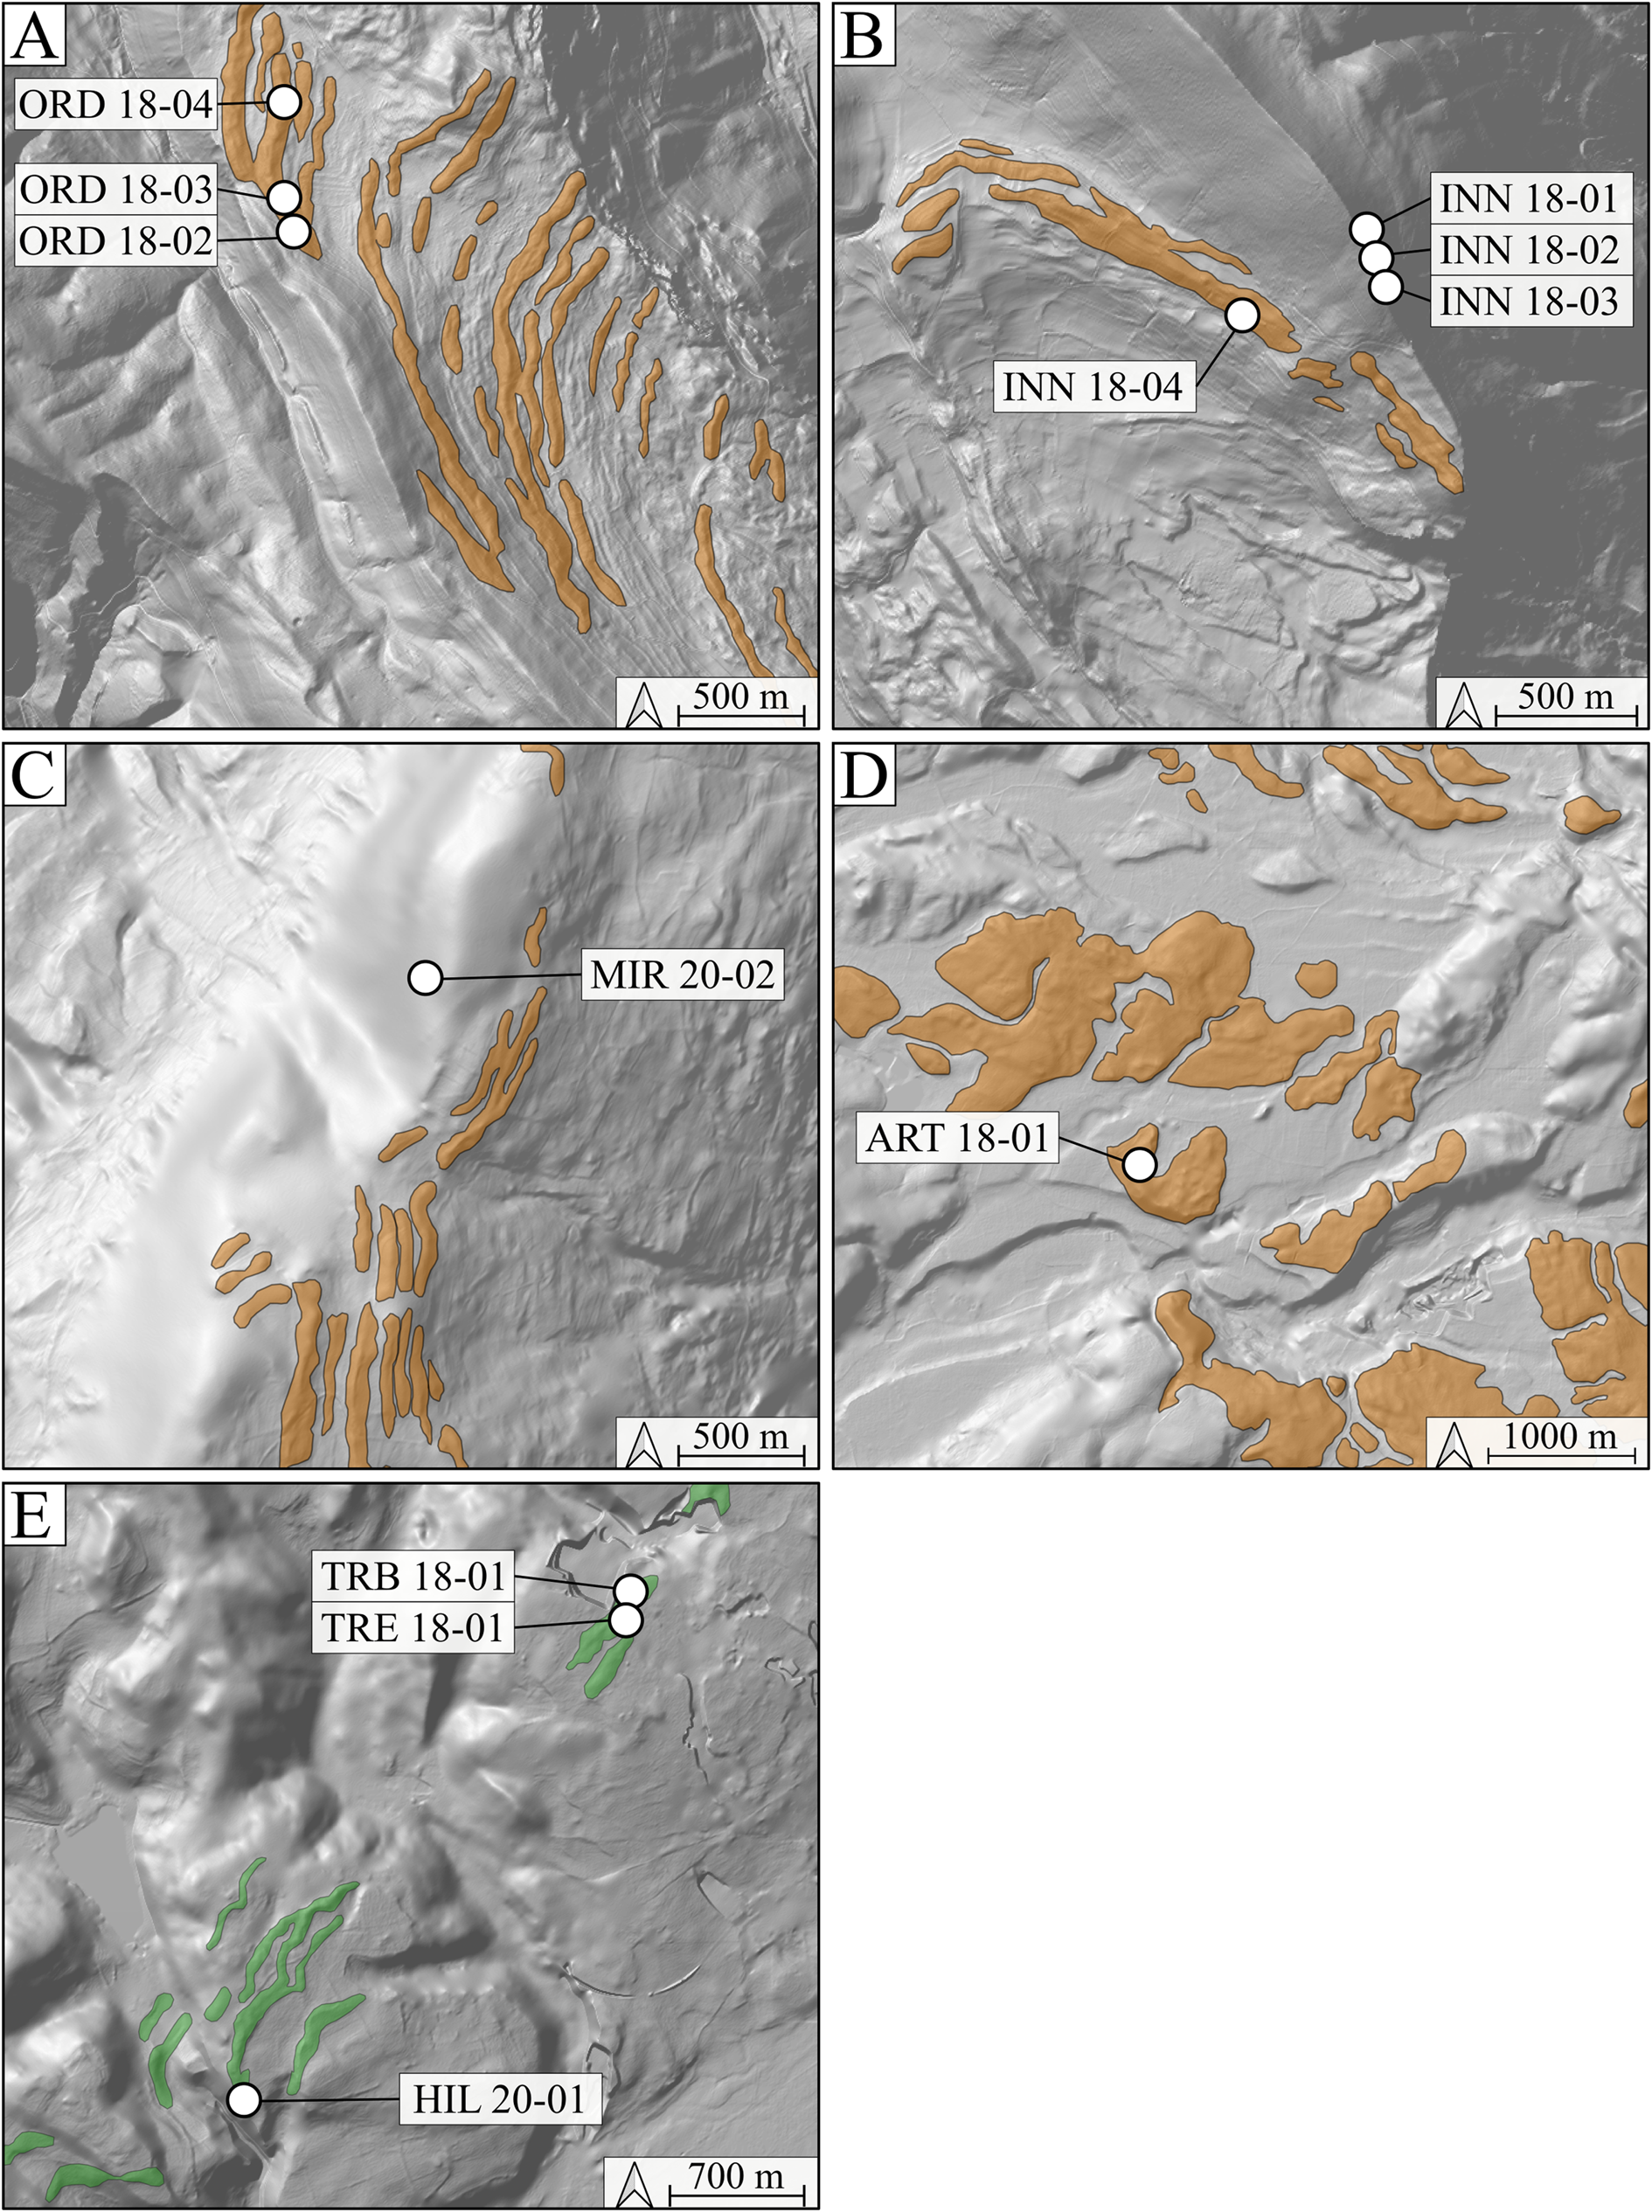
Inset maps (locations given on Fig. 3) from the DEM showing morainic landforms and OSL sampling sites of ORD (A) and INN (B) boulders in southern Jura, MIR 20-02 (C) in Terres Froides, ART 18-01 (D) in the Southwestern foreland, and TRB 18-01, TRE 18-01, HIL 20-01 in Crémieu plateau.
Cosmogenic-exposure data. The surface-exposure ages are calculated with a zero-erosion rate. The scale scheme used for the in situ cosmogenic nuclide production rates is the LSD scaling scheme given by Lifton et al. (Reference Lifton, Sato and Dunai2014). The atmospheric model considered is the ERA40 model (Uppala et al., Reference Uppala, Kållberg, Simmons, Andrea, Da Costa Bechtold, Fiorino and Gibson2005). The geomagnetic database used is the VDM, provided by Lifton (Reference Lifton2016). Production rates are scaled from the reference Chironico production rate (Claude et al., Reference Claude, Ivy-Ochs, Kober, Antognini, Salcher and Kubik2014). Thickness is ~4 cm for all samples. Spike (a) = Scharlau beryllium standard solution, 998 mg/L; (b) = LN2C, 3025 mg/L.

Eight boulders were sampled in the southern Jura area, at altitudes between 800–1100 m asl (Table 2) and located on or close to well-preserved arcuate moraines. ORD 18-02, ORD 18-03, and ORD 18-04 glacial boulders are located on a frontal morainic crest (Fig. 4A) and give dates of 23.81 ± 1.12 ka, 14.08 ± 1.01 ka, and 14.83 ± 0.64 ka, respectively (Table 3; Fig. 4). THZ 18-01 glacial boulder lies on a lateral morainic crest (Fig. 3) and provides a date of 16.86 ± 0.75 ka (Table 3; Fig. 3).
INN 18-01, INN 18-02, and INN 18-03 erratic boulders, which are located on a till deposit, provide surface-exposure ages of 16.56 ± 0.68 ka, 15.79 ± 0.75 ka, and 2.91 ± 0.20 ka, respectively. INN 18-04 glacial boulder lies within a well-preserved frontal moraine (Fig. 4B) and yields a date of 21.32 ± 0.80 ka (Table 3; Fig. 3).
Four erratic boulders were sampled in the Terres Froides, between 670–800 m asl. Erratic boulders MIR 20-01, MIR 20-02, PAL 20-01, and RAT 19-01 are located on till. They are not associated with a clear morphologic feature. Nevertheless, the area corresponds to the intermediate morainic domain (Fig. 4). These erratic boulders provide surface exposure ages of 12.94 ± 0.85 ka, 22.72 ± 0.96 ka, 14.00 ± 0.59 ka, and 16.96 ± 0.87 ka, respectively (Table 3; Fig. 4).
ART 18-01 is the only glacial boulder sampled in the Southwestern foreland. It lies farther west, at 440 m asl, on a hummocky moraine (Table 2; Fig. 4D), and yields an age of 20.71 ± 0.80 ka (Table 3; Fig. 4).
Glacial boulders on the Crémieu plateau are located near the southern margin of this topographic high. Three glacial boulders (TRB 18-01, TRE 18-01, and HIL 20-01) were sampled on a linear morainic ridge (Fig. 4E), at an altitude of 340 m asl (Table 2). These three samples yield ages of 17.08 ± 0.84 ka, 18.81 ± 0.93 ka, and 496.91 ± 19.20 ka, respectively (Table 3; Fig. 4).
The last five sampled erratic boulders (CUL 19-01, YEN 19-01, CRV 20-01, BIL 19-01, and LAT 19-01) are not in the foreland and located in a more internal zone to the east, within the Rhône Valley, located between 300–850 m asl (Table 2). Two boulders (CUL 19-01 and YEN 19-01) lie directly on the bedrock. The three other boulders (CRV 20-01, BIL 19-01, and LAT 19-01) are associated with glacial deposits, but without clear landforms (Table 2; Fig. 3). They provide surface-exposure ages of 16.50 ± 1.08 ka, 21.80 ± 0.85 ka, 15.28 ± 0.65 ka, 4.99 ± 0.40 ka, and 7.33 ± 0.43 ka, respectively (Table 3; Fig. 3).
DISCUSSION
Terrestrial cosmogenic nuclides dating
Two types of geological processes may alter interpretation of the exposure ages on erratic and glacial boulders and induce subsequent erroneous chronological conclusions (Brown et al., Reference Brown, Molnar and Bourlès2005; Chevalier et al., Reference Chevalier, Ryerson, Tapponnier, Finkel, Van Der Woerd, Haibing and Qing2005; Applegate et al., Reference Applegate, Lowell and Alley2007; Barrows et al., Reference Barrows, Lehman, Fifield and De Deckker2007). The first process is the prior exposure to the cosmic rays inducing additional cosmogenic nuclides concentration, also called inheritance. This inherited concentration produces an apparent exposure age older than the true deposition age of the target moraine. The other process is the incomplete post-depositional exposure because of shielding due to burial into a moraine or till. The subsequent exhumation yields reduced cosmogenic nuclides concentration with respect to a full exposure at the surface since deposition. This incomplete exposure induces apparent younger exposure age than the true deposition age. Boulders with significant pre-exposure inheritance are not predominant in glacial contexts because of significant glacier erosion and ice shielding. Incomplete exposure is much more frequent and is the principal source of error in age interpretation (Putkonen and Swanson, Reference Putkonen and Swanson2003; Briner et al., Reference Briner, Kaufman, Manley, Finkel and Caffee2005; Heyman et al., Reference Heyman, Stroeven, Harbor and Caffee2011, Reference Heyman, Applegate, Blomdin, Gribenski, Harbor and Stroeven2016). Considering this assumption, the surface-exposure age can be assessed as a minimum age for the deposition. This assumption is classically used in similar glacier contexts in the Alpine foreland (Ivy-Ochs et al., Reference Ivy-Ochs, Lucchesi, Baggio, Fioraso, Gianotti, Monegato, Graf, Akçar, Christl and Carraro2018; Kemleitner et al., 2022). For each site with multiple samples, the oldest exposure age is retained and considered as closest to the real age of the deposit. The preferred age is often derived from the tallest boulder in the most stable position (Putkonen and Swanson, Reference Putkonen and Swanson2003; Heyman et al., Reference Heyman, Applegate, Blomdin, Gribenski, Harbor and Stroeven2016; Tomkins et al., Reference Tomkins, Dortch, Hughes, Huck, Pallàs, Rodés and Allard2021). We consider the calculation of mean ages as not reliable in this case. For each site with a single sample, the exposure age is considered as a minimum age unless contradictory with the morpho-stratigraphical position of the boulder at the regional scale.
Southern Jura
According with their geological and geomorphological setting, the three sites (INN, ORD, and THZ) of this area belong to the same glacial stage.
For the multi-sampled INN site (Fig. 3), the retained age of INN 18-04 at 21.32 ± 0.80 ka corresponds to the oldest sample, even if it is not the highest in elevation (~140 m difference with highest boulder). INN 18-04 is the tallest erratic boulder sampled on the southern Jura (Fig. 2; Table 2), thus limiting incomplete exposure by burial.
For the ORD site (Fig. 3), the three boulders have a similar size, are located on the top of a well-defined morainic crest, and do not exceed 1 m height above the ground (Table 2). The retained age corresponds to the oldest sample ORD 18-02 at 23.81 ± 1.12 ka.
The THZ site (Fig. 3) contains only one boulder. It is located on the internal slope of the moraine and does not protrude much from the ground (~1 m) (Table 2), making it susceptible to an incomplete exposure by burial or gravitational processes. According to the morphostratigraphical relationship of INN, ORD, and THZ, the age of THZ 18-01 at 16.86 ± 0.75 ka may be considered as underestimated.
For the southern Jura area, the two dated boulder sites (ORD and INN) provide similar oldest exposure ages of 23.81 ± 1.12 ka and 21.32 ± 0.80 ka, respectively, in accordance with the LGM. These dated glacial landforms are the outermost moraines of the southern Jura. No morainic landform attributable to older glacier advances occurs beyond the dated moraines complex, only patches of undated till exist.
Terres Froides
The oldest exposure age of the Terres Froides (Fig. 3) is MIR 20-02 (Fig 2F) at 22.72 ± 0.96 ka, which corresponds to the tallest boulder (Fig. 2; Table 2), limiting incomplete exposure by burial. Similar to the southern Jura area, this age corresponds to the LGM.
MIR 20-02 is not directly located on a morainic landform, but is a few hundred meters from a moraine of the same altitude (Fig. 4C). The age of the closest moraine should be comparable to the exposure age of the boulder. The elevation of this moraine is between 140–50 m below the highest and oldest moraines of the Terres Froides. This geomorphological evidence proves preservation of prior older moraines located topographically above the LGM moraines dated by our exposure ages. According to Steinfatt (Reference Steinfatt1975) and Mandier (Reference Mandier1984), these higher moraines correlate with glacio-fluvial deposits that were later dated MIS4 by Gribenski et al. (Reference Gribenski, Valla, Preusser, Roattino, Crouzet and Buoncristiani2021).
Southwestern foreland
Sample ART 18-01 (Figs. 2E, 3D) is the only large boulder preserved on the IMC in the East Lyonnais and Southwestern foreland (Fig. 3). It is also the largest (252 m3) and tallest (~3.5 m) sampled boulder in the study (Fig. 2; Table 2). It yields an exposure age of 20.71 ± 0.90 ka. It is however situated on the internal slope of the moraine, rendering it vulnerable to incomplete exposure by partial burial or gravitational processes. Because of a lack of robustness due to the small amount of data, this age should be considered, with caution, as a minimum age of a glacier advance in the Southwestern foreland during the LGM.
The glacio-fluvial deposits dated as pre-LGM (Gribenski et al., Reference Gribenski, Valla, Preusser, Roattino, Crouzet and Buoncristiani2021) in this area are correlated with IMC. The exposure age of ART 18-01 suggests that this glacial morphology is more complex and includes a stack of several glacier advances, the latest being LGM.
Crémieu plateau
In this sector (Fig. 3), the three samples have the same lithology (i.e., polygenic conglomerate, Table 2), therefore they come from the same polygenic conglomerate source located in the internal Alps and probably from the same rockfall on the glacier surface. According to Coutterand et al. (Reference Coutterand, Schoeneich and Nicoud2009) and Coutterand (Reference Coutterand2010), this source corresponds to the “Flysch de Tarentaise.” The oldest exposure age of the Crémieu plateau sector is HIL 20-01 at 497.48 ± 19.57 ka. This age is older than the oldest exposure age recorded from any sample obtained from the Alpine glaciations at 144.0 ± 5.3 ka (Graf et al., Reference Graf, Akçar, Ivy-Ochs, Strasky, Kubik, Christl, Burkhard, Wieler and Schlûchter2015). The 10Be concentration measured for HIL 20-01 (~2330 × 103 atoms/g; Table 3) is of the same magnitude as a 10Be concentration found on rock wall scars in the Mont Blanc Massif at an elevation >3400 m asl (Gallach et al., Reference Gallach, Egli, Brandova, Schaepman, Christl, Gruber, Deline, Carcaillet and Pallandre2018). We hence interpret that the 10Be concentration of HIL 20-01 is inherited from a prior exposure to cosmic rays on the original outcrop. Assuming that HIL 20-01 has followed a similar last exposure history as TRE 18-01, we can estimate the inherited 10Be concentration (i.e., prior to last deposition and exposure event on the Crémieu plateau). This can be converted into an apparent exposure age of ca. 60 ka, when considering the highest altitude of the presumed rock source (~2900 m asl).
TRB 18-01 and TRE 18-01 boulders protrude 3.5 m and 3.0 m, respectively, from the ground (Table 2), and lie on a low elevated morainic landform (Fig. 4E), limiting incomplete exposure by burial or gravitational processes. These two samples yield similar exposure ages, and the older exposure age is TRE 18-01 at 18.81 ± 0.93 ka. This exposure age does not overlap within uncertainty with the other LGM exposure ages of the other sectors. It is therefore significantly younger and suggests a readvance or stabilization of the glaciers during the Late LGM.
Rhône Valley
The oldest exposure age of the Rhône Valley sector (Fig. 3) is YEN 19-01 at 21.80 ± 0.85 ka, corresponding to the LGM period. The YEN 19-01 sample is located on a bedrock ridge at 350 m asl, similar to the elevation of the Crémieu plateau boulders. Considering YEN 19-01 internal position and low elevation, the apparent exposure age is too old in comparison with the other samples giving LGM exposure ages located at higher elevation and/or farther in the foreland. Therefore, its overestimated age is probably explained by inheritance.
Excluding the YEN 19-01 sample, the oldest boulder on the Rhône Valley is CUL 19-01 at 16.50 ± 1.08 ka. This erratic boulder is the tallest (2.0 m high; Fig. 2; Table 2) sampled in the Rhône Valley sector. Despite the absence of significant geomorphological evidence allowing us to reconstitute the glacial front associated with CUL 19-01, the inner position and very low elevation (300 m asl) of this sample indicate that the lobe Lyonnais glacier remained in the foreland at least until 16.50 ± 1.08 ka during the late glacial period. This interpretation is supported by the 14C ages (Fig. 1; Table 1) of human settlement in the same area (Romains cave 18.33–16.49 cal ka BP) and the Cerin Lake sediments (18.35–14.79 cal ka BP).
Reconstruction of extent and timing of the western French Alps glacier
Previous studies on glacial landforms in the French Alps foreland were based only on a relative chronology approach (Mandier, Reference Mandier1984; Roattino et al., Reference Roattino, Crouzet, Buoncristiani and Tissoux2021). Well-developed glacio-fluvial sediments that were dated by optically stimulated luminescence (OSL) techniques (Gribenski et al., Reference Gribenski, Valla, Preusser, Roattino, Crouzet and Buoncristiani2021) provided MIS 4 and late MIS 3 ages. Glacio-fluvial deposit associated with the western morainic domain (Fig. 1) belong to the MIS 4. These moraines have never been directly dated because of the lack of boulders. In the same area, Vilain et al. (Reference Vilain, Evin, Drevon and Marechal1988) studied the paleosol above the same till, providing consistent pre-LGM 14C dates (Fig. 1; Table 1). These results evince important pre-LGM glacier extent during the last glacial period (Figs. 5, 6).
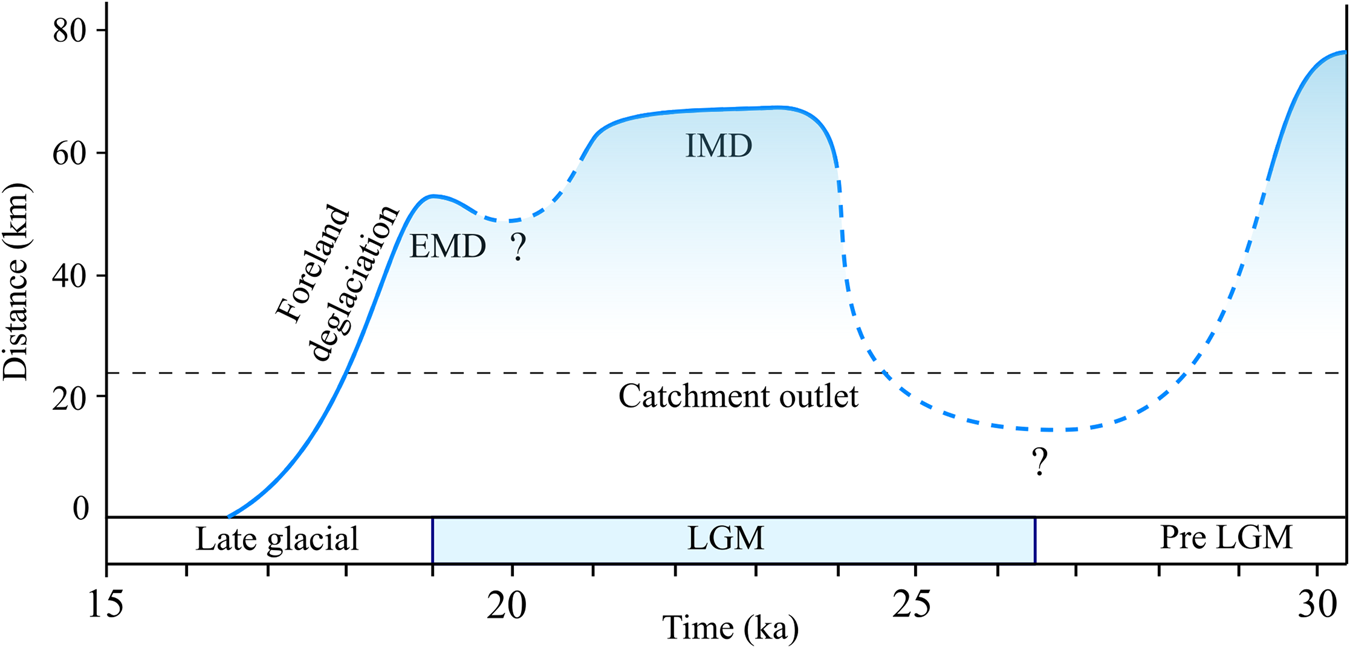
Time- distance diagram for the last glacial cycle glacier advances and retreat of the Lyonnais ice lobe based on OSL, 14C, and our exposure ages. IMD = Intermediate Morainic Domain; EMD = Eastern Morainic Domain. Distance origin is located at the level of CUL 19-01 boulder.
Reconstructed paleogeography of the Lyonnais ice lobe during the LGM. (A) Reconstruction between ca. 24–21 ka, solid lines are a glacial front based on the sets of moraines recognized and considered synchronous according to morphostratigraphical, pedological, and geological interpretations in previous studies and dated by our exposure ages. The gradient area delimited by thin solid lines represents the width of the intermediate morainic complex in the Southwestern foreland and Est Lyonnais where the position of the LGM front is not known precisely. Dotted lines represent supposed glacial fronts.
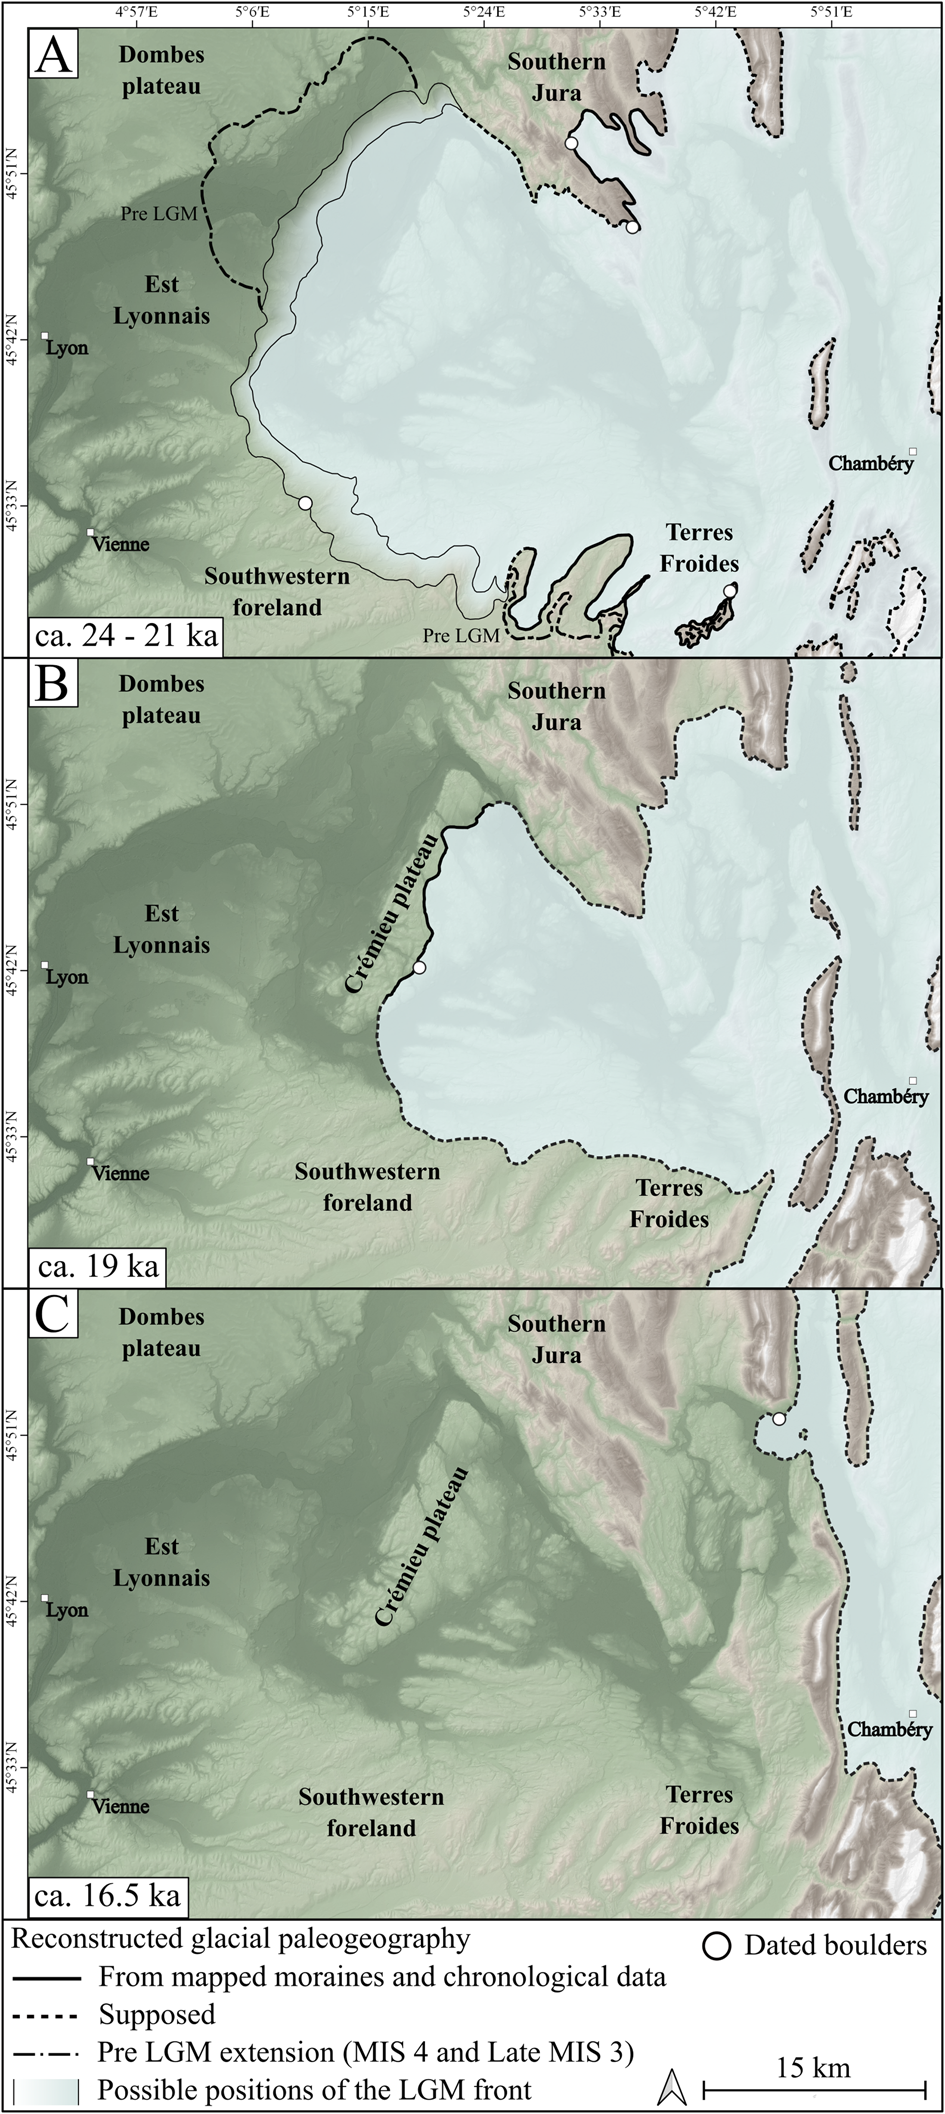
According to our results, dated moraines are at ca. 24–21 ka in Southern Jura, at ca. 23 ka in Terres Froides, and at ca. 21 ka in the Southwestern foreland. These exposure ages are considered as minimum ages. Theoretically, they could be much younger than the real glacier advance age. In this case, they would belong to pre-LGM glacier advances, and the LGM glacier may have not reached the front of the IMC.
However, the absence of older boulders belonging to the last glacial period in our dataset strongly suggests that these ages are representative of a major glacier advance in the region during the LGM. This glacial stage should therefore be associated with main morphological features at the Lyonnais ice lobe scale. This is the case of the moraines from which the sampled glacial boulders come. In the foreland, the intermediate morainic domain is a continuous geomorphic feature running over a length of several tens of kilometers from Terres Froides to the Southwestern foreland and Est Lyonnais (Fig. 1). In Southern Jura, the outermost frontal moraines of Ordonnaz and Innimond are the locally best-preserved geomorphic expression of a glacier advance (Fig. 4). The LGM exposure ages therefore coincide with the major glacier advance features, both in the foreland and in the surrounding relief. The spatio-temporal correlation among these morainic domains appears to be the most plausible hypothesis.
These results do not allow a direct correlation between these morainic landforms and the glacio-fluvial deposits dated using OSL in the Southwestern area. However, they imply that, at least in this area, the two glacier extents (LGM and pre-LGM) are superimposed and confounded in morphology. Several hypothesis may then be considered to explain why LGM ages were not recorded in the OSL based dating: (1) the LGM ice front was not thick enough to overcome the topographic step allowing glacio-fluvial terrace aggradation observed beyond the intermediate morainic domain on Southwestern foreland; (2) considering that the ice front was thick enough, because OSL sampling targets were limited to sand lenses embedded in the glacio-fluvial sequences, a time delay between the levels sampled and the upper terrace surfaces could be possible; and (3) potential partial bleaching, common in glacial environments, would result in overestimated OSL ages. However, the resolution (single grain) at which the measurements were undertaken, as well as the use and concordance of multiple signals (quartz and feldspar) with varying bleaching properties, suggest reliability of the OSL ages.
On Crémieu plateau, dated moraines at ca. 19 ka are significantly younger than the dated moraines on Southern Jura, Terres Froides, and the Southwestern foreland. They are included in a more internal series of frontal moraines located on the Crémieu plateau and associated with a glacier readvance or stabilization phase (Enay, Reference Enay1981; Steiner, Reference Steiner2020). This Late LGM age can be extended to the whole eastern morainic domain.
In the Rhône Valley sector, exposure ages indicate retreat of the glacier from the foreland at ca. 16.5 ka. The age of deglaciation of the western French Alps foreland is supported by radiocarbon data in the study area associated with post-glacial lacustrine, fluvial, and karst deposits (Fig. 1; Table 1).
Deglaciation of the western French Alps foreland between ca 19 ka and ca. 16.5 ka is consistent with the initiation of ice thinning in the western French Alps accumulation zones, more precisely in the Mont Blanc area at ca. 18.5 ka (Wirsig et al., Reference Wirsig, Zasadni, Christl, Akçar and Ivy-Ochs2016; Lehmann et al., Reference Lehmann, Herman, Valla, King, Biswas, Ivy-Ochs, Steinemann and Christl2020).
Our results are also in agreement with previous dating of the glaciers position at the entrance of the Romanche and Arc valleys at 17.5 ka and 15 ka, respectively (Schwartz et al., Reference Schwartz, Zerathe, Jongmans, Baillet, Carcaillet, Audin, Dumont, Bourlès, Braucher and Lebrouc2017; Prud'homme et al., Reference Prud'homme, Vassallo, Crouzet, Carcaillet, Mugnier and Cortés-Aranda2020), and between 17.5–16 ka in the Arve valley (Coutterand and Nicoud, Reference Coutterand and Nicoud2005; Perret, Reference Perret2014).
Lyonnais ice lobe dynamics in the Alpine context
Our results can be used to establish a paleogeographic comparison between the Late Pleistocene advances of the Lyonnais ice lobe and the other Alpine foreland glaciers.
Pre-LGM glacier advances during MIS 4 have been documented in the Swiss Alps from OSL-dated fluvial and glacio-fluvial deposits (Preusser and Degering, Reference Preusser and Degering2007; Gaar and Preusser, Reference Gaar and Preusser2019). The Italian foreland glaciers also show an interesting geometric relationship between the LGM moraines and earlier morainic landforms. An apparently smaller LGM advance than the pre-LGM extent also has been suggested for the Ivrea glacier lobe and Rivoli-Avigliana lobe, which share the Mont Blanc/Tarentaise and Maurienne accumulation zones with the Lyonnais ice lobe (Gianotti et al., Reference Gianotti, Forno, Ivy-Ochs and Kubik2008; Coutterand, Reference Coutterand2010; Ivy-Ochs et al., Reference Ivy-Ochs, Lucchesi, Baggio, Fioraso, Gianotti, Monegato, Graf, Akçar, Christl and Carraro2018). Similar to the western morainic domain of the Lyonnais ice lobe, the pre-LGM dates of the Rivoli-Avigliana glacier moraines during the last glacial period are more external than the LGM moraines (Ivy-Ochs et al., Reference Ivy-Ochs, Lucchesi, Baggio, Fioraso, Gianotti, Monegato, Graf, Akçar, Christl and Carraro2018). Conversely, the other ice lobes in Italy and Switzerland reached their maximum extents during the LGM in the Alpine foreland (Wirsig et al., Reference Wirsig, Zasadni, Christl, Akçar and Ivy-Ochs2016; Monegato et al., Reference Monegato, Scardia, Hajdas, Rizzini and Piccin2017; Braakhekke et al., Reference Braakhekke, Ivy-Ochs, Monegato, Gianotti, Martin, Casale and Christl2020).
LGM moraines in the western French Alps foreland dated between ca. 24–21 ka (Figs. 5, 6A) are consistent with the available chronology of the LGM foreland glaciers across the entire Alps. This result indicates synchronous LGM glacier extent of the western French Alps glacier with respect to the other alpine glacier systems.
The glacier readvance or stabilization phase of the Late LGM highlighted by the Crémieu plateau exposure age (ca. 19 ka) (Figs. 5, 6B) is also documented in the Italian foreland for the Rivoli-Avigliana glacier at 19.6 ± 0.9 ka (Ivy-Ochs et al., Reference Ivy-Ochs, Lucchesi, Baggio, Fioraso, Gianotti, Monegato, Graf, Akçar, Christl and Carraro2018), for the Ivrea glacier at 20.1 ± 3 (Gianotti et al., Reference Gianotti, Forno, Ivy-Ochs, Monegato, Pini and Ravazzi2015), and for the Orta glacier at 19 ± 1 ka (Braakhekke et al., Reference Braakhekke, Ivy-Ochs, Monegato, Gianotti, Martin, Casale and Christl2020). The innermost ice margin of the Verbano foreland glacier (dated at 19.7 ± 1.1 ka) has been correlated to a short-lived glacier readvance (Kamleitner et al., Reference Kamleitner, Ivy-Ochs, Monegato, Gianotti, Akçar, Vockenhuber, Christl and Synal2022). A Late LGM advance has been shown to have occurred between 22–17.5 ka on the Garda ice lobe (Monegato et al., Reference Monegato, Scardia, Hajdas, Rizzini and Piccin2017). In Switzerland, recessional moraines of the Reuss glacier have been dated at 18.6 ± 0.9 ka (Reber et al., Reference Reber, Akçar, Ivy-Ochs, Tikhomirov, Burkhalter, Zahno, Lüthold, Kubik, Vockenhuber and Christian2014). These results show that the glacial landforms of the eastern morainic domain represent the effect of a major climatic stage, at least at the scale of the western Alps.
Western French Alps foreland deglaciation between ca. 19 ka and 16.5 ka (Figs. 5, 6C) is consistent with the initiation of ice thinning in the Alps accumulation zones between 18.5–14 ka (Dielforder and Hetzel, Reference Dielforder and Hetzel2014; Hippe et al., Reference Hippe, Ivy-Ochs, Kober, Zasadni, Wieler, Wacker, Kubik and Schlüchter2014; Scapozza et al., Reference Scapozza, Castelletti, Soma, Dall'Agnolo and Ambrosi2014; Wirsig et al., Reference Wirsig, Zasadni, Christl, Akçar and Ivy-Ochs2016; Lehmann et al., Reference Lehmann, Herman, Valla, King, Biswas, Ivy-Ochs, Steinemann and Christl2020). Parallel to this ice surface lowering in the alpine accumulation zones, deglaciation of the Po plain foreland occurs between 18–17 ka (Gianotti et al., Reference Gianotti, Forno, Ivy-Ochs and Kubik2008; Lauterbach et al., Reference Lauterbach, Chapron, Brauer, Hüls, Gilli, Arnaud and Piccin2012; Ravazzi et al., Reference Ravazzi, Badino, Marsetti, Patera and Reimer2012, Reference Ravazzi, Pini, Badino, De Amicis, Londeix and Reimer2014; Gianotti et al., Reference Gianotti, Forno, Ivy-Ochs, Monegato, Pini and Ravazzi2015; Serra et al., Reference Serra, Valla, Gribenski, Carcaillet and Deline2022). In the north-eastern part of the Alps, the withdrawal seems to be slightly older (20–18 ka; Lister, Reference Lister1988; van Husen, Reference van Husen1997; Reitner, Reference Reitner2007; Schmidt et al., Reference Schmidt, Weckström, Lauterbach and Tessadri2012; Fontana et al., Reference Fontana, Monegato, Zavagno, Devoto, Burla and Cucchi2014). Finally, our results will improve the modeling of alpine glacier dynamics during the last glacial cycle. Contrary to the results of previous models that lack dates, in our study area (Seguinot et al., Reference Seguinot, Ivy-Ochs, Jouvet, Huss, Funk and Preusser2018) our results show that the Lyonnais ice lobe returned to the piedmont during the LGM.
CONCLUSIONS
10Be surface-exposure dating of nine glacial boulders and 12 erratic boulders allowed us to investigate the glacial paleogeography of the western French Alps foreland during the global LGM. Our results provide the first evidence of the Lyonnais ice lobe extension in the piedmont area during the LGM. More precisely, our data suggest that the intermediate morainic domain corresponds to a glacier advance between ca. 24–21 ka. Paleogeography highlighted by our dating and geomorphological mapping implies that the Lyonnais ice lobe extended over the foreland during the LGM, reaching pre-LGM glacier extent in the Southwestern foreland and Southern Jura areas. This paleoglacial extension of the Lyonnais ice lobe during the LGM is similar to that of the Ivrea and Rivoli-Avigliana glaciers (Italian Alps), which share similar accumulation areas. At ca. 19 ka, the eastern morainic domain was deposited by a readvance or stabilization phase. This phase is synchronous with the western Italian and Switzerland forelands ice lobes. According to our exposure ages and radiocarbon dates, after this phase, the Lyonnais ice lobe started a withdrawal phase and left the western French Alps foreland at ca.16.5 ka, which is in agreement with the timing of deglaciation of the western Italian foreland ice lobes. This synchronicity of glacial phases, at least at the scale of the Western Alps, suggests climatic forcing in glacier dynamics.
Acknowledgments
The authors acknowledge financial support from the French Institut National des Sciences de l'Univers (INSU) and the Université Savoie Mont Blanc AAP DIEGO I and II. The BRGM (Bureau de Recherches Géologiques et Minières) is acknowledged for its contribution via the national program Référentiel Géologique de la France Alpes (RGF-Alpes).
The LN2C/ASTER team (V. Godard, R. Braucher, L. Léanni, V. Guillou, K. Kedadouche, G. Aumaître, F. Zaidi) is warmly thanked for chemical preparations and measurements performed at the ASTER AMS facility (CEREGE, Aix-en-Provence). P.G.V. acknowledges funding support from the Swiss National Science Foundation SNSF (Grant PP00P2_170559) and the French ANR-PIA program (ANR-18-MPGA-0006). We gratefully thank Francis Coeur (GTC, Grenoble) for processing the samples. Thanks are owed to Jakob Heyman, Quaternary Research Associate Editor Jason Dortch, and to an anonymous referee for their very constructive and detailed revisions, which greatly improved this manuscript.


 Open access