





1. Introduction
In the classical semiotic theory (Peirce, Reference Peirce and Buchler1955), the term ‘iconic’ refers to cases where the acoustic or gestural (including articulatory) dimension of a communicative signal resembles representational features derived from environmental cues. In spoken interaction, meaning is not conveyed only through arbitrary words but also through iconic cues such as gestures, prosody (i.e., suprasegmental iconicity) and sound symbolism (i.e., segmental iconicity). Prosody and gestures can carry a substantial portion of expressive meaning (see Mehrabian & Wiener, Reference Mehrabian and Wiener1967). Most transparently, gestural, suprasegmental and segmental iconicity occur in communicative cues that relatively directly mirror some visual or acoustic property of a referent. For instance, a communicator can spread arms wide open to provide a gestural cue about the size of the referent (i.e., gestural iconicity), increase the intensity of vocalization when portraying a loud noise of the referent (i.e., suprasegmental iconicity), or use an onomatopoeic word ‘bang’ to emphasize the magnitude of a collision (i.e., segmental iconicity). However, people can also recruit iconic communicative cues so that they present some property of the referent more indirectly and/or metaphorically. For example, communicators might raise the pitch of their voice and use the adjective ‘ pikkuriikkinen ’ (the Finnish word for ‘diminutive’) to emphasize the smallness of the referent object. In contrast to the case of a direct sound–meaning linkage, the high pitch and the word ‘ pikkuriikkinen ’ do not transparently and unequivocally correspond to any visual or acoustic property of the referent. However, the high pitch and the predominance of the vowel [i] in the word may still be taken to highlight the smallness of the referent (Nygaard et al., Reference Nygaard, Herold and Namy2009).
Research has shown that gestures relatively frequently accompany suprasegmental cues (e.g., Krivokapic et al., Reference Krivokapic, Tiede and Tyrone2015) as well as segmental iconicity (Wilding et al., Reference Wilding, Winter, Littlemore and Perlman2025), suggesting that iconicity in spoken communication is a multimodal phenomenon: expressing meanings can be emphasized by recruiting a variety of available iconic visual and acoustic means in parallel. Similarly, one might assume that suprasegmental and segmental iconicity are often used simultaneously to highlight some property of the referent, as is the case in our ‘ pikkuriikkinen ’ example. However, these two dimensions of acoustic iconicity have been mostly studied separately to date. This study focuses on investigating how suprasegmental and segmental iconicity cues are associated with visual properties when these different iconic speech cues occur in the same acoustic stimuli.
1.1. Suprasegmental iconicity
Speech prosody refers to the rhythm, stress and intonation of speech. It can be observed, for example, in speech melody and in the relative prominence of syllables, words and phrases, which occur alongside individual phonetic segments. Prosody has a wide range of communicative functions. For instance, the intonation contour can provide a cue to detect word and phrase boundaries (e.g., Christophe et al., Reference Christophe, Gout, Peperkamp and Morgan2003), and prosody can also deliver information about intentions, attitudes and emotions of a communication partner (Fernald, Reference Fernald1989; Ofuka et al., Reference Ofuka, McKeown, Waterman and Roach2000).
Research has also shown that properties of suprasegmentals can be used to provide information about the meaning of spoken words. Originally, Kunihira (Reference Kunihira1971) demonstrated that monolingual native speakers of English more accurately inferred the meanings of Japanese words when the words were spoken with expressive prosody rather than in a monotone voice. More recently, Nygaard et al. (Reference Nygaard, Herold and Namy2009) showed that people tend to use iconic prosody when they are asked to produce novel words using infant-directed speech (IDS) with a tone of voice (ToV) that underlines a particular quality of an antonym adjective, such as small (vs. large) or short (vs. tall). Concerning these example antonym pairs, the mean fundamental frequency (f0) was higher for producing novel words associated with small and short concepts. In contrast, the f0 variation, as well as the mean intensity, was higher with big and tall concepts. In the same study, listener participants were presented with these novel words in addition to pictures depicting each of the two antonyms (e.g., a tall person and a short person). Listeners were asked to judge which of the two pictures matched the meaning of the novel word. They were significantly more likely to choose the picture corresponding to the word meaning that was produced by speakers using a ToV that was intended to underline the specific quality of this particular adjective, as opposed to neutral prosody. That is, for example, the novel word that was uttered using a ToV that underlined smallness was more likely to be associated with a small dog than with a large dog. At this point, it should be stated that the term ToV is often used to refer to suprasegmental as a shorthand for a combination of feature values typically used for pragmatic and affective purposes. For instance, terms like ‘smooth’ and ‘harsh’ ToV typically refer to laryngeal voice qualities (e.g., breathy vs. pressed voice).
Similar patterns of iconic prosody that were observed in the study of Nygaard et al. (Reference Nygaard, Herold and Namy2009) have been observed in the IDS of mothers who read a picture book to their 2-year-old children by labeling pictures using dimensional adjectives (e.g., strong, weak) (Herold et al., Reference Herold, Nygaard and Namy2012). Research also shows that iconic prosody can facilitate learning the meaning of novel words when the iconic prosody used to utter the word is congruent with the meaning (Reinisch et al., Reference Reinisch, Jesse and Nygaard2013; Shintel et al., Reference Shintel, Anderson and Fenn2014). Furthermore, it has been shown that iconic prosody is recruited when speaker participants are required to produce nonlinguistic vocalizations to communicate the meaning of particular antonyms (small vs. big) to their listener partner (Perlman & Cain, Reference Perlman and Cain2014).
Emotional prosody can similarly function iconically by mirroring the affective quality of the referent. For example, Nygaard et al. (Reference Nygaard, Herold and Namy2009) showed that when a speaker is required to emphasize the meaning of novel words referring to happy or sad emotions using prosody, the mean f0, f0 variation, as well as mean intensity were higher for novel words referring to happy emotions, which in turn enabled identifying the meaning of these novels words as happy or sad with a relatively high accuracy. In another study (Nygaard & Lunders, Reference Nygaard and Lunders2002), listeners were presented with homophones that have both an affective and a neutral meaning (e.g., die/dye). When these words were presented with emotional prosody that was congruent, incongruent or neutral with respect to the affective meaning, the listeners were more likely to recognize emotional meanings when the homophones were presented in a congruent ToV, as opposed to a neutral or incongruent ToV. Together, these findings suggest that prosodic features can iconically reflect both physical and affective dimensions of meaning.
Moreover, Kitayama and coworkers have conducted several Stroop-like studies to investigate whether emotional ToV influences the processing of the meaning of words when the ToV is congruent or incongruent with the meaning (e.g., Kitayama, Reference Kitayama1996). For example, in the study of Ishii et al. (Reference Ishii, Reyes and Kitayama2003), the words that had either a pleasant (e.g., pretty) or unpleasant (e.g., ugly) meaning were pronounced in a smooth and round ToV (pleasant), a business-like ToV (neutral) and a harsh and constricted ToV (unpleasant). The participants were required to judge either how pleasant the ToV of each utterance was or how pleasant the verbal content of each utterance was. Japanese participants had difficulty ignoring vocal tone, which was observed in faster reaction times when there was a congruency between the ToV (e.g., harsh tone) and the meaning (e.g., ugly). Interestingly, American participants showed greater difficulty ignoring verbal content, suggesting cultural differences in the integrated processing of affective content of ToV and verbal meaning. However, taken together, research shows that decoding the word meaning can be facilitated when the emotional and/or iconic ToV is congruent with the meaning of the word.
1.2. Segmental iconicity
The research on segmental iconicity (Sidhu, Reference Sidhu2025) has most commonly focused on investigating how particular speech sounds are associated with the shape (sound-shape iconicity) or size of the referent (sound-size iconicity). Most typically, in the experimental settings, the sound-shape effect show that pseudowords containing unrounded high front vowels [i, e] and/or voiceless stop consonants [t, k] are associated with angular shapes, while pseudowords containing rounded back vowels [u, o] and/or voiced consonants [b, m, l] are associated with round shapes (Fort et al., Reference Fort, Martin and Peperkamp2015; Köhler, Reference Köhler1929). Correspondingly, in the sound-size iconicity, high front vowels ([i] in particular) as well as specific consonants (e.g., [s, t, p]) are associated with small magnitudes. In contrast, low and/or back vowels, such as [ɑ, u, o], as well as particular consonants, such as [g, m, l], are associated with large magnitudes (Newman, Reference Newman1933; Sapir, Reference Sapir1929).
In addition to attributing these effects to the acoustic realization and articulatory configuration of these specific segments (Newman, Reference Newman1933), conceptual higher-order factors may also contribute to these phenomena. For example, Auracher (Reference Auracher2017) has shown that specific segmental sounds are not only associated with small (vs. large) sizes, but the same segmental sounds are also associated with emotional body postures that convey a socioemotional state of fearful-submissive (vs. aggressive-dominant). In general, it seems that sound symbolism effects may be, to some extent, grounded in semantic networks of higher-order representations (Miron, Reference Miron1961; Sidhu et al., Reference Sidhu, Vigliocco and Pexman2022). Sidhu et al. (Reference Sidhu, Vigliocco and Pexman2022) have proposed that, for example, potency-related representations linked to concepts such as weak-strong, small-big, powerless-powerful may partially underlie the sound-size iconicity, whereas activity-related representations linked to concepts such as active–passive, fast-slow, sharp-round may underlie the sound-shape iconicity. All in all, research shows that speech sounds can be sound-symbolically associated with meanings, and some instances of these sound symbolism phenomena, such as the sound-size and sound-shape iconicity, can be based on semantic networks of higher-order representations.
1.3. Can suprasegmental and segmental iconicity be processed in the speech signal in parallel?
Prosodic and gestural communicative cues are often used jointly (Esteve-Gibert & Prieto, Reference Esteve-Gibert and Prieto2013; Krivokapic et al., Reference Krivokapic, Tiede and Tyrone2015; McNeill, Reference McNeill1992). For instance, regarding emotional prosody, when vocally referring to something that has happy content or when vocally expressing a happy mood, the rising intonation is often accompanied by happy facial expressions consisting of, for example, the rising of eyebrows, head and arms (Dael et al., Reference Dael, Mortillaro and Scherer2012; Kohler et al., Reference Kohler, Turner, Stolar, Bilker, Brensinger, Gur and Gur2004). Regarding the interplay between iconic prosody and gestures, Perlman (Reference Perlman, Fischer, Akita and Perniss2026) has proposed that particular patterns of iconic prosody and iconic gestures might be fundamentally coupled in communication. In line with this view, for example, McClave (Reference McClave1998) has shown that the stroke of a propositional gesture tends to co-occur with the peak of fundamental frequency of an intonation. Moreover, recent research has revealed that segmental iconicity is relatively frequently accompanied by gestures (Wilding et al., Reference Wilding, Winter, Littlemore and Perlman2025). These observations reveal that expressing meanings is frequently emphasized by recruiting a variety of available iconic visual and acoustic means in parallel. It might be assumed that suprasegmental and segmental iconicity would be similarly used simultaneously to highlight some property of the referent. One might, for example, emphasize the effectiveness of the onomatopoeic word ‘banging’ in the sentence ‘someone was banging on my door’ by lowering the voice and increasing the intensity of the ToV. However, these two elements of acoustic iconicity have been mostly researched separately so far.
Traditionally, a division of labor between suprasegmental and segmental speech elements has been emphasized in most textbooks on phonetics (Ladefoged & Johnson, Reference Ladefoged and Johnson2010). Nevertheless, it has been shown that these two levels of speech signal can also interact. Listeners take into account the prosodic structure when interpreting segments, so that, for example, the phonetic form of a segmental phoneme is to some extent determined by the prosodic position in which it occurs (e.g., Cho & Keating, Reference Cho and Keating2009; Fougeron & Keating, Reference Fougeron and Keating1997).
In the context of iconicity, the interaction between suprasegmental and segmental iconicity in speech production has been reported by Michelini and Nygaard (Reference Michelini and Nygaard2025). They investigated whether a sound symbolic association between a novel word and a given meaning can influence the prosodic patterns of pronounced novel words. Participants were required to vocally produce pseudowords – associated with small or large sizes in the earlier study – to small and large targets. The visual size of the animal referent did not significantly influence vocal characteristics. However, the intensity of utterances was altered in accordance with the size evoked by the pseudowords themselves. That is, for example, the pseudowords containing ‘large-sounding’ segmental units were pronounced with a relatively high intensity. Furthermore, it has been shown that the pronunciation of ideophones in Japanese involves an iconic potential of the prosodic features (Akita & Kawahara, Reference Akita and Kawahara2025). For example, a heightened f0 was observed with ideophones that refer to faster and more pleasant movements. These studies show that prosodic and segmental iconicity can interact in vocal production.
The present study investigates whether listeners can process both types of acoustic iconicity simultaneously within the same speech signal. So far, this research question has been addressed only by Akita (Reference Akita2021, Reference Akita2025). Akita showed that when pseudowords composed of vowels and consonants that are hypothetically congruent with size (small vs. large) or shape (spiky vs. rounded) are pronounced using the phonation types of creaky voice, falsetto and whisper, sound-symbolic effects extend beyond segmental speech features. In addition to the standard sound symbolism effects based on consonants and vowels, creaky voice was associated with large and spiky images, whereas falsetto was associated with roundedness. However, it is noteworthy that the hypothesized iconicity of these phonation types is not based on empirical evidence; it is unclear how creaky voice iconically represents the perceptual dimension of large, or how falsetto iconically represents the perceptual dimension of roundness. The present study investigates whether suprasegmental and segmental iconicity can simultaneously influence associating a novel word with a visual attribute that is hypothetically congruent or incongruent with the segmental and/or suprasegmental iconic elements of the auditorily presented word. However, in contrast to Akita’s study, the present study employs phonation types that provide empirically established, relatively direct and unambiguous iconic cues to the meaning of the referent. Accordingly, this research primarily investigates whether segmental iconic features of speech stimuli can cue associations between a pseudoword and potency- and activity-related meanings, even when suprasegmental iconic properties simultaneously and relatively unambiguously signal those same meanings.
1.4. The present study
In the study, participants were presented with a visual target image. In addition, they were auditorily presented with a pseudoword that was hypothetically congruent, neutral or incongruent with a specific attribute of the target image, such as size. The congruency between the pseudoword and the image attribute was based on segmental or suprasegmental iconicity, or both. In Experiment 1, we investigated whether participants can recruit segmental and/or suprasegmental iconicity of the words in linking the word to activity-related concepts, such as round and angular shape or passive and active action. In Experiment 2, we investigated whether participants recruit these iconic elements of the words in linking the words to potency-related concepts, such as weak and strong or small and big. Participants were asked to rate the matchability of the word to the target attribute using a 6-point Likert scale.
Prosodic cues – emotional in particular – automatically grab the perceiver’s attention (e.g., Brosch et al., Reference Brosch, Grandjean, Sander and Scherer2008; Stern et al., Reference Stern, Spieker and MacKain1982). For instance, when participants are asked to rate the valence of words or sentences with either positive or negative connotations, and that are spoken with positive, negative and neutral prosody, prosody has a larger impact than semantics (Ben-David et al., Reference Ben-David, Multani, Shakuf, Rudzicz and van Lieshout2016; Mehrabian & Wiener, Reference Mehrabian and Wiener1967). However, it remains unclear whether the iconic prosody of a speech signal dominates the processing of iconicity to the extent that it interferes with the processing of segmental iconicity cues. If so, any sound–meaning effects arising from segmental iconicity cues may be weakened when listeners process the iconic prosody of speech signals (competition hypothesis). Alternatively, iconic prosodic and segmental cues may be processed simultaneously when associating speech signals with meaning (concurrent processing hypothesis). Iconic prosody may also facilitate meaning associations based on segmental iconicity, particularly when the prosodic and segmental cues are congruent (facilitation hypothesis). Based on the previous research, the facilitation hypothesis seems most likely because people appear to recruit prosodic cues to emphasize the iconic cues of segmental speech units in speech production (Michelini & Nygaard, Reference Michelini and Nygaard2025), in the same way as iconic gestures are often used to emphasize the meaning expressed verbally (Ozçaliskan & Goldin-Meadow, Reference Ozçaliskan and Goldin-Meadow2005).
This study asks the following questions: First, previous investigations of segmental sound symbolism that have required associating auditorily presented pseudowords with particular concepts have mostly used relatively monotonic acoustic stimuli (i.e., stimuli that is lacking any systematically controlled iconic prosody), or stimuli in which the iconicity value of suprasegmental elements is quite hypothetical in the context of given meanings (Akita, Reference Akita2021, Reference Akita2025). Therefore, it is not clear whether we can observe sound-meaning mappings between the segmental iconicity of pseudowords and the image attribute at all, when the acoustic signal conveys information of prosodic iconicity, which directly enables mapping the pseudoword with an image attribute. That is, can these two iconic elements of speech signal be processed concurrently to map the pseudoword with a concept? If they cannot be processed in conjunction, we may, for example, observe the segmental sound symbolism effects only with the pseudowords that are neutral in terms of prosodic iconicity. Indeed, according to the ‘competition hypothesis’, when the speech signal consists of cues of iconic prosody, the signal is mapped to the meaning exclusively based on iconic prosody cues, perhaps even at the expense of processing the segmental iconicity of the speech signal. Second, if the results of the present study support the ‘concurrent processing hypothesis’ and segmental sound-symbolic effects are observed alongside the influence of prosodic iconicity in mapping pseudowords to image attributes, it is important to determine whether the effects of prosodic iconicity and segmental iconicity can also be observed independently of each other. That is, whether the segmental sound symbolism effects can be observed even when the prosodic iconicity of the speech signal is congruent or incongruent with the segmental iconicity of the speech signal. Third, according to the ‘facilitation hypothesis’, it is possible that these two iconicity channels – segmental and suprasegmental – are not only processed in parallel, but the iconicity cues of suprasegmental features can even reinforce mapping the speech signal to a meaning when the iconic prosody is congruent with the iconic cues of segmental speech units.
1.5. Experiments 1 and 2
As mentioned above, it has been shown that a smooth/pleasant ToV is typically associated with pleasant concepts, while a harsh/unpleasant ToV is associated with unpleasant concepts (e.g., Ishii et al., Reference Ishii, Reyes and Kitayama2003). Furthermore, pseudowords constructed from sharp-sounding segments (e.g., [i], [t] and [k]) and angular shapes have been associated with unpleasant and arousing affects, while pseudowords constructed from round-sounding segments (e.g., [o], [b] and [m]) and round shapes have been associated with pleasant and passive-calm affects (Aryani et al., Reference Aryani, Isbilen and Christiansen2020; Vainio et al., Reference Vainio, Mo and Vainio2025). Experiment 1 investigates whether a smooth/harsh ToV is associated with round/angular shapes in the same way as they are associated with pleasant/unpleasant concepts. More importantly, this experiment explores whether suprasegmental (smooth, neutral and harsh) and segmental (round-sounding, neutral-sounding and sharp-sounding) iconicity cues of pseudowords can be recruited in parallel to associate the word with a hypothetically congruent attribute of the target image, such as shape, activity or pleasantness. As such, the suprasegmental and segmental features of the pseudoword can be either congruent, neutral or incongruent with the attribute.
Experiment 2 uses the same method as Experiment 1, with the exception that, in Experiment 2, we investigate whether iconic speech cues of suprasegmentals and segmentals can be used in parallel to link the pseudoword to a size or strength-related attribute of the target image. For this purpose, the pseudowords built from hypothetically small-sounding, neutral-sounding or large-sounding segments are pronounced in ‘diminished’ prosody, ‘neutral’ prosody or ‘magnified’ prosody (see Nygaard et al., Reference Nygaard, Herold and Namy2009 for these phonation types). As such, this experiment investigates whether suprasegmental (diminished, neutral and magnified) and segmental (small-sounding, neutral-sounding and large-sounding) iconicity cues of pseudowords can be recruited in conjunction to associate the word with a hypothetically congruent attribute of the target image, such as size and strength.
In experimental research, size and shape sound symbolism have been examined using either visually presented pseudowords (e.g., Eberhardt, Reference Eberhardt1940; Preziosi & Coane, Reference Preziosi and Coane2017; Thompson & Estes, Reference Thompson and Estes2011) or auditorily presented pseudowords (e.g., Newman, Reference Newman1933; Ohtake & Haryu, Reference Ohtake and Haryu2013; Sapir, Reference Sapir1929). Participants are typically asked to judge the smallness or largeness of a word using two-alternative forced-choice tasks (e.g., Newman, Reference Newman1933; Sapir, Reference Sapir1929) or Likert-scale rating tasks (e.g., Akita, Reference Akita2021; Knoeferle et al., Reference Knoeferle, Li, Maggioni and Spence2017; Lacey et al., Reference Lacey, Matthews, Sathian and Nygaard2024). However, such explicit association tasks require the conscious mapping of speech sounds onto a size- or shape-related context, generally without strict time constraints. Consequently, these tasks may increase the likelihood of strategic responding and are not ideally suited to capturing automatically activated associations (Moors & De Houwer, Reference Moors and De Houwer2006). Nevertheless, only a limited number of studies have employed implicit association tasks to investigate size and shape sound symbolism (Auracher, Reference Auracher2017; Hoshi et al., Reference Hoshi, Kwon, Akita and Auracher2019; Parise & Spence, Reference Parise and Spence2012). In the present study, we employed an explicit association task for two reasons. First, we aimed to ensure that our findings would be directly comparable with those of previous studies in this field. Second, because we were interested in whether the prosodic properties of the speech stimuli would bias responses toward the nontarget item, the target and nontarget items were presented simultaneously on the screen.
2. Method
2.1. Participants
Twenty-eight people participated in Experiments 1 and 2 (19–43 years of age; mean age = 27.3 years; seven males; one left-handed). All participants had normal or corrected-to-normal vision and hearing and were native Finnish speakers. All participants were naïve to the purpose of the study. Informed consent was obtained from participants to participate in the study. To estimate the sample size, we carried out the power simulations based on our unpublished dataset from the study, which had a similar experimental design (Likert scale 1–6) and research question. That study investigates how auditorily presented pseudowords, differing in their content of segmental phonemes, are associated with different colors/shapes that are hypothesized to be either calming or arousing. The independent variable of the design is a congruency (1 = congruent, 2 = neutral and 3 = incongruent) between the segmental type of the pseudowords (1 = ‘bouba’-like words, 2 = neutral words and 3 = ‘kiki’-like words) and the emotional type of the color/shape (1 = calming and 2 = arousing). That study is a part of the other research project and will be fully reported elsewhere later. The simulated data (pilot_data.sav), the data of this study, as well as other material that is relevant to this study, are openly accessible in the OSF repository: https://osf.io/ytgke/overview?view_only=e2acc0be0002450cb459096cdf3c3233. The simulation was run with R package simr (Green & MacLeod, Reference Green and MacLeod2016). The study of the power analysis included 29 participants. In these data, the p-value was < .001 and the effect size was (dz) 1.8 for the congruency effect. In the model structure, there was a random intercept for subject and a random slope of congruency (i.e., the hypothesized congruency between the visual stimulus and the pseudoword type; congruent, neutral and incongruent). The outcome variable was ‘response’ (Likert scale 1–6). Four hundred simulations per sample size were used to estimate power. This linear mixed-effects model was fitted with the lmer() function from the R Foundation for Statistical Computing’s lme4 package. Significance criterion was α = 0.05, and the power threshold was 0.80. The simulations suggest that as few as 10 observers (estimated power = 99%) would suffice to produce a statistically significant difference in evaluating the color-related calmness/arousal of these pseudowords. However, given that a large portion of the participants (up to 50%) are likely to be familiar with the shape-sound symbolism phenomenon (see Vainio et al., Reference Vainio, Mo and Vainio2025), we decided to recruit more than twice as many participants as estimated by the power simulation. The study was conducted according to the principles expressed in the Declaration of Helsinki. Written informed consent was obtained from all participants, and the participants were able to withdraw their consent and participation at any time without consequence. The participants received gift cards valued at 20 euros as compensation for participating. The study was approved by the Ethical Review Board in the Humanities and Social and Behavioral Sciences at the University of Helsinki.
2.2. Apparatus, stimuli and procedure
Each participant sat in a dimly lit room with his or her head 80 cm in front of a 25-inch Full HD monitor (screen refresh rate: 60 Hz; screen resolution: 2560 × 1440). Presentation® software (V16.1; https://www.neurobs.com) was used to execute the study. Manual responses were performed with the Cedrus response pad located at the front of the monitor. All participants performed Experiments 1 and 2 in a single session that lasted approximately 40 min. The order of the experiments was randomized between the participants (i.e., half of the participants started with Experiment 1). There was a short break, which lasted approximately 10 min, between the experiments. This break included the instructions and practice for the second experiment.
Experiment 1: Experiments consisted of 144 trials. Participants responded using their right hand by pressing one of the six response keys. The response keys were numbered from 0 to 5. The response pad was positioned vertically so that the key with the largest number (5) was located furthest from the participant, while the key with the smallest number (0) was located closest to the participant. Participants were auditorily presented with a pseudoword (the list of all pseudowords is provided in the repository). Participants were falsely told that some of the words were semantically meaningful in some foreign language and that some of the words were manipulated from real foreign words. The word was presented twice with a silent 1-second interval between the presentations. A visual black-and-white stimulus appeared at the onset of the word. The visual stimuli were displayed for 9.5 s at the onset of the auditory stimulus. The visual stimuli consisted of two images, one located on the left and the other on the right. A black arrow was pointing vertically to one of the two images. The primary attribute of the indicated image (e.g., round shape) was opposite to that of the nonindicated image (e.g., sharp shape). Participants were instructed to estimate how well the word matched the indicated image; that is, they were asked to evaluate the likelihood that the meaning of the heard word refers to the meaning of the indicated image in some unfamiliar language. To clarify the matching task for participants, each visual stimulus was accompanied by a line of text positioned above the images. This text specified the attribute of the indicated image whose matchability with the presented word the participant was asked to evaluate. The text instructed participants to match the word to a shape, font type, fruit type, stone type, emotional bond, action type, weather type or toy type. It should be noted, however, that our more recent unpublished research shows that providing the instruction text is unnecessary (the same effect can be observed even without the text), because the difference between the indicated and nonindicated stimuli is so self-evident. Participants were informed to press the lower keys (0 = very bad match, 1 = bad match and 2 = somewhat bad match) if they felt that the word did not match the indicated image, and the higher keys (3 = somewhat good match, 4 = good match and 5 = very good match) if they felt that the word matched the indicated image. They were encouraged to use the whole range of the response scale, instead of using only the ‘conservative’ response keys (i.e., 2 and 3). They were told that there are no right or wrong responses from their perspective, as the words were chosen from languages that were unfamiliar to them. Instead, they were encouraged to use a ‘gut feeling’ when estimating the matchability. They were also told that they did not need to use the entire 9 s in their responses, but they could respond as fast as they got the initial feeling about the matchability. Finally, after the study, the participants were asked whether they were familiar with the shape-sound and/or size-sound symbolism phenomena. In the final questionnaire, 9 participants (32%) reported familiarity with the shape-sound symbolism phenomenon.
The visual stimuli consisted of eight pairs of images (i.e., 16 different images), from which one was hypothetically congruent with the harsh ToV and sharp-sounding pseudowords, whereas the other was hypothetically congruent with the smooth ToV and round-sounding pseudowords. The shape was the most dominant visual element that differentiated four of these pairs (see the section Experiment 1 ‘a’ of Figure 1), whereas in the rest of the pairs, the most dominant differentiating factor was related to a dimension of affect (e.g., calm/pleasurable vs. arousing/unpleasurable) (see the section Experiment 1 ‘b’ of Figure 1). The two images of a pair were displayed in approximately the same size (e.g., the size of the angular and round shapes was 5 cm horizontally and vertically). There was approximately a 5-cm gap between the two images. There was an equal chance for the harsh-congruent images being presented on the left and right. Similarly, there was an equal chance for the arrow to be pointing to either the left or the right image. The target-left and target-right conditions were displayed in randomized order.
Visual items used in Experiments 1 (upper) and 2 (lower). The ‘M’ refers to the mean congruency effect of the association between segmental iconicity and the conceptual attribute of the indicated item. The ‘Mp’ refers to the mean congruency effect of the association between prosodic iconicity and the conceptual attribute of the indicated item.

Figure 1. Long description
The multi-panel layout is divided into Experiment 1 at the top and Experiment 2 at the bottom.
Experiment 1: The shape a and affect-related b concepts.
Row a displays four pairs of shape-based items. From left to right:
1. A rounded cloud-like outline and a sharp star-like outline. M equals 2.9, p is less than .001. M p equals 0.8, p is less than .001.
2. A smooth-edged abstract shape and a jagged-edged abstract shape. M equals 2.6, p is less than .001. M p equals 0.8, p is less than .001.
3. A smooth mango held in a hand and a spiky durian fruit held in a hand. M equals 2.0, p is less than .001. M p equals 0.9, p is less than .001.
4. A smooth river stone and a sharp crystalline rock. M equals 1.4, p is less than .001. M p equals 0.4, p equals .052.
Row b displays four pairs of affect-related items. From left to right:
1. Two people hugging and two people standing apart with arms crossed. M equals 1.4, p is less than .001. M p equals 1.1, p is less than .001.
2. A person in a hammock and a person kayaking in rough water. M equals 1.2, p is less than .001. M p equals 0.9, p is less than .001.
3. A sun behind a cloud and a dark storm cloud with lightning and rain. M equals 1.4, p is less than .001. M p equals 1.0, p is less than .001.
4. A soft teddy bear and a sharp-edged robot toy. M equals 2.1, p is less than .001. M p equals 0.8, p is less than .001.
Experiment 2: The size a and strength-related b concepts.
Row a displays four pairs of size-based items. From left to right:
1. A small tree and a large wide tree. M equals 0.9, p is less than .001. M p equals 1.7, p is less than .001.
2. A small chihuahua and a large great dane. M equals 0.8, p is less than .001. M p equals 2.2, p is less than .001.
3. A small peanut and a large coconut. M equals 1.1, p is less than .001. M p equals 1.7, p is less than .001.
4. A small hamster and a large bear. M equals 1.4, p is less than .001. M p equals 1.9, p is less than .001.
Row b displays four pairs of strength-related items. From left to right:
1. Fingers holding a thin needle and a hand squeezing a heavy-duty grip strengthener. M equals 0.8, p is less than .001. M p equals 1.6, p is less than .001.
2. A thin arm and a muscular flexed arm. M equals 0.5, p equals .01. M p equals 2.0, p is less than .001.
3. A dripping faucet and a faucet with a heavy flow of water. M equals 0.8, p is less than .001. M p equals 1.7, p is less than .001.
4. Hands gently pulling a thread and hands forcefully kneading dough. M equals 1.5, p is less than .001. M p equals 1.3, p is less than .001.
Auditory stimuli consisted of 144 auditorily presented (at ca. 60 dB SPL) pseudowords. These pseudowords were constructed from vowels and consonants that were either hypothetically congruent or incongruent with round/calm/pleasurable or sharp/arousing/unpleasurable images. The sharp-sounding words were mostly constructed from the speech sounds [i], [e], [t] and [k], while the round-sounding words were mostly constructed from the speech sounds [u], [o], [m] and [l] (see, e.g., Fort et al., Reference Fort, Martin and Peperkamp2015 for the justification of selecting these particular speech sounds). To increase the variability of the segments in the words in different (round-sounding and sharp-sounding) categories, we added one of the consonants [p], [v] or [h] to some of the words in both categories. In addition, the vowel [ɑ] was included in a small number of words in both categories for the same reason. In addition to including the speech sounds [p], [v], [h] and [ɑ], neutral pseudowords comprised a mixture of sharp and round-sounding segments (e.g., they had a balance between the speech sounds [l] and [t]). An algorithm was used to build the words based on Finnish phonotactics and the given speech sounds. All words were produced in harsh (unpleasant and constricted), neutral (i.e., monotonic) and smooth (pleasant and round) ToVs (see Kitayama, Reference Kitayama1996; Scherer, Reference Scherer1986). The words were recorded in a soundproof studio. The words were pronounced by an individual (female) who was familiar with how these particular speech patterns can be mechanically produced. A few examples of these pseudoword stimuli, as well as a statistical analysis of the acoustics of the stimuli, are provided in the repository. The auditory stimuli were randomly selected from these recordings so that each of the 16 visual target images was presented once with every possible combination of suprasegmental (1 = smooth, 2 = neutral and 3 = harsh) and segmental (1 = round-sounding, 2 = neutral-sounding and 3 = sharp-sounding) conditions. As such, each of the 16 possible images functioned as a visual target nine times.
Experiment 2: The number of trials, as well as the response and stimuli arrangements, was the same as those of Experiment 1. The visual stimuli consisted of eight pairs of images (i.e., 16 different images), from which one was hypothetically congruent with the diminished ToV and small-sounding pseudowords, whereas the other was hypothetically congruent with the magnified ToV and large-sounding pseudowords. The size was the most dominant visual element that differentiated four of these pairs (see the section Experiment 2 ‘a’ of Figure 1), whereas in the rest of the pairs, the most dominant differentiating factor was related to the force/strength (see the section Experiment 2 ‘b’ of Figure 1).
Auditory stimuli were created in the same way as in Experiment 1, with the exception that the pseudowords were constructed from vowels and consonants that were hypothetically either congruent or incongruent with small/weak and large/strong images. The small-sounding words were mostly constructed from the speech sounds [i], [e], [y], [t], [p] and [s], while the large-sounding words were mostly constructed from the speech sounds [u], [o], [ɑ], [m], [g] and [l] (see, e.g., Newman, Reference Newman1933 for the justification of selecting these particular speech sounds). To increase the variability of the segments in the words in the small- and large-sounding pseudoword categories, we added the consonant [h] to some of the words in both categories. In addition to including the speech sound [h], neutral pseudowords comprised a mixture of small and big-sounding segments (e.g., they had a balance between the speech sounds [l] and [t]). An algorithm was used to build the words based on Finnish phonotactics and the given speech sounds. The list of these pseudowords is provided in the repository. The stimuli were recorded so that the same female who produced the stimuli for Experiment 1 also pronounced the pseudowords for this experiment. She was familiar with how these particular ToVs can be mechanically produced based on the previous literature (e.g., Nygaard et al., Reference Nygaard, Herold and Namy2009). All words were produced with diminished, neutral (i.e., monotonic) and magnified iconic prosody. A few examples of these pseudoword stimuli, as well as a statistical analysis of the acoustics of the stimuli, are provided in the repository. The auditory stimuli were randomly selected from these recordings so that each of the 16 visual target images was presented once with every possible combination of suprasegmental (1 = diminished, 2 = neutral and 3 = magnified) and segmental (1 = small-sounding, 2 = neutral-sounding and 3 = large-sounding) conditions. As such, each of the 16 possible images functioned as a visual target nine times. In Experiment 2, the instruction text required participants to match the word to a tree type, dog breed, nut type, animal, grasp type, hand strength, water flow or manipulative action (see Figure 1). In the final questionnaire, four participants (14%) reported familiarity with the size-sound symbolism phenomenon.
The post-validation of the stimuli used in Experiments 1 and 2: To verify that the stimuli were represented as intended (e.g., that words pronounced in a harsh ToV were indeed perceived as harsh), we presented the auditory and visual stimuli used in Experiments 1 and 2 to six new participants. First, participants were shown all visual stimuli in a randomized order and asked to identify the most salient feature distinguishing the two opposing items in each pair. For the shape- and size-related stimuli, recognition accuracy was 100%. For the affect- and strength-related stimuli, however, in a few cases, participants initially referred to a distinction that was not directly framed in terms of affect or strength. For example, with the toy stimuli, participants typically described one item as a cute toy (i.e., a teddy bear) and the other as a threatening robot. Because ‘cute’ and ‘threatening’ are semantically related to pleasurable and unpleasurable affect, respectively, these responses were coded as correct. One participant initially distinguished the teddy bear and the robot based on the softness versus hardness of the materials from which they were made; this response was coded as incorrect. However, when asked explicitly which toy appeared pleasurable and which appeared unpleasurable, the participant responded in line with our hypothesis (teddy bear = pleasurable and robot = unpleasurable). Similarly, for the action-type stimuli in Experiment 2, three participants did not initially refer to differences in strength or force. Instead, they mentioned distinctions such as one action requiring more precise manipulation than the other. These responses were coded as incorrect. Nevertheless, when asked directly which action required greater strength, all participants identified the difference as hypothesized. As such, the accuracy rate for recognizing visual stimuli according to the hypothesis was 95.8%. However, recognition accuracy for the visual stimuli reached 100% once participants were prompted to indicate which item in each pair was pleasurable versus unpleasurable, or which required greater strength. For the auditory stimuli, we randomly selected 15 items from each prosody category, resulting in 90 stimuli presented in randomized order to each participant. For the acoustic stimuli in Experiment 1, participants indicated whether each stimulus was pronounced in a harsh and unpleasurable, monotonic or smooth and pleasurable ToV. For Experiment 2, they indicated whether each stimulus conveyed smallness, largeness or was pronounced in a monotonic ToV. Recognition accuracy was 96% for the stimuli used in Experiment 1 and 99% for those used in Experiment 2. Notably, nearly all incorrect responses occurred within the first five trials, suggesting that errors diminished once participants became familiar with the stimuli. These data are available in the project repository (stimulus_validity_test).
3. Results
3.1. Experiment 1
Statistical analyses: The statistical significance of response values was tested using a random intercept model (linear mixed models; see Norman, Reference Norman2010 and Kizach, Reference Kizach2014, for a justification of using this statistical method with the current data). The data were approximately normally distributed. In the preliminary analyses, the LMM treated the congruency between the type of segmentals and the visual attribute (segmental-attribute congruency: 1: congruent, 2: neutral and 3: incongruent); the congruency between the prosodic ToV and the visual attribute (prosody-attribute congruency: 1: congruent, 2: neutral and 3: incongruent); the category of visual stimuli (category: 1: shape and 2: affect) and/or (depending on the analysis) the version of the stimulus (image pairs 1–8) as fixed factors and Subject as a random intercept. The congruency variables were marked as congruent (1), neutral (2) and incongruent (3) based on our hypothesized associations between the auditorily presented word and the indicated visual stimulus. For example, regarding the ‘segmental-attribute congruency’ factor, the congruent (1) level includes those experimental trials in which the type of segmental was a ‘round-sounding’ word, and the visual attribute was a round shape, or in which the type of segmental was a ‘sharp-sounding’ word, and the visual attribute was an angular shape. In the primary analyses, the LMM treated the type of segmentals (1: round-sounding, 2: neutral-sounding and 3: sharp-sounding); the visual attribute (1: round/calm/pleasurable and 2: sharp/arousing/unpleasurable) and the prosodic ToV (1: smooth, 2: neutral and 3: harsh) as fixed factors and Subject as a random intercept. The independent variables were treated as random slopes. The response, varying in Likert scale between 1 (a very bad match between the perceived word and the indicated visual stimulus) and 6 (a very good match), was always the dependent variable. The selection of the error covariance structure was based on Schwarz’s Bayesian criterion. Post hoc comparisons were carried out by using the Bonferroni correction. All analyses were conducted using the SPSS Statistics software package (version 31).
3.2. Results
In the first preliminary analysis, we examined whether the segmental-attribute congruency and the prosody-attribute congruency could be observed for both categories of visual stimuli (i.e., visual attributes of shape and affect). The analysis, including segmental-attribute congruency, prosody-attribute congruency and category as fixed factors, revealed a significant interaction between segmental-attribute congruency and category [F(2,3838) = 30.21, p < .001] as well as prosody-attribute congruency and category [F(2,3838) = 3.95, p = .019]. Segmental-attribute congruency effect (i.e., the mean of congruent values minus the mean of incongruent values) was slightly larger for the shape category (shape: M = 1.1; affect: M = 0.8), whereas a similar difference was not observed for prosody-attribute congruency (shape: M = 0.4; affect: M = 0.5). Nevertheless, the congruency effects of segmental-attribute and prosody-attribute (i.e., response value is significantly larger for congruent conditions than neutral conditions and smaller for incongruent conditions than neutral conditions) were observed for the shape and affect categories (p-value was .003 or smaller for each comparison). Given these observations, we decided to treat the two visual stimuli categories (shape and affect) as a single category (shape-affect) in the primary analyses.
In the second preliminary analysis, we investigated whether segmental-attribute congruency and prosody-attribute congruency could be observed across all visual image pairs. The analysis, including segmental-attribute congruency and image pair as fixed factors, showed that segmental-attribute congruency (p < .001) can be observed for all image pairs. The effect size (i.e., the mean of congruent values minus the mean of incongruent values) varied between 2.9 [image pair 1] and 1.4 [image pair 7]). Finally, the analysis, including prosody-attribute congruency and item as fixed factors, showed that prosody-attribute congruency (p < .001) can be observed for all other image pairs (the effect size varied between 1.1 [image pair 5] and 0.8 [image pair 1]) but not for image pair 4 (p = .052; M = 0.4). Figure 1 presents the p-values and the sizes of these congruency effects for each image pair.
In the primary analysis, we included the type of segmentals, visual attribute and prosodic ToV as fixed factors. This analysis revealed significant interactions of type of segmentals*visual attribute [F(2,3838) = 163.88, p < .001], prosodic ToV*visual attribute [F(2,3838) = 721.74, p < .001] and type of segmentals*visual attribute*prosodic ToV [F(4,3838) = 3.42, p = .008]. Regarding the three-way interaction, as observed in Figure 2a, round-sounding pseudowords in comparison to neutral-sounding pseudowords and neutral-sounding pseudowords in comparison to sharp-sounding pseudowords were rated to be significantly (p < .001) more suitable for round/pleasurable objects in smooth, neutral and harsh prosody conditions. In contrast, sharp-sounding pseudowords in comparison to neutral-sounding pseudowords and neutral-sounding pseudowords in comparison to round-sounding pseudowords were rated to be significantly (p < .001) more suitable for angular/unpleasurable objects in smooth, neutral and harsh prosody conditions. When the three-way interaction is approached in order to evaluate the influence of type of segmentals on associating prosodic ToV with visual shape, as observed in Figure 2b, it appears that smooth prosody tends to be associated with ‘round’ visuals, while harsh prosody tends to be associated with ‘sharp’ visuals, although the differences between smooth and neutral, as well as between neutral and harsh, are not always statistically significant. It is also noteworthy that the same effects were observed when the data of only those participants who were not familiar with the phenomenon were included in the analysis (see the repository for the outcome of this analysis). These observations suggest that participants can recruit prosodic and segmental iconicity cues of perceived speech signals concurrently to associate the speech signals with the visual attribute that is congruent with the prosodic and segmental iconicity cues. The segmental sound symbolism effect can be observed to the same degree regardless of whether the prosodic information is congruent, neutral or incongruent with the segmental iconicity of the speech signal. Correspondingly, the prosody-meaning effect can be observed regardless of whether the segmental information is congruent, neutral or incongruent with the prosodic iconicity of the speech signal.
The figure presents the means of the rated matchability between segmental iconicity (round-sounding, neutral-sounding, sharp-sounding) and the conceptual attribute of the indicated image (round/calm vs. angular/arousing) in three different conditions of iconic prosody (smooth, neutral, harsh). Error bars depict the standard error of the mean. Asterisks indicate statistically significant (***p < .001) differences. The effect sizes of these significant differences vary between (dz) 0.9 and 2.1 (mean = 1.3; SD = 0.3), with the smallest effect size between the conditions of angular(visual)-harsh(prosody)-sharp(word) and angular(visual)-harsh(prosody)-neutral(word) (i.e., between the bars 17 and 18) and the largest between the conditions of round(visual)-harsh(prosody)-round(word) and round(visual)-harsh(prosody)-neutral(word) (i.e., between the bars 13 and 14).
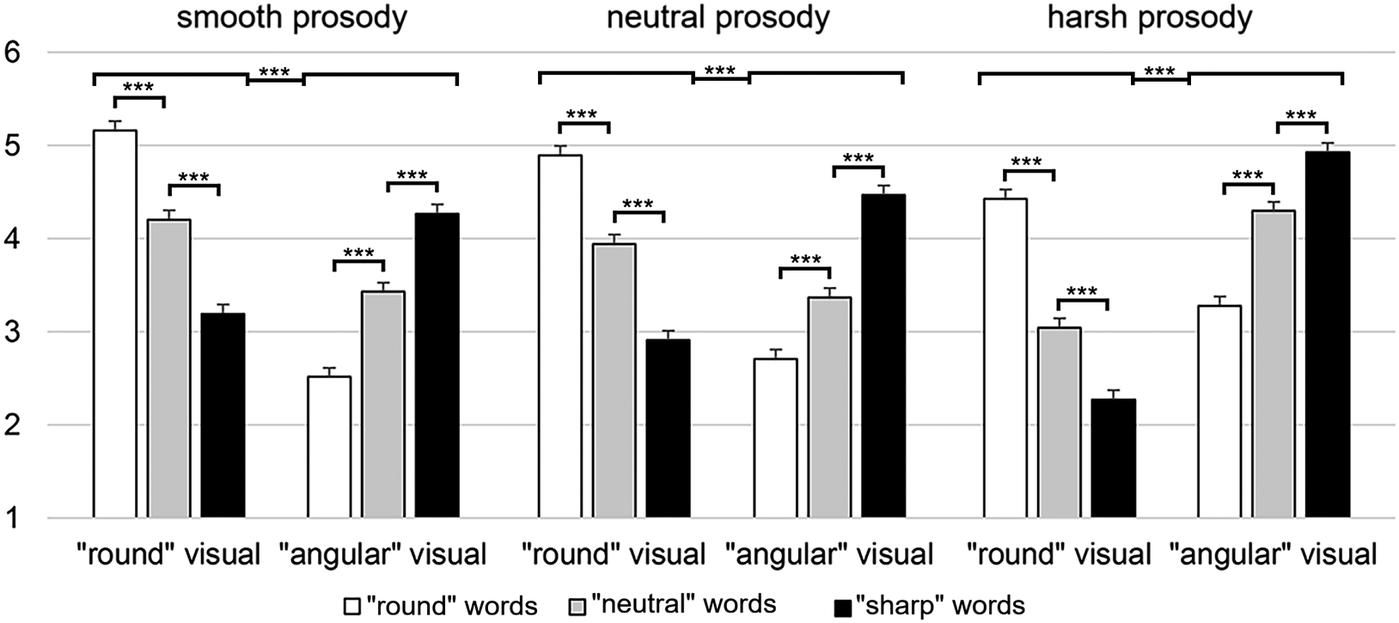
Figure 2a. Long description
The Y-axis represents rated matchability on a scale from 1 to 6. The X-axis is divided into three main sections: smooth prosody, neutral prosody, and harsh prosody. Within each section, there are two visual categories: round visual and angular visual. Each visual category contains three bars representing word types: white bars for round words, grey bars for neutral words, and black bars for sharp words.
* Smooth Prosody section: For round visual, matchability is highest for round words (approx. 5.2), followed by neutral (4.2) and sharp (3.2). For angular visual, the trend reverses with sharp words highest (4.3), followed by neutral (3.4) and round (2.5).
* Neutral Prosody section: For round visual, round words are highest (4.9), neutral (3.9), and sharp (2.9). For angular visual, sharp words are highest (4.5), neutral (3.4), and round (2.7).
* Harsh Prosody section: For round visual, round words are highest (4.4), neutral (3.1), and sharp (2.3). For angular visual, sharp words are highest (4.9), neutral (4.3), and round (3.3).
Statistical significance brackets with three asterisks (p less than .001) are shown above almost all adjacent bar comparisons and between the round and angular visual groupings within each prosody condition. Error bars indicate the standard error of the mean for each data point.
The figure presents the means of the rated matchability between prosodic iconicity (smooth, neutral, harsh) and the conceptual attribute of the indicated image (round/calm vs. angular/arousing) in three different conditions of segmental iconicity (round-sounding, neutral-sounding, sharp-sounding). Error bars depict the standard error of the mean. Asterisks indicate statistically significant (***p < .001) differences. The effect sizes of these significant differences vary between (dz) 0.7 and 1.5 (mean = 1.5; SD = 0.3), with the smallest effect size between the conditions of angular(visual)-sharp(word)-harsh(prosody) and angular(visual)-sharp(word)-neutral(prosody) (i.e., between the bars 17 and 18), and the largest between the conditions of angular(visual)-neutral(word)-harsh(prosody) and angular(visual)-neutral(word)-neutral(prosody) (i.e., between the bars 11 and 12).
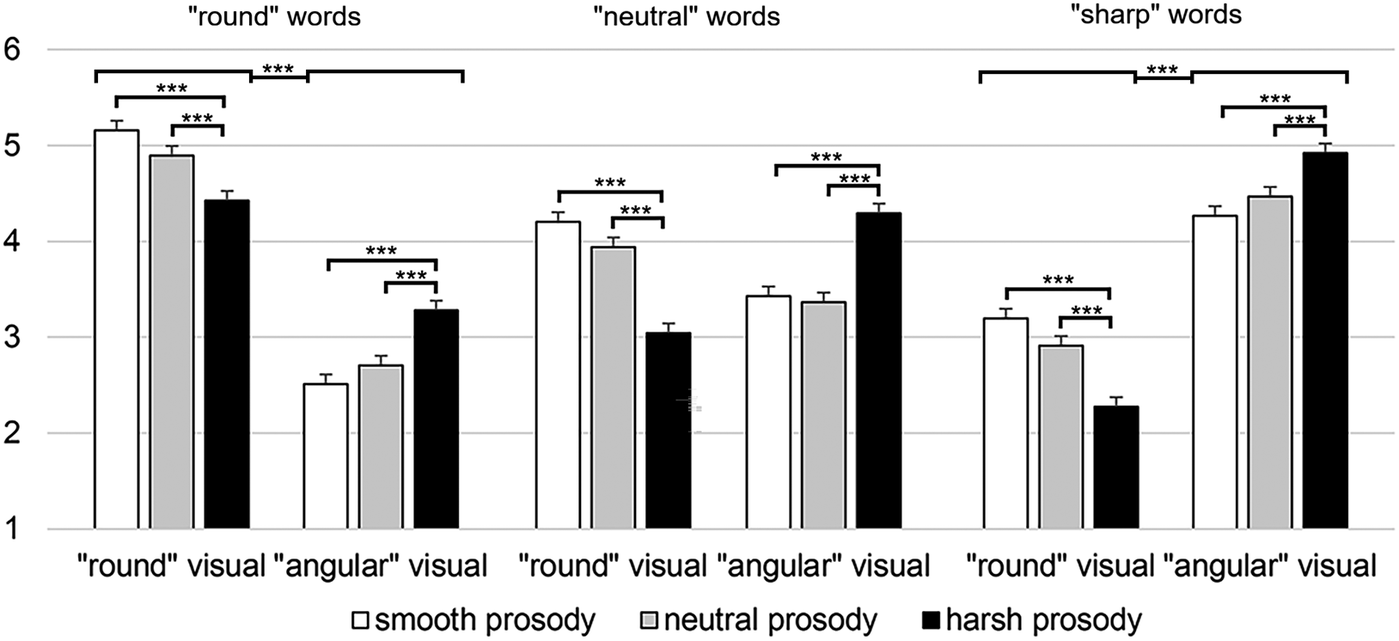
Figure 2b. Long description
A bar chart with a Y-axis ranging from 1 to 6 representing rated matchability. The X-axis is divided into three main sections based on segmental iconicity: round words, neutral words, and sharp words. Within each section, there are two sub-categories: round visual and angular visual. Each sub-category contains three bars representing prosodic iconicity: smooth prosody (white), neutral prosody (light gray), and harsh prosody (black).
* In the round words section, round visual attributes show a downward trend from smooth to harsh prosody, while angular visual attributes show an upward trend from smooth to harsh prosody.
* In the neutral words section, round visual attributes show a downward trend from smooth to harsh prosody, while angular visual attributes show an upward trend from smooth to harsh prosody.
* In the sharp words section, round visual attributes show a downward trend from smooth to harsh prosody, while angular visual attributes show an upward trend from smooth to harsh prosody.
Statistically significant differences, marked by triple asterisks, are indicated by brackets above the bars. For round visual attributes across all word types, smooth prosody consistently has the highest matchability. For angular visual attributes across all word types, harsh prosody consistently has the highest matchability. Error bars representing the standard error of the mean are present on each bar.
3.3. Experiment 2
Statistical analyses: The statistical significance of response values was tested using a random intercept model. The data were approximately normally distributed. In the preliminary analyses, the LMM treated the congruency between the type of segmentals and the visual magnitude (segmental-magnitude congruency: 1: congruent, 2: neutral and 3: incongruent); the congruency between the prosodic ToV and the visual magnitude (prosody-magnitude congruency: 1: congruent, 2: neutral and 3: incongruent) the magnitude category of visual stimuli (magnitude category: 1: size and 2: strength) and/or (depending on the analysis) the version of the stimulus (image pairs 1–8) as fixed factors and Subject as a random intercept. In the primary analyses, the LMM treated the type of segmentals (1: small-sounding, 2: neutral-sounding and 3: large-sounding); visual magnitude (1: small/weak and 2: large/strong) and prosodic ToV (1: diminished-prosody, 2: neutral-prosody and 3: magnified-prosody) as fixed factors and Subject as a random intercept. The independent variables were treated as random slopes. The selection of the error covariance structure was based on Schwarz’s Bayesian criterion. Post hoc comparisons were performed using the Bonferroni correction. All analyses were conducted using the SPSS Statistics software package (version 31).
3.4. Results
In the first preliminary analysis, we examined whether segmental-magnitude congruency and prosody-magnitude congruency could be observed for both magnitude categories. The analysis, including segmental-magnitude congruency, prosody-magnitude congruency and category as fixed factors, revealed a significant interaction between segmental-magnitude congruency and category [F(2,3864) = 5.16, p = .006]. Segmental-magnitude congruency*prosody-magnitude congruency interaction was not significant (p = .071). In addition, prosody-magnitude congruency*category interaction was not significant (p = 0.10). Segmental-magnitude congruency effect (i.e., the mean of congruent values minus the mean of incongruent values), as well as prosody-magnitude congruency effect, were slightly larger for the size category in comparison to the force category (segmental-magnitude congruency: size: M = 1.1; strength: M = 0.9; prosody-magnitude congruency: size: M = 1.9; strength: M = 1.7). However, the congruency effects of segmental-magnitude and prosody-magnitude (i.e., response value is significantly larger for congruent conditions than neutral conditions and smaller for incongruent conditions than neutral conditions) were observed for the size and strength categories. The p-value was < .001 in all other conditions, but in the strength category of segmental-magnitude congruency between congruent and neutral conditions, in which the p-value was .042. Given these observations, we decided to treat the two visual stimuli categories (size and strength) as a single category (magnitude) in the primary analyses.
In the second preliminary analysis, we investigated whether segmental-magnitude congruency and prosody-magnitude congruency could be observed across all visual image pairs. The analysis, including segmental-magnitude congruency and image pair as fixed factors, showed that segmental-magnitude congruency (i.e., the mean of congruent values minus the mean of incongruent values) can be observed (p < .010) for all image pairs (the effect size varied between 1.5 [image pair 8] and 0.5 [image pair 6]). The analysis, including prosody-magnitude congruency and image pair as fixed factors, showed that prosody-magnitude congruency (p < .001) can be observed for all image pairs (the effect size varied between 2.2 [image pair 2] and 1.3 [image pair 8]). Figure 1 presents the p-values and the sizes of the congruency effects for each image pair.
In the primary analysis, we included the type of segmentals, visual magnitude and prosodic ToV as fixed factors. This analysis revealed significant interactions of type of segmentals*visual magnitude [F(2,3838) = 182.56, p < .001] and prosodic ToV*visual magnitude [F(2,3838) = 594.70, p < .001]. Regarding the three-way interaction (p = .060), as observed in Figure 3a, small-sounding pseudowords in comparison to neutral-sounding pseudowords and neutral-sounding pseudowords in comparison to large-sounding pseudowords are rated to be significantly (p < .001) more suitable for small/weak targets in diminished, neutral and magnified prosody conditions. In contrast, large-sounding pseudowords in comparison to neutral-sounding pseudowords and neutral-sounding pseudowords in comparison to small-sounding pseudowords are rated to be significantly (p < .001) more suitable for large/strong objects in diminished, neutral and magnified prosody conditions. When the three-way interaction is approached in order to evaluate the influence of the type of segmentals on associating prosodic ToV with visual magnitude, as observed in Figure 3b, it appears that diminished prosody is, in general, associated with small-weak magnitudes, whereas magnified prosody is associated with large-strong magnitudes. However, the differences between diminished and neutral-like prosodic ToVs, as well as between neutral-like and magnified prosodic ToVs, are not always statistically significant. These observations support the view that the segmental sound symbolism effect can be observed to the same degree regardless of whether the prosodic information is congruent, neutral or incongruent with the segmental iconicity of the speech signal. Participants can recruit prosodic and segmental iconicity cues of perceived speech signals in conjunction to associate the speech signals with the visual attribute that is congruent with the prosodic and segmental iconicity cues.
The figure presents the means of the rated matchability between segmental iconicity (small-sounding, neutral-sounding, large-sounding) and the conceptual attribute of the indicated image (small magnitude vs. large magnitude) in three different conditions of iconic prosody (diminished prosody, neutral prosody, magnified prosody). Error bars depict the standard error of the mean. Asterisks indicate statistically significant (***p < .001, **p < .010, *p < .050) differences. The effect sizes of these significant differences vary between (dz) 0.5 and 1.5 (mean = 0.8; SD = 0.3), with the smallest effect size between the conditions of large(visual)-large(prosody)-neutral(word) and large(visual)-large(prosody)-large(word) (i.e., between the bars 17 and 18), and the largest between the conditions of large(visual)-neutral(prosody)-small(word) and large(visual)-neutral(prosody)-neutral(word) (i.e., between the bars 10 and 11).

Figure 3a. Long description
A bar chart with a Y-axis representing rated matchability from 1 to 6. The X-axis is divided into three main sections: diminished prosody, neutral prosody, and magnified prosody. Each section contains two subgroups: small visual and large visual. Within each subgroup, three bars represent small words (white), neutral words (grey), and large words (black).
* In the diminished prosody section, for small visual, ratings decrease from small words (approx. 4.7) to large words (approx. 4.0). For large visual, ratings increase from small words (approx. 2.1) to large words (approx. 3.2).
* In the neutral prosody section, for small visual, ratings decrease from small words (approx. 4.3) to large words (approx. 3.3). For large visual, ratings increase from small words (approx. 2.8) to large words (approx. 4.2).
* In the magnified prosody section, for small visual, ratings decrease from small words (approx. 3.1) to large words (approx. 2.4). For large visual, ratings increase from small words (approx. 4.1) to large words (approx. 5.1).
Statistical significance brackets with asterisks (one, two, or three stars) are placed above various bar comparisons to indicate p-values less than .050, .010, and .001 respectively. Error bars representing standard error are present on each bar.
presents the means of the rated matchability between prosodic iconicity (diminished prosody, neutral prosody, magnified prosody) and the conceptual attribute of the indicated image (small magnitude vs. large magnitude) in three different conditions of segmental iconicity (small-sounding, neutral-sounding, large-sounding). Error bars depict the standard error of the mean. Asterisks indicate statistically significant (***p < .001, **p < .010, *p < .050) differences. The effect sizes of these significant differences vary between (dz) 0.6 and 1.9 (mean = 1.2; SD = 0.4), with the smallest effect size between the conditions of small(visual)-small(word)-small(prosody) and small(visual)-small(word)-neutral(prosody) (i.e., between the bars 1 and 2), and the largest between the conditions of large(visual)-small(word)-neutral(prosody) and large(visual)-small(word)-large(prosody) (i.e., between the bars 5 and 6).

Figure 3b. Long description
The Y axis represents matchability ratings from 1 to 6. The X axis is divided into three main sections based on segmental iconicity: small words, neutral words, and large words. Each section contains two sub-groups: small visual and large visual. Within each sub-group, three bars represent prosodic iconicity: white for diminished prosody, gray for neutral prosody, and black for magnified prosody.
* In the small words section, for small visual magnitude, matchability decreases as prosody increases from diminished to magnified. For large visual magnitude, matchability increases as prosody increases.
* In the neutral words section, the small visual sub-group shows a decrease in matchability from diminished to magnified prosody, while the large visual sub-group shows an increase.
* In the large words section, for small visual magnitude, matchability decreases as prosody increases. For large visual magnitude, matchability increases significantly as prosody increases, reaching the highest rating of approximately 5.
Statistical significance brackets with asterisks are present above almost all bar comparisons, indicating p values less than .001, .010, or .050. Error bars are present on every bar to indicate the standard error of the mean.
4. General discussion
The study showed that sound symbolism effects driven by segmental iconicity can be observed even when the perceived word can be mapped to a meaning based on iconic prosody cues, despite these prosodic cues likely being more salient acoustic cues than the iconicity cues of segmental speech units. That is, in addition to associating the pseudoword with a given meaning based on the prosody-meaning congruency, the segmental iconicity can be simultaneously used to associate the word with meaning. Therefore, the suprasegmental and segmental iconicity of the speech signal can be recruited in parallel to link the word to meaning. These results are consistent with studies by Akita (Reference Akita2021, Reference Akita2025), who found that while, for example, creaky voice properties of stimuli enable linking the speech stimuli with large and sharp-edged images, these stimuli can be simultaneously associated with large and sharp-edged images based on features of segmental iconicity. The present study shows that a corresponding pattern of results can be observed even when the suprasegmental features provide relatively direct and unambiguous prosodic cues (e.g., ‘diminished’ prosody) for linking the pseudoword to an image (e.g., small size).
It appears that the association effect between the segmental iconicity of the meaning can be observed regardless of whether the prosodic iconicity cues are congruent, neutral or incongruent with the visual attribute. That is, for example, the pseudoword built from small-sounding segments is associated with small concepts regardless of whether the pseudoword is pronounced with diminished prosody or magnified prosody. Furthermore, neutral-prosody conditions did not systematically result in larger association effects between the segmental iconicity and the meaning. These outcomes were similar concerning the potency-related (small-big, weak-strong) and activity-related (round-sharp, calm-arousing) concepts. All in all, these observations suggest that the two dimensions of acoustic iconicity – suprasegmental and segmental – are processed separately yet in parallel, for linking the speech signal to meaning.
Correspondingly, association effects between prosodic iconicity and meaning were also observed in relation to potency-related and activity-related concepts, regardless of whether the segmental iconicity cues provided information that was congruent, neutral or incongruent with the meaning. Again, this finding supports the view that these two separate iconic dimensions of the speech signal are processed separately and in parallel for associating the speech signal with a meaning. Furthermore, regarding processing prosodic iconicity, the study showed for the first time that smooth and harsh ToV are not only associated with pleasant and unpleasant concepts, respectively (Ishii et al., Reference Ishii, Reyes and Kitayama2003), but they are also associated with round and sharp shapes, respectively. Participants were more likely to associate the pseudowords pronounced with smooth prosody with round shapes and the pseudowords pronounced with harsh prosody with sharp shapes. This finding is in line with the proposal that sharp shapes are experienced as unpleasant, while round shapes are experienced as pleasant (Bar & Neta, Reference Bar and Neta2006), and that the sound-shape symbolism phenomena might be, to some degree, mediated by emotional factors (Aryani et al., Reference Aryani, Isbilen and Christiansen2020).
As observed in Figs. 2b and 3b, it appears that, in Experiment 1, the congruency between segmental iconicity and the meaning influences, to some degree, how effectively acoustic cues of prosodic iconicity can be used to associate the pseudoword with the meaning. In contrast, a similar influence of segmental iconicity on associating the pseudoword with the meaning based on prosodic iconicity is not observed in Experiment 2. That is, using the iconicity of smooth and harsh ToV in associating the pseudoword with the meaning is more sensitive to the sound-meaning influences of the segmental iconicity than using the iconicity of diminished and magnified prosodic cues in associating the pseudoword with the meaning. We assume that this observation can be explained in two ways. First, it is possible that the participants perceived iconicity cues more easily in diminished and magnified ToV than in smooth and harsh ToV. That is, magnitude-related prosody may provide generally more effective acoustic cues in the context of iconicity in comparison to prosody that provides cues about the pleasantness of the speech signal. Second, the segmental iconicity investigated in Experiment 1 (i.e., sound-shape symbolism) may provide more effective iconicity cues of speech signals than the cues of segmental iconicity investigated in Experiment 2 (i.e., sound-size symbolism), leaving fewer resources for processing iconic dimensions of smooth and harsh ToV in comparison to processing iconic dimensions of diminished and magnified prosodic cues.
In the Introduction, we proposed that segmental and suprasegmental iconic cues can either compete for the resources of mapping the speech signal to a semantic concept, they can be processed concurrently for associating the speech signal with a meaning, or they may even facilitate each other for associating the speech units with a meaning. All in all, the results do not conclusively indicate whether the concurrent processing hypothesis or the facilitation hypothesis better explains the outcome. In Experiment 2, the three-way interaction between segmentals, prosody and visual attribute was not significant, suggesting that the congruency effect observed between segmental cues and meaning was not significantly modulated by prosodic information. This observation might be taken to support the concurrent processing hypothesis. However, the three-way interaction was significant in Experiment 1, suggesting that prosodic information might have somewhat influenced how segmental cues of pseudowords were mapped to meanings. As observed in Figure 2a, the congruency effect between segmentals and meaning is somewhat larger when the prosodic iconicity is congruent with the segmental iconicity. However, the fact that, for example, in the smooth prosody condition (see Figure 2a), the matchability rating is higher between ‘round-sounding’ words and ‘round’ visual stimuli than the matchability rating between ‘sharp-sounding’ words and ‘angular’ visual stimuli does not necessarily support the facilitation hypothesis. It is also likely that the matchability ratings are particularly high, for example, in smooth(prosody)-round(word)-round(visual) condition (i.e., the first bar of Figure 2a), because the prosodic and segmental iconicity cues simultaneously contribute to matching the speech signal to a congruent meaning. These particularly high ratings in this specific condition do not necessarily result from a reinforcing influence of prosodic cues on processing congruent iconicity cues of segmental speech units.
It has been proposed that associating the same iconicity cues of segmental information of speech signals with different concepts is partially based on the higher-order properties that they have in common (Sidhu et al., Reference Sidhu, Vigliocco and Pexman2022). For instance, the same speech sounds are associated with different activity-related concepts, such as active-passive and sharp-round, whereas the same speech sounds are associated with different potency-related concepts, such as small-large and weak-strong. Given that, in the present study, the pseudowords that conveyed similar prosodic and/or segmental iconicity were associated with the concepts of small-large and weak-strong (Experiment 1), as well as the concepts of round-sharp and passive/calm-active/aroused (Experiment 2), shows that this higher-order hypothesis does not only apply to phenomena of segmental iconicity, but also to phenomena of prosodic iconicity.
4.1. Potential limitations of the study
It should be acknowledged that the task employed primarily engaged explicit association processes, which are not ideally suited to capturing automatically activated associations (Moors & De Houwer, Reference Moors and De Houwer2006). Moreover, previous research has shown that sound symbolism effects may rely on partially distinct mechanisms depending on whether the task involves implicit or explicit association processes (Vainio et al., Reference Vainio, Mo and Vainio2025). Therefore, the findings of the present study are limited to explaining the explicit associative processes underlying sound symbolism. It should also be noted that the acoustic elements of segmental speech units are tied to the prosodic structure of utterances. Indeed, prosodic patterns are phonetically realized within segments, and segmental elements are to some degree modulated by their prosodic context (e.g., Gussenhoven, Reference Gussenhoven2004; Ladd, Reference Ladd2008). Consequently, when we interpret our results from this perspective, we have to acknowledge that the iconicity effects produced by segmental speech elements cannot be entirely untied from the influence of prosodic structure on these segments, and vice versa. Hence, we cannot unequivocally conclude that, for example, the iconicity effects observed in relation to segments are purely based on segmental features in the absence of any contribution of prosodic structure. In addition, although a substantial sound-symbolic congruency effect was expected to be observable with a sample of 28 participants, this number is relatively small for Likert-scale research and should be considered a limitation. Furthermore, because the majority of participants were female, the generalizability of these findings may be somewhat restricted. Most importantly, the generalizability of these observations should be increased by testing samples from different countries/language communities.
It is also important to note that according to the account of pluripotentiality (Winter et al., Reference Winter, Pérez-Sobrino and Brown2019; Winter et al., Reference Winter, Oh, Hübscher, Idemaru, Brown, Prieto and Grawunder2021), segmental speech units do not carry intrinsic meanings. For instance, the vowel [i] is not inherently associated with smallness or sharpness. Rather, it has the potential to convey meaning, which is realized only when it is interpreted within a context that assigns it a contrastive value. Therefore, the fact that sound-to-meaning mappings are flexible – that speech sounds can stand for many different features – does not necessarily imply that they are undergirded by higher-order representations. In light of this, treating attributes such as size and force as a single, unified magnitude factor—as was done in the study—may constitute an oversimplification. From both a theoretical and methodological perspective, it might have been more appropriate to treat these particular stimulus attributes as separate factors. However, doing so would have considerably increased the complexity of the model, making the analysis and interpretation of the results more challenging. Moreover, the preliminary analyses indicated that similar effects emerged across the different object attributes (e.g., size, force and strength), suggesting that the primary results would likely have been comparable even if these attributes had been modeled separately. Nevertheless, future research might benefit from either focusing on a single attribute or explicitly modeling potentially overlapping concepts as distinct factors.
5. Conclusions
The study contributes to research that shows an interaction between iconic cues processed in different communication channels. For instance, when we express meanings to other individuals, segmental (Wilding et al., Reference Wilding, Winter, Littlemore and Perlman2025) and suprasegmental (Krivokapic et al., Reference Krivokapic, Tiede and Tyrone2015) iconic cues might be frequently accompanied by iconic gestures. Correspondingly, when we utter segmentally iconic words, we are likely to emphasize the meaning of these iconic words using prosodically iconic features (Akita & Kawahara, Reference Akita and Kawahara2025). Regarding decoding the semantic meaning of communicative signals, perceiving gestural and prosodic cues can influence each other (Kelly et al., Reference Kelly, Bailey and Hirata2017). In line with these investigations, this study supports the view that the two dimensions of acoustic iconicity – prosodic and segmental – are also processed separately from each other, yet in parallel, for linking the speech signal to meaning.
Acknowledgements
We would like to thank Reetta Jokinen for her assistance in collecting the data.
Competing interest
The authors have no conflicts of interest to declare.
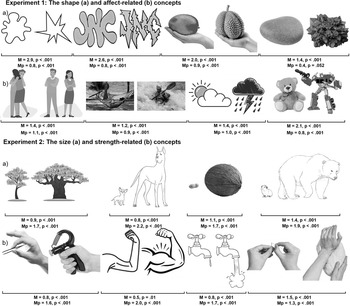
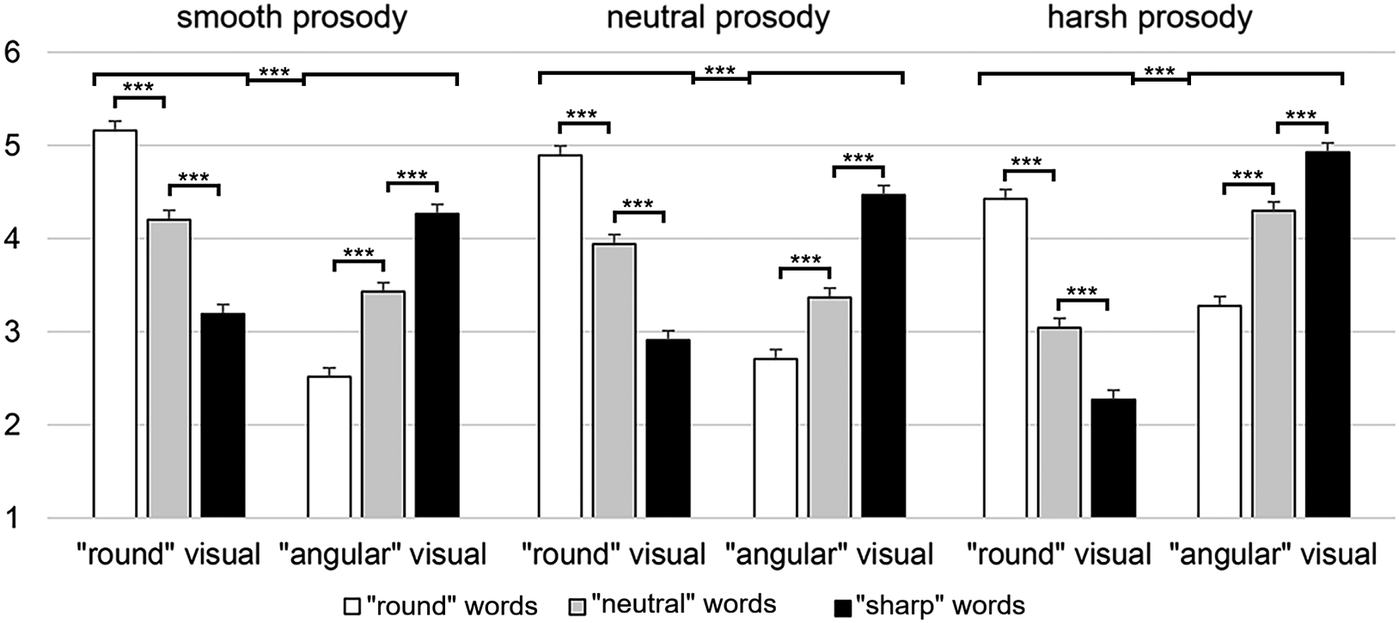
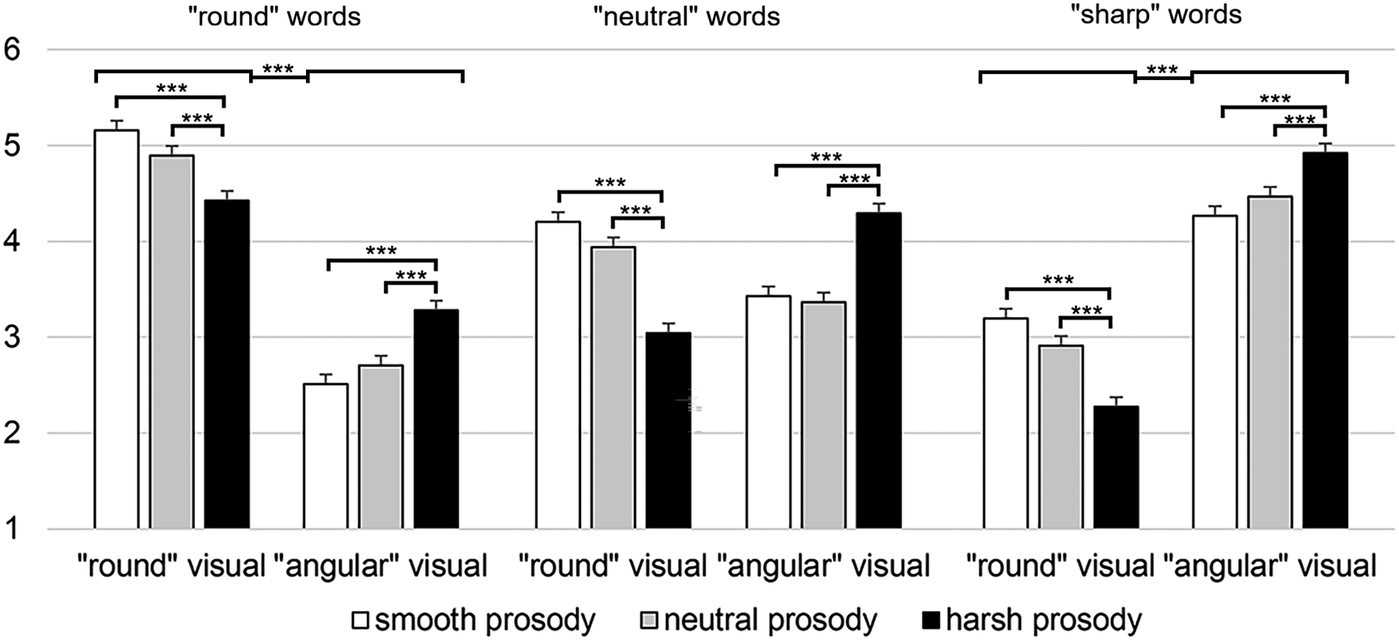
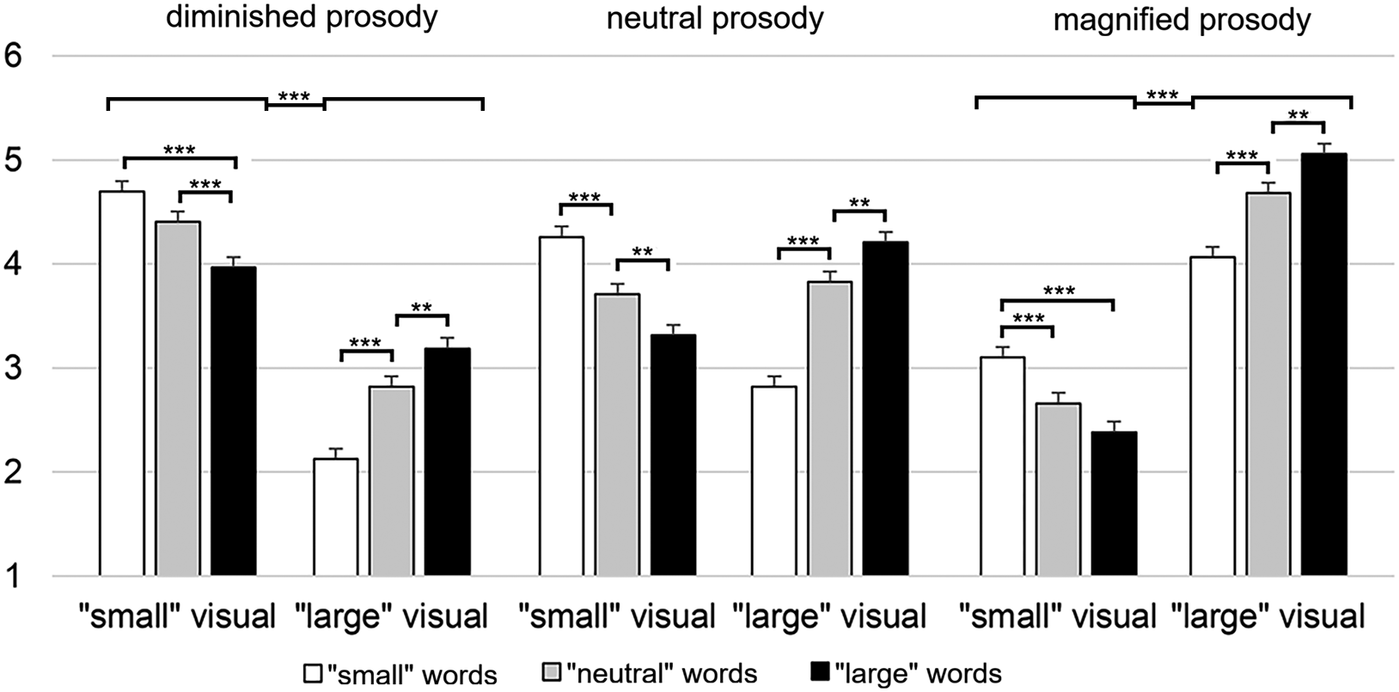
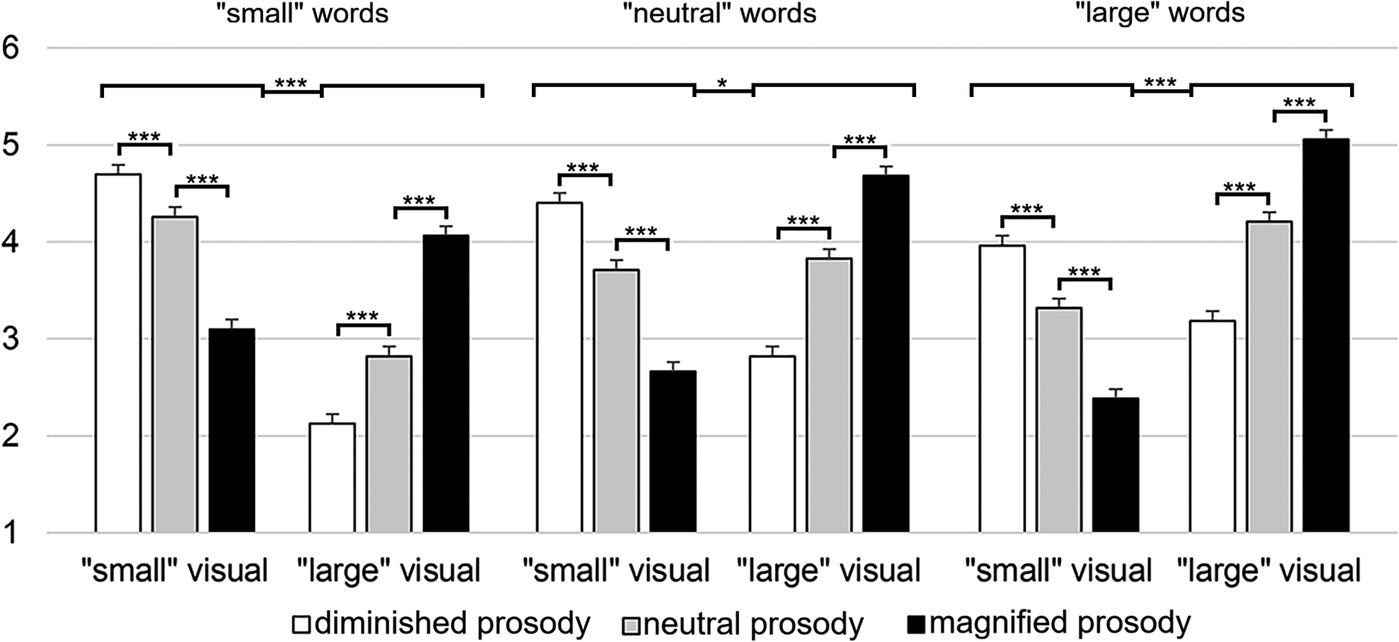

 Open access

