





1. Introduction
The study of turbulence in stably stratified fluids is vital for understanding and modelling atmospheric and oceanic flows. The background mean density gradient can arise due to temperature and/or salinity gradients throughout the fluid, and leads to buoyancy forces that inhibit vertical motion and generate spatially intermittent and layered flow structures that are of tremendous consequence, yet difficult to understand (Fernando Reference Fernando1991; Staquet & Sommeria Reference Staquet and Sommeria1996; Riley & Lindborg Reference Riley and Lindborg2012; Caulfield Reference Caulfield2021).
The relative diffusivity of the scalar on which density depends is quantified by the Prandtl number $\textit{Pr}\equiv \nu /\kappa$
, where
$\textit{Pr}\equiv \nu /\kappa$
, where $\nu$
and
$\nu$
and $\kappa$
are the momentum and the scalar diffusivities, respectively. For thermally stratified air
$\kappa$
are the momentum and the scalar diffusivities, respectively. For thermally stratified air $\textit{Pr} \approx 0.7$
, for thermally stratified water
$\textit{Pr} \approx 0.7$
, for thermally stratified water $\textit{Pr} \approx 7$
, whereas
$\textit{Pr} \approx 7$
, whereas $\textit{Pr}\approx 700$
for salt stratified water. Despite this wide range, much of the literature on stratified turbulence has focused on
$\textit{Pr}\approx 700$
for salt stratified water. Despite this wide range, much of the literature on stratified turbulence has focused on $\textit{Pr}=1$
, as also noted by Okino & Hanazaki (Reference Okino and Hanazaki2020), primarily because direct numerical simulations (DNS) with
$\textit{Pr}=1$
, as also noted by Okino & Hanazaki (Reference Okino and Hanazaki2020), primarily because direct numerical simulations (DNS) with $\textit{Pr}\gt 1$
are
$\textit{Pr}\gt 1$
are $\textit{Pr}^{3/2}$
times more computationally expensive (in terms of spatial resolution requirements) compared with
$\textit{Pr}^{3/2}$
times more computationally expensive (in terms of spatial resolution requirements) compared with $\textit{Pr} \approx 1$
flows.
$\textit{Pr} \approx 1$
flows.
Gerz, Schumann & Elghobashi (Reference Gerz, Schumann and Elghobashi1989) observed that stratified, turbulent shear flows feature a counter-gradient (reverse) heat flux when the stratification is strong for $\textit{Pr}=5$
but not for
$\textit{Pr}=5$
but not for $\textit{Pr}=0.7$
. Komori & Nagata (Reference Komori and Nagata1996) compared grid generated turbulence using thermally stratified water at
$\textit{Pr}=0.7$
. Komori & Nagata (Reference Komori and Nagata1996) compared grid generated turbulence using thermally stratified water at $\textit{Pr} = 6$
with that using salt-stratified water at
$\textit{Pr} = 6$
with that using salt-stratified water at $\textit{Pr} = 600$
and found that higher-Prandtl-number fluids develop stronger, smaller-scale reverse buoyancy fluxes. In their recent study of forced, stratified turbulence using DNS with
$\textit{Pr} = 600$
and found that higher-Prandtl-number fluids develop stronger, smaller-scale reverse buoyancy fluxes. In their recent study of forced, stratified turbulence using DNS with $0.7 \leqslant \textit{Pr} \leqslant 8$
and for varying stability strengths, Legaspi & Waite (Reference Legaspi and Waite2020) observed that at high wavenumbers the buoyancy flux becomes positive, indicating conversion of potential energy to kinetic energy at small scales, which had also been discussed in Holloway (Reference Holloway1988), Bouruet-Aubertot, Sommeria & Staquet (Reference Bouruet-Aubertot, Sommeria and Staquet1996) and Carnevale, Briscolini & Orlandi (Reference Carnevale, Briscolini and Orlandi2001). While different arguments have been given for the origin of the reverse buoyancy flux, there is no general consensus on the mechanism that leads to its development or
$0.7 \leqslant \textit{Pr} \leqslant 8$
and for varying stability strengths, Legaspi & Waite (Reference Legaspi and Waite2020) observed that at high wavenumbers the buoyancy flux becomes positive, indicating conversion of potential energy to kinetic energy at small scales, which had also been discussed in Holloway (Reference Holloway1988), Bouruet-Aubertot, Sommeria & Staquet (Reference Bouruet-Aubertot, Sommeria and Staquet1996) and Carnevale, Briscolini & Orlandi (Reference Carnevale, Briscolini and Orlandi2001). While different arguments have been given for the origin of the reverse buoyancy flux, there is no general consensus on the mechanism that leads to its development or $\textit{Pr}$
dependence. For example, Holloway (Reference Holloway1988) suggests that nonlinear interactions transfer potential energy downscale more effectively than it does kinetic energy; this leads to a relative excess of potential energy which is converted to kinetic energy through the buoyancy flux, also discussed in Legaspi & Waite (Reference Legaspi and Waite2020). The plausibility of this argument is, however, unclear. Indeed, if kinetic energy is transferred downscale less effectively than potentially energy, this would seem to suggest that kinetic energy might pile up at some scales, not potential energy, and some of this could then be transferred to the potential field. But this is the opposite of what was suggested in Holloway (Reference Holloway1988).
$\textit{Pr}$
dependence. For example, Holloway (Reference Holloway1988) suggests that nonlinear interactions transfer potential energy downscale more effectively than it does kinetic energy; this leads to a relative excess of potential energy which is converted to kinetic energy through the buoyancy flux, also discussed in Legaspi & Waite (Reference Legaspi and Waite2020). The plausibility of this argument is, however, unclear. Indeed, if kinetic energy is transferred downscale less effectively than potentially energy, this would seem to suggest that kinetic energy might pile up at some scales, not potential energy, and some of this could then be transferred to the potential field. But this is the opposite of what was suggested in Holloway (Reference Holloway1988).
Riley et al. (Reference Riley, Couchman, de Bruyn and Stephen2023) recently investigated the decay of a stably stratified turbulence and observed that higher $\textit{Pr}$
leads to a smaller mixing coefficient
$\textit{Pr}$
leads to a smaller mixing coefficient $\varGamma \equiv \langle \chi \rangle /\langle \epsilon \rangle$
, where
$\varGamma \equiv \langle \chi \rangle /\langle \epsilon \rangle$
, where $\langle \chi \rangle$
and
$\langle \chi \rangle$
and $\langle \epsilon \rangle$
are the average turbulent potential and kinetic energy dissipation rates, respectively (cf. Okino & Hanazaki Reference Okino and Hanazaki2019). In order to explain this, Bragg & de Bruyn Kops (Reference Bragg, de Bruyn and Stephen2024) analysed the equations governing the velocity and density gradients in stratified turbulence, which describe
$\langle \epsilon \rangle$
are the average turbulent potential and kinetic energy dissipation rates, respectively (cf. Okino & Hanazaki Reference Okino and Hanazaki2019). In order to explain this, Bragg & de Bruyn Kops (Reference Bragg, de Bruyn and Stephen2024) analysed the equations governing the velocity and density gradients in stratified turbulence, which describe $\langle \chi \rangle$
and
$\langle \chi \rangle$
and $\langle \epsilon \rangle$
, and they identified a new mechanism that explains why
$\langle \epsilon \rangle$
, and they identified a new mechanism that explains why $\varGamma$
decreases with increasing
$\varGamma$
decreases with increasing $\textit{Pr}$
. According to this mechanism, the emergence of ramp–cliff structures in the density field causes the mean density gradient to oppose the production of fluctuating density gradients (reducing
$\textit{Pr}$
. According to this mechanism, the emergence of ramp–cliff structures in the density field causes the mean density gradient to oppose the production of fluctuating density gradients (reducing $\langle \chi \rangle$
), and supports the growth of velocity gradients (increasing
$\langle \chi \rangle$
), and supports the growth of velocity gradients (increasing $\langle \epsilon \rangle$
). They also showed, using asymptotic analysis, that this effect should grow with increasing
$\langle \epsilon \rangle$
). They also showed, using asymptotic analysis, that this effect should grow with increasing $\textit{Pr}$
(although the effect will saturate at sufficiently large
$\textit{Pr}$
(although the effect will saturate at sufficiently large $\textit{Pr}$
), and this is why
$\textit{Pr}$
), and this is why $\varGamma$
reduces as
$\varGamma$
reduces as $\textit{Pr}$
increases. Results from DNS (using the same database as Riley et al. (Reference Riley, Couchman, de Bruyn and Stephen2023)) confirm these arguments. The objective of this paper is to establish the connection between the gradient field dynamics, along the lines noted by Bragg & de Bruyn Kops (Reference Bragg, de Bruyn and Stephen2024), and the small-scale buoyancy flux reversal that has been observed in previous studies of stratified turbulence. Should such a connection exist, it would provide a mechanistic explanation for the occurrence of a small-scale buoyancy flux reversal, linking it to ramp–cliff structures, a fundamental feature of of scalar turbulence driven by a mean scalar gradient.
$\textit{Pr}$
increases. Results from DNS (using the same database as Riley et al. (Reference Riley, Couchman, de Bruyn and Stephen2023)) confirm these arguments. The objective of this paper is to establish the connection between the gradient field dynamics, along the lines noted by Bragg & de Bruyn Kops (Reference Bragg, de Bruyn and Stephen2024), and the small-scale buoyancy flux reversal that has been observed in previous studies of stratified turbulence. Should such a connection exist, it would provide a mechanistic explanation for the occurrence of a small-scale buoyancy flux reversal, linking it to ramp–cliff structures, a fundamental feature of of scalar turbulence driven by a mean scalar gradient.
The rest of the paper is organised as follows: in § 2 we present our theoretical analysis that establishes the connection, in § 3 we
summarise the DNS used and in § 4 we present and discuss the results from our DNS and consider them in view of the theoretical analysis. Finally, in § 5 we summarise the findings and discuss future work.
2. Theory
We consider a stably stratified flow with fluctuating $\phi$
and mean
$\phi$
and mean $\varPhi _b=(\rho _r + \zeta z)g/(N \rho _r)$
densities (that have been normalised so that they have the dimensions of a velocity), where
$\varPhi _b=(\rho _r + \zeta z)g/(N \rho _r)$
densities (that have been normalised so that they have the dimensions of a velocity), where $\rho _r$
is the reference density,
$\rho _r$
is the reference density, $\zeta \lt 0$
is the constant, mean density gradient,
$\zeta \lt 0$
is the constant, mean density gradient, $g$
is the magnitude of the gravitational acceleration and
$g$
is the magnitude of the gravitational acceleration and $N\equiv \sqrt {-g \zeta/\rho _r}$
is the Brünt–Väisälä frequency. Note that the mean density gradient
$N\equiv \sqrt {-g \zeta/\rho _r}$
is the Brünt–Väisälä frequency. Note that the mean density gradient $\zeta \hat {\boldsymbol{e}}_z$
points in the direction of gravity
$\zeta \hat {\boldsymbol{e}}_z$
points in the direction of gravity $\hat {\boldsymbol{g}} = -\hat {\boldsymbol{e}}_z$
since
$\hat {\boldsymbol{g}} = -\hat {\boldsymbol{e}}_z$
since $\zeta \lt 0$
. The Navier–Stokes-Boussinesq equations are given by
$\zeta \lt 0$
. The Navier–Stokes-Boussinesq equations are given by
 \begin{align} D_t \boldsymbol{u} &=-\left (1 / \rho _r\right ) \boldsymbol{\nabla \!}p+ 2 \nu \boldsymbol{\nabla }\boldsymbol{\cdot } \boldsymbol{S}-N \phi \hat {\boldsymbol{e}}_z+\boldsymbol{F}, \end{align}
 \begin{align} D_t \phi &= \kappa {\nabla} ^2 \phi +N u_z, \end{align}
where $D_t \equiv \partial _t + {\boldsymbol{u}} \,\boldsymbol{\cdot }\boldsymbol{\nabla } \,$
is the material derivative operator,
$D_t \equiv \partial _t + {\boldsymbol{u}} \,\boldsymbol{\cdot }\boldsymbol{\nabla } \,$
is the material derivative operator, $\boldsymbol{u}$
is the velocity,
$\boldsymbol{u}$
is the velocity, $\nu$
is the kinematic viscosity,
$\nu$
is the kinematic viscosity, $\kappa = \nu /\textit{Pr}$
is the scalar diffusivity,
$\kappa = \nu /\textit{Pr}$
is the scalar diffusivity, $\boldsymbol{S}\equiv (\boldsymbol{A} + \boldsymbol{A}^\top )/2$
is the strain-rate field and
$\boldsymbol{S}\equiv (\boldsymbol{A} + \boldsymbol{A}^\top )/2$
is the strain-rate field and $\boldsymbol{A}\equiv \boldsymbol{\nabla \!}\boldsymbol{u}$
is the velocity-gradient field. Here,
$\boldsymbol{A}\equiv \boldsymbol{\nabla \!}\boldsymbol{u}$
is the velocity-gradient field. Here, $\boldsymbol{F}$
is a forcing term which is used in the DNS to generate an approximately statistically stationary state (details on this are given later).
$\boldsymbol{F}$
is a forcing term which is used in the DNS to generate an approximately statistically stationary state (details on this are given later).
The flow can be characterised using the Reynolds number $Re \equiv UL/\nu$
and the Froude number
$Re \equiv UL/\nu$
and the Froude number $\textit{Fr} \equiv U/(LN)$
, where
$\textit{Fr} \equiv U/(LN)$
, where $U$
and
$U$
and $L$
are the horizontal root mean square velocity and horizontal integral length scale of the flow. The smallest spatial scale (in a mean-field sense) of the velocity field is the Kolmogorov scale
$L$
are the horizontal root mean square velocity and horizontal integral length scale of the flow. The smallest spatial scale (in a mean-field sense) of the velocity field is the Kolmogorov scale $\eta = (\nu^3/\langle \epsilon \rangle)^{1/4}$
, while the smallest scale in the density field is the Bachelor scale, which is related to
$\eta = (\nu^3/\langle \epsilon \rangle)^{1/4}$
, while the smallest scale in the density field is the Bachelor scale, which is related to $\eta$
through
$\eta$
through $\eta _B = \eta /\textit{Pr}^{1/2}$
when
$\eta _B = \eta /\textit{Pr}^{1/2}$
when $\textit{Pr}\geqslant 1$
(Batchelor Reference Batchelor1959).
$\textit{Pr}\geqslant 1$
(Batchelor Reference Batchelor1959).
We employ a filtering approach to explore the dynamics of $\boldsymbol{u}$
and
$\boldsymbol{u}$
and $\phi$
at different scales. The filter operator acting on an arbitrary field
$\phi$
at different scales. The filter operator acting on an arbitrary field $a(\boldsymbol{x},t)$
is defined as
$a(\boldsymbol{x},t)$
is defined as
 \begin{equation} \tilde {a}^\ell (\boldsymbol{x},t) \equiv \int a(\boldsymbol{y},t)\mathcal{G}_{\ell }(\boldsymbol{x}-\boldsymbol{y})\,{\rm d}\boldsymbol{y}, \end{equation}
where $\tilde {a}^\ell$
contains the field information at scales
$\tilde {a}^\ell$
contains the field information at scales $\geqslant \ell$
, whereas the sub-filter-scale information is captured by
$\geqslant \ell$
, whereas the sub-filter-scale information is captured by $a(\boldsymbol{x},t)-\tilde {a}^\ell (\boldsymbol{x},t)$
. For notational simplicity, the
$a(\boldsymbol{x},t)-\tilde {a}^\ell (\boldsymbol{x},t)$
. For notational simplicity, the $\ell$
in the superscript will be dropped and
$\ell$
in the superscript will be dropped and $\tilde {a}$
will denote a field filtered at a scale
$\tilde {a}$
will denote a field filtered at a scale $\ell$
, unless indicated otherwise.
$\ell$
, unless indicated otherwise.
Following Germano (Reference Germano1992), one can partition the energy associated with the velocity and density fluctuations into filter-scale energy and sub-filter-scale energy fields, the latter being the focus here. The sub-filter turbulent kinetic energy (TKE) is given by $e_{\!K}\equiv (\widetilde {\|\boldsymbol{u}\|^2}-\tilde {\boldsymbol{u}} \boldsymbol{\cdot } \tilde {\boldsymbol{u}})/2$
, whereas the sub-filter turbulent potential energy (TPE) is given by
$e_{\!K}\equiv (\widetilde {\|\boldsymbol{u}\|^2}-\tilde {\boldsymbol{u}} \boldsymbol{\cdot } \tilde {\boldsymbol{u}})/2$
, whereas the sub-filter turbulent potential energy (TPE) is given by $e_{\!P}\equiv (\widetilde {\phi \phi }-\tilde {\phi }\tilde {\phi })/2$
. The averaged equations for
$e_{\!P}\equiv (\widetilde {\phi \phi }-\tilde {\phi }\tilde {\phi })/2$
. The averaged equations for $e_{\!K}$
and
$e_{\!K}$
and $e_{\!P}$
in homogeneous, stably stratified turbulence are given by
$e_{\!P}$
in homogeneous, stably stratified turbulence are given by
 \begin{align} \partial _t \langle e_{\!K} \rangle &= \langle \varPi _{K}\rangle + \langle \mathcal{B}\rangle - \langle \varepsilon _{K}\rangle +\langle \mathcal{F}_{\!K}\rangle, \end{align}
 \begin{align} \partial _t \langle e_\phi \rangle &= -\langle \mathcal{B}\rangle +\langle \varPi _\phi \rangle -\langle \varepsilon _\phi \rangle .\\[-12pt]\nonumber \end{align}
Here, $\varPi _{K}\equiv -(\widetilde {\boldsymbol{u}\boldsymbol{u}}-\tilde {\boldsymbol{u}}\tilde {\boldsymbol{u}}) \boldsymbol{:} \tilde {\boldsymbol{S}}$
and
$\varPi _{K}\equiv -(\widetilde {\boldsymbol{u}\boldsymbol{u}}-\tilde {\boldsymbol{u}}\tilde {\boldsymbol{u}}) \boldsymbol{:} \tilde {\boldsymbol{S}}$
and $\varPi _\phi \equiv -(\widetilde {\boldsymbol{u} \phi }-\tilde {\boldsymbol{u}} \tilde {\phi }) \boldsymbol{\cdot } \tilde {\boldsymbol{B}}$
are the scale-to-scale TKE and TPE fluxes (
$\varPi _\phi \equiv -(\widetilde {\boldsymbol{u} \phi }-\tilde {\boldsymbol{u}} \tilde {\phi }) \boldsymbol{\cdot } \tilde {\boldsymbol{B}}$
are the scale-to-scale TKE and TPE fluxes ( $\boldsymbol{B}=\boldsymbol{\nabla }\phi$
being the density gradient),
$\boldsymbol{B}=\boldsymbol{\nabla }\phi$
being the density gradient), $\varepsilon _{K}\,\equiv \,\nu (\widetilde {\|\boldsymbol{\nabla \!}\boldsymbol{u}\|^2} - \|\boldsymbol{\nabla \!}\tilde {\boldsymbol{u}}\|^2 )$
and
$\varepsilon _{K}\,\equiv \,\nu (\widetilde {\|\boldsymbol{\nabla \!}\boldsymbol{u}\|^2} - \|\boldsymbol{\nabla \!}\tilde {\boldsymbol{u}}\|^2 )$
and $\varepsilon _\phi \equiv (\nu /\textit{Pr}) (\widetilde {\|\boldsymbol{B}\|^2} - \|\tilde {\boldsymbol{B}}\|^2 )$
are the sub-filter TKE and TPE dissipation rates and
$\varepsilon _\phi \equiv (\nu /\textit{Pr}) (\widetilde {\|\boldsymbol{B}\|^2} - \|\tilde {\boldsymbol{B}}\|^2 )$
are the sub-filter TKE and TPE dissipation rates and
 \begin{align} \mathcal{B}\equiv -N ( \widetilde {u_z \phi } - \tilde {u}_z \tilde {\phi }), \end{align}
is the sub-filter buoyancy flux which couples the sub-filter TKE and TPE equations, and is defined such that $\mathcal{B}\lt 0$
corresponds to a transfer from the sub-filter TKE field to the sub-filter TPE field.
$\mathcal{B}\lt 0$
corresponds to a transfer from the sub-filter TKE field to the sub-filter TPE field.
For a statistically stationary flow, at scale $\ell \gg L$
, we have the balance
$\ell \gg L$
, we have the balance $-\langle \mathcal{B} \rangle \sim \langle \chi \rangle \gt 0$
. At scales larger than the Ozmidov scale
$-\langle \mathcal{B} \rangle \sim \langle \chi \rangle \gt 0$
. At scales larger than the Ozmidov scale $\ell \gt l_{O}\equiv (\langle \epsilon \rangle /N^3)^{1/2}$
where buoyancy plays a leading-order role in the flow energetics, one expects
$\ell \gt l_{O}\equiv (\langle \epsilon \rangle /N^3)^{1/2}$
where buoyancy plays a leading-order role in the flow energetics, one expects $\langle \mathcal{B}\rangle \lt 0$
corresponding on average to a transfer of TKE into TPE. Based on the standard theory of stratified turbulence, the buoyancy flux is supposed to be negligible compared with the energy flux terms at scales
$\langle \mathcal{B}\rangle \lt 0$
corresponding on average to a transfer of TKE into TPE. Based on the standard theory of stratified turbulence, the buoyancy flux is supposed to be negligible compared with the energy flux terms at scales $\ell \lt l_{O}$
, and Kolmogorov-like turbulence is expected to emerge (Riley & Lindborg Reference Riley and Lindborg2012). While this seems to be true for
$\ell \lt l_{O}$
, and Kolmogorov-like turbulence is expected to emerge (Riley & Lindborg Reference Riley and Lindborg2012). While this seems to be true for $\textit{Pr}=O(1)$
, recent arguments suggest it may not apply when
$\textit{Pr}=O(1)$
, recent arguments suggest it may not apply when $\textit{Pr}\gg 1$
(Bhattacharjee et al. Reference Bhattacharjee, de Bruyn, Stephen and Bragg2025).
$\textit{Pr}\gg 1$
(Bhattacharjee et al. Reference Bhattacharjee, de Bruyn, Stephen and Bragg2025).
We now want to establish the connection between $\mathcal{B}$
and the gradient field dynamics analysed by Bragg & de Bruyn Kops (Reference Bragg, de Bruyn and Stephen2024). From (2.1), (2.2) we can obtain equations governing the evolution of the averaged velocity and density gradient magnitudes,
$\mathcal{B}$
and the gradient field dynamics analysed by Bragg & de Bruyn Kops (Reference Bragg, de Bruyn and Stephen2024). From (2.1), (2.2) we can obtain equations governing the evolution of the averaged velocity and density gradient magnitudes, $\|{\boldsymbol{A}}\|^2$
and
$\|{\boldsymbol{A}}\|^2$
and $\|{\boldsymbol{B}}\|^2$
, which (using homogeneity of the flow) are given by
$\|{\boldsymbol{B}}\|^2$
, which (using homogeneity of the flow) are given by
 \begin{align} \partial _t \langle \| {\boldsymbol{A}}\|^2 \rangle &= \langle \mathcal{P\!}_{A1}\rangle - \langle \mathcal{P\!}_{B2}\rangle - \langle \mathcal{D}_{\!A} \rangle + \langle {\boldsymbol{A}} \boldsymbol{:} \boldsymbol{\nabla \!}\boldsymbol{F} \rangle , \end{align}
 \begin{align} \partial _t\langle \| {\boldsymbol{B}}\|^2 \rangle &= \langle \mathcal{P\!}_{B1}\rangle + \langle \mathcal{P\!}_{B2}\rangle - \langle \mathcal{D}_{\!B} \rangle . \end{align}
In these equations, $\boldsymbol{A}$
and
$\boldsymbol{A}$
and $\boldsymbol{B}$
are the fluctuating velocity and density gradient fields, and the fluctuating productions terms are given by
$\boldsymbol{B}$
are the fluctuating velocity and density gradient fields, and the fluctuating productions terms are given by
 \begin{align} \mathcal{P\!}_{A1} \equiv - \boldsymbol{A}^\top \boldsymbol{:} {\boldsymbol{A}} \boldsymbol{\cdot } {\boldsymbol{A}}, \; \mathcal{P\!}_{B1} \equiv - \boldsymbol{B} \boldsymbol{\cdot } {\boldsymbol{A}}^\top \boldsymbol{\cdot } {\boldsymbol{B}}, \end{align}
whereas the mean production term arising from the background density gradient is
 \begin{align} \mathcal{P\!}_{B2} \equiv N\! {\boldsymbol{B}} \boldsymbol{\cdot } {\boldsymbol{A}}^\top \boldsymbol{\cdot } \hat {\boldsymbol{e}}_z, \end{align}
and $\mathcal{D}_{\!A}$
,
$\mathcal{D}_{\!A}$
, $\mathcal{D}_{\!B}$
are dissipation rates of the velocity and scalar gradient magnitudes (Bragg & de Bruyn Kops Reference Bragg, de Bruyn and Stephen2024, see below (2.12), (3.1) for expressions). Bragg & de Bruyn Kops (Reference Bragg, de Bruyn and Stephen2024) noted that ramp–cliff structures in the field
$\mathcal{D}_{\!B}$
are dissipation rates of the velocity and scalar gradient magnitudes (Bragg & de Bruyn Kops Reference Bragg, de Bruyn and Stephen2024, see below (2.12), (3.1) for expressions). Bragg & de Bruyn Kops (Reference Bragg, de Bruyn and Stephen2024) noted that ramp–cliff structures in the field $\phi$
imply that
$\phi$
imply that $\boldsymbol{B}$
exhibits the largest fluctuations when it points in the direction of the mean density gradient
$\boldsymbol{B}$
exhibits the largest fluctuations when it points in the direction of the mean density gradient $\hat {\boldsymbol{g}}$
. Further, as a consequence of
$\hat {\boldsymbol{g}}$
. Further, as a consequence of $\langle \boldsymbol{B}\rangle =\boldsymbol{0}$
(since
$\langle \boldsymbol{B}\rangle =\boldsymbol{0}$
(since $\boldsymbol{B}$
is the gradient of the fluctuating density),
$\boldsymbol{B}$
is the gradient of the fluctuating density), $\boldsymbol{B}$
is preferentially misaligned with the mean density-gradient direction
$\boldsymbol{B}$
is preferentially misaligned with the mean density-gradient direction $\hat {\boldsymbol{g}}$
and so
$\hat {\boldsymbol{g}}$
and so
 \begin{align} \mathbb{P}(\boldsymbol{B} \boldsymbol{\cdot } \hat {\boldsymbol{g}} \gt 0) \lt \mathbb{P}(\boldsymbol{B} \boldsymbol{\cdot } \hat {\boldsymbol{g}} \lt 0) \text{, or equivalently, }\mathbb{P}(B_z \gt 0) \gt \mathbb{P}(B_z \lt 0). \end{align}
where $\mathbb{P}(\boldsymbol{\cdot })$
denotes the probability. From this, they argued that
$\mathbb{P}(\boldsymbol{\cdot })$
denotes the probability. From this, they argued that $\langle \mathcal{P\!}_{B1} \rangle$
and
$\langle \mathcal{P\!}_{B1} \rangle$
and $\langle \mathcal{P\!}_{B2} \rangle$
should have opposite signs. Moreover, since
$\langle \mathcal{P\!}_{B2} \rangle$
should have opposite signs. Moreover, since $\langle \mathcal{P\!}_{B1} \rangle +\langle \mathcal{P\!}_{B2} \rangle \gt 0$
at steady state (to balance the dissipation term
$\langle \mathcal{P\!}_{B1} \rangle +\langle \mathcal{P\!}_{B2} \rangle \gt 0$
at steady state (to balance the dissipation term $\langle \mathcal{D}_{\!B} \rangle$
in (2.8)), it follows that
$\langle \mathcal{D}_{\!B} \rangle$
in (2.8)), it follows that $\langle \mathcal{P\!}_{B2} \rangle \lt 0$
provided
$\langle \mathcal{P\!}_{B2} \rangle \lt 0$
provided $N^2/\langle \| {\boldsymbol{B}}\|^2\rangle \lt O(1)$
(i.e. the fluctuating density gradients are larger than the mean density gradient, which will be satisfied if the flow is turbulent unless
$N^2/\langle \| {\boldsymbol{B}}\|^2\rangle \lt O(1)$
(i.e. the fluctuating density gradients are larger than the mean density gradient, which will be satisfied if the flow is turbulent unless $\textit{Pr}$
is very small). The negativity of
$\textit{Pr}$
is very small). The negativity of $\langle \mathcal{P\!}_{B2} \rangle$
means that it acts as a source for
$\langle \mathcal{P\!}_{B2} \rangle$
means that it acts as a source for $\langle \epsilon \rangle = \langle \| {\boldsymbol{A}}\|^2\rangle /\nu$
(2.7) but as a sink for
$\langle \epsilon \rangle = \langle \| {\boldsymbol{A}}\|^2\rangle /\nu$
(2.7) but as a sink for $\langle \chi \rangle =\langle \| {\boldsymbol{B}}\|^2 \rangle \textit{Pr}/\nu$
(2.8).
$\langle \chi \rangle =\langle \| {\boldsymbol{B}}\|^2 \rangle \textit{Pr}/\nu$
(2.8).
Following similar steps, one can derive the evolution of the filtered velocity and density gradient magnitudes, $\| \tilde {\boldsymbol{A}}\|^2$
and
$\| \tilde {\boldsymbol{A}}\|^2$
and $\| \tilde {\boldsymbol{B}}\|^2$
, for a homogeneous flow
$\| \tilde {\boldsymbol{B}}\|^2$
, for a homogeneous flow
 \begin{align} \partial _t \langle \| \tilde {\boldsymbol{A}}\|^2 \rangle &= \langle \mathcal{P}^\ell _{A1}\rangle - \langle \mathcal{P}^\ell _{B2}\rangle - \langle \mathcal{D}^\ell _A \rangle + \langle \tilde {\boldsymbol{A}} \boldsymbol{:} \boldsymbol{\nabla \!}\boldsymbol{F} \rangle - \langle \tilde {\boldsymbol{A}} \boldsymbol{:} \boldsymbol{\nabla }\boldsymbol{\nabla }\boldsymbol{\cdot } \boldsymbol{\tau }\rangle , \end{align}
 \begin{align} \partial _t\langle \| \tilde {\boldsymbol{B}}\|^2 \rangle &= \langle \mathcal{P}^\ell _{B1}\rangle + \langle \mathcal{P}^\ell _{B2}\rangle - \langle \mathcal{D}^\ell _B \rangle - \langle \tilde {\boldsymbol{B}} \boldsymbol{\cdot } \boldsymbol{\nabla }\boldsymbol{\nabla }\boldsymbol{\cdot } \boldsymbol{\varSigma }\rangle , \\[9pt] \nonumber \end{align}
where the productions terms, $\mathcal{P}^\ell _{A1}$
,
$\mathcal{P}^\ell _{A1}$
, $\mathcal{P}^\ell _{B1}$
and
$\mathcal{P}^\ell _{B1}$
and $\mathcal{P}^\ell _{B2}$
 \begin{align} \mathcal{P}^\ell _{A1} \equiv - \tilde {\boldsymbol{A}}^\top \boldsymbol{:} \tilde {\boldsymbol{A}} \boldsymbol{\cdot } \tilde {\boldsymbol{A}}, \; \mathcal{P}^\ell _{B1} \equiv - \tilde {\boldsymbol{B}} \boldsymbol{\cdot } \tilde {\boldsymbol{A}}^\top \boldsymbol{\cdot } \tilde {\boldsymbol{B}}, \; \mathcal{P}^\ell _{B2} \equiv N \tilde {\boldsymbol{B}} \boldsymbol{\cdot } \tilde {\boldsymbol{A}}^\top \boldsymbol{\cdot } \hat {\boldsymbol{e}}_z \end{align}
correspond to the filtered version production terms $\mathcal{P\!}_{A1}$
,
$\mathcal{P\!}_{A1}$
, $\mathcal{P\!}_{B1}$
and
$\mathcal{P\!}_{B1}$
and $\mathcal{P\!}_{B2}$
((2.7), (2.8)). In the limit
$\mathcal{P\!}_{B2}$
((2.7), (2.8)). In the limit $\ell /\eta _B \to 0$
, (2.12), (2.13) reduce to (2.7) and (2.8) respectively, the filtered productions terms tend to the corresponding unfiltered values and the scale-to-scale flux terms (last terms in (2.12), (2.13)) go to 0:
$\ell /\eta _B \to 0$
, (2.12), (2.13) reduce to (2.7) and (2.8) respectively, the filtered productions terms tend to the corresponding unfiltered values and the scale-to-scale flux terms (last terms in (2.12), (2.13)) go to 0:
 \begin{align} & \tilde {\boldsymbol{A}} \to \boldsymbol{A},\;\tilde {\boldsymbol{B}} \to \boldsymbol{B},\quad \mathcal{P}^\ell _{A1} \to \mathcal{P\!}_{A1},\; \mathcal{P}^\ell _{B1} \to \mathcal{P\!}_{B1},\; \mathcal{P}^\ell _{B2} \to \mathcal{P\!}_{B2},\nonumber \\ & \tilde {\boldsymbol{B}} \boldsymbol{\cdot } \boldsymbol{\nabla }\boldsymbol{\nabla }\boldsymbol{\cdot } \boldsymbol{\varSigma } \to 0,\; \tilde {\boldsymbol{A}} \boldsymbol{:} \boldsymbol{\nabla }\boldsymbol{\nabla }\boldsymbol{\cdot } \boldsymbol{\tau } \to 0. \end{align}
Since the term $\mathcal{P}^\ell _{B2}$
comes from taking the gradient of the buoyancy term in (2.1), there must be a connection between it and
$\mathcal{P}^\ell _{B2}$
comes from taking the gradient of the buoyancy term in (2.1), there must be a connection between it and $\mathcal{B}$
.
$\mathcal{B}$
.
Johnson (Reference Johnson2020, Reference Johnson2021) showed that, for the special case of an isotropic, Gaussian filter kernel $\mathcal{G}_\ell$
, an exact solution for the sub-filter stress
$\mathcal{G}_\ell$
, an exact solution for the sub-filter stress $\widetilde {\boldsymbol{u}\boldsymbol{u}}-\tilde {\boldsymbol{u}}\tilde {\boldsymbol{u}}$
(that appears in the filtered TKE equation) in terms of the velocity gradients can be obtained as the solution to a forced diffusion equation whose Green’s function is
$\widetilde {\boldsymbol{u}\boldsymbol{u}}-\tilde {\boldsymbol{u}}\tilde {\boldsymbol{u}}$
(that appears in the filtered TKE equation) in terms of the velocity gradients can be obtained as the solution to a forced diffusion equation whose Green’s function is $\mathcal{G}_\ell$
. The same analytical procedure can also be used to obtain an exact solution for the buoyancy flux
$\mathcal{G}_\ell$
. The same analytical procedure can also be used to obtain an exact solution for the buoyancy flux $\mathcal{B}$
in terms of velocity and density gradients, yielding
$\mathcal{B}$
in terms of velocity and density gradients, yielding
 \begin{align} \mathcal{B} &= \mathcal{B}^{\textit{l}} + \mathcal{B}^{\textit{nl}} , \end{align}
 \begin{align} \mathcal{B}^{\textit{l}} &\equiv - \ell ^2 \mathcal{P}^\ell _{B2} , \end{align}
 \begin{align} \mathcal{B}^{{nl}} &\equiv -N \int _0^{\ell ^2} \boldsymbol{T}^\theta \big ( \tilde {\boldsymbol{B}}^{\sqrt {\alpha }}, \widetilde {\boldsymbol{A}^\top }^{\sqrt {\alpha }} \big ) \boldsymbol{\cdot } \hat {\boldsymbol{e}}_z\,\mathrm{d} \alpha , \end{align}
where $\theta \equiv \sqrt {\ell ^2 - \alpha }$
and
$\theta \equiv \sqrt {\ell ^2 - \alpha }$
and $\boldsymbol{T}^\theta (\boldsymbol{a},\boldsymbol{b})\equiv \widetilde {\boldsymbol{a\boldsymbol{\cdot }b}}^\theta - \tilde {\boldsymbol{a}}^\theta \boldsymbol{\cdot } \tilde {\boldsymbol{b}}^\theta$
, for arbitrary tensors
$\boldsymbol{T}^\theta (\boldsymbol{a},\boldsymbol{b})\equiv \widetilde {\boldsymbol{a\boldsymbol{\cdot }b}}^\theta - \tilde {\boldsymbol{a}}^\theta \boldsymbol{\cdot } \tilde {\boldsymbol{b}}^\theta$
, for arbitrary tensors $\boldsymbol{a},\boldsymbol{b}$
and where
$\boldsymbol{a},\boldsymbol{b}$
and where $\mathcal{B}^{{nl}}$
is the contribution to the sub-filter-scale buoyancy flux from scales
$\mathcal{B}^{{nl}}$
is the contribution to the sub-filter-scale buoyancy flux from scales $\lt \ell$
(and we have shown explicitly the superscript denoting filtering at scales
$\lt \ell$
(and we have shown explicitly the superscript denoting filtering at scales $\theta$
,
$\theta$
, $\sqrt {\alpha }$
in keeping with the definition from (2.3)). In keeping with the terminology used in Johnson (Reference Johnson2020, Reference Johnson2021), the term
$\sqrt {\alpha }$
in keeping with the definition from (2.3)). In keeping with the terminology used in Johnson (Reference Johnson2020, Reference Johnson2021), the term $\mathcal{B}^{\textit{l}}$
represents the ’scale-local‘ contribution to
$\mathcal{B}^{\textit{l}}$
represents the ’scale-local‘ contribution to $\mathcal{B}$
which only involves contributions from scales
$\mathcal{B}$
which only involves contributions from scales $\geqslant \ell$
, while
$\geqslant \ell$
, while $ \mathcal{B}^{{nl}}$
is the ‘non-local’ contribution which only involves contributions from scales
$ \mathcal{B}^{{nl}}$
is the ‘non-local’ contribution which only involves contributions from scales $\lt \ell$
(the sub-filter scales) on the energetics of the filtered fields.
$\lt \ell$
(the sub-filter scales) on the energetics of the filtered fields.
The filtered term $\langle \mathcal{P}^\ell _{B2}\rangle$
was also analysed in Bragg & de Bruyn Kops (Reference Bragg, de Bruyn and Stephen2024) and it was argued that, while it is negative at small scales since
$\langle \mathcal{P}^\ell _{B2}\rangle$
was also analysed in Bragg & de Bruyn Kops (Reference Bragg, de Bruyn and Stephen2024) and it was argued that, while it is negative at small scales since $\lim _{\ell /\eta _B\to 0}\langle \mathcal{P}^\ell _{B2}\rangle \to \langle \mathcal{P\!}_{B2}\rangle$
, and
$\lim _{\ell /\eta _B\to 0}\langle \mathcal{P}^\ell _{B2}\rangle \to \langle \mathcal{P\!}_{B2}\rangle$
, and $\langle \mathcal{P\!}_{B2}\rangle \lt 0$
, it must become positive at large scales for a statistically stationary flow because this term must balance the sub-filter flux (last term in (2.13)) which is expected to be positive (corresponding to a downscale flux of TPE). The result in (2.16) then suggests that the mechanism discovered in Bragg & de Bruyn Kops (Reference Bragg, de Bruyn and Stephen2024) that generates
$\langle \mathcal{P\!}_{B2}\rangle \lt 0$
, it must become positive at large scales for a statistically stationary flow because this term must balance the sub-filter flux (last term in (2.13)) which is expected to be positive (corresponding to a downscale flux of TPE). The result in (2.16) then suggests that the mechanism discovered in Bragg & de Bruyn Kops (Reference Bragg, de Bruyn and Stephen2024) that generates $\langle \mathcal{P\!}_{B2}\rangle \lt 0$
may also explain the change in the sign of the buoyancy flux
$\langle \mathcal{P\!}_{B2}\rangle \lt 0$
may also explain the change in the sign of the buoyancy flux $\langle \mathcal{B}\rangle$
at small scales that has been observed in numerous previous studies. This is certainly the case for
$\langle \mathcal{B}\rangle$
at small scales that has been observed in numerous previous studies. This is certainly the case for $\ell \leqslant O(\eta _B)$
where
$\ell \leqslant O(\eta _B)$
where $ \mathcal{B}^{{nl}}$
will be sub-leading compared with
$ \mathcal{B}^{{nl}}$
will be sub-leading compared with $\mathcal{B}^l$
in (2.16) because
$\mathcal{B}^l$
in (2.16) because $\lim _{\ell /\eta _B \to 0} \mathcal{B}^{\textit{nl}} \to 0$
. In this case, we may say that just as the formation of ramp–cliff structures is responsible for
$\lim _{\ell /\eta _B \to 0} \mathcal{B}^{\textit{nl}} \to 0$
. In this case, we may say that just as the formation of ramp–cliff structures is responsible for $\langle \mathcal{P\!}_{B2}\rangle$
becoming negative, they are also responsible for the emergence of an inverse buoyancy flux
$\langle \mathcal{P\!}_{B2}\rangle$
becoming negative, they are also responsible for the emergence of an inverse buoyancy flux $\langle \mathcal{B}\rangle \gt 0$
at scales
$\langle \mathcal{B}\rangle \gt 0$
at scales $\ell \leqslant O(\eta _B)$
. Whether the behaviour of
$\ell \leqslant O(\eta _B)$
. Whether the behaviour of $\langle \mathcal{P}^\ell _{B2}\rangle$
at scales
$\langle \mathcal{P}^\ell _{B2}\rangle$
at scales $\ell \gt O(\eta _B)$
can also explain the behaviour of
$\ell \gt O(\eta _B)$
can also explain the behaviour of $\langle \mathcal{B}\rangle$
at these scales (and in particular its sign) will depend on how large the contribution from
$\langle \mathcal{B}\rangle$
at these scales (and in particular its sign) will depend on how large the contribution from $\langle \mathcal{B}^{{nl}} \rangle$
is to
$\langle \mathcal{B}^{{nl}} \rangle$
is to $\langle \mathcal{B}\rangle$
.
$\langle \mathcal{B}\rangle$
.
Due to the complexity of the integral defining $ \mathcal{B}^{{nl}}$
, estimates for its size relative to
$ \mathcal{B}^{{nl}}$
, estimates for its size relative to $\mathcal{B}$
are challenging. However, its behaviour in the limit
$\mathcal{B}$
are challenging. However, its behaviour in the limit $\ell /L\to \infty$
is known. In particular, for the statistically homogeneous system we are considering,
$\ell /L\to \infty$
is known. In particular, for the statistically homogeneous system we are considering, $\tilde {\boldsymbol{A}}$
,
$\tilde {\boldsymbol{A}}$
, $\tilde {\boldsymbol{B}}$
and therefore
$\tilde {\boldsymbol{B}}$
and therefore $\mathcal{P\!}_{B2}$
all vanish in the limit
$\mathcal{P\!}_{B2}$
all vanish in the limit $\ell /L\to \infty$
because in this limit
$\ell /L\to \infty$
because in this limit $\tilde {\boldsymbol{A}}=\overline {\boldsymbol{A}}=\boldsymbol{0}$
and
$\tilde {\boldsymbol{A}}=\overline {\boldsymbol{A}}=\boldsymbol{0}$
and $\tilde {\boldsymbol{B}}=\overline {\boldsymbol{B}}=\boldsymbol{0}$
, where
$\tilde {\boldsymbol{B}}=\overline {\boldsymbol{B}}=\boldsymbol{0}$
, where $\overline {\boldsymbol{\cdot }}$
denotes a spatial average over the domain of the flow. However, in this same limit,
$\overline {\boldsymbol{\cdot }}$
denotes a spatial average over the domain of the flow. However, in this same limit, $\mathcal{B}=-N\overline {u_z\phi }\neq 0$
and hence in this limit we must have
$\mathcal{B}=-N\overline {u_z\phi }\neq 0$
and hence in this limit we must have $\mathcal{B}^{{nl}}=\mathcal{B}$
. We will explore later the contribution from
$\mathcal{B}^{{nl}}=\mathcal{B}$
. We will explore later the contribution from $\mathcal{B}^{{nl}}$
across scales using DNS, and the role that ramp cliffs play in determining the sign of this term.
$\mathcal{B}^{{nl}}$
across scales using DNS, and the role that ramp cliffs play in determining the sign of this term.
Another important conclusion that follows from the behaviour of (2.16) concerns the $\textit{Pr}$
-dependence of
$\textit{Pr}$
-dependence of $\langle \mathcal{B}\rangle$
. In particular, Bragg & de Bruyn Kops (Reference Bragg, de Bruyn and Stephen2024) showed that the magnitude of
$\langle \mathcal{B}\rangle$
. In particular, Bragg & de Bruyn Kops (Reference Bragg, de Bruyn and Stephen2024) showed that the magnitude of $\langle \mathcal{P\!}_{B2}\rangle$
grows with increasing
$\langle \mathcal{P\!}_{B2}\rangle$
grows with increasing $\textit{Pr}$
(although it saturates at sufficiently large
$\textit{Pr}$
(although it saturates at sufficiently large $\textit{Pr}$
), and therefore according to (2.16), so also must
$\textit{Pr}$
), and therefore according to (2.16), so also must $\langle \mathcal{B}\rangle$
, at least in the range
$\langle \mathcal{B}\rangle$
, at least in the range $\ell \leqslant O(\eta _B)$
. This then implies that the inverse buoyancy flux at the small scales should become stronger as
$\ell \leqslant O(\eta _B)$
. This then implies that the inverse buoyancy flux at the small scales should become stronger as $\textit{Pr}$
increases. This is consistent with what has been previously observed in DNS of stratified turbulence with
$\textit{Pr}$
increases. This is consistent with what has been previously observed in DNS of stratified turbulence with $\textit{Pr}\geqslant 1$
(Okino & Hanazaki Reference Okino and Hanazaki2019; Legaspi & Waite Reference Legaspi and Waite2020).
$\textit{Pr}\geqslant 1$
(Okino & Hanazaki Reference Okino and Hanazaki2019; Legaspi & Waite Reference Legaspi and Waite2020).
3. Direct numerical simulations
The data sets to be used in the next section are from the simulation campaign of statistically stationary, stably stratified DNS first described in Almalkie & de Bruyn Kops (Reference Almalkie, de Bruyn and Stephen2012), which have later been examined by de Bruyn Kops (Reference de Bruyn Kops2015), Portwood et al. (Reference Portwood, de Bruyn Kops, Taylor, Salehipour and Caulfield2016), Taylor et al. (Reference Taylor, de Bruyn Kops, Caulfield and Linden2019), Couchman et al. (Reference Couchman, de Bruyn, Stephen and Caulfield2023) and Petropoulos et al. (Reference Petropoulos, Couchman, Mashayek, de Bruyn, Stephen and Caulfield2024). The DNS are for $\textit{Pr}=1,7$
and
$\textit{Pr}=1,7$
and $\textit{Fr}\approx 0.08, 0.16$
(note that the definition of
$\textit{Fr}\approx 0.08, 0.16$
(note that the definition of $\textit{Fr}$
differs by a factor of
$\textit{Fr}$
differs by a factor of $2\pi$
relative to the references cited at the start of this section). In each case, a constant activity parameter (which is closely related to the buoyancy Reynolds number defined in terms of the integral scales of the flow; see de Bruyn Kops & Riley (Reference de Bruyn Kops and Riley2019) for a discussion)
$2\pi$
relative to the references cited at the start of this section). In each case, a constant activity parameter (which is closely related to the buoyancy Reynolds number defined in terms of the integral scales of the flow; see de Bruyn Kops & Riley (Reference de Bruyn Kops and Riley2019) for a discussion) $\textit{Gn} \equiv \langle \epsilon \rangle /(\nu N^2) \approx 50$
is maintained. Table 1 provides a summary of the parameters from the current DNS; additional details of the simulation algorithm can be found in Almalkie & de Bruyn Kops (Reference Almalkie, de Bruyn and Stephen2012).
$\textit{Gn} \equiv \langle \epsilon \rangle /(\nu N^2) \approx 50$
is maintained. Table 1 provides a summary of the parameters from the current DNS; additional details of the simulation algorithm can be found in Almalkie & de Bruyn Kops (Reference Almalkie, de Bruyn and Stephen2012).
Flow parameters in DNS. Here, $Gn\equiv \langle \epsilon \rangle /\nu N^2$
is the activity parameter,
$Gn\equiv \langle \epsilon \rangle /\nu N^2$
is the activity parameter, $\textit{Fr}\equiv U/(LN)$
is the Froude number and AR
$\textit{Fr}\equiv U/(LN)$
is the Froude number and AR $=\mathcal{L}_h/\mathcal{L}_z$
is the aspect ratio of the simulation domain, where
$=\mathcal{L}_h/\mathcal{L}_z$
is the aspect ratio of the simulation domain, where $\mathcal{L}_h=2 \pi$
,
$\mathcal{L}_h=2 \pi$
, $\mathcal{L}_z$
are the lengths of the domain in the horizontal (
$\mathcal{L}_z$
are the lengths of the domain in the horizontal ( $h$
) and the vertical (
$h$
) and the vertical ( $z$
) directions, respectively. The three-dimensional simulation domain is discretised with (
$z$
) directions, respectively. The three-dimensional simulation domain is discretised with ( $n_h$
,
$n_h$
, $n_h$
,
$n_h$
, $n_z$
) grids points, such that
$n_z$
) grids points, such that $n_z=n_h/\text{AR}$
. Here,
$n_z=n_h/\text{AR}$
. Here, $L$
is the integral length scale computed as the horizontal autocorrelation length of the horizontal field and
$L$
is the integral length scale computed as the horizontal autocorrelation length of the horizontal field and $l_{\textit{Oz}}$
,
$l_{\textit{Oz}}$
, $\eta$
and
$\eta$
and $\eta _B$
are the Ozmidov, Kolmogorov and Bachelor length scales, respectively.
$\eta _B$
are the Ozmidov, Kolmogorov and Bachelor length scales, respectively.

For the post-processing analysis, an isotropic Gaussian filter was used, consistent with the theory in § 2. Logarithmically spaced filter scales were used and the set of $\ell /\eta$
values used in the analysis is the same for each case.
$\ell /\eta$
values used in the analysis is the same for each case.
4. Results and discussion
4.1. Sign of $\langle \mathcal{P}^\ell _{B2}\rangle$
across scales
$\langle \mathcal{P}^\ell _{B2}\rangle$
across scales

We first examine the behaviour of the filtered production mechanism $\langle \mathcal{P}^\ell _{B2}\rangle$
, which is associated with the local contribution to the scale-dependent buoyancy flux
$\langle \mathcal{P}^\ell _{B2}\rangle$
, which is associated with the local contribution to the scale-dependent buoyancy flux $\langle \mathcal{B}\rangle$
. Figure 1 shows
$\langle \mathcal{B}\rangle$
. Figure 1 shows $\langle \mathcal{P}^\ell _{B2}\rangle /\sigma ^3_{\tilde {A}}$
(where
$\langle \mathcal{P}^\ell _{B2}\rangle /\sigma ^3_{\tilde {A}}$
(where $\sigma _{\tilde {A}}\equiv \langle \| \tilde {\boldsymbol{A}}\|^2\rangle ^{1/2}$
) as a function of
$\sigma _{\tilde {A}}\equiv \langle \| \tilde {\boldsymbol{A}}\|^2\rangle ^{1/2}$
) as a function of $\ell /\eta$
for
$\ell /\eta$
for $\textit{Fr}\approx 0.08$
(solid lines) and
$\textit{Fr}\approx 0.08$
(solid lines) and $\textit{Fr} \approx 0.16$
(dashed lines) and for
$\textit{Fr} \approx 0.16$
(dashed lines) and for $\textit{Pr}=1$
(blue), and
$\textit{Pr}=1$
(blue), and $\textit{Pr}=7$
(orange). The results clearly show that
$\textit{Pr}=7$
(orange). The results clearly show that $\langle \mathcal{P}^\ell _{B2}\rangle$
changes sign as
$\langle \mathcal{P}^\ell _{B2}\rangle$
changes sign as $\ell$
is decreased, in agreement with the arguments in Bragg & de Bruyn Kops (Reference Bragg, de Bruyn and Stephen2024). The DNS data in Bragg & de Bruyn Kops (Reference Bragg, de Bruyn and Stephen2024) have also shown this sign change, but their data showed that
$\ell$
is decreased, in agreement with the arguments in Bragg & de Bruyn Kops (Reference Bragg, de Bruyn and Stephen2024). The DNS data in Bragg & de Bruyn Kops (Reference Bragg, de Bruyn and Stephen2024) have also shown this sign change, but their data showed that $\langle \mathcal{P}^\ell _{B2}\rangle$
switched sign again and became negative at the largest scales of the flow. They suggested that this was due to the non-stationarity of the decaying stratified turbulent flow they considered, since for a stationary flow their analysis suggested that
$\langle \mathcal{P}^\ell _{B2}\rangle$
switched sign again and became negative at the largest scales of the flow. They suggested that this was due to the non-stationarity of the decaying stratified turbulent flow they considered, since for a stationary flow their analysis suggested that $\langle \mathcal{P}^\ell _{B2}\rangle$
must be positive in order to satisfy the balance equation for
$\langle \mathcal{P}^\ell _{B2}\rangle$
must be positive in order to satisfy the balance equation for $\langle \|\tilde {\boldsymbol{B}}\|^2\rangle$
at the large scales (2.13). The present results which are for a stationary stratified flow seem to confirm this, showing that
$\langle \|\tilde {\boldsymbol{B}}\|^2\rangle$
at the large scales (2.13). The present results which are for a stationary stratified flow seem to confirm this, showing that $\langle \mathcal{P}^\ell _{B2}\rangle$
remains positive at the largest flow scales.
$\langle \mathcal{P}^\ell _{B2}\rangle$
remains positive at the largest flow scales.
Lin–log plots of $\langle \mathcal{P}^\ell _{B2}\rangle /\sigma ^3_{\tilde {A}}$
as a function of filter-scale
$\langle \mathcal{P}^\ell _{B2}\rangle /\sigma ^3_{\tilde {A}}$
as a function of filter-scale $\ell$
for
$\ell$
for $\textit{Pr}=1$
(blue) and
$\textit{Pr}=1$
(blue) and $\textit{Pr}=7$
(orange) with
$\textit{Pr}=7$
(orange) with $\textit{Fr}\approx 0.08$
(solid) and
$\textit{Fr}\approx 0.08$
(solid) and $\textit{Fr} \approx 0.16$
(dashed). Black vertical dashed line marks the approximate Ozmidov scale
$\textit{Fr} \approx 0.16$
(dashed). Black vertical dashed line marks the approximate Ozmidov scale $l_{O}/\eta \sim 20$
; exact values in table 1.
$l_{O}/\eta \sim 20$
; exact values in table 1.

4.2. Reversal of average buoyancy flux
Figure 2 shows plots of $-\langle \mathcal{B}\rangle /\langle \chi \rangle$
versus
$-\langle \mathcal{B}\rangle /\langle \chi \rangle$
versus $\ell /\eta$
for
$\ell /\eta$
for $\textit{Pr}=1$
(blue) and
$\textit{Pr}=1$
(blue) and $\textit{Pr}=7$
(orange) for
$\textit{Pr}=7$
(orange) for $\textit{Fr}\approx 0.08$
(solid) and
$\textit{Fr}\approx 0.08$
(solid) and $\textit{Fr} \approx 0.16$
(dashed). At the large scales
$\textit{Fr} \approx 0.16$
(dashed). At the large scales $-\langle \mathcal{B} \rangle \gt 0$
and
$-\langle \mathcal{B} \rangle \gt 0$
and $-\langle \mathcal{B} \rangle \sim \langle \chi \rangle$
, reflecting a balance between the rate of production of TPE due to buoyancy and the dissipation rate of TPE. However, for
$-\langle \mathcal{B} \rangle \sim \langle \chi \rangle$
, reflecting a balance between the rate of production of TPE due to buoyancy and the dissipation rate of TPE. However, for $\ell \lesssim l_{O}$
the results show that
$\ell \lesssim l_{O}$
the results show that $-\langle \mathcal{B} \rangle$
switches sign and becomes negative, indicating a reverse buoyancy flux with TPE being converted back into TKE at the small scales. This flux reversal occurs for both
$-\langle \mathcal{B} \rangle$
switches sign and becomes negative, indicating a reverse buoyancy flux with TPE being converted back into TKE at the small scales. This flux reversal occurs for both $\textit{Pr}=1$
and
$\textit{Pr}=1$
and $\textit{Pr}=7$
, but the magnitude of the reverse flux is much more significant for
$\textit{Pr}=7$
, but the magnitude of the reverse flux is much more significant for $\textit{Pr}=7$
. Legaspi & Waite (Reference Legaspi and Waite2020) previously observed this flux reversal in their DNS results when analysed in Fourier space, and they argued that the inverse buoyancy flux is the reason why simulations with
$\textit{Pr}=7$
. Legaspi & Waite (Reference Legaspi and Waite2020) previously observed this flux reversal in their DNS results when analysed in Fourier space, and they argued that the inverse buoyancy flux is the reason why simulations with $\textit{Pr}\gt 1$
show shallowing of the TKE spectra at high wavenumbers (see figure 10 of Legaspi & Waite (Reference Legaspi and Waite2020), and figure 8 of Riley et al. (Reference Riley, Couchman, de Bruyn and Stephen2023)). Legaspi & Waite (Reference Legaspi and Waite2020) observed a stronger buoyancy flux reversal with decreasing
$\textit{Pr}\gt 1$
show shallowing of the TKE spectra at high wavenumbers (see figure 10 of Legaspi & Waite (Reference Legaspi and Waite2020), and figure 8 of Riley et al. (Reference Riley, Couchman, de Bruyn and Stephen2023)). Legaspi & Waite (Reference Legaspi and Waite2020) observed a stronger buoyancy flux reversal with decreasing $\textit{Fr}$
, which we also see here (although the effect of
$\textit{Fr}$
, which we also see here (although the effect of $\textit{Fr}$
is very weak for the value of
$\textit{Fr}$
is very weak for the value of $Gn$
in our DNS), and also observed that the magnitude of the reverse buoyancy flux increased with increasing
$Gn$
in our DNS), and also observed that the magnitude of the reverse buoyancy flux increased with increasing $\textit{Pr}$
, which we again see here. They observed a saturation in the
$\textit{Pr}$
, which we again see here. They observed a saturation in the $\textit{Pr}$
dependence of the buoyancy flux spectra as
$\textit{Pr}$
dependence of the buoyancy flux spectra as $\textit{Pr}$
was increased, while Okino & Hanazaki (Reference Okino and Hanazaki2019) found that the buoyancy flux reversal continues to grow in magnitude when going from
$\textit{Pr}$
was increased, while Okino & Hanazaki (Reference Okino and Hanazaki2019) found that the buoyancy flux reversal continues to grow in magnitude when going from $\textit{Pr}=7$
to
$\textit{Pr}=7$
to $\textit{Pr}=70$
. It is likely that any saturation of the effect of
$\textit{Pr}=70$
. It is likely that any saturation of the effect of $\textit{Pr}$
occurs at a value of
$\textit{Pr}$
occurs at a value of $\textit{Pr}$
that depends on both the buoyancy Reynolds number
$\textit{Pr}$
that depends on both the buoyancy Reynolds number $Re_b$
and
$Re_b$
and $\textit{Fr}$
, and these values were different in Okino & Hanazaki (Reference Okino and Hanazaki2019) and Legaspi & Waite (Reference Legaspi and Waite2020).
$\textit{Fr}$
, and these values were different in Okino & Hanazaki (Reference Okino and Hanazaki2019) and Legaspi & Waite (Reference Legaspi and Waite2020).
4.3. Contribution to average buoyancy flux from local and non-local mechanisms
As discussed in § 2, the filtered production mechanism $ \mathcal{P}^{\ell }_{B2}$
is related to the scale-local part of the buoyancy flux
$ \mathcal{P}^{\ell }_{B2}$
is related to the scale-local part of the buoyancy flux $\mathcal{B}^{\textit{l}}=-\ell ^2 \mathcal{P}^\ell _{B2}$
, i.e. the part of the buoyancy flux involving only contributions from filtered scales of motion. Figure 3 shows the ratio of
$\mathcal{B}^{\textit{l}}=-\ell ^2 \mathcal{P}^\ell _{B2}$
, i.e. the part of the buoyancy flux involving only contributions from filtered scales of motion. Figure 3 shows the ratio of $\langle \mathcal{B}^{\textit{l}}\rangle$
to
$\langle \mathcal{B}^{\textit{l}}\rangle$
to $\langle \mathcal{B}\rangle$
for
$\langle \mathcal{B}\rangle$
for $\textit{Pr}=1$
(blue),
$\textit{Pr}=1$
(blue), $\textit{Pr}=7$
(orange) with
$\textit{Pr}=7$
(orange) with $\textit{Fr}\approx 0.08$
(solid) and
$\textit{Fr}\approx 0.08$
(solid) and $\textit{Fr} \approx 0.16$
(dashed). In the limit
$\textit{Fr} \approx 0.16$
(dashed). In the limit $\ell /\eta \to 0$
the ratio approaches one, consistent with the analysis in § 2 that predicts
$\ell /\eta \to 0$
the ratio approaches one, consistent with the analysis in § 2 that predicts $\lim _{\ell /\eta \to 0}\mathcal{B}\to -\ell ^2\mathcal{P\!}_{B2}$
. While there are extended portions of the scale space over which
$\lim _{\ell /\eta \to 0}\mathcal{B}\to -\ell ^2\mathcal{P\!}_{B2}$
. While there are extended portions of the scale space over which $\langle \mathcal{B}^{\textit{l}}\rangle$
makes a substantial contribution to
$\langle \mathcal{B}^{\textit{l}}\rangle$
makes a substantial contribution to $\langle \mathcal{B}\rangle$
, it is clear that in general the non-local term
$\langle \mathcal{B}\rangle$
, it is clear that in general the non-local term $\langle \mathcal{B}^{{nl}}\rangle$
makes a significant contribution. At intermediate
$\langle \mathcal{B}^{{nl}}\rangle$
makes a significant contribution. At intermediate $\ell /\eta$
,
$\ell /\eta$
, $\langle \mathcal{B}^{\textit{l}}\rangle /\langle \mathcal{B}\rangle$
diverges to
$\langle \mathcal{B}^{\textit{l}}\rangle /\langle \mathcal{B}\rangle$
diverges to $+\infty$
, and then to
$+\infty$
, and then to $-\infty$
, and this occurs because
$-\infty$
, and this occurs because $\langle \mathcal{P}^\ell _{B2}\rangle$
and
$\langle \mathcal{P}^\ell _{B2}\rangle$
and $\langle \mathcal{B}\rangle$
do not change sign at the same scale. Outside of the range of
$\langle \mathcal{B}\rangle$
do not change sign at the same scale. Outside of the range of $\ell /\eta$
in which these divergences occur, the signs of
$\ell /\eta$
in which these divergences occur, the signs of $\langle \mathcal{B}^{\textit{l}}\rangle$
and
$\langle \mathcal{B}^{\textit{l}}\rangle$
and $\langle \mathcal{B}\rangle$
correspond to each other. The results also show that in the limit
$\langle \mathcal{B}\rangle$
correspond to each other. The results also show that in the limit $\ell /\eta \to \infty$
,
$\ell /\eta \to \infty$
, $\langle \mathcal{B}^{\textit{l}}\rangle /\langle \mathcal{B}\rangle \to 0$
, consistent with the argument made earlier that in this limit
$\langle \mathcal{B}^{\textit{l}}\rangle /\langle \mathcal{B}\rangle \to 0$
, consistent with the argument made earlier that in this limit $\langle \mathcal{B}\rangle \to \langle \mathcal{B}^{{nl}}\rangle$
due to homogeneity of the flow.
$\langle \mathcal{B}\rangle \to \langle \mathcal{B}^{{nl}}\rangle$
due to homogeneity of the flow.
Buoyancy flux $\langle \mathcal{B} \rangle$
as a function of filter-scale
$\langle \mathcal{B} \rangle$
as a function of filter-scale $\ell$
for
$\ell$
for $\textit{Pr}=1$
(blue) and
$\textit{Pr}=1$
(blue) and $\textit{Pr}=7$
(orange) with
$\textit{Pr}=7$
(orange) with $\textit{Fr}\approx 0.08$
(solid) and
$\textit{Fr}\approx 0.08$
(solid) and $\textit{Fr} \approx 0.16$
(dashed). Black vertical dashed line marks the approximate Ozmidov scale
$\textit{Fr} \approx 0.16$
(dashed). Black vertical dashed line marks the approximate Ozmidov scale $l_{O}/\eta \sim 20$
; exact values in table 1.
$l_{O}/\eta \sim 20$
; exact values in table 1.

Ratio of the scale-local component to the total buoyancy flux $\langle \mathcal{B}^{\textit{l}}\rangle /\langle \mathcal{B}\rangle$
as a function of filter-scale
$\langle \mathcal{B}^{\textit{l}}\rangle /\langle \mathcal{B}\rangle$
as a function of filter-scale $\ell$
for
$\ell$
for $\textit{Pr}=1$
(blue),
$\textit{Pr}=1$
(blue), $\textit{Pr}=7$
(orange) with
$\textit{Pr}=7$
(orange) with $\textit{Fr}\approx 0.08$
(solid) and
$\textit{Fr}\approx 0.08$
(solid) and $\textit{Fr} \approx 0.16$
(dashed). Black vertical dashed line marks the approximate Ozmidov scale
$\textit{Fr} \approx 0.16$
(dashed). Black vertical dashed line marks the approximate Ozmidov scale $l_{O}/\eta \sim 20$
; exact values in table 1.
$l_{O}/\eta \sim 20$
; exact values in table 1.

Traditionally, the small-scale reverse buoyancy flux has been related to internal wave breaking and convective instabilities (Holloway Reference Holloway1988; Bouruet-Aubertot et al. Reference Bouruet-Aubertot, Sommeria and Staquet1996). Holloway (Reference Holloway1988) proposed that the TPE is transferred more efficiently to smaller scales than TKE through the cascade mechanism, and therefore the reverse buoyancy flux restores equipartition. Bouruet-Aubertot et al. (Reference Bouruet-Aubertot, Sommeria and Staquet1996) argued that it is due to shear instabilities in vorticity layers that form after wave breaking. While these explanations are possible, the scale at which the reversal occurs seems too small for the underlying mechanism to be associated with wave motion which is more likely to play a role at scales $\ell \gt l_{O}$
. There is also no reason why equipartition should be expected to hold for these non-equilibrium systems. More importantly, however, is that these mechanisms cannot explain why
$\ell \gt l_{O}$
. There is also no reason why equipartition should be expected to hold for these non-equilibrium systems. More importantly, however, is that these mechanisms cannot explain why $\langle \mathcal{B}\rangle$
also changes sign at the small scales even for a passive scalar (neutrally buoyant) flow (for such a flow, although
$\langle \mathcal{B}\rangle$
also changes sign at the small scales even for a passive scalar (neutrally buoyant) flow (for such a flow, although $\langle \mathcal{B}\rangle$
is absent from the TKE equation, it is still present in the TPE equation and describes the production of
$\langle \mathcal{B}\rangle$
is absent from the TKE equation, it is still present in the TPE equation and describes the production of $\phi$
due to the mean scalar gradient). As discussed earlier, at the small scales
$\phi$
due to the mean scalar gradient). As discussed earlier, at the small scales $\langle \mathcal{B}\rangle \sim -\ell ^2\langle \mathcal{P\!}_{B2}\rangle$
, and Bragg & de Bruyn Kops (Reference Bragg, de Bruyn and Stephen2024) showed that
$\langle \mathcal{B}\rangle \sim -\ell ^2\langle \mathcal{P\!}_{B2}\rangle$
, and Bragg & de Bruyn Kops (Reference Bragg, de Bruyn and Stephen2024) showed that $\langle \mathcal{P\!}_{B2}\rangle$
is negative for a passive scalar due to the formation of ramp cliffs, implying
$\langle \mathcal{P\!}_{B2}\rangle$
is negative for a passive scalar due to the formation of ramp cliffs, implying $\langle \mathcal{B}\rangle \gt 0$
at those scales. Since the mechanism we have proposed, which is grounded in that described by Bragg & de Bruyn Kops (Reference Bragg, de Bruyn and Stephen2024), can explain why
$\langle \mathcal{B}\rangle \gt 0$
at those scales. Since the mechanism we have proposed, which is grounded in that described by Bragg & de Bruyn Kops (Reference Bragg, de Bruyn and Stephen2024), can explain why $\langle \mathcal{B}\rangle \gt 0$
at the small scales in both stratified and neutral flows, it seems more plausible than the alternative explanations which could only apply to stratified flows. However, while the mechanism we have proposed explains why
$\langle \mathcal{B}\rangle \gt 0$
at the small scales in both stratified and neutral flows, it seems more plausible than the alternative explanations which could only apply to stratified flows. However, while the mechanism we have proposed explains why $\langle \mathcal{B}\rangle \gt 0$
at the smallest scales, it only partially explains it outside of this range. A complete explanation would require a mechanism that also explains why
$\langle \mathcal{B}\rangle \gt 0$
at the smallest scales, it only partially explains it outside of this range. A complete explanation would require a mechanism that also explains why $\langle \mathcal{B}^{{nl}}\rangle \gt 0$
at smaller scales.
$\langle \mathcal{B}^{{nl}}\rangle \gt 0$
at smaller scales.
An important observation is that the integrand defining the non-local buoyancy flux $\mathcal{B}^{{nl}}$
(see (2.16)) is mathematically similar in form to the quantity
$\mathcal{B}^{{nl}}$
(see (2.16)) is mathematically similar in form to the quantity $\tilde {\boldsymbol{B}} \boldsymbol{\cdot } \tilde {\boldsymbol{A}}^\top \boldsymbol{\cdot } \hat {\boldsymbol{e}}_z$
appearing in the definition of
$\tilde {\boldsymbol{B}} \boldsymbol{\cdot } \tilde {\boldsymbol{A}}^\top \boldsymbol{\cdot } \hat {\boldsymbol{e}}_z$
appearing in the definition of $\mathcal{P}^\ell _{B2}$
, with both involving invariants formed from filtered velocity and density gradients, along with
$\mathcal{P}^\ell _{B2}$
, with both involving invariants formed from filtered velocity and density gradients, along with $\hat {\boldsymbol{e}}_z$
. This suggests that just as the sign of
$\hat {\boldsymbol{e}}_z$
. This suggests that just as the sign of $\mathcal{P}^\ell _{B2}$
depends crucially on the sign of
$\mathcal{P}^\ell _{B2}$
depends crucially on the sign of $\hat {\boldsymbol{e}}_{\tilde {B}} \boldsymbol{\cdot } \hat {\boldsymbol{e}}_z$
(where
$\hat {\boldsymbol{e}}_{\tilde {B}} \boldsymbol{\cdot } \hat {\boldsymbol{e}}_z$
(where $\hat {\boldsymbol{e}}_{\tilde {B}} \equiv \widetilde {\boldsymbol{B}}/\|\widetilde {\boldsymbol{B}}\|$
) and the associated ramp–cliff structures, so also might
$\hat {\boldsymbol{e}}_{\tilde {B}} \equiv \widetilde {\boldsymbol{B}}/\|\widetilde {\boldsymbol{B}}\|$
) and the associated ramp–cliff structures, so also might $\mathcal{B}^{{ nl}}$
. If so, then the formation of ramp–cliff structures might not only be responsible for
$\mathcal{B}^{{ nl}}$
. If so, then the formation of ramp–cliff structures might not only be responsible for $\langle \mathcal{P}^\ell _{B2}\rangle$
becoming negative at small scales, but also for
$\langle \mathcal{P}^\ell _{B2}\rangle$
becoming negative at small scales, but also for $\langle \mathcal{B}^{{ nl}}\rangle$
and hence the entire flux
$\langle \mathcal{B}^{{ nl}}\rangle$
and hence the entire flux $\langle \mathcal{B}\rangle$
becoming positive at small scales. To explore this further, we conditionally average the buoyancy flux and its local and non-local components based on the alignment of the density gradient
$\langle \mathcal{B}\rangle$
becoming positive at small scales. To explore this further, we conditionally average the buoyancy flux and its local and non-local components based on the alignment of the density gradient $\hat {\boldsymbol{e}}_{\tilde {B}} \boldsymbol{\cdot } \hat {\boldsymbol{e}}_z \in [-1,+1]$
at different filter scales, defined as
$\hat {\boldsymbol{e}}_{\tilde {B}} \boldsymbol{\cdot } \hat {\boldsymbol{e}}_z \in [-1,+1]$
at different filter scales, defined as
 \begin{align} \mathcal{Y}(\gamma )&\equiv \langle \mathcal{B}\rangle _\gamma \mathcal{P}(\gamma ), \end{align}
 \begin{align} \mathcal{Y}^{{nl}}(\gamma )&\equiv \langle \mathcal{B}^{{nl}}\rangle _\gamma \mathcal{P}(\gamma ), \end{align}
 \begin{align} \mathcal{Y}^{\textit{l}}(\gamma )&\equiv \langle \mathcal{B}^{\textit{l}}\rangle _\gamma \mathcal{P}(\gamma ), \end{align}
where $\langle \boldsymbol{\cdot }\rangle _\gamma$
denotes an average conditioned on
$\langle \boldsymbol{\cdot }\rangle _\gamma$
denotes an average conditioned on $\gamma =\hat {\boldsymbol{e}}_{\tilde {B}} \boldsymbol{\cdot } \hat {\boldsymbol{e}}_z$
,
$\gamma =\hat {\boldsymbol{e}}_{\tilde {B}} \boldsymbol{\cdot } \hat {\boldsymbol{e}}_z$
, $\mathcal{P}(\gamma )\equiv \langle \delta ( \gamma - \hat {\boldsymbol{e}}_{\tilde {B}} \boldsymbol{\cdot } \hat {\boldsymbol{e}}_z )\rangle$
is the probability density function of
$\mathcal{P}(\gamma )\equiv \langle \delta ( \gamma - \hat {\boldsymbol{e}}_{\tilde {B}} \boldsymbol{\cdot } \hat {\boldsymbol{e}}_z )\rangle$
is the probability density function of $\gamma$
and
$\gamma$
and $\langle \mathcal{B}\rangle =\int _{-1}^{+1}\mathcal{Y}(\gamma )\,{\rm d}\gamma$
,
$\langle \mathcal{B}\rangle =\int _{-1}^{+1}\mathcal{Y}(\gamma )\,{\rm d}\gamma$
, $\langle \mathcal{B}^{{ nl}}\rangle =\int _{-1}^{+1}\mathcal{Y}^{{nl}}(\gamma )\,{\rm d}\gamma$
,
$\langle \mathcal{B}^{{ nl}}\rangle =\int _{-1}^{+1}\mathcal{Y}^{{nl}}(\gamma )\,{\rm d}\gamma$
, $\langle \mathcal{B}^{\textit{l}}\rangle =\int _{-1}^{+1}\mathcal{Y}^{\textit{l}}(\gamma )\,{\rm d}\gamma$
. Ramps (which are the most frequently occurring events) correspond to
$\langle \mathcal{B}^{\textit{l}}\rangle =\int _{-1}^{+1}\mathcal{Y}^{\textit{l}}(\gamma )\,{\rm d}\gamma$
. Ramps (which are the most frequently occurring events) correspond to $\gamma \gt 0$
(i.e. misalignment of
$\gamma \gt 0$
(i.e. misalignment of $\tilde {\boldsymbol{B}}$
with the mean density direction
$\tilde {\boldsymbol{B}}$
with the mean density direction $\hat {\boldsymbol{g}}=-\hat {\boldsymbol{e}}_z$
), whereas cliffs correspond to
$\hat {\boldsymbol{g}}=-\hat {\boldsymbol{e}}_z$
), whereas cliffs correspond to $\gamma \lt 0$
. Figure 4 shows the results for
$\gamma \lt 0$
. Figure 4 shows the results for $\mathcal{Y},\mathcal{Y}^{{nl}}, \mathcal{Y}^{\textit{l}}$
at different scales, where blue (orange) lines show the values for
$\mathcal{Y},\mathcal{Y}^{{nl}}, \mathcal{Y}^{\textit{l}}$
at different scales, where blue (orange) lines show the values for $\textit{Pr}=1$
(
$\textit{Pr}=1$
( $\textit{Pr}=7$
), whereas the solid (dashed) lines correspond to
$\textit{Pr}=7$
), whereas the solid (dashed) lines correspond to $\textit{Fr}\approx 0.08$
(
$\textit{Fr}\approx 0.08$
( $\textit{Fr} \approx 0.16$
). Panels (a–d) correspond to filtering at scales
$\textit{Fr} \approx 0.16$
). Panels (a–d) correspond to filtering at scales $\ell /\eta \approx 0.7$
,
$\ell /\eta \approx 0.7$
, $\ell /\eta \approx 12$
,
$\ell /\eta \approx 12$
, $\ell /\eta \approx 26$
and
$\ell /\eta \approx 26$
and $\ell /\eta \approx 90$
, respectively.
$\ell /\eta \approx 90$
, respectively.
Averages of the total buoyancy flux $\mathcal{B}$
, and its scale-non-local and scale-local decompositions
$\mathcal{B}$
, and its scale-non-local and scale-local decompositions $\mathcal{B}^{nl}$
and
$\mathcal{B}^{nl}$
and $\mathcal{B}^l$
, respectively, conditioned on
$\mathcal{B}^l$
, respectively, conditioned on $\gamma =\hat {\boldsymbol{e}}_{\tilde {B}} \boldsymbol{\cdot } \hat {\boldsymbol{e}}_z$
and normalised by the average TPE dissipation rate
$\gamma =\hat {\boldsymbol{e}}_{\tilde {B}} \boldsymbol{\cdot } \hat {\boldsymbol{e}}_z$
and normalised by the average TPE dissipation rate $\langle \chi \rangle$
. Blue (orange) lines show the values for
$\langle \chi \rangle$
. Blue (orange) lines show the values for $\textit{Pr}=1$
(
$\textit{Pr}=1$
( $\textit{Pr}=7$
), whereas the solid (dashed) lines correspond to
$\textit{Pr}=7$
), whereas the solid (dashed) lines correspond to $\textit{Fr}\approx 0.08$
(
$\textit{Fr}\approx 0.08$
( $\textit{Fr} \approx 0.16$
). Panels (a–d) correspond to fields filtered at scales
$\textit{Fr} \approx 0.16$
). Panels (a–d) correspond to fields filtered at scales $\ell /\eta \approx 0.7$
,
$\ell /\eta \approx 0.7$
, $\ell /\eta \approx 12$
,
$\ell /\eta \approx 12$
, $\ell /\eta \approx 26$
and
$\ell /\eta \approx 26$
and $\ell /\eta \approx 90$
, respectively.
$\ell /\eta \approx 90$
, respectively.

The results for $\mathcal{Y}$
show that, at the small scales where there is a reverse buoyancy flux (i.e.
$\mathcal{Y}$
show that, at the small scales where there is a reverse buoyancy flux (i.e. $\ell /\eta \lesssim 26$
), ramp structures contribute exclusively to reverse buoyancy flux events, and at intermediate scales (e.g.
$\ell /\eta \lesssim 26$
), ramp structures contribute exclusively to reverse buoyancy flux events, and at intermediate scales (e.g. $\ell /\eta \approx 12, 26$
) the main contribution is from ramp regions with strong alignment
$\ell /\eta \approx 12, 26$
) the main contribution is from ramp regions with strong alignment $\gamma \approx +1$
. By contrast, cliff regions contribute to both forward and reverse buoyancy flux events, with regions of strong misalignment
$\gamma \approx +1$
. By contrast, cliff regions contribute to both forward and reverse buoyancy flux events, with regions of strong misalignment $\gamma \approx -1$
strikingly associated with regions of forward buoyancy flux at all scales in the flow, where TKE is converted to TPE. These results are consistent with the arguments of Bragg & de Bruyn Kops (Reference Bragg, de Bruyn and Stephen2024) and those presented in § 2, lending support to the idea that the sign of the buoyancy flux is intimately connected to ramp–cliff structures in the flow. It is also quite remarkable that except for scales
$\gamma \approx -1$
strikingly associated with regions of forward buoyancy flux at all scales in the flow, where TKE is converted to TPE. These results are consistent with the arguments of Bragg & de Bruyn Kops (Reference Bragg, de Bruyn and Stephen2024) and those presented in § 2, lending support to the idea that the sign of the buoyancy flux is intimately connected to ramp–cliff structures in the flow. It is also quite remarkable that except for scales $\ell \leqslant O(\eta )$
, the largest contributions to
$\ell \leqslant O(\eta )$
, the largest contributions to $\langle \mathcal{B}\rangle$
come from the extreme events where
$\langle \mathcal{B}\rangle$
come from the extreme events where $\gamma \approx -1$
and
$\gamma \approx -1$
and $\gamma \approx +1$
, further emphasising the crucial role that ramp cliffs play in the buoyancy flux mechanism.
$\gamma \approx +1$
, further emphasising the crucial role that ramp cliffs play in the buoyancy flux mechanism.
The results for $\mathcal{Y}^{{nl}}$
are qualitatively very similar to those of both
$\mathcal{Y}^{{nl}}$
are qualitatively very similar to those of both $\mathcal{Y}$
and
$\mathcal{Y}$
and $\mathcal{Y}^{\textit{l}}$
(except for
$\mathcal{Y}^{\textit{l}}$
(except for $\ell /\eta \approx 0.7$
, which is simply because
$\ell /\eta \approx 0.7$
, which is simply because $\mathcal{Y}^{{nl}}\to 0$
for
$\mathcal{Y}^{{nl}}\to 0$
for $\ell /\eta \to 0$
). In particular,
$\ell /\eta \to 0$
). In particular, $\mathcal{Y}^{{nl}}$
exhibits a reverse flux in ramp regions where
$\mathcal{Y}^{{nl}}$
exhibits a reverse flux in ramp regions where $\gamma \approx +1$
, and a forward flux in cliff regions where
$\gamma \approx +1$
, and a forward flux in cliff regions where $\gamma \approx -1$
. This strongly suggests that the formation of ramp–cliff structures is not only responsible for the behaviour of the local part of the buoyancy flux and its sign, but also that of the non-local part, as speculated earlier. At larger scales,
$\gamma \approx -1$
. This strongly suggests that the formation of ramp–cliff structures is not only responsible for the behaviour of the local part of the buoyancy flux and its sign, but also that of the non-local part, as speculated earlier. At larger scales, $\ell /\eta \approx 90$
,
$\ell /\eta \approx 90$
, $\mathcal{Y}, \mathcal{Y}^{{nl}}, \mathcal{Y}^{\textit{l}}$
are negative at all
$\mathcal{Y}, \mathcal{Y}^{{nl}}, \mathcal{Y}^{\textit{l}}$
are negative at all $\gamma$
, corresponding to a total buoyancy flux that is forward, converting TKE to TPE. For a statistically stationary, stably stratified turbulent flow where only the TKE field has a source term (as in our DNS), the TPE field cannot be sustained unless
$\gamma$
, corresponding to a total buoyancy flux that is forward, converting TKE to TPE. For a statistically stationary, stably stratified turbulent flow where only the TKE field has a source term (as in our DNS), the TPE field cannot be sustained unless $\langle \mathcal{B}\rangle \lt 0$
at the large scales. There are therefore two effects controlling the sign of
$\langle \mathcal{B}\rangle \lt 0$
at the large scales. There are therefore two effects controlling the sign of $\langle \mathcal{B}\rangle$
, one coming from the symmetry-breaking effect of the ramp–cliff structures, and the other from the need to sustain the TPE field. In a sense the latter is more fundamental because unless the TPE field is sustained, there would not even be ramp–cliff structures in the first place. We therefore suggest the following picture for understanding the behaviour of the sign of
$\langle \mathcal{B}\rangle$
, one coming from the symmetry-breaking effect of the ramp–cliff structures, and the other from the need to sustain the TPE field. In a sense the latter is more fundamental because unless the TPE field is sustained, there would not even be ramp–cliff structures in the first place. We therefore suggest the following picture for understanding the behaviour of the sign of $\langle \mathcal{B}\rangle$
: At large scales,
$\langle \mathcal{B}\rangle$
: At large scales, $\langle \mathcal{B}\rangle \lt 0$
, which must occur in order for the TPE field to be sustained against the dissipative effect of molecular mixing of the density field. However, once sufficiently small scales are attained for
$\langle \mathcal{B}\rangle \lt 0$
, which must occur in order for the TPE field to be sustained against the dissipative effect of molecular mixing of the density field. However, once sufficiently small scales are attained for $\langle \mathcal{B}\rangle$
to play a sub-leading role in the TPE equation (e.g. because the TPE interscale flux term becomes important) then the symmetry-breaking effect of the ramp cliffs is able to exert its influence and enforce
$\langle \mathcal{B}\rangle$
to play a sub-leading role in the TPE equation (e.g. because the TPE interscale flux term becomes important) then the symmetry-breaking effect of the ramp cliffs is able to exert its influence and enforce $\langle \mathcal{B}\rangle \gt 0$
.
$\langle \mathcal{B}\rangle \gt 0$
.
Correlation coefficient of $\mathcal{B}$
with the scale-local term
$\mathcal{B}$
with the scale-local term $\mathcal{B}^{\textit{l}}=-\ell ^2 \mathcal{P}^\ell _{B2}$
(2.16) for
$\mathcal{B}^{\textit{l}}=-\ell ^2 \mathcal{P}^\ell _{B2}$
(2.16) for $\textit{Pr}=1$
(blue),
$\textit{Pr}=1$
(blue), $\textit{Pr}=7$
(orange) with
$\textit{Pr}=7$
(orange) with $\textit{Fr}\approx 0.08$
(solid) and
$\textit{Fr}\approx 0.08$
(solid) and $\textit{Fr} \approx 0.16$
(dashed). Black vertical dashed line marks the approximate Ozmidov scale
$\textit{Fr} \approx 0.16$
(dashed). Black vertical dashed line marks the approximate Ozmidov scale $l_{O}/\eta \sim 20$
; exact values in table 1.
$l_{O}/\eta \sim 20$
; exact values in table 1.

4.4. Contribution from local mechanism to fluctuations of buoyancy flux
Finally, we turn to consider how fluctuations of the local contribution $\mathcal{B}^{\textit{l}}$
are correlated with those of the instantaneous buoyancy flux
$\mathcal{B}^{\textit{l}}$
are correlated with those of the instantaneous buoyancy flux $\mathcal{B}$
. Figure 5 shows the correlation coefficient of
$\mathcal{B}$
. Figure 5 shows the correlation coefficient of $\mathcal{B}^{\textit{l}}$
and
$\mathcal{B}^{\textit{l}}$
and $\mathcal{B}$
as a function of
$\mathcal{B}$
as a function of $\ell /\eta$
for
$\ell /\eta$
for $\textit{Pr}=1$
(blue),
$\textit{Pr}=1$
(blue), $\textit{Pr}=7$
(orange) with
$\textit{Pr}=7$
(orange) with $\textit{Fr}\approx 0.08$
(solid) and
$\textit{Fr}\approx 0.08$
(solid) and $\textit{Fr} \approx 0.16$
(dashed). We observe that the total buoyancy flux
$\textit{Fr} \approx 0.16$
(dashed). We observe that the total buoyancy flux $\mathcal{B}$
is strongly correlated to the local contribution
$\mathcal{B}$
is strongly correlated to the local contribution $\mathcal{B}^{\textit{l}}$
, and this holds true even at scales where the ratios of their mean values is significantly different. The strong correlation in the fluctuations of
$\mathcal{B}^{\textit{l}}$
, and this holds true even at scales where the ratios of their mean values is significantly different. The strong correlation in the fluctuations of $\mathcal{B}$
and
$\mathcal{B}$
and $\mathcal{B}^{\textit{l}}$
, especially at scales when
$\mathcal{B}^{\textit{l}}$
, especially at scales when $\mathcal{B}^{{nl}}$
is significant, is further evidence of the shared underlying mechanism, related to ramp–cliff structures, shown in figure 4. This is reminiscent of the correlation observed in isotropic turbulence between the TKE inter-scale energy flux
$\mathcal{B}^{{nl}}$
is significant, is further evidence of the shared underlying mechanism, related to ramp–cliff structures, shown in figure 4. This is reminiscent of the correlation observed in isotropic turbulence between the TKE inter-scale energy flux $\varPi _K$
and the scale-local contribution to this flux from the corresponding filter-scale gradient production mechanisms (Johnson Reference Johnson2021): the correlation coefficient being close to
$\varPi _K$
and the scale-local contribution to this flux from the corresponding filter-scale gradient production mechanisms (Johnson Reference Johnson2021): the correlation coefficient being close to $0.9$
, which is also what we observe here. The results in figure 5 also indicate that
$0.9$
, which is also what we observe here. The results in figure 5 also indicate that $\textit{Fr},\textit{Pr}$
do not have a strong or systematic effect on the correlations, except at scales
$\textit{Fr},\textit{Pr}$
do not have a strong or systematic effect on the correlations, except at scales $\ell /\eta \geqslant O(100)$
.
$\ell /\eta \geqslant O(100)$
.
5. Conclusions
Recent investigations of stratified turbulence show that the TPE (TKE) dissipation rate $\langle \chi \rangle$
(
$\langle \chi \rangle$
( $\langle \epsilon \rangle$
) is smaller (larger) for flows with larger
$\langle \epsilon \rangle$
) is smaller (larger) for flows with larger $\textit{Pr}$
(Okino & Hanazaki Reference Okino and Hanazaki2019; Riley et al. Reference Riley, Couchman, de Bruyn and Stephen2023). Bragg & de Bruyn Kops (Reference Bragg, de Bruyn and Stephen2024) argued that this can be understood due to the role of the gradient production mechanism associated with the mean density gradient,
$\textit{Pr}$
(Okino & Hanazaki Reference Okino and Hanazaki2019; Riley et al. Reference Riley, Couchman, de Bruyn and Stephen2023). Bragg & de Bruyn Kops (Reference Bragg, de Bruyn and Stephen2024) argued that this can be understood due to the role of the gradient production mechanism associated with the mean density gradient, $\mathcal{P\!}_{B2}$
, which appears with an opposite sign in the velocity and density gradient equations. In particular they argued that the formation of ramp–cliff structures in the fluctuating density field ultimately leads to
$\mathcal{P\!}_{B2}$
, which appears with an opposite sign in the velocity and density gradient equations. In particular they argued that the formation of ramp–cliff structures in the fluctuating density field ultimately leads to $\langle \mathcal{P\!}_{B2}\rangle$
being negative, and the fact that the fluctuating density gradients increase in magnitude as
$\langle \mathcal{P\!}_{B2}\rangle$
being negative, and the fact that the fluctuating density gradients increase in magnitude as $\textit{Pr}$
is increased also causes the magnitude of
$\textit{Pr}$
is increased also causes the magnitude of $\langle \mathcal{P\!}_{B2}\rangle$
to increase. This then causes
$\langle \mathcal{P\!}_{B2}\rangle$
to increase. This then causes $\langle \chi \rangle$
to decrease and
$\langle \chi \rangle$
to decrease and $\langle \epsilon \rangle$
to increase as
$\langle \epsilon \rangle$
to increase as $\textit{Pr}$
increases. In this study we sought to explain the connection between this mechanism and the small-scale reverse buoyancy flux that has previously been observed in stratified turbulence.
$\textit{Pr}$
increases. In this study we sought to explain the connection between this mechanism and the small-scale reverse buoyancy flux that has previously been observed in stratified turbulence.
An exact decomposition of the scale-dependent buoyancy flux $\mathcal{B}$
was derived using a filtering analysis and analytical results from Johnson (Reference Johnson2020, Reference Johnson2021). The result is
$\mathcal{B}$
was derived using a filtering analysis and analytical results from Johnson (Reference Johnson2020, Reference Johnson2021). The result is $\mathcal{B}=-\ell ^2\mathcal{P}_{B2}^\ell +\mathcal{B}^{nl}$
, where
$\mathcal{B}=-\ell ^2\mathcal{P}_{B2}^\ell +\mathcal{B}^{nl}$
, where $\mathcal{P}_{B2}^\ell$
is a generalisation of the gradient production term analysed in Bragg & de Bruyn Kops (Reference Bragg, de Bruyn and Stephen2024) that describes the production of gradients filtered at scale
$\mathcal{P}_{B2}^\ell$
is a generalisation of the gradient production term analysed in Bragg & de Bruyn Kops (Reference Bragg, de Bruyn and Stephen2024) that describes the production of gradients filtered at scale $\ell$
and satisfies
$\ell$
and satisfies $\mathcal{P}_{B2}^\ell =\mathcal{P\!}_{B2}$
for
$\mathcal{P}_{B2}^\ell =\mathcal{P\!}_{B2}$
for $\ell /\eta _B\to 0$
(where
$\ell /\eta _B\to 0$
(where $\eta _B$
is the Batchelor length). The term
$\eta _B$
is the Batchelor length). The term $-\ell ^2\mathcal{P}_{B2}^\ell$
represents the scale-local contribution from scales
$-\ell ^2\mathcal{P}_{B2}^\ell$
represents the scale-local contribution from scales $\geqslant \ell$
, while
$\geqslant \ell$
, while $\mathcal{B}^{nl}$
denotes the non-local contribution. In the limit
$\mathcal{B}^{nl}$
denotes the non-local contribution. In the limit $\ell /\eta _B\to 0$
the result yields
$\ell /\eta _B\to 0$
the result yields $\langle \mathcal{B}\rangle =-\ell ^2\langle \mathcal{P\!}_{B2}\rangle$
, and therefore the mechanism presented in Bragg & de Bruyn Kops (Reference Bragg, de Bruyn and Stephen2024) for why
$\langle \mathcal{B}\rangle =-\ell ^2\langle \mathcal{P\!}_{B2}\rangle$
, and therefore the mechanism presented in Bragg & de Bruyn Kops (Reference Bragg, de Bruyn and Stephen2024) for why $\langle \mathcal{P\!}_{B2}\rangle \lt 0$
and why its magnitude increases with increasing
$\langle \mathcal{P\!}_{B2}\rangle \lt 0$
and why its magnitude increases with increasing $\textit{Pr}$
also explains why
$\textit{Pr}$
also explains why $\langle \mathcal{B}\rangle \gt 0$
at the smallest scales of stratified turbulence and why the reverse buoyancy flux at the small scales becomes stronger with increasing
$\langle \mathcal{B}\rangle \gt 0$
at the smallest scales of stratified turbulence and why the reverse buoyancy flux at the small scales becomes stronger with increasing $\textit{Pr}$
.
$\textit{Pr}$
.
State-of-the-art DNS of three-dimensional, strongly stratified turbulence with $\textit{Pr}=1,7$
was used to test the predictions and explore further the behaviour of
$\textit{Pr}=1,7$
was used to test the predictions and explore further the behaviour of $\mathcal{B}$
. The results confirm the argument from Bragg & de Bruyn Kops (Reference Bragg, de Bruyn and Stephen2024) that
$\mathcal{B}$
. The results confirm the argument from Bragg & de Bruyn Kops (Reference Bragg, de Bruyn and Stephen2024) that $\langle \mathcal{P}_{B2}^\ell \rangle$
should switch from being positive at the large scales, to negative at the small scales. The results for
$\langle \mathcal{P}_{B2}^\ell \rangle$
should switch from being positive at the large scales, to negative at the small scales. The results for $\langle \mathcal{B}\rangle$
also agree with previous studies showing that
$\langle \mathcal{B}\rangle$
also agree with previous studies showing that $\langle \mathcal{B}\rangle \gt 0$
at the small scales, with a magnitude that increases with increasing
$\langle \mathcal{B}\rangle \gt 0$
at the small scales, with a magnitude that increases with increasing $\textit{Pr}$
. The results confirm that for
$\textit{Pr}$
. The results confirm that for $\ell \leqslant O(\eta _B)$
,
$\ell \leqslant O(\eta _B)$
, $\langle \mathcal{B}\rangle \sim -\ell ^2\langle \mathcal{P\!}_{B2}\rangle$
, and therefore support the proposed mechanism for why
$\langle \mathcal{B}\rangle \sim -\ell ^2\langle \mathcal{P\!}_{B2}\rangle$
, and therefore support the proposed mechanism for why $\langle \mathcal{B}\rangle \gt 0$
at the smallest scales. Although
$\langle \mathcal{B}\rangle \gt 0$
at the smallest scales. Although $\langle \mathcal{B}^{{nl}}\rangle$
makes an important contribution to
$\langle \mathcal{B}^{{nl}}\rangle$
makes an important contribution to $\langle \mathcal{B}\rangle$
beyond the smallest scales, we show that the correlation between the scale-local part
$\langle \mathcal{B}\rangle$
beyond the smallest scales, we show that the correlation between the scale-local part $-\ell ^2\langle \mathcal{P\!}_{B2}\rangle$
and
$-\ell ^2\langle \mathcal{P\!}_{B2}\rangle$
and $\langle \mathcal{B}\rangle$
is very high across all scales.
$\langle \mathcal{B}\rangle$
is very high across all scales.
The integral formula defining the non-local contribution $\langle \mathcal{B}^{{nl}}\rangle$
makes this term very difficult to analyse and understand, including why this term also changes sign as
$\langle \mathcal{B}^{{nl}}\rangle$
makes this term very difficult to analyse and understand, including why this term also changes sign as $\ell$
is reduced. Nevertheless, the integral depends on the relative alignments of the filtered density and velocity gradients with respect to the vertical direction, much like the term
$\ell$
is reduced. Nevertheless, the integral depends on the relative alignments of the filtered density and velocity gradients with respect to the vertical direction, much like the term $\langle \mathcal{P\!}_{B2}\rangle$
. This suggests that the formation of ramp cliffs might also be connected with the reversal of
$\langle \mathcal{P\!}_{B2}\rangle$
. This suggests that the formation of ramp cliffs might also be connected with the reversal of $\langle \mathcal{B}^{\textit{nl}}\rangle$
, similar to the local flux. To further understand how the ramp–cliff structures correspond to the buoyancy flux reversals, we partition the flow based on the alignment of the filtered density gradient with respect to the vertical direction
$\langle \mathcal{B}^{\textit{nl}}\rangle$
, similar to the local flux. To further understand how the ramp–cliff structures correspond to the buoyancy flux reversals, we partition the flow based on the alignment of the filtered density gradient with respect to the vertical direction $\hat {\boldsymbol{e}}_{\tilde {B}} \boldsymbol{\cdot }\hat {\boldsymbol{e}}_z$
. The more frequent ‘ramps’ correspond to regions where the fluctuating density gradient misaligns with the mean density gradient
$\hat {\boldsymbol{e}}_{\tilde {B}} \boldsymbol{\cdot }\hat {\boldsymbol{e}}_z$
. The more frequent ‘ramps’ correspond to regions where the fluctuating density gradient misaligns with the mean density gradient $\hat {\boldsymbol{e}}_{\tilde {B}} \boldsymbol{\cdot } \hat {\boldsymbol{e}}_z \gt 0$
, whereas ‘cliffs’ correspond to
$\hat {\boldsymbol{e}}_{\tilde {B}} \boldsymbol{\cdot } \hat {\boldsymbol{e}}_z \gt 0$
, whereas ‘cliffs’ correspond to $\hat {\boldsymbol{e}}_{\tilde {B}} \boldsymbol{\cdot }\hat {\boldsymbol{e}}_z \lt 0$
. We observe that cliff events generate prominent forward buoyancy fluxes at all scales, converting TKE to TPE. At scales below the Ozmidov scale
$\hat {\boldsymbol{e}}_{\tilde {B}} \boldsymbol{\cdot }\hat {\boldsymbol{e}}_z \lt 0$
. We observe that cliff events generate prominent forward buoyancy fluxes at all scales, converting TKE to TPE. At scales below the Ozmidov scale $\ell \lt l_O$
, ramp events produce strong reverse buoyancy flux events, converting TPE to TKE, whereas for
$\ell \lt l_O$
, ramp events produce strong reverse buoyancy flux events, converting TPE to TKE, whereas for $\ell \gg l_O$
, ramp events produce a forward flux. It is also quite remarkable that except for scales
$\ell \gg l_O$
, ramp events produce a forward flux. It is also quite remarkable that except for scales $\ell \leqslant O(\eta )$
, the largest contributions to
$\ell \leqslant O(\eta )$
, the largest contributions to $\langle \mathcal{B}\rangle$
come from the extreme events where
$\langle \mathcal{B}\rangle$
come from the extreme events where $\hat {\boldsymbol{e}}_{\tilde {B}} \boldsymbol{\cdot } \hat {\boldsymbol{e}}_z \approx -1$
and
$\hat {\boldsymbol{e}}_{\tilde {B}} \boldsymbol{\cdot } \hat {\boldsymbol{e}}_z \approx -1$
and $\hat {\boldsymbol{e}}_{\tilde {B}} \boldsymbol{\cdot }\hat {\boldsymbol{e}}_z \approx +1$
, further emphasising the crucial role that ramp cliffs play in the buoyancy flux mechanism. The behaviour of the local and non-local part of the buoyancy flux conditioned on
$\hat {\boldsymbol{e}}_{\tilde {B}} \boldsymbol{\cdot }\hat {\boldsymbol{e}}_z \approx +1$
, further emphasising the crucial role that ramp cliffs play in the buoyancy flux mechanism. The behaviour of the local and non-local part of the buoyancy flux conditioned on $\hat {\boldsymbol{e}}_{\tilde {B}} \boldsymbol{\cdot } \hat {\boldsymbol{e}}_z$
is qualitatively very similar, and only their relative contribution to the total buoyancy flux changes with filter scale. This provides significant evidence that the ramp–cliff mechanism that is responsible for the behaviour of the local buoyancy flux is also fundamentally that which is responsible for the behaviour of
$\hat {\boldsymbol{e}}_{\tilde {B}} \boldsymbol{\cdot } \hat {\boldsymbol{e}}_z$
is qualitatively very similar, and only their relative contribution to the total buoyancy flux changes with filter scale. This provides significant evidence that the ramp–cliff mechanism that is responsible for the behaviour of the local buoyancy flux is also fundamentally that which is responsible for the behaviour of $\langle \mathcal{B}^{{nl}}\rangle$
and its reversal in sign as
$\langle \mathcal{B}^{{nl}}\rangle$
and its reversal in sign as $\ell$
is decreased.
$\ell$
is decreased.
These results provide new insights for closure modelling of $\mathcal{B}$
in large eddy simulations that should be explored in future work, as well as trying to understand better the properties of
$\mathcal{B}$
in large eddy simulations that should be explored in future work, as well as trying to understand better the properties of $\mathcal{B}^{{nl}}$
.
$\mathcal{B}^{{nl}}$
.
Acknowledgements
This research used resources of the Duke Compute Cluster at Duke University and the Oak Ridge Leadership Computing Facility at the Oak Ridge National Laboratory, which is supported by the Office of Science of the U.S. Department of Energy under Contract No. DE-AC05-00OR22725. Additional resources were provided through the U.S. Department of Defense High Performance Computing Modernization Program by the Army Engineer Research and Development Center and the Army Research Laboratory under Frontier Project FP-CFD-FY14-007.
Funding
S.B. and A.D.B. were supported by National Science Foundation (NSF) CAREER award no. 2042346.
Declaration of interests
The authors report no conflict of interest.
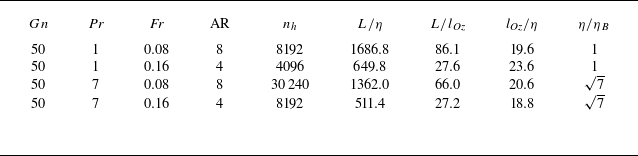


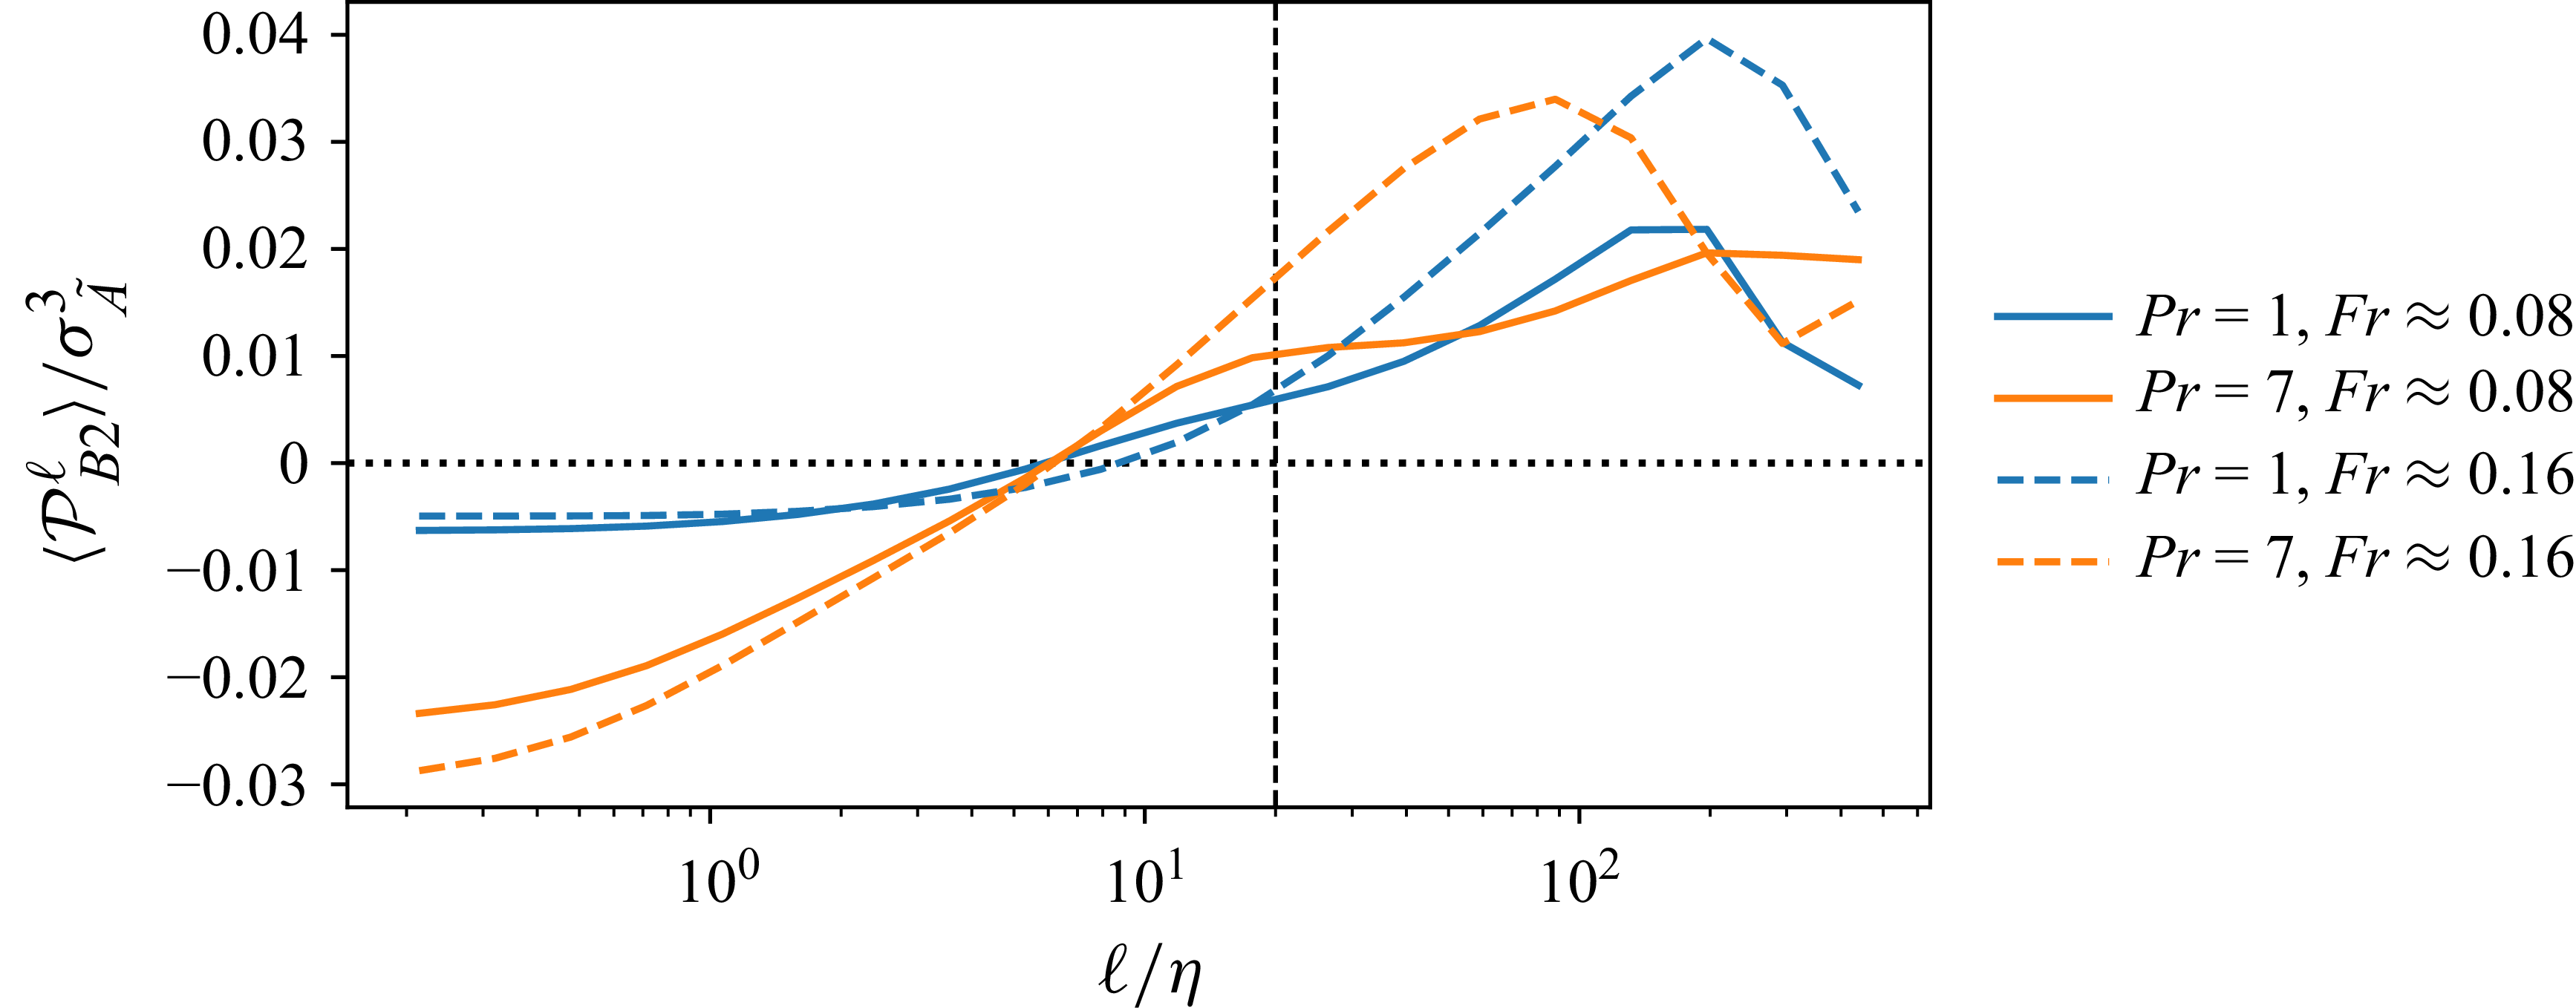


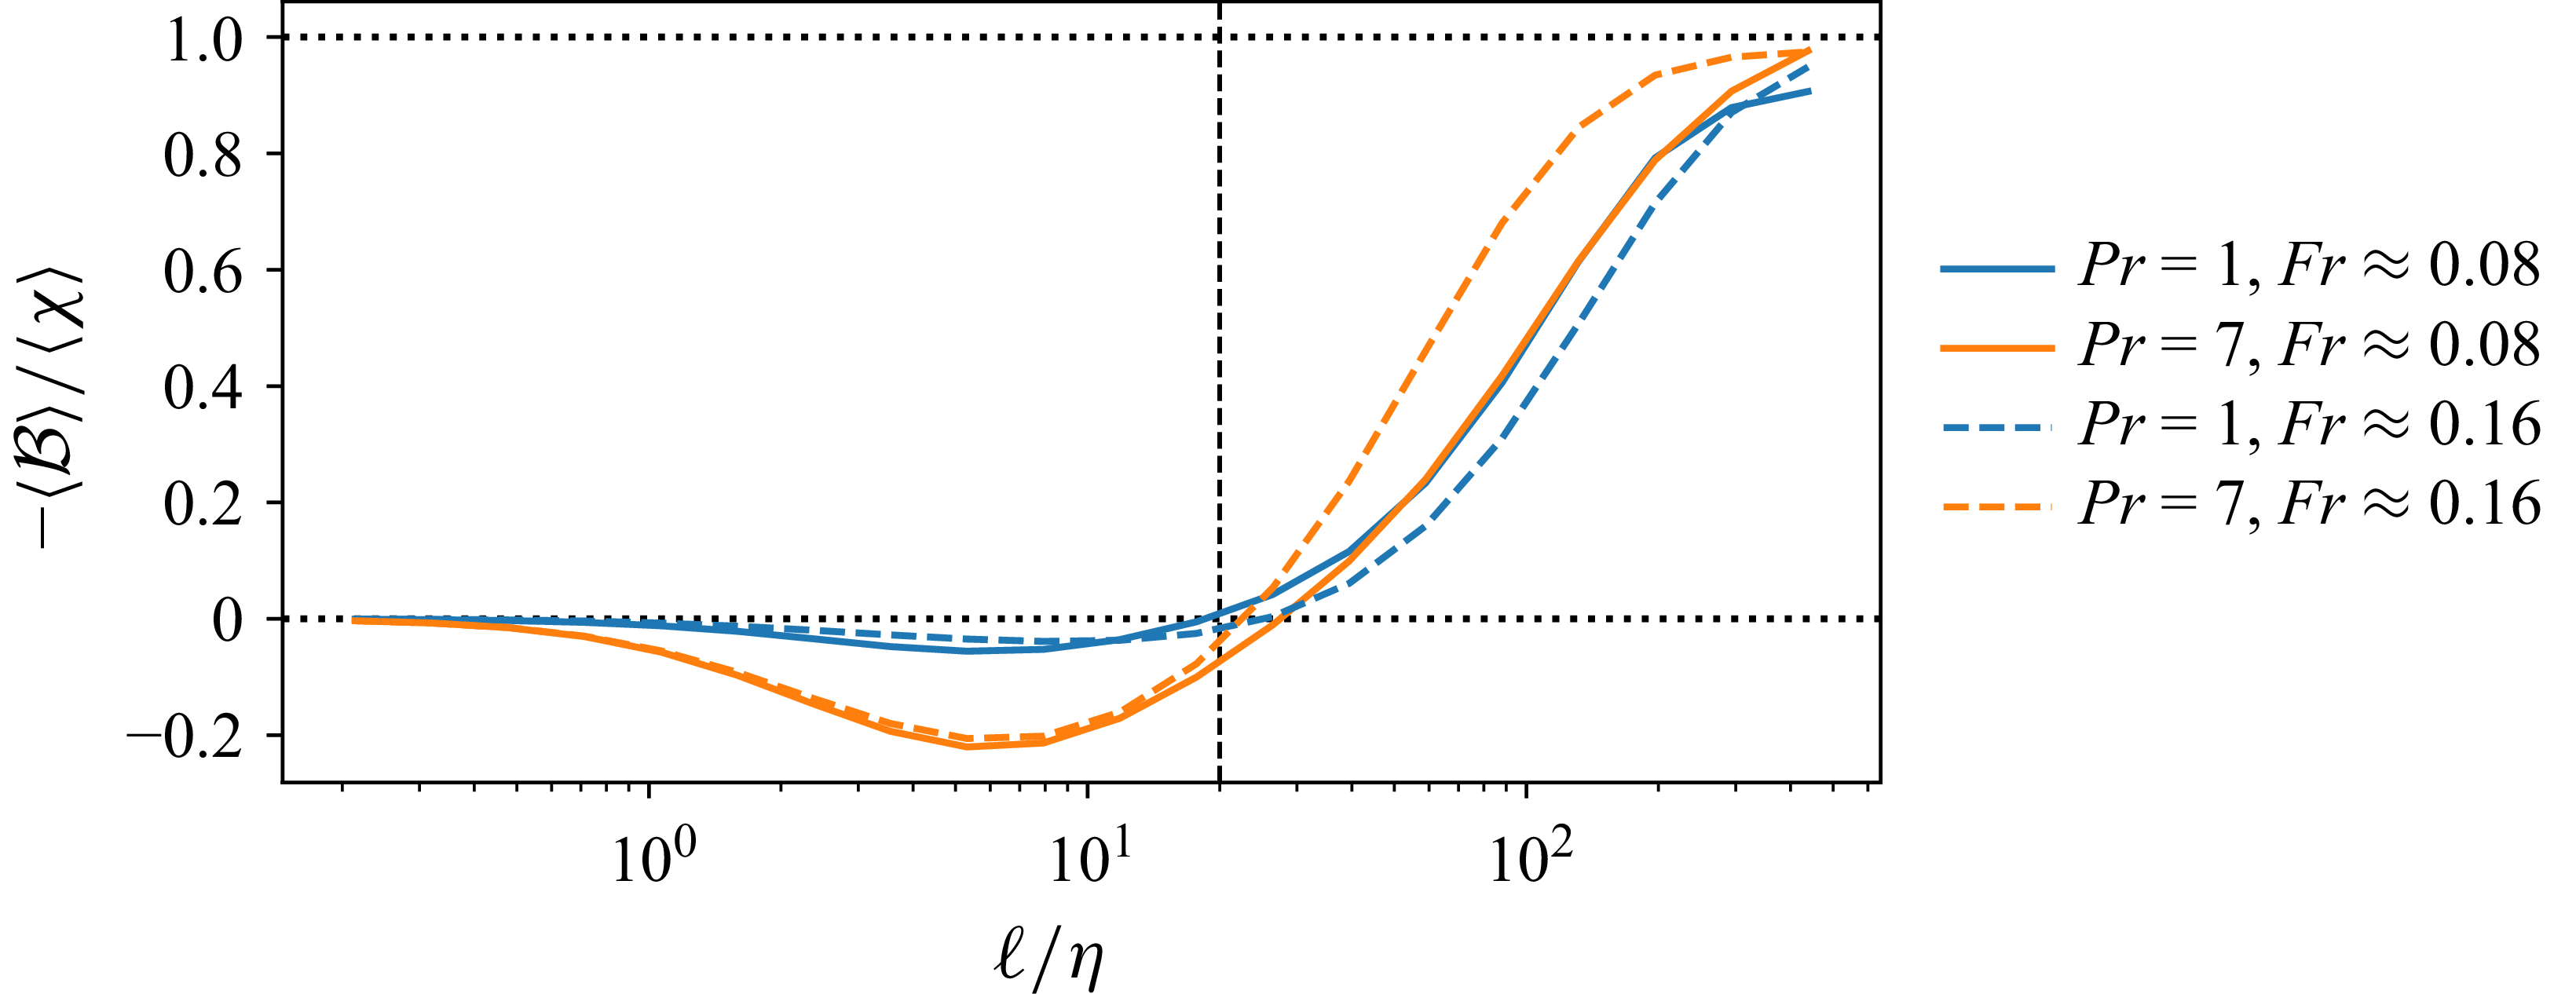


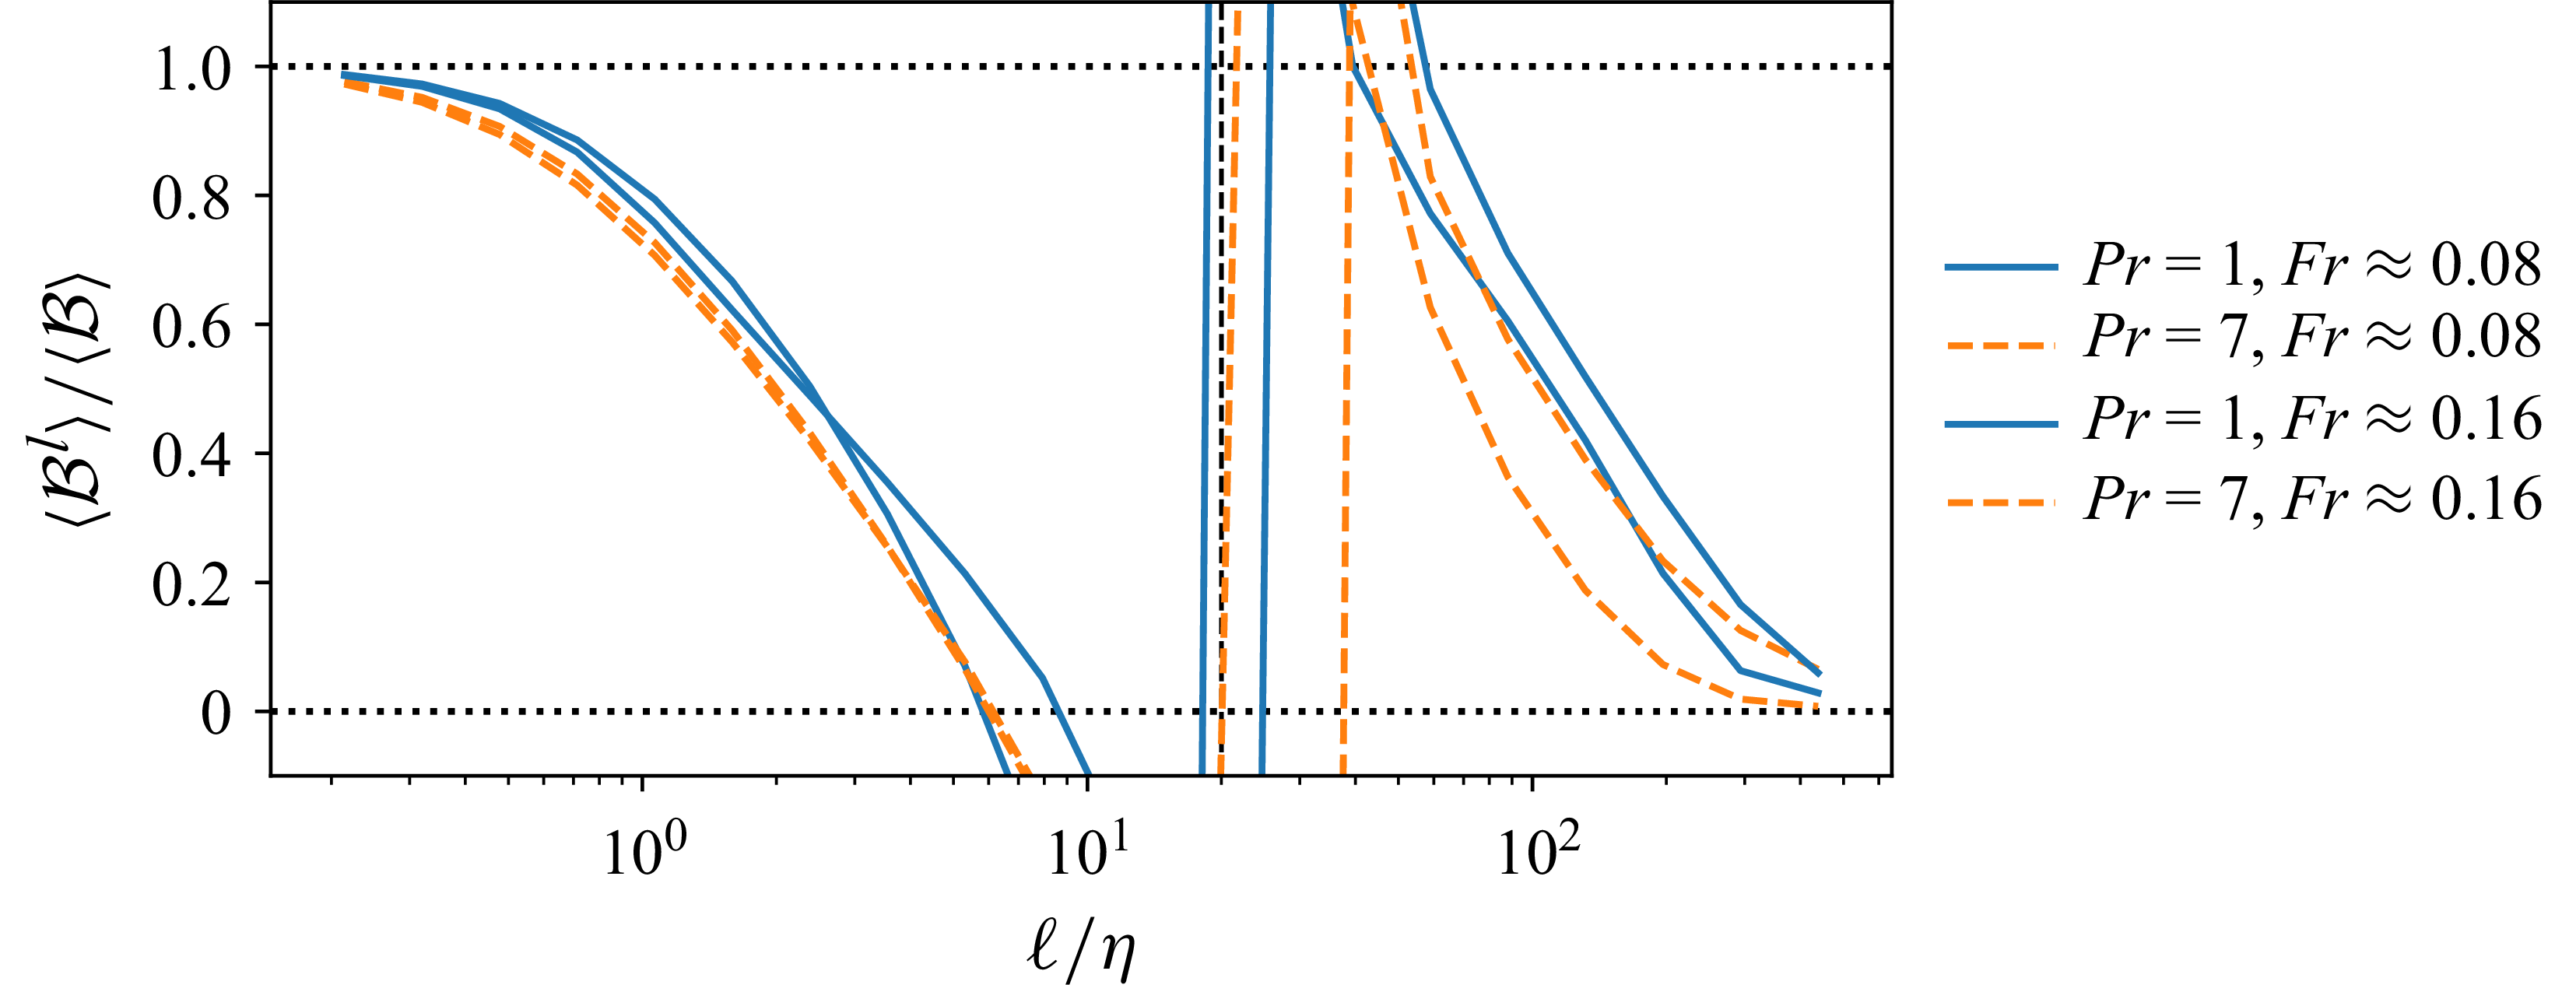


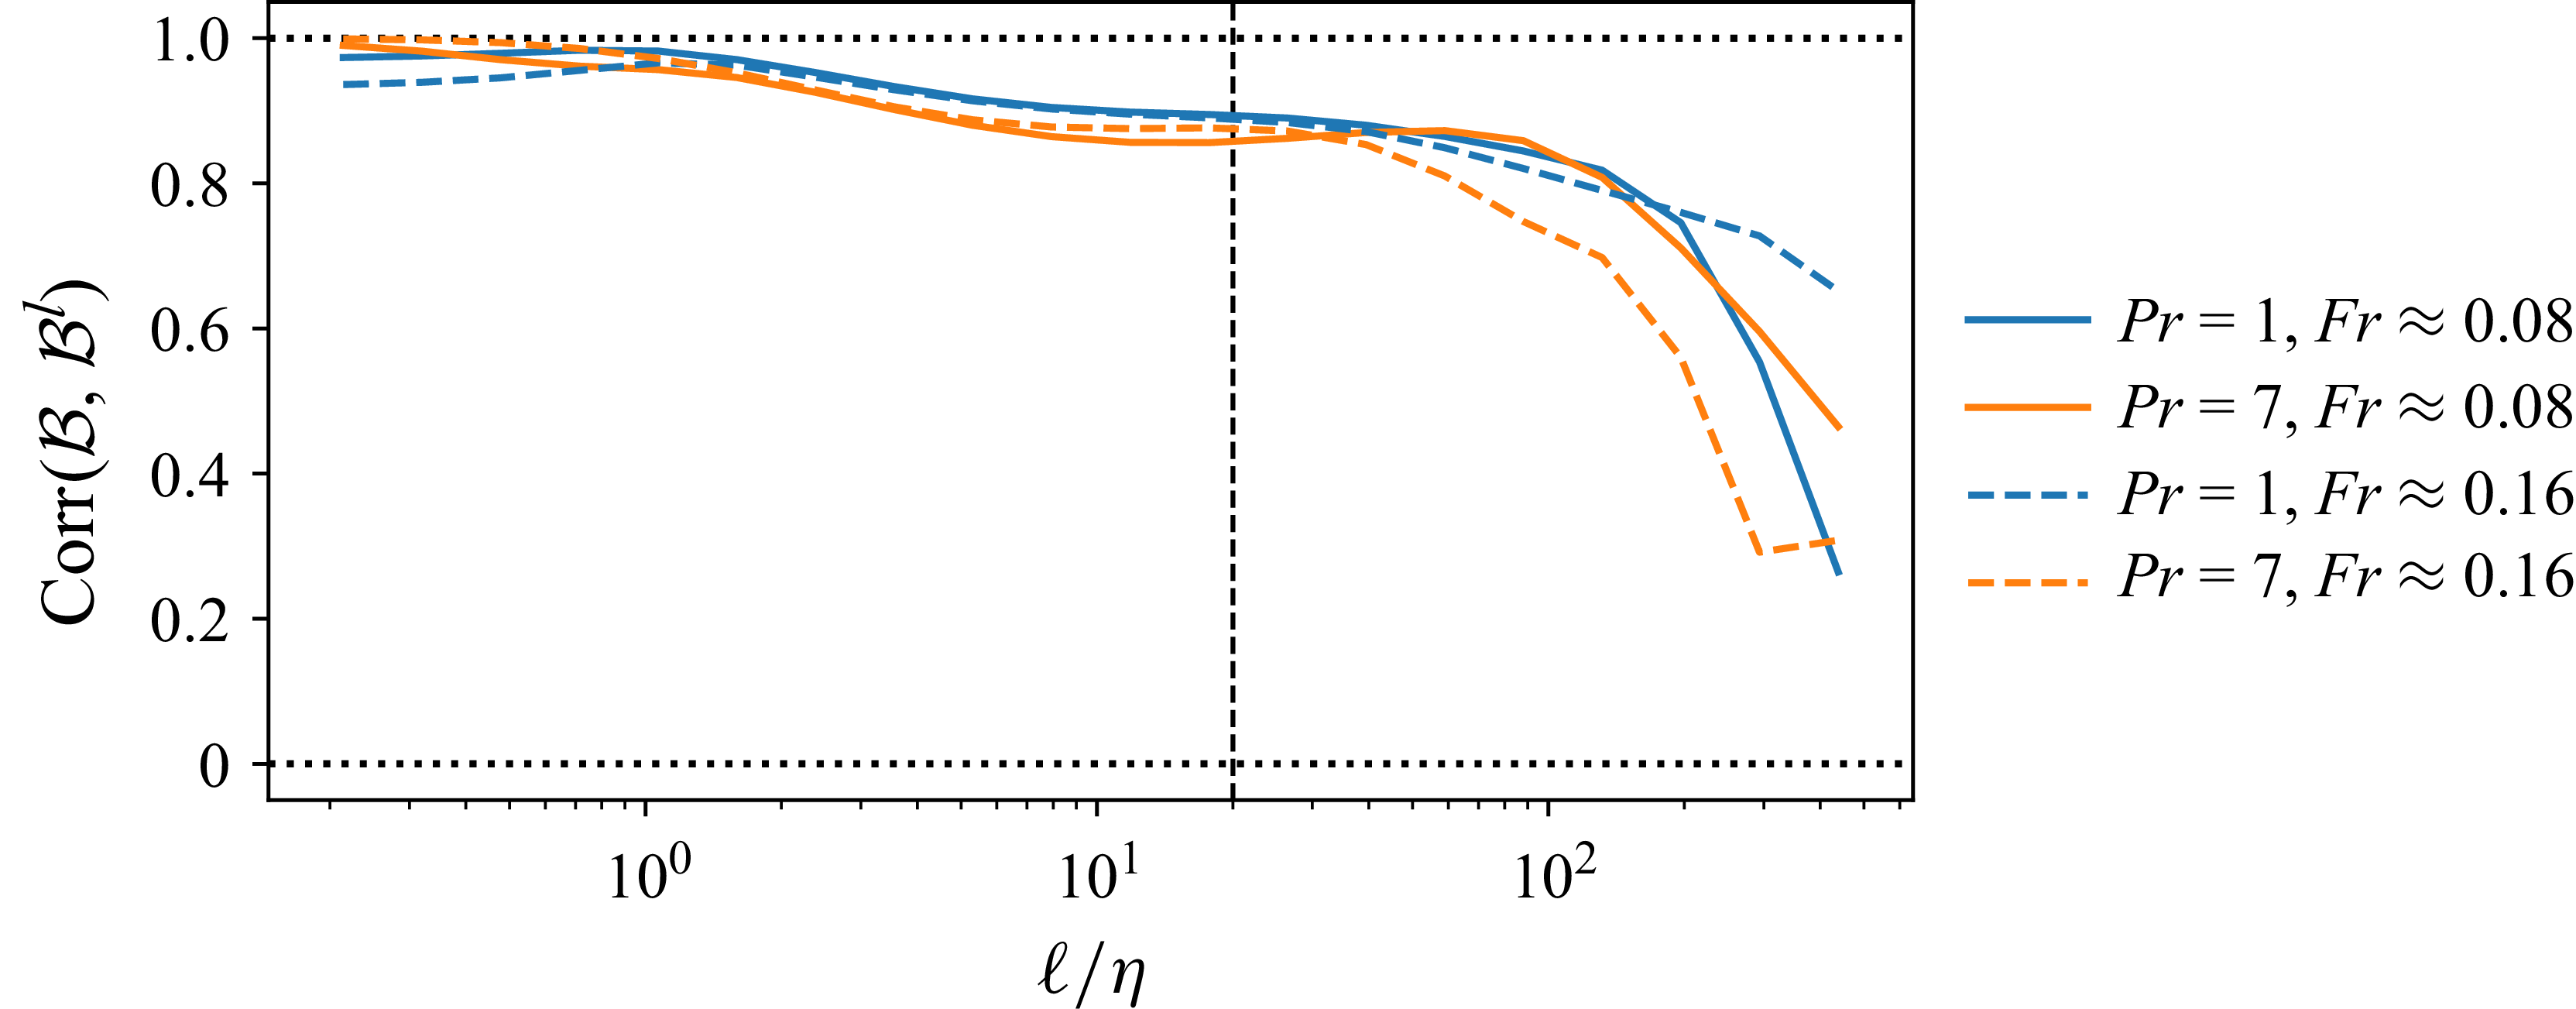


 Open access

