


INTRODUCTION
How to generate higher tax revenues in lower-income countries is a core puzzle in political science. Even in contexts experiencing rising economic growth, few citizens in many low-income countries pay any form of tax. Without more revenue, governments are unlikely to be able to expand the role of the state, or to escape the current wave of debt defaults (De la Cuesta et al. Reference De la Cuesta, Martin, Milner and Nielson2022; North and Weingast Reference North and Weingast1989; Stasavage Reference Stasavage2011; Tilly Reference Tilly1992; Weigel Reference Weigel2020).
Understanding taxation is especially critical as it has the potential to improve perceptions of the state and democracy, lower corruption, and increase citizen political engagement (Baskaran and Bigsten Reference Baskaran and Bigsten2013; Brollo et al. Reference Brollo, Nannicini, Perotti and Tabellini2013; De la Cuesta et al. Reference De la Cuesta, Martin, Milner and Nielson2022; Martin Reference Martin2023; Paler Reference Paler2013; Prichard Reference Prichard2015; Ross Reference Ross2004; Timmons Reference Timmons2005; Weigel Reference Weigel2020). Yet, despite recent advances, there are significant gaps in our understanding of taxation, especially in lower-income countries. One of the primary issues with existing evidence is that it focuses largely on interventions targeting individuals, either taxpayers or tax collectors. In contrast, most theories of taxation are actually about community-level processes that suggest the need for broader interventions, especially in states where existing levels of taxation are low. The difficulty of implementing community-level interventions has also limited the ability of prior work to examine the causal mechanisms underpinning the relationship between taxation and state capacity through mediating variables such as bureaucratic effort, citizen political engagement, perceptions of the state, and trust.
Theories of taxation suggest two reasons citizens may pay taxes. First, citizens may pay because enforcement makes tax compliance less costly, in expectation, than evasion (Allingham and Sandmo Reference Allingham and Sandmo1972). Second, citizens may pay “quasi-voluntarily” because they feel they are getting something in return, such as public goods or representation (Bates and Lien Reference Bates and Lien1985; Levi Reference Levi1989; North and Weingast Reference North and Weingast1989; Prichard Reference Prichard2015). These theories have led to two distinct approaches to increasing tax compliance through individual-level interventions. While there have been some successful initiatives to increase tax compliance via enforcement (often through letters or tax collector visits), attempts to increase quasi-voluntary tax compliance through a range of approaches have, on average, had little impact (see discussion below). This is especially troubling, as quasi-voluntary compliance is proposed to have significant downstream benefits for citizen-government relations.
Additionally, most experimental evidence to date comes from OECD countries, and even experiments run in lower-income countries focus on relatively weak interventions that aim to improve one mechanism or the other, but not both. It is not clear how well existing theories of tax compliance will travel to a developing country setting. For example, tax bargaining may only succeed if citizens trust the state to keep a bargain. Coercive approaches may likewise require beliefs that the state is sufficiently strong to enforce penalties for non-compliance (for taxpayers) or shirking (for tax collectors). Finally, there is no evidence regarding whether enforcement and bargaining are complementary tactics, or whether using both is actually less effective than one approach alone.
This article uses a field experiment conducted among 128 markets in Malawi to test the effectiveness of top-down (TD) enforcement and bottom-up (BU) bargaining approaches to increasing tax compliance in a lower-income and low state capacity setting. In Malawi, as in many sub-Saharan African countries, fees from open-air markets form one of the largest sources of “own-source” revenue for district (hereafter called “local”) governments (Fleck, Jangia, and Delbridge Reference Fleck, Jangia and Delbridge2023). However, low tax compliance levels limit governments’ ability to provide services, and potential taxpayers, in turn, are reluctant to pay taxes until services improve.
From a theoretical standpoint, such markets are an optimal setting for both tax compliance approaches. As market vendors are gathered in dense, observable locations, local governments should be able to efficiently monitor and enforce revenue collection. Market vendors also meet the preconditions for tax bargaining: they have high collective action potential, are in broad agreement on how tax revenue should be spent, and indicate high hypothetical willingness to pay taxes in return for benefits. The dense nature of markets also makes public goods provision funded by tax revenues both relatively inexpensive and easily observed by vendors.
Our experiment consists of two cross-cutting, market-level treatment bundles. The “BU” intervention bundle was designed to improve quasi-voluntary compliance at the community level. It facilitated communication between market vendors and local government, constructed public goods in markets, and increased government transparency. The infrastructure element makes this study one of the first to change actual levels of public services, rather than perceptions of these services. The “TD” enforcement bundle improved local governments’ ability to collect, track, and manage market revenue collection, focusing again on the market level, rather than individuals. It enhanced revenue tracking technology, improved local government information about taxpayers, and bolstered tax collectors’ incentives to meet revenue targets.
We find that the BU treatment significantly increased tax compliance among vendors by 40% (10 percentage points), though this effect is limited to one measure of tax compliance, the presentation of a paper receipt. It also led to significant increases in vendors’ trust in local government, satisfaction with services, and belief that paying tax is a duty. We also find downstream effects of the BU treatment on political engagement. Taxpayers were more likely to sign a petition for local government requesting more funding for market services and more likely to send text messages to local government demanding a reduction in the overreach of government power in collecting revenue in this district. The TD intervention had a less robust effect on compliance, although not significantly different from the effect of the BU treatment. The TD treatment had no effect on citizen trust and satisfaction, but did lead to higher tax collector effort and citizen perceptions of stronger tax enforcement.
Critically, treatment effects were limited to markets that received only one treatment arm. In markets that received both treatments, we find effects that are significantly smaller than we would predict if the cross-cutting group experienced an additive effect of the two individual treatments. We posit that increased enforcement due to the TD treatment “crowded out” an increase in quasi-voluntary compliance from the BU treatment, leading to a null effect on average. However, more work is needed to fully test this hypothesis.
This article makes several contributions to the literature on taxation. First, our results show that it is possible to increase tax compliance by jump-starting tax bargaining and shifting to a more positive taxation equilibrium. We also show that different approaches to improving compliance activate different mechanisms, with implications for broader effects on state capacity and citizen-state relations.
Second, this experiment is one of the first that examines tax compliance at the community level, rather than relying on easier to implement, but potentially less effective, individual-level interventions. This is critical because theories of tax compliance focus on community-level variables like public goods provision, overall tax enforcement, or beliefs about others’ compliance. Our community-level treatment bundles therefore allow us to test a key element of tax compliance theory that cannot be addressed via experiments that rely on interventions among individuals.
Our intervention is also stronger than many previous tax experiments: the bundled interventions are designed to fix multiple broken linkages at once. This allows us to provide evidence on the potential for government interventions to increase tax compliance in low-capacity states. It suggests, however, that weak or single-pronged approaches are unlikely to work, as even our extremely strong interventions had limited success.
THEORY
There are two dominant theories of why citizens pay taxes. This section discusses the theoretical framework for each, existing evidence, and how each might translate to individual- or community-level interventions. Each of the community-level experimental treatments in our study was designed to test how a particular theoretical approach to taxation affects compliance and potential downstream effects.
Increasing Compliance via TD Enforcement. Enforcement-based theories assume that rational taxpayers will comply when the costs of the tax are lower than the expected costs of noncompliance; these include the probability of detection and the penalty once caught (see, e.g., seminal work by Allingham and Sandmo Reference Allingham and Sandmo1972). This implies that tax compliance will increase with the costs of evasion. Two key ways to change the costs of noncompliance are to increase government information about taxpayers (thus decreasing the costs of monitoring) and to improve the incentives of tax collectors to work hard and enforce taxation. These TD enforcement approaches to tax compliance have the potential to increase compliance and revenue, but also to increase bureaucratic capacity and effort more broadly.
Field experiments on taxation consistently find that increasing the actual or perceived probability of detection and punishment does in fact improve tax compliance (Castro and Scartascini Reference Castro and Scartascini2015; Coleman Reference Coleman1996; Dwenger et al. Reference Dwenger, Kleven, Rasul and Rincke2016; Fellner, Sausgruber, and Traxler Reference Fellner, Sausgruber and Traxler2013; Kleven et al. Reference Kleven, Knudsen, Kreiner, Pedersen and Saez2011; Slemrod, Blumenthal, and Christian Reference Slemrod, Blumenthal and Christian2001). Critically, two recent studies find similar effects in Rwanda (Mascagni, Nell, and Monkam Reference Mascagni, Nell and Monkam2017) and Ethiopia (Mascagni, Mengistu, and Boldeyes Reference Mascagni, Mengistu and Boldeyes2018), suggesting that the empirical patterns hold outside of the OECD. All of these experiments target individuals, typically through sending letters to individual taxpayers: none target more aggregated groups of taxpayers. In an experiment in Pakistan randomizing groups of tax collectors to treatment, Khan, Khwaja, and Olken (Reference Khan, Khwaja and Olken2016) show that incentivizing tax collector effort can also improve tax compliance.
While some individual-level enforcement interventions have succeeded, there are reasons to expect community-level interventions to be more effective. Indeed, randomized trials that target individuals typically do so because it allows clean randomization of a large sample, not because individual approaches are seen as most effective writ large. Community-level interventions—including changing overall audit rates, improving government information about the tax rolls, or changing tax collector incentive structures—could be more effective than individual approaches for two reasons. First, individual approaches may change individual beliefs in the short-term, but without community-level changes, these effects are unlikely to persist. Second, work on the role of fairness in tax compliance implies that community-level “common knowledge” of enforcement may avoid pushback against targeted approaches perceived as unfair (Torgler Reference Torgler2007).
To the best of our knowledge, the primary prior attempt to test community-level changes in enforcement is Weigel and Kabue Ngindu (Reference Weigel and Ngindu2023), which finds that first-time visits from tax collectors, randomized at the neighborhood level, are effective. However, that article does not test alternative approaches to collection, and tests initial enforcement of a tax, rather than attempts to improve compliance for an existing tax.
Increasing Compliance via Quasi-Voluntary Approaches. An alternate approach to taxation is quasi-voluntary tax compliance. In many settings, citizens appear to pay taxes despite the low probability of punishment (Alm, Jackson, and McKee Reference Alm, Jackson and McKee1992; Andreoni, Erard, and Feinstein Reference Andreoni, Erard and Feinstein1998). This can occur if citizens have high “tax morale” and believe that it is their duty (Torgler Reference Torgler2007). It can also occur under a conditional compliance strategy, in which citizens comply provided they see their funds used on their preferred policies. This “fiscal exchange” can include formal tax bargains that include policy or institutional concessions (Bates and Lien Reference Bates and Lien1985; Levi Reference Levi1989; North and Weingast Reference North and Weingast1989), or simply a clear link between tax payments and public services (Fjeldstad and Therkildsen Reference Fjeldstad and Therkildsen2008).
The evidence on quasi-voluntary approaches is weaker than that on enforcement approaches. Observational studies show that tax compliance increases with tax morale, trust in government, satisfaction with public goods provision, and low levels of corruption (Alm, Martinez-Vazque, and Torgler Reference Alm, Martinez-Vazque and Torgler2006; Levi, Sacks, and Tyler Reference Levi, Sacks and Tyler2009; Picur and Riahi-Belkaoui Reference Picur and Riahi-Belkaoui2006). However, experimental efforts to improve quasi-voluntary compliance, including treatments that stress citizens’ civic duty to pay taxes or provide information about how revenues are spent, have failed (Castro and Scartascini Reference Castro and Scartascini2015; Coleman Reference Coleman1996; Hallsworth et al. Reference Hallsworth, List, Metcalfe and Vlaev2017; Mascagni, Mengistu, and Boldeyes Reference Mascagni, Mengistu and Boldeyes2018; McGraw and Scholz Reference McGraw and Scholz1991). Interventions that aim to increase citizens’ perceptions that others are paying taxes have only succeeded in contexts where existing levels of tax compliance are relatively high (see, e.g., Coleman Reference Coleman2007), and have null or negative effects when baseline compliance levels are low, as is the case in many developing country settings (Castro and Scartascini Reference Castro and Scartascini2015; Del Carpio Reference Del Carpio2013).
Critically, most of these experiments again rely on letters to taxpayers or other individual interventions; they do not actually intervene to change community-level beliefs or government behavior. Yet, the mechanisms underlying quasi-voluntary compliance imply community-level changes are necessary. Fiscal exchange requires that citizens receive benefits from public spending; in developing countries, this typically involves community-level public goods, rather than individual transfers. Both formal and informal tax bargains must inherently be community-level: a government cannot effectively strike a bargain with individual citizens, and citizens may only be able to demand a bargain if they can solve the collective action problem and work together. Even attributes that are typically measured at the individual level, like tax morale, often depend on beliefs about whether others are paying taxes, suggesting higher effects for public, group-level interventions.
Causal Mechanisms. Citizens may therefore pay taxes because they are compelled to or because they feel that paying taxes is in line with their values and interests. This suggests that both interventions that increase enforcement as well as interventions that facilitate tax bargaining should increase tax compliance. However, the two approaches differ in their causal mechanisms and potential downstream effects on citizen-state relations.
TD enforcement approaches require the state to invest in taxpayer monitoring, bureaucratic capacity, and information collection on taxpayers. This suggests two causal mechanisms: increased effort or decreased corruption among tax collectors. Corruption in this context could include stealing revenue or taking bribes to allow tax evasion. Given their focus on tax collectors, rather than taxpayers, community-level, TD approaches will have a limited impact on citizen-state relations. Indeed, if higher enforcement becomes coercion, TD approaches could damage how citizens view the state.
In contrast, BU approaches have the potential to more drastically reshape citizen-state relations, particularly when they target entire communities. If increased tax compliance is the result of higher public goods provision or better bargaining and communication, it could improve taxpayer satisfaction with government and public services. This in turn could increase trust in government, which is critical for the state’s ability to promote development and capacity more generally.
A further potential effect of BU approaches is greater political engagement. Such approaches, if they target communities, may improve taxpayers’ bargaining position or agency vis-à-vis the government, empowering them to address grievances or make demands on leaders. If BU approaches increase trust in government, they could also make citizens more likely to engage with the state directly on other topics. Strengthening taxpayers’ connection to the state may therefore have downstream effects for broader political outcomes.
An alternative to the above theorized mechanisms is that BU and TD approaches actually overlap in the mechanisms they activate. For example, if the revenue collected via stronger enforcement is spent on valued and visible public goods, it could also raise satisfaction with government or tax morale. If increased enforcement is seen as making tax collection more fair, we could see similar improvements. These complementarities, however, may take longer to become visible than the more direct intermediate effects.
RESEARCH CONTEXT
Malawi is a paradigmatic example of a low-capacity state. It is economically developing, with 66.7% of the population living with multi-dimensional poverty (UNDP 2016). Due to its low state capacity and low economic development, Malawi is among the most aid-dependent countries in the world, with aid representing over 37% of the government’s budget. Malawians, therefore, perceive government and donor development efforts to be intertwined (Seim, Jablonski, and Ahlbäck Reference Seim, Jablonski and Ahlbäck2020).
Local government capacity is especially limited, with significant de jure authority over development but de facto reliance on central government funding. Own-source revenue is critical for building the capacity of local government but makes up a small percentage of local budgets. One of the primary sources of local revenue is market fees (Fleck, Jangia, and Delbridge Reference Fleck, Jangia and Delbridge2023). Malawian markets are open-air collections of stalls, with vendors providing a wide range of goods and services. At baseline, markets in our sample had an average of approximately 700 vendors on their busiest day, though the range was 30–8,000 vendors. The five most common stall types sold dry fish, vegetables, fruit, hardware, or were convenience-store-style “tuck shops.” The average market was 34 years old and had varied services: 90% had market cleaners; 75% had a trash receptacle; 66% had a toilet; 41% had a water source; and 15% had night security.
Vendors are charged a fixed fee each day (typically MWK 100-200, US$ 0.14-0.27), and, in return, the local government is mandated to provide basic market services. Tax collectors (called “ticket sellers”) visit the market daily to collect fees and give out receipts.Footnote 1 Tax collectors then give revenue to the Market Manager, a more senior district employee who manages one or more markets. The Market Manager deposits the cash directly in the district bank account or brings it to the Revenue Collector, a more senior district-level tax official. A market-specific, democratically elected governing body of vendors, called the “market committee,” advocates on behalf of the market to the district, compiles market development priorities, and mediates market conflicts.
At baseline, only 27% of market vendors were able to produce a recent tax receipt. In pre-treatment interviews and focus group discussions, vendors and government officials reported two barriers to higher tax compliance. First, vendors are unwilling to pay voluntarily because they are dissatisfied with market services, believe that tax revenues are co-opted by local government officials, and feel excluded from tax collection processes.Footnote 2 Second, low local government capacity hampers tax collection. Information regarding the tax base is limited: before the interventions associated with our study, some local governments lacked even a list of taxed markets in the district, and most had no data on market sizes. This was compounded by a fee collection process vulnerable to corruption and poorly paid tax collectors: at baseline, tax collectors were paid $0.80–$1.35 a day, low even in local terms. Significantly, vendors consistently acknowledged that the fee amount is not a barrier to compliance.
RESEARCH DESIGN
Our field experiment was one component of a larger, five-year international development program (see Section A of the Supplementary Material for a description). All hypotheses, measures, and analysis were pre-registered with OSF.Footnote 3 All stages of the project received IRB approval; Section Q of the Supplementary Material includes our ethics statement. The experiment was conducted in the program’s eight target districts: Balaka, Blantyre, Kasungu, Lilongwe, Machinga, Mulanje, M’mbelwa, and Zomba. We selected a sample of 128 markets from a list of 209 total markets in the districts, prioritizing markets with at least 100 vendors. To facilitate block randomization, the number of sampled markets in each district was divisible by four.
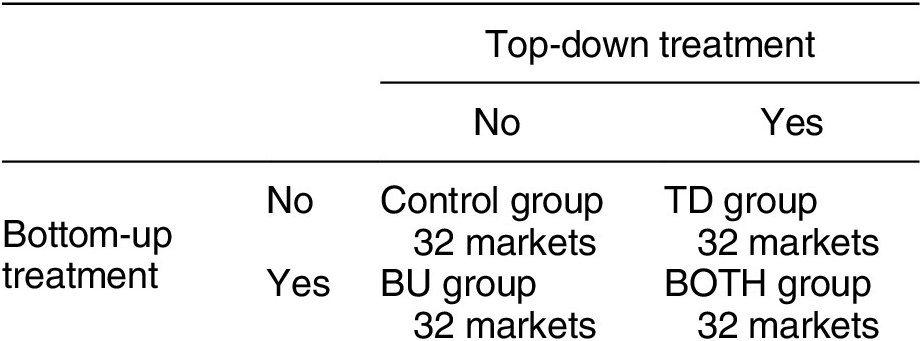
Our field experiment randomized two cross-cutting treatment arms at the market level. To ensure pre-treatment balance on our main outcome of tax compliance, randomization was stratified on district and on baseline tax compliance. The “BU” treatment was designed to increase vendors’ willingness to pay taxes, while the “TD” treatment was designed to improve local government capacity to collect taxes. Each treatment had four components, outlined in the next sub-section. Table 1 shows the resulting four groups of markets.
Table 1. Experimental Design

Experimental Treatments
The experimental treatments were rolled out over a single year. All components that occurred concurrently as part of the broader program were designed to avoid confounding our analysis. As explained below, each treatment arm was targeted at the market level and bundled several components together. This followed pre-experiment fieldwork suggesting that low compliance was due to multiple related issues that no single-pronged intervention could properly address. Appendices A and B report additional implementation details.
BU Treatment Bundle
Background research identified three key reasons for low compliance: vendors felt that they receive few services in return for taxes paid; they did not trust local government or view it as accountable to vendors; and they felt excluded from tax collection systems. This closely matches theories of tax bargaining and fiscal exchange: vendors repeatedly stressed that they were willing to pay taxes if government addressed their concerns. To address these barriers and increase willingness to pay market taxes voluntarily, all “BU” markets received the four-part intervention described below. Our pilot research suggested that each component was unlikely to have a large impact on its own: the intervention needed to identify problems through the meetings, provide a costly signal of government commitment through the infrastructure grants, improve transparency to sustain any positive changes, and empower vendors to monitor and sanction local government officials for how they use market revenues. Note that these are all community-level processes, in which government needs to work with an entire market at once, rather than address individual vendors’ concerns.
Step 1: Facilitate Market Committee Elections and Training. To facilitate communication between markets and local government, and improve the collective action potential of vendors, market vendor committee elections were held in all markets without a valid market committee (54 markets total). All committees, including pre-existing ones, then received a training on committee organization, roles, and responsibilities.
Step 2: Facilitate Meetings Between Vendors, Market Committees, and Local Government. Next, local governments held public meetings in each market to address vendors’ sense of exclusion from the tax system: this was designed to allow tax bargaining between each market and the local government. In addition to vendors and market committees, meetings included political and bureaucratic local government representatives, market staff, and group village headmen. The meetings discussed the connection between taxes and market development, perceived problems with the current market tax system, and market services and priorities. Local government officials also introduced the final two components of the treatment: the infrastructure projects (Step 3), and the SMS system (Step 4). Vendors then chose a preferred market infrastructure project. 46 markets chose a borehole—the others chose a mix of market sheds, water access, electricity, pathways, concrete slabs, and refuse bins.
Step 3: Jump Start Service Delivery in Markets. To escape the low services / low compliance equilibrium, all treatment markets received an infrastructure project costing approximately US $5,000, selected based on the priorities generated in Step 2. Each project was bookended by opening and handover ceremonies, attended by government officials and vendors. The public nature of the project selection, construction, and handover were designed to stress the community-level nature of the intervention and the involvement of local government officials.
Step 4: Increase Transparency in Taxation via an SMS System. To facilitate ongoing communication and transparency, a two-way vendor-government SMS system was introduced during the Step 2 meetings. 73% of meeting attendees signed up for the system. Each month, vendors who opted in received a message with information on the previous month’s market revenue and how the money was allocated. Vendors could also use the SMS system to report complaints and grievances about local government service delivery; these were passed on to designated local government officials who could send a follow-up message back to the vendor.
TD Treatment Bundle
Background research identified three key limitations of government tax collection capacity: inefficient collection systems, lack of knowledge of the tax base, and lack of tax collector incentives. These barriers relate closely to TD theories of tax compliance, and suggest the need for market-level interventions to increase information and change incentives. The second, TD treatment arm therefore included four components designed to improve local governments’ tax capacity and improve the incentives of tax collectors and market managers to collect taxes efficiently and honestly.
Step 1: Roll Out Mobile Money Revenue Transfer System. At baseline, market managers collated money from the tax collectors then physically took the cash to the local government a few times a month. To improve revenue tracking and reduce opportunities for leakage, treatment markets converted to a system in which market managers still collected cash from the fee collectors, but then deposited revenues daily into the local government bank account via a mobile money agent.
Step 2: Provide Accurate and Reliable Market Vendor Counts. At baseline, local governments had almost no information about the revenue potential of each market, which is primarily a function of market size. To address this, trained vendor counters visited each treatment market four times a month during the intervention period and reported the numbers to local government.
Step 3: Generate Market Revenue Targets. The vendor counts from Step 2 were fed into a revenue target calculator to create monthly targets for each market based on seasonality and the previous month’s revenues. These targets were communicated to market managers and tax collectors. For tax collectors, this provides a check against corruption and serves as an incentive for better performance.
Step 4: Introduce Incentives for Tax Collectors. Finally, treatment markets received a tax collector incentive system using the Step 3 revenue targets. If a market met its monthly revenue target, local government presented the market with valuable goods, typically wheelbarrows and bicycles, that facilitated market management. This component originally included individual incentives for each tax collector; these were eliminated after the first month due to resistance from local government officials to cash incentives. This likely weakened the TD treatment.
Implementation Details
This experiment was conducted as one component of the Local Government Accountability and Performance (LGAP) activity, a program from the United States Agency for International Development (USAID) in Malawi. LGAP positioned itself as “helping to give [councillors] the skills they need to fully represent the people of Malawi.” LGAP positioned the specific market revenue interventions as part of the “mandate of district councils” to develop the districts and obtain financing to do so.Footnote 4
The interventions were coordinated by LGAP’s implementing partner, with all written materials, meetings, interactions, and products (e.g., the infrastructure projects) co-branded by USAID, the Republic of Malawi Ministry of Local Government and Rural Development, and UKAid. These materials listed contacts from both the District Council and the LGAP office.Footnote 5 This kind of co-management and joint credit claiming between donors and government is common in Malawi and other contexts where donor funding is critical in public goods and services provision (Baldwin and Winters Reference Baldwin and Winters2023; Cruz and Schneider Reference Cruz and Schneider2017; Swedlund Reference Swedlund2017).
The treatments are described in their idealized form above. Despite extensive prior buy-in from all stakeholders, some markets saw significant deviations from the originally-planned interventions, likely weakening them. First, both the project as a whole and specific components were delayed several times. This ultimately reduced the intervention period from 12 to 6–8 months. While this is still long compared to many interventions, it does limit our ability to test long-run effects. In the BU treatment, construction delays meant that endline data collection for three markets occurred before any construction had taken place, and only 19 markets were visited after all construction was completed.
Other specific intervention issues have the potential to weaken the interventions. Due to budget constraints, about half of BU markets received their second-choice rather than first-choice infrastructure project.Footnote 6 In 14 markets that chose boreholes, no water was found after drilling, despite prior positive hydrologist reports. These markets received alternative projects, typically wheelbarrows, cleaning supplies, and/or mobile refuse bins. In one district, a dispute with the district’s bank led to a temporary halt to the TD mobile money program for two months during the intervention period. Finally, in the TD group, tax collector incentives for achieving revenue collection targets were sometimes delivered late. Despite these individual issues, we stress that in most markets the interventions were carried out as planned.
Hypotheses
Following our Theory section, our main hypotheses are that:
H1: Each treatment will increase the percentage of taxpayers who pay their fees.
H2: Each treatment will increase the revenue per market that the local government receives.Footnote 7
We expected the cross-cutting BOTH treatment to be more effective than either approach alone, theorizing that better enforcement would reinforce quasi-voluntary compliance. This expectation was grounded on claims that using audits and penalties to compel those who don’t pay voluntarily can bolster tax morale among those who do (Coleman Reference Coleman2007).
H3: The two treatment arms will have the largest effect in combination.
We also pre-specified hypotheses regarding causal mechanisms and downstream effects.Footnote 8 Given its focus on community-level tax bargaining, collective action, and service provision, we expected the BU treatment to have the following mechanism effects:
H4: Increase taxpayers’ trust in local government.
H5: Increase taxpayers’ satisfaction with the local government.
H6: Increase taxpayers’ satisfaction with the level of market services.
H7: Increase taxpayers’ tax morale.
We also expected the BU treatment to empower vendors politically, especially by improving collective action capacity at the market level. As such, we hypothesized that in BU markets:
H8: Vendors will become more politically engaged.
The TD treatment required the state to invest in more monitoring and bureaucratic capacity. Because entire market communities were treated, we expected general perceptions of enforcement to change, in addition to individual experiences. We therefore expected the TD treatment to have the following mechanism effects:
H9: Increase tax enforcement.
H10: Decrease corruption.
H11: Increase tax collector effort.
A priori, we did not expect the TD treatment bundle to have effects on the mechanisms specified in H4–H7. However, theoretically we could still see effects if better revenue enforcement leads to improved services, improving perceptions of government quality and leading to higher willingness to pay.
EMPIRICAL STRATEGY
Data and Measures
To measure outcomes, we collected survey data from market vendors and tax collectors.Footnote 9 In each market, we surveyed 100 vendors at baseline and endline. Vendors were chosen via a modified random walk (see Section C.1.1 of the Supplementary Material), and different individuals were sampled at baseline and endline. Of the 100 vendors, 80 received a 15-minute survey measuring demographics and tax compliance, which improves measurement precision for our primary outcomes. A randomly-chosen 20 vendors received a longer, 1-hour survey that included additional mechanism and treatment compliance questions. Markets were visited on their main market day when the largest number of vendors were present. Vendors received a small airtime voucher for completing the survey. The total sample size was 12,389 at baseline and 12,370 at endline.
Enumerators also surveyed each market’s tax collectors, covering job details, perceptions of vendor compliance and relations, and knowledge of intervention components. On average 2–3 tax collectors were interviewed in each market. The total sample size was 302 at baseline and 264 at endline.
We describe our main measures in the following sub-section and report additional measurement details in Section C.3 of the Supplementary Material. Our PAP also specified that we would analyze monthly tax revenue information for each market in our sample. However, these data, provided by local governments with low capacity, proved to be of poor quality. We include this analysis, along with a discussion of revenue data quality, in Section E of the Supplementary Material.
Empirical Models
The main independent variables are indicators for whether a market was assigned to the BU, TD, or BOTH treatment group.Footnote 10 As discussed above, treatment implementation was inconsistent across markets. Therefore, the coefficient estimates for all the treatment indicators are intent-to-treat (ITT) effects. Section J of the Supplementary Material reports estimates of treatment effects on compliers, which are broadly consistent with the ITT effect estimates reported below.
Individual-level regressions use endline survey data and take the following form:
 $$ \begin{array}{l}{Y}_{ijkl}={\beta}_0+{\beta}_1*B{U}_j+{\beta}_2*T{D}_j+{\beta}_3*BOT{H}_j\\ {}\hskip3em +{\beta}_k*ENU{M}_k+{\beta}_l*Bloc{k}_l+{\epsilon}_{ijkl},& & \end{array} $$
where $ {Y}_{ijkl} $
represents an outcome measure for vendor i in market j in block l, interviewed by enumerator k, measured at endline.
$ {Y}_{ijkl} $
represents an outcome measure for vendor i in market j in block l, interviewed by enumerator k, measured at endline. $ T{D}_j $
,
$ T{D}_j $
, $ B{U}_j $
, and
$ B{U}_j $
, and $ BOT{H}_j $
are indicators that are one if market j was in that treatment group and 0 if not. We include enumerator fixed effects (
$ BOT{H}_j $
are indicators that are one if market j was in that treatment group and 0 if not. We include enumerator fixed effects ( $ ENU{M}_k) $
because enumerator skill and general behavior can impact respondents’ answers. We include block fixed effects (
$ ENU{M}_k) $
because enumerator skill and general behavior can impact respondents’ answers. We include block fixed effects ( $ Bloc{k}_l $
) to control for unobservable differences between the blocks. Because treatment was assigned at the market level, we cluster standard errors at that level. When presenting results, we refer to this specification as individual-level difference-in-means (“Individual DIM”).
$ Bloc{k}_l $
) to control for unobservable differences between the blocks. Because treatment was assigned at the market level, we cluster standard errors at that level. When presenting results, we refer to this specification as individual-level difference-in-means (“Individual DIM”).
In addition to the individual-level analysis, we perform market-level analyses for the main tax compliance outcomes.Footnote 11 Specifically, we estimate a difference-in-differences (DID) model of the following form:
 $$ \begin{array}{lll}{Y}_{jl}={\beta}_0+{\beta}_1*B{U}_j+{\beta}_2*T{D}_j+{\beta}_3*BOT{H}_j+{\beta}_l*Bloc{k}_l+{\epsilon}_{jl},& & \end{array} $$
where $ {Y}_{jl} $
is the difference in the average outcome between endline and baseline for market j in block l, i.e.,
$ {Y}_{jl} $
is the difference in the average outcome between endline and baseline for market j in block l, i.e., $ {Y}_{jl}={Y}_{jl(Endline)}-{Y}_{jl(Baseline)} $
. This is equivalent to the typical one-time period DID estimator but is more easily interpretable. As in the individual-level difference-in-means,
$ {Y}_{jl}={Y}_{jl(Endline)}-{Y}_{jl(Baseline)} $
. This is equivalent to the typical one-time period DID estimator but is more easily interpretable. As in the individual-level difference-in-means, $ B{U}_j $
,
$ B{U}_j $
, $ T{D}_j $
, and
$ T{D}_j $
, and $ BOT{H}_j $
are indicators that are 1 if market j was in that treatment group and 0 otherwise. Once again, we include block fixed effects. In this model,
$ BOT{H}_j $
are indicators that are 1 if market j was in that treatment group and 0 otherwise. Once again, we include block fixed effects. In this model, $ {\beta}_1 $
,
$ {\beta}_1 $
, $ {\beta}_2 $
, and
$ {\beta}_2 $
, and $ {\beta}_3 $
represent changes in the changes from Baseline to Endline in the BU, TD, and BOTH groups compared to the control group.Footnote
12
$ {\beta}_3 $
represent changes in the changes from Baseline to Endline in the BU, TD, and BOTH groups compared to the control group.Footnote
12
RESULTS
Treatment Effects on Tax Compliance
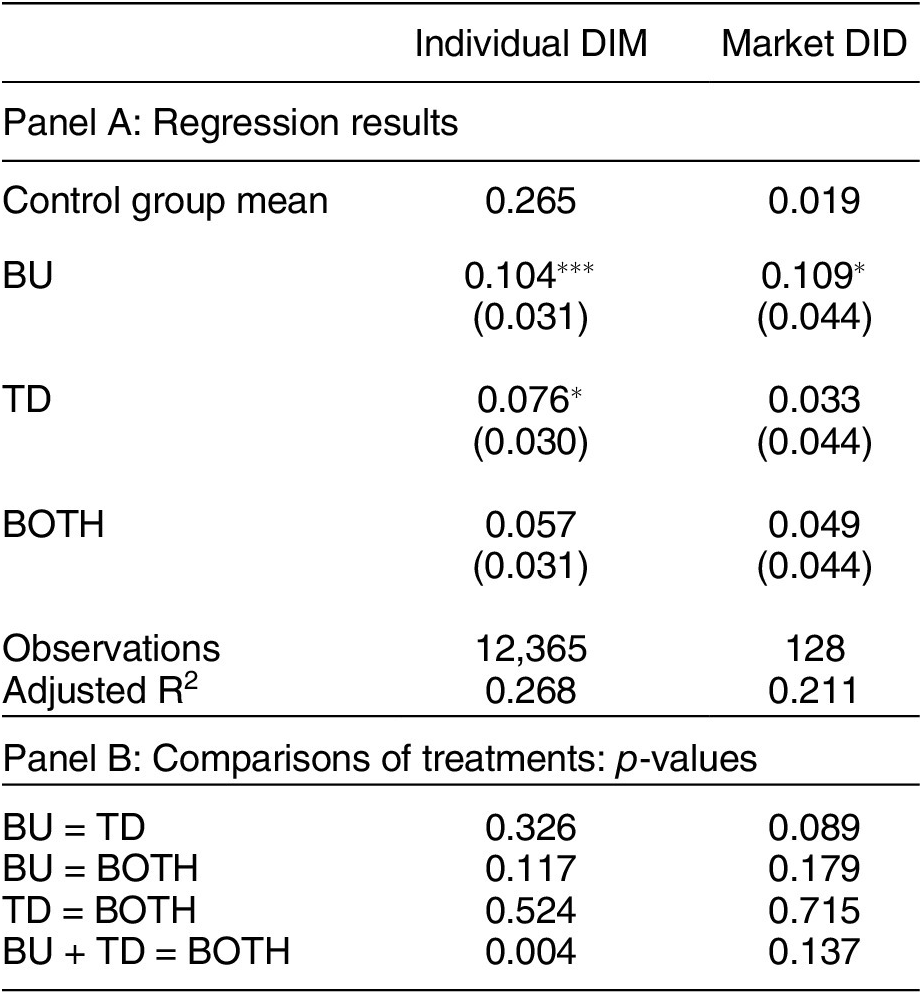
Our primary measure of tax compliance is whether the vendor can produce a tax receipt from within the past 7 days. We pre-specified this as our main measure because it is verifiable and less subject to bias than self-reported measures. Panel A of Table 2 reports individual-level DIM and market-level DID estimations assessing whether each treatment increased the likelihood that vendors paid their fees (H1). Panel B of Table 2 reports the p-values for tests comparing effects across treatment groups.
Table 2. Treatment Effects on Ability to Produce a Receipt

Note: All models estimated using ordinary least squares. Individual-level DIM model includes enumerator and block FE, market-level clustered SE. Market-level DID model includes block FE. *p<0.05; **p<0.01; ***p<0.001.
Supporting H1, the DIM estimates indicate both the BU and the TD treatments increase vendors’ ability to produce a receipt. Compared to control group vendors, BU (TD) vendors were 10.1 (7.4) percentage points more likely to be able to provide a recent receipt: these differences are statistically significant. Although the estimated effect of the BU treatment is slightly larger, the two effects are not statistically distinguishable.
In the DID model, the only statistically significant effect is the BU one, where the point estimate is very similar to the individual-level DIM model (10.4 versus 10.9 percentage points). For the TD treatment, the market-level DID effect estimate is about half the size of the estimated effect in the individual-level DIM. These results indicate that the distribution of treatment effects across vendors and markets followed a pattern such that the estimated effect remained unaffected by market-level averaging in the BU condition, but not in the TD condition.Footnote 13 Heterogeneity analysis (below) examines these results further.
The BU treatment has a consistent, statistically significant effect on compliance across all specifications, including the robustness checks discussed below. The TD treatment effect is much less robust. However, hypothesis tests cannot reject the null that the the BU and TD treatments have the same effect (see Panel B of Table 2).
Finally, the BOTH treatment shows a non-significant treatment effect of 5.7 (4.9) percentage points in the DIM (DID) analysis. This is not significantly different from the TD or BU treatment effects (see Panel B of Table 2). However, H3 predicted that there would be a positive interaction between the TD and BU treatments. This does not appear to be the case: in Table N5 in the Supplementary Material, the interaction analysis finds a significant negative interaction effect on compliance for the two treatments, suggesting that the experience of receiving both treatment arms is not equivalent to the additive effect of the TD and BU treatment separately. In addition, a Wald test of the constraint BU + TD = BOTH in the DIM model has a p-value of 0.004 (we fail to reject the null of complementarity for the DID model; p = 0.137).Footnote 14
Table N1 in the Supplementary Material reports the analysis of two alternative measures of compliance: self-reported compliance and perceptions of other vendors’ compliance. We find little evidence that the treatments had an effect on these measures. As these measures suffer from social desirability bias, we put more weight on the verified receipt measure. Importantly, the receipt measure is also likely a conservative one, as it requires vendors to obtain and retain receipts. Indeed, while mean compliance according to the self-reported measure was 78.9%, it was a much lower 32.6% according to the receipt measure.
One potential concern with the receipt measure is that it could reflect improvements in vendors’ ability to obtain a receipt, rather than higher compliance. To examine this, we use an endline survey question measuring whether respondents report receiving a receipt the most recent time they paid the fee. Here, we see no significant treatment effects for the BU and TD groups, and a small (2 percentage point) increase in the BOTH group. This suggests that our compliance results are not driven by receipt production.Footnote 15
Another concern is that the treatment induced vendors to keep receipts for longer; this is especially pertinent as we coded compliance as any receipt less than a week old. However, Table N8 in the Supplementary Material shows that there are no significant differences across treatments in the age of receipts among the vendors who were able to show a receipt, nor are there significant differences in how long vendors report they generally keep receipts. These findings alleviate this concern.
The analysis suggests an increase in tax compliance in the BU and TD groups, although the evidence of impact is stronger for the BU treatment. Interestingly, we find no evidence of treatment complementarity in the BOTH group. We discuss some potential explanations for this unexpected result in the Conclusion.
BU Treatment Causal Mechanisms
We expected each treatment to work through the causal mechanisms presented in our Hypotheses section. We expected the BU treatment to increase vendors’ trust in and satisfaction with local government (H4 and H5), satisfaction with services (H6), and tax morale (H7). As pre-specified, we estimate individual-level DIM models using data from the market vendor survey to test these hypotheses.
To measure trust, we used two questions which asked respondents how trustworthy they considered their local government and ward councilor (their local elected representative) to be. We measured satisfaction with local government using three questions measuring perceptions of how well the local government managed public funds, how transparently it spent said funds, and how transparent the tax collection process was. We examined two measures of satisfaction: average satisfaction across five common market services, and satisfaction with access to water specifically (as many markets received boreholes as part of the BU treatment). We also analyzed vendors’ perceptions of the relative amount of funds (out of 1,000 Malawi kwacha) the local government was spending on services. Finally, to measure tax morale, we used two questions. The first asked respondents to provide their level of agreement with the statement “Paying taxes is a duty of all citizens, even when you do not approve of how elected officials spend money.” The second asked respondents whether they thought that vendors should pay taxes even if they disagree with local government.
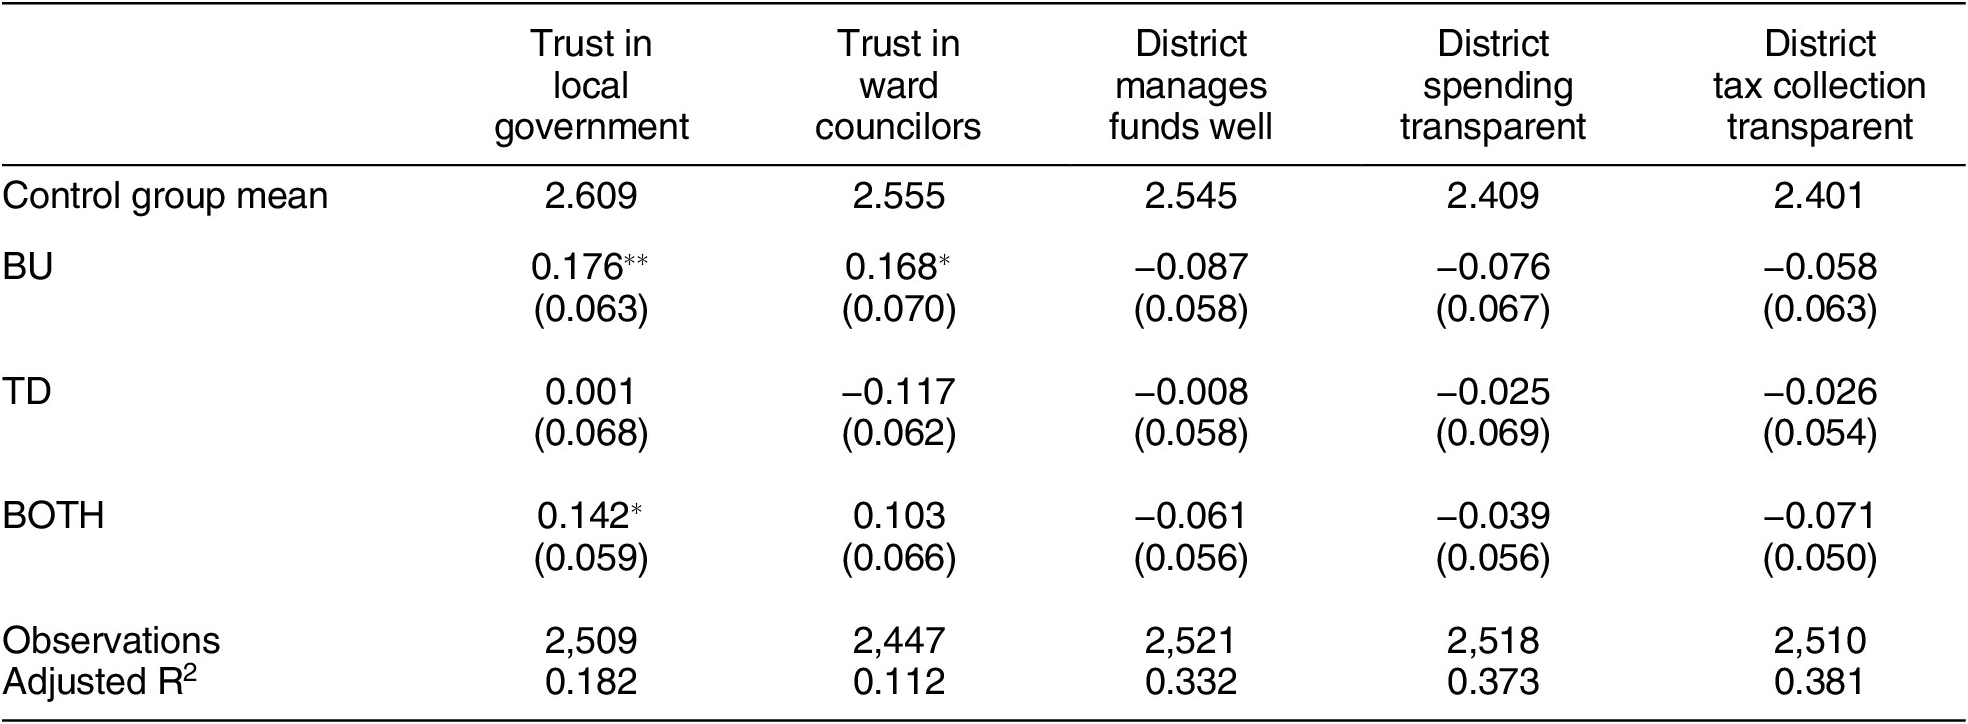
Table 3 reports the results pertaining to trust in and satisfaction with local government, all of which were measured on a four-point scale. In line with H4, we find that the BU treatment modestly but significantly increased both measures of trust. Trust in local government increased by 0.176 points, representing a 6.7% increase over the control group mean. Similarly, trust in ward councilors increased by 0.168 points, a 6.6% increase.Footnote 16 This increase in trust is not accompanied by an increase in satisfaction with local government: contrary to H5, there is no change in perceptions that the local government manages fund well, spends funds transparently, or collects fees transparently.
Table 3. Treatment Effects on Trust in and Satisfaction with Local Government

Note: Sample includes 20 vendors per market. Outcomes measured using a four-point scale. Models estimated using ordinary least squares and include enumerator and block FE, market-level clustered SE. *p<0.05; **p<0.01; ***p<0.001.
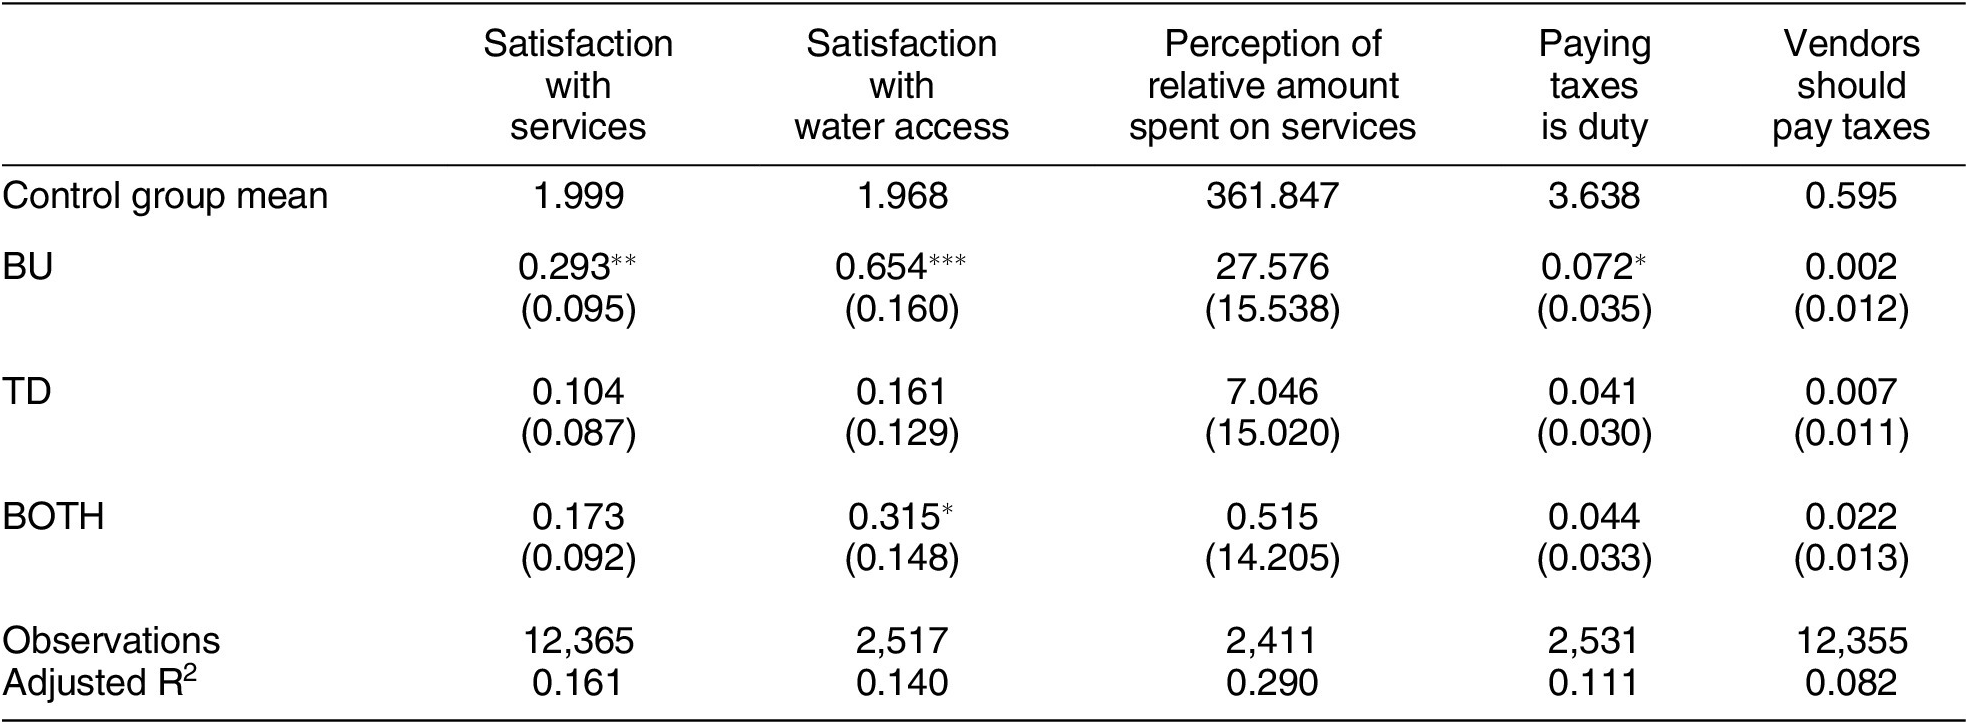
Table 4 reports the results pertaining to satisfaction with services (H6) and tax morale (H7). In line with H6, we see significantly higher satisfaction with market services in BU markets. Vendors exposed to the BU treatment were 0.293 points on a four-point scale more satisfied with market services in general than those in the control group, a 14.7% increase. This is driven by a large increase in satisfaction with access to clean water, a 33.2% (16.0%) increase for the BU (BOTH) treatment group; likely because boreholes were the chosen infrastructure project in 67% of treated markets. These gains in satisfaction are not driven by perceptions that the local government is spending a larger fraction of funds on services.
Table 4. Treatment Effects on Satisfaction with Services and Tax Morale

Note: Service satisfaction was asked of 100 respondents per market; other outcomes were asked for 20 respondents per market. Perception of relative amount spent in services is measured on a 0–1000 scale; Vendors should pay taxes is dichotomous; all other outcomes are measured using a four-point scale. Models estimated using ordinary least squares and include enumerator and block FE, market-level clustered SE. *p<0.05; **p<0.01; ***p<0.001.
Results for tax morale (H7) are mixed. While we do find a significant increase in the fraction of vendors who agree that paying taxes is a duty in BU markets, the substantive effect is small (2% increase over control, measured on a four-point scale). Also, we see no increase in the belief that vendors should pay taxes even if they disagree with local government (measured dichotomously). This is consistent with a world in which citizens are conditional compilers and the treatment increased satisfaction and therefore willingness to pay taxes, but did not shift broader norms and attitudes toward taxation.
Overall, these results provide some support for the proposed causal mechanisms, particularly those linking the BU intervention to tax compliance through higher vendor satisfaction. In interacting more with local government officials and experiencing more responsiveness surrounding revenue collection and service provision, vendors feel slightly more trusting of local government, and significantly more satisfied with services. Vendors who did not experience the BU treatment did not display similar spikes in trust and satisfaction, and the results are slightly weaker for the BOTH treatment group. However, vendors’ views on local government transparency or performance in managing funds did not improve in any treatment group. It is possible that these questions were too technical or that factors like partisanship are dominant predictors for answers to these questions.
Finally, we note that, first, contrary to the receipt measure, for the mechanism questions we do often find statistically significant differences between the BU and TD effects (see Tables M2 and M3 in the Supplementary Material for details). Second, these estimated effects are likely the lower bound of real-world effects, as they were measured prior to the completion of the infrastructure projects in some markets.
BU Treatment Downstream Effects
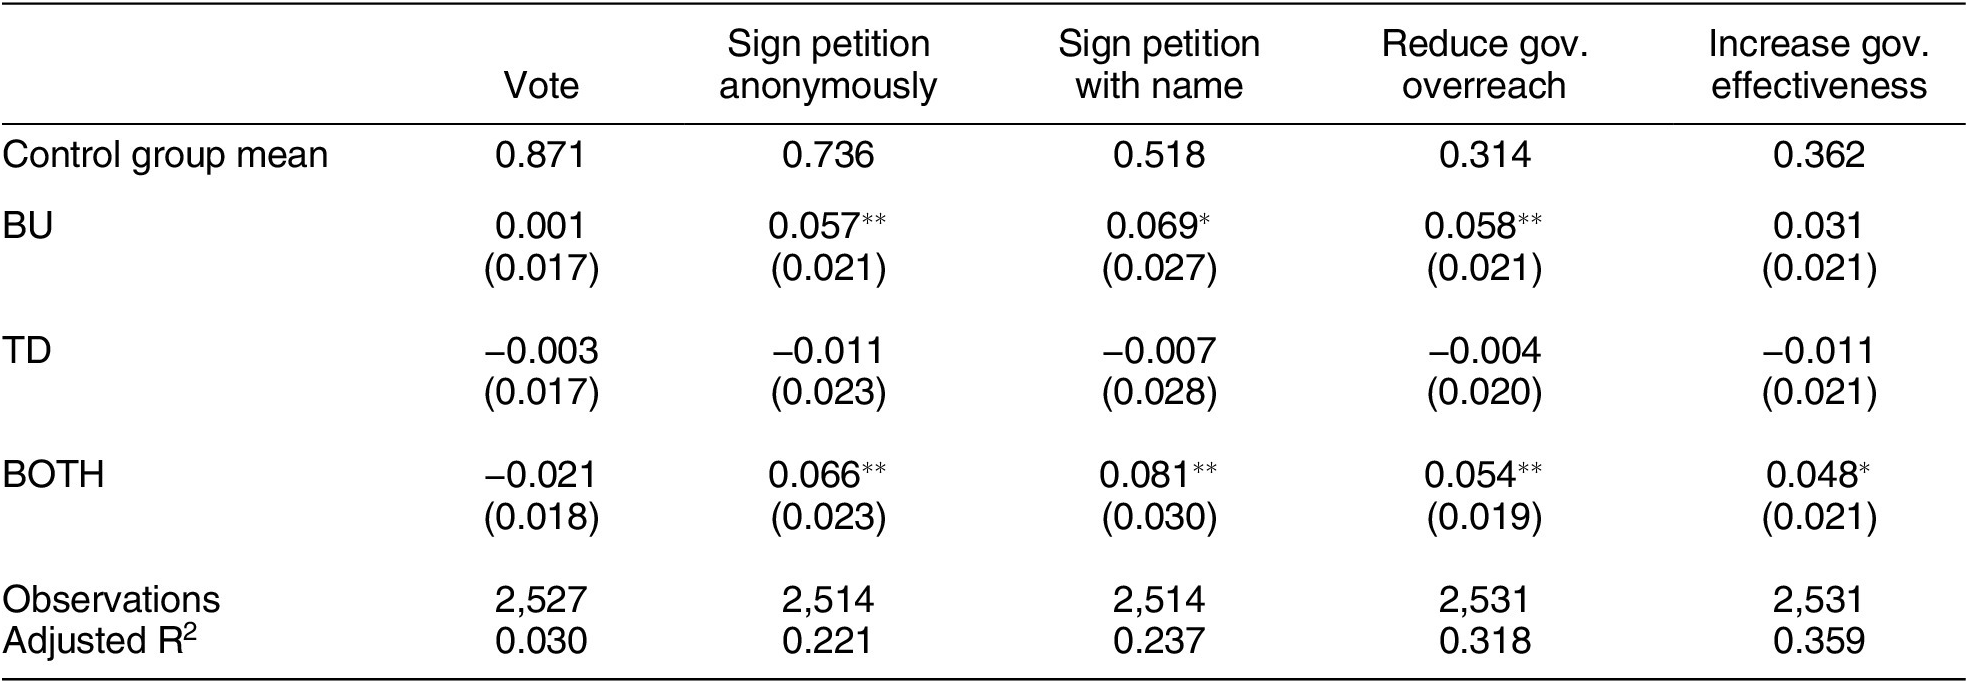
We predicted that the BU treatment would have the downstream effect of increasing vendor political engagement (H8). We test this hypothesis with individual-level DIM models for five binary outcomes. The first measured self-reported voting intention in the next election. The next two measures captured respondents’ willingness to sign a hypothetical petition to the District Finance Committee telling them that vendors want the local government to improve funding for markets. Respondents were first asked whether they would be willing to sign the petition anonymously, and then whether they would be willing to sign it with their names.
Finally, we included two costly behavioral measures. We asked respondents to send text messages expressing they agreed with the following two statements: (1) “We would like to demand a reduction in the over-reach of government power in collecting revenue in this district,” and (2) “We would like to demand an increase in government effectiveness in spending government revenue collected in this district.”Footnote 17 Respondents also had the chance to write a longer message, which they were informed would be passed on to the local government along with the level of agreement with the two statements. Respondents had to pay normal rates to send the message from their personal cell phone. The message went to a number monitored by the data collection team, which later collated and shared the messages with the local government (excluding names and cell phone numbers).
In line with H8, we find evidence that vendors became more politically engaged as a result of the interventions in markets that received the BU treatment. There is no effect on anticipated voter turnout, although this may be because of ceiling effects or social desirability bias—87% of control group vendors reported intending to vote.Footnote 18 By contrast, we find that the BU and BOTH treatments had positive and significant effects on willingness to sign a petition, both anonymously and with their name, with effects ranging from 5.7 percentage points to 8.1 percentage points.
In addition, vendors in BU and BOTH markets were five to six percentage points more likely to send the text asking for a reduction in the “overreach of government power” in revenue collection, relative to control. Vendors in BOTH treatment markets were also roughly five percentage points more likely to send a text demanding “an increase in government effectiveness in spending government revenue” than vendors in control markets.
The finding that citizens receiving the BU treatment demand a reduction in overreach by the local government seems counterintuitive given our findings in the mechanism tests that there is increased trust in the local government. If citizens trust the local government, why would they want to limit the ability of the local government to collect taxes? There are at least three possible explanations for this dynamic.
First, it is possible that citizens view the two as separate. They may have become more trusting of the local government overall in the BU arm, but still be hesitant to trust the enforcement arm of the local government. Second, it is possible that a shift to voluntary compliance reduces approval of any more coercive methods of enforcement. In the next section, we show that the BU treatment did not increase the perceived coerciveness of tax collection, alleviating the concern that our interventions led to overly-coercive government practices.
Third, it is possible that we are seeing two distinct vendor reactions to the BU treatment. One set of vendors experiences stronger trust in government and a sense that taxpaying is a duty, while another set of vendors is unhappy with government involvement in markets. We see some descriptive evidence of this—vendors from BU and BOTH treatment markets who agreed to send the message had levels of trust in the local government 7.6% lower than vendors who did not agree to send the message. In addition, refitting the model in column 4 in Table 5 with an interaction between the treatment variables and trust in local government reveals that individuals in BU markets who had indicated that they considered the local government “Very Trustworthy” were 3% less likely to agree with the statement about overreach.Footnote 19
Table 5. Treatment Effects on Political Engagement Outcomes

Note: Sample size is 20 vendors per market. All outcomes are dichotomous. Models estimated using ordinary least squares and include enumerator and block FE and market-level clustered SE. *p<0.05; **p<0.01; ***p<0.001.
The TD treatment did not seek to empower vendors in the same way as the BU treatment. As expected, there are consistent null effects on the political engagement outcomes in the TD markets.Footnote 20 It is encouraging that the stronger enforcement in the TD markets did not lead to increased demands to reduce tax collection (which is what a statistically significant effect on agreement with the statement about overreach would suggest).
TD Treatment: Causal Mechanisms
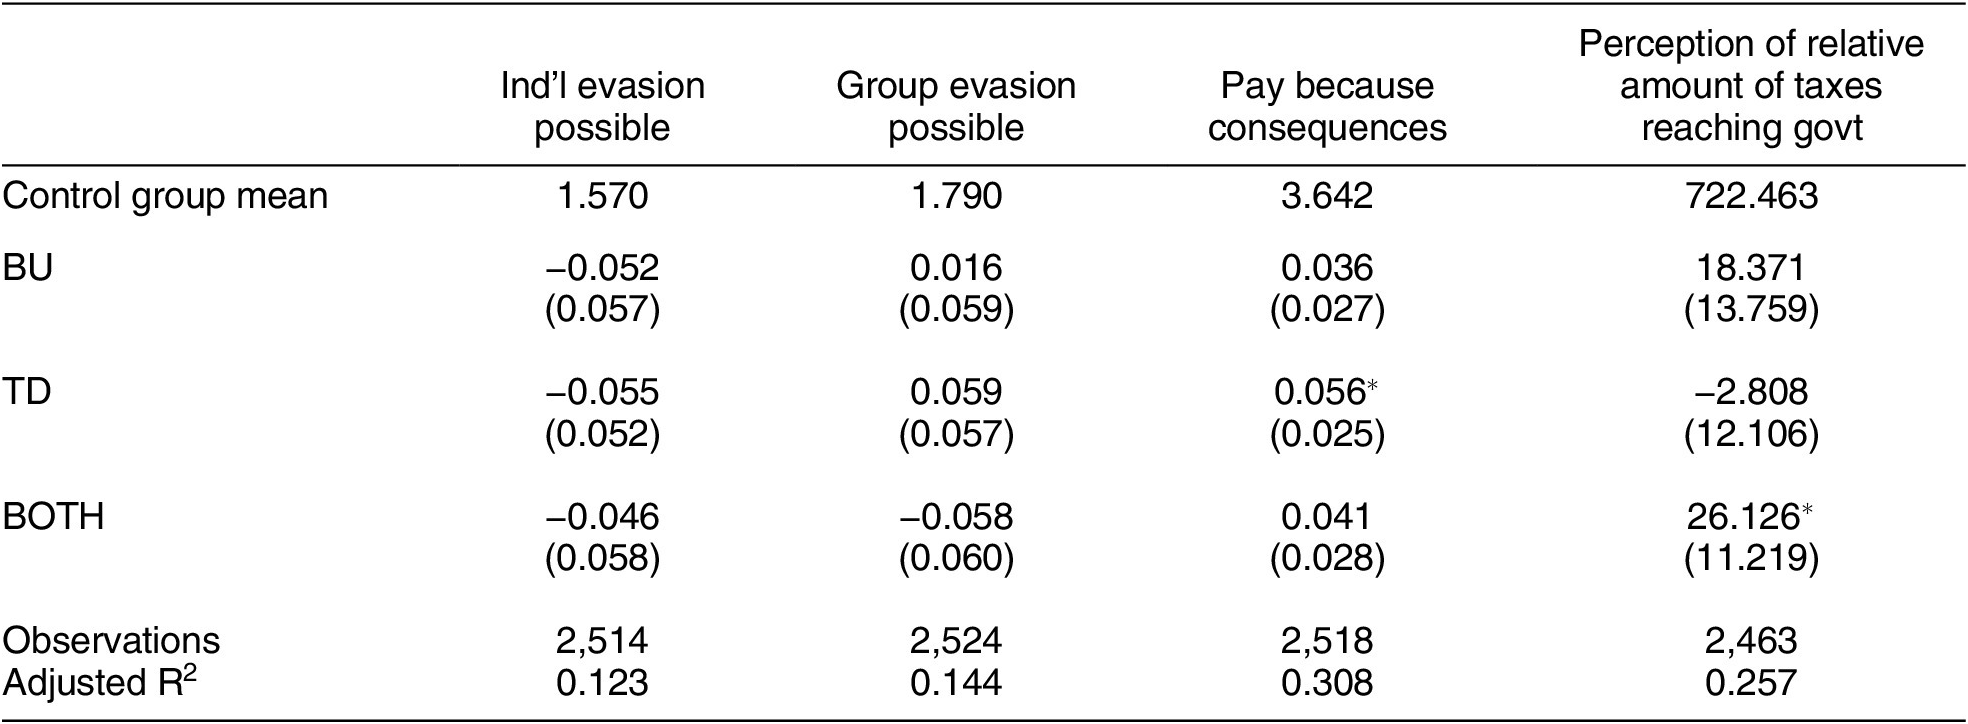
We expected the TD treatment to increase perceived and actual tax enforcement (H9), decrease corruption (H10), and increase tax collector effort (H11). To test these hypotheses, we estimated individual-level DIM models for outcomes from the market vendor and tax collector surveys.
The vendor survey included three questions measuring perceived tax enforcement. Two asked vendors whether they believed they could avoid paying market fees individually and together with other vendors, measured on a four-point scale. The third asked vendors whether they agreed “I pay market fees because I’ll get in trouble if I don’t,” also measured on a four-point scale. To measure corruption perceptions, vendors were asked to estimate the amount (out of 1,000 Malawi kwacha) of collected fees that actually reach the local government. Finally, to measure tax collector effort, we used two questions from the tax collector survey about the numbers of hours worked per market day and the number of vendors visited per market day.
Table 6 reports results for perceived tax enforcement and corruption. We find little evidence of increased tax enforcement (H9). While vendors in the TD group are slightly more likely to report that they pay taxes due to the consequences of non-payment, this effect is substantively small (1.5% increase over control), and there is no effect on vendors’ beliefs about their ability to refuse to pay the fee, either alone or together with other vendors. In all conditions, large majorities of vendors disagreed with the assertion that noncompliance was possible.
Table 6. Treatment Effects on Perceived Tax Enforcement and Corruption

Note: Outcomes were only included in the long version of the market vendor survey, which was administered to 20 respondents per market. Perception of relative amount of taxes reaching gov’t is measured on a 0-1000 scale; all other outcomes are measured on a four-point scale. Models are estimated using ordinary least squares and include enumerator and block fixed-effects and market-level clustered standard errors. *p<0.05; **p<0.01; ***p<0.001.
We find mixed evidence that the treatments decreased corruption (H10). There is no evidence that vendors perceive more tax money reaching the local government in TD markets. We do see that vendors in BOTH markets reported that they thought more money reached the local government than in control markets, but the effect size is substantively small (3.6% increase over control).
To assess H10 further, we use a list experiment included in the tax collector survey. Tax collectors were given a list of events and asked how many had happened to them in the previous week. Half of the tax collectors received the control group list with four innocuous activities. The other half was assigned to the treatment group, whose list included a fifth item concerning bribe-taking: “A vendor in this market gave you money so that the vendor did not have to pay the market fee.” The list experiment allows us to estimate the percentage of tax collectors in each intervention group who report taking bribes by comparing the mean number of activities reported across the control and treatment groups in the list experiment.
Across all treatment groups, the list experiment results estimate that 14% of tax collectors report accepting money from a vendor seeking to avoid paying the market fee. However, this varies greatly by treatment group: we find corruption estimates of about 0% in the TD group; 4% in the BOTH group; 18% in BU markets; and 36% in control markets. Due (at least in part) to the small sample size, these differences are not statistically significant. Still, the results are consistent with a world in which bribe-taking is lower in markets that got the TD treatment.
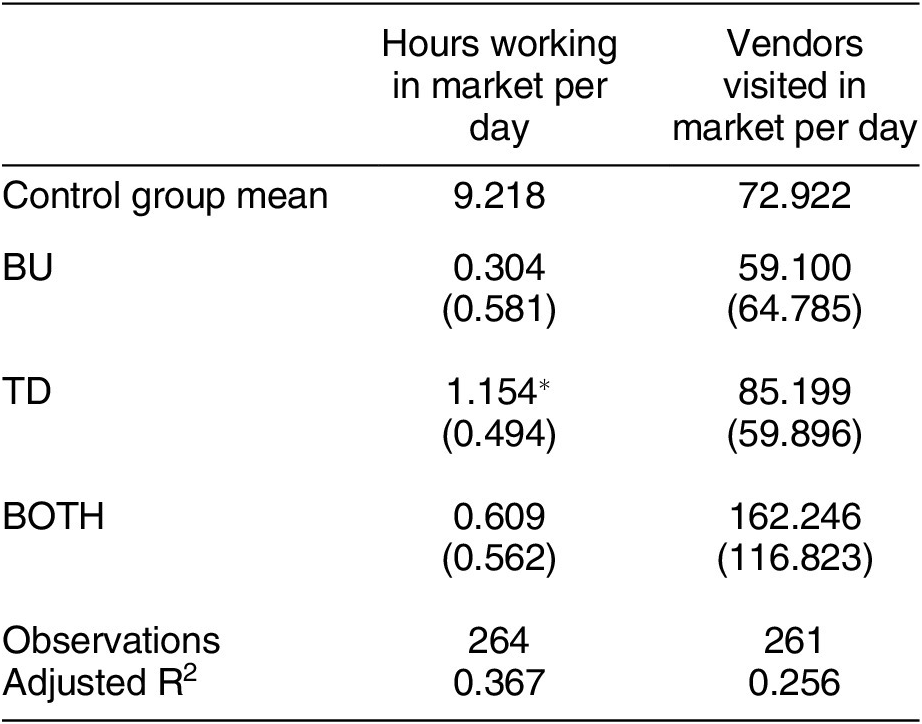
Table 7 reports results for tax collection effort (H11). The results are mixed. While the treatments did not increase the number of vendors tax collectors report visiting, tax collectors do report spending significantly more time in TD markets at endline: 12.5% longer on average over control markets. This suggests that TD tax collectors are spending more time with the vendors they do visit, in line with other studies that improve tax collector incentives (see, e.g., Khan, Khwaja, and Olken Reference Khan, Khwaja and Olken2016). This is consistent with tax collectors in TD markets either feeling more pressure from local government or being better incentivized.
Table 7. Treatment Effects on Tax Collection Effort

Note: Hours working in market per day is measured as a real number 0–24. Vendors visited in market per day is measured as a positive real number. Models estimated using ordinary least squares and include enumerator and block FE and market-level clustered SE. *p<0.05; **p<0.01; ***p<0.001.
Robustness Checks
The results for the ability to produce a receipt, self-reported tax compliance, and perceived group tax compliance measures are robust to alternative specifications, including market-level endline difference-in-means, market-level DID, individual-level quasi-DID,Footnote 21 and individual-level endline difference-in-means controlling for the baseline market-level average for the outcome variable (see Section N.1 of the Supplementary Material). We also analyzed the main outcomes considering the BOTH group as an interaction between the TD and BU treatments: these models show the same results. The results are also robust to codings that retain observations with nonsensical values for the self-reported and perceived group tax compliance measures (see Section N.1 of the Supplementary Material), and to widening the compliance receipt window to 10 days (see Table N6 in the Supplementary Material). Our mechanism outcomes are similarly robust to different modeling approaches, including individual level quasi-DID, and endline difference-in-means controlling for the baseline market-level of the outcome (see Section N.2 of the Supplementary Material).
As pre-specified, we explored several possible sources of effect heterogeneity. At the individual level, we examined heterogeneous effects by vendors’ gender, type (selling goods versus services), frequency of vending (daily versus not daily), and wealth, but do not find any evidence of heterogeneous effects based on these vendor-level variables (see Section L.1 of the Supplementary Material).
Based on a pre-treatment market scoping exercise and the vendor survey data, we tested for market-level heterogeneous effects by markets’ size and their propensity for collective action. We operationalized market size using the number of vendors present on a market day as estimated during a pre-treatment scoping visit. We find no heterogeneous effects based on this variable. We operationalized collective action propensity as the market-level mean of a question on the vendor survey inquiring whether the market would work together to solve a problem. We find that the likelihood of producing a receipt does not vary with collective action propensity, but that self-reported and perceived group tax compliance effects in the BU group are stronger as collective action propensity increases (see Section L.2 of the Supplementary Material).
Because many vendors sell in multiple markets, and because markets can operate in close proximity to one another, we also conduct spillover analysis using two approaches: an inverse probability weighting (IPW) approach and a treatment externalities approach based on Miguel and Kremer (Reference Miguel and Kremer2004). Full description of and results from this analysis are in Section I of the Supplementary Material. Both approaches find treatment effects robust to most specifications. Cases where our results are weaker (a 10 km radius in the IPW approach, and one specification in the treatment externalities approach) could be driven by the drop in observations.
Finally, we execute a pre-specified multiple hypothesis correction per hypothesis, collecting all tests for all outcomes for each hypothesis and using the Holm procedure to see which p-values survive.Footnote 22 Table O1 in the Supplementary Material shows the original and corrected p-values. Multiple hypothesis correction solidifies our belief in the effect in the BU treatment, as all except two of the significant results for the BU treatment survive: the market-level recent receipt result, which was a hard test to begin with due to the small market-level sample size; and the Sign Petition with Name outcome for H8 (corrected p-value of 0.060).
CONCLUSION
This article presents some of the first experimental evidence on different approaches to improving tax compliance in a developing country setting. We designed and implemented a set of complex, multi-pronged interventions to provide a strong test of two common approaches to improving taxation. The BU approach focused on improving citizen-state relations, jump-starting tax bargaining, and breaking out of the low-services, low-compliance tax equilibrium. The TD approach focused on enforcement and government capacity to monitor and collect taxes efficiently. Critically, we focused on interventions that targeted communities of taxpayers, rather than individuals; this more closely matches the predictions of existing theories.
The BU treatment successfully increased tax compliance and improved citizen-government relations and citizen engagement. This suggests that such approaches may be critical for creating sustained improvements in taxation in developing countries. We find less robust effects on tax compliance in markets that received the TD treatment, although these are not significantly different from the BU results. These effects on tax compliance hold only for one measure of tax compliance: the production of a receipt for paying a fee in the last 7 days. While we assert this behavioral measure is the most valid, as it is least vulnerable to social desirability bias, future research examining the robustness of effects across tax compliance measures would be useful.
In contrast, the markets that received both the BU and TD treatments saw smaller treatment effects than predicted. There are several potential reasons for this. First, given the low level of state capacity in Malawi, it is possible carrying out both treatments was too demanding, and the treatment backfired due to ineffective execution. It is also possible that one treatment crowded out the other. For example, it is possible that while the BU treatment increased tax morale, adding in the TD treatment led to higher pressure on vendors, dampening effects by undermining vendors’ intrinsic motivation. Finally, it is possible that delays in the infrastructure component, in conjunction with the increased TD pressure, meant that vendors faced increased enforcement after they had been promised new public goods, but before those public goods were actually delivered. More research is needed to explore these potential explanations.
In a similar vein, we fail to document effects on overall revenue totals, primarily due to poor revenue data quality at baseline. There is a key insight embedded in this data problem, however. Building fundamental capacities of the tax collection and revenue tracking system is a critical prerequisite for effective tax interventions.
We find encouraging evidence surrounding the hypothesized causal mechanisms and downstream effects. The BU treatment, but not the TD treatment, led to small increases in trust in government and substantially higher satisfaction with services. This would be a valuable outcome even absent an effect on tax compliance. In addition, the BU treatment increased political engagement among vendors, another important intermediate outcome with positive implications for citizen-state relations. Interestingly, markets that received the BOTH treatment saw similar effects on political engagement outcomes to BU-only markets. These effects are particularly promising given the short time frame between intervention implementation and endline data collection.
A few caveats on the findings are in order. First, while the effect sizes on compliance are substantively meaningful, we still see high levels of noncompliance in all treatment conditions. This could result from the relatively short timeframe of the interventions: it is possible that, if higher trust in government is sustained, we would see a virtuous cycle of higher compliance and trust emerge over time. This may be especially likely if compliance is “sticky” and some vendors want to see sustained changes in government behavior before paying. However, it is also possible that the challenges in implementation of the interventions reduced their impact; in line with this, we do see that some markets saw very large changes in compliance, while others saw very small changes (Figure N1 in the Supplementary Material). This is a nascent area of research in developing countries, and much more work is needed to understand the scope conditions of these effects.
Second, while our intervention was longer-term than many other tax experiments, data collection on outcomes occurred relatively soon after the interventions concluded, or even during their completion in some BU and BOTH markets. Our findings should therefore be viewed as short-term effects. Studies that allow for longer time horizons are starkly missing from the literature on tax compliance. The lack of an effect on compliance in the TD treatment also limits our ability to test the overlap between mechanisms in the two treatment arms. For example, it is possible that a successful TD treatment could also have increased tax morale or satisfaction, provided taxes were collected fairly and the money well-spent. Likewise, it is possible that in a longer time frame we would have seen larger impacts on the proposed causal mechanisms.
Two further caveats concern the bundled nature of each intervention arm. First, future work will be needed to disentangle the bundles and identify the most effective components. This would provide a better understanding of whether some components can work on their own, or whether the interventions must be implemented as a set to overcome barriers to taxation. The observed effects are also relatively modest when considering the strength of the bundles. This speaks to the complexity of tax interventions and the need for restraint in scaling up any particular intervention based on our findings.
Second, their bundled nature also means the interventions were quite costly. Many of the costs (e.g., setting up mobile money in the TD bundle or the SMS system in the BU bundle) were one-off expenses that were necessary to build the capacity of the tax collection system but would not repeat moving forward. Still, expanding the intervention to other areas would require fixed up front costs, especially for the infrastructure projects in the BU bundle, which cost approximately $5,000 per market. However, such one time investments could have positive effects for the community overall separate from the effects on tax compliance, making them more viable. Once an investment is made, the cycle of collecting revenue and providing services should be self-sustaining. For example, our scoping research suggested that 10 days of fees from 10 vendors would cover the cost of a month of periodic trash pickup across several markets in an area, and that 25 days of fees from 10 vendors would cover the cost of a security guard for one market. The merit-based incentives for tax collectors are self-funding by definition, and the ongoing costs of meetings between market committees and district officials would be minimal. That said, the sustainability of these interventions would depend on the willingness of district councils to minimize overhead costs at the district level.
Finally, more work is needed on the political feasibility of each approach. Both treatment arms ran into a lack of political will to implement the experiment as originally agreed upon: local officials worried about giving detailed spending information to citizens, and about the ways in which incentive schemes for tax collectors could backfire. Further, the interventions advanced partially because of the involvement (and resources) of an international donor, which calls into question whether they would be viable without such involvement. Still, local government officials were ultimately responsible for the day-to-day execution of the interventions. That relatively new local governments were able to implement such an ambitious set of interventions points to the potential for this kind of approach, even in low capacity settings.
SUPPLEMENTARY MATERIAL
The supplementary material for this article can be found at https://doi.org/10.1017/S0003055425100774.
DATA AVAILABILITY STATEMENT
Research documentation and data that support the findings of this study are openly available at the American Political Science Review Dataverse: https://doi.org/10.7910/DVN/O9NYHN.
Acknowledgements
We thank the teams at USAID, NORC, DAI, and IPA Malawi for their insights and diligence in supporting this impact evaluation. Particular thanks go to Francis Jere, Morgan Holmes, Meral Karan, Thoko Chisala, Christian Elwood, Jeffrey Telgarsky, and Renee Hendley. Carolyne Barker, Doug Dubrowski, and Kate Stotesbery provided excellent research assistance. The original research design benefited greatly from feedback at the Midwestern Working Group on African Political Economy (MGAPE), and of the Contemporary African Political Economy Research Seminar (CAPERS). This article was significantly improved by feedback from presentations at APSA, EGAP, Duke University, Georgetown University, University of California-Los Angeles, University of Minnesota, University of North Carolina-Chapel Hill, and University of Texas-Austin.
FUNDING STATEMENT
This research was funded by a U.S. Agency for International Development (USAID) contract (No. GS-10F-0033M, Task Order No. AID-OAA-M-13-00013) through the National Opinion Research Center (NORC) at the University of Chicago.
CONFLICT OF INTEREST
The authors declare no ethical issues or conflicts of interest in this research.
ETHICAL STANDARDS
The authors declare the human subjects research in this article was reviewed by the University of North Carolina at Chapel Hill and NORC at the University of Chicago and certificate numbers are provided in the appendix. The authors affirm this article adheres to the principles concerning research with human participants laid out in APSA’s Principles and Guidance on Human Subject Research (2020).


Comments
No Comments have been published for this article.