

Measuring fatty acid (FA) composition of plasma and erythrocyte phospholipids are well-established methods used in intervention and observational studies to investigate the relationship between the dietary intake of long-chain n-3 FA and the risk of disease. The association between habitual fish intake and the concentration of long-chain n-3 FA in phospholipids and cholesterol esters (CE) has been well documented(Reference Ma, Folsom and Shahar1–Reference Baylin and Campos3). When baseline measurements are used in long-term observational studies, the initial value is believed to reflect the concentration in each subject throughout the period of follow-up. Studies with this design have documented the association between habitual fish consumption and the long-term risk of CHD, stroke and death(Reference Miettinen, Naukkarinen and Huttunen4–Reference Lindberg, Saltvedt and Sletvold7).
Analysis of long-chain n-3 FA is now increasingly used in clinical diagnostics and preventive medicine to advise patients on their dietary intake of marine n-3 FA. However, the validity of using phospholipid FA analysis diagnostically is not well documented, and validation of the FA composition of plasma phospholipids as a long-term marker is scarce(Reference Moilanen, Rasanen and Viikari8–Reference Guerra, Demmelmair and Toschke11). Dietary intake is considered to be the most important factor determining the plasma concentration of phospholipid long-chain n-3 FA, but other factors such as genetic characteristics, receptor and enzyme activation, health and disease conditions might modify the pharmacokinetics of dietary marine FA and how they are incorporated into plasma and cell membrane phospholipids(Reference Corpeleijn, Feskens and Jansen12–Reference Oh da, Talukdar and Bae14). These factors constitute the total inter- and intra-individual biological variation of the actual FA measured. Knowledge of the inter- and intra-individual variation together with knowledge of the analytical variation is necessary in order to evaluate the potential clinical usefulness of new diagnostic biochemical methods.
The present study reports the biological variation of plasma phospholipid FA concentrations, reference change values (RCV), the index of individuality and their potential long-term tracking, as well as their correlation with self-reported dietary intake of fish and cod-liver oil.
Subjects and methods
The Nord-Trøndelag Health Study (HUNT) is an extensive health study in the county of Nord-Trøndelag, Norway(Reference Claudi, Midthjell and Holmen15). HUNT addressed the total adult population in the county, which is known to have a population fairly representative for the whole of Norway. The county population was ethnically homogeneous, with 97 % of Caucasian origin. During 1984–6, all inhabitants aged 20 years and older were invited, and 74 977 (88·1 %) attended the baseline screening where participants aged 40 years and older had their random, non-fasting capillary blood glucose measured. Those without known diabetes and a non-fasting glucose ≥ 8·0 mmol/l were given an appointment for a fasting blood glucose test and, if necessary, an oral glucose tolerance test. They were also referred to their own general practitioner for final diagnosis, treatment and clinical control. Using the 1980 WHO criteria(16) for diabetes mellitus, a total of 428 new cases of diabetes were identified. These new diabetic patients were invited to the first follow-up including an extended clinical evaluation 6–22 months (mean 14) after the baseline screening. A total of 103 out of the 428 cases were not invited due to old age (twenty), being deceased (twelve), having concomitant serious diseases (fourteen), having moved out of the county (two), or they did not answer or were unwilling to participate (thirty-seven), while eighteen were excluded for other reasons. This resulted in a population of 325 new diabetic persons, who were followed extensively(Reference Claudi, Midthjell and Holmen15, Reference Dale, Nilsen and Vatten17–Reference Dale, Midthjell and Nilsen19). Blood samples for plasma phospholipid FA analysis were collected in 323 subjects at the first follow-up (fasting state) and in 214 of these subjects at a second follow-up 3·1 years later (non-fasting state). Dropout at the second follow-up visit was due to death (forty), no blood sample (two) or other reasons (old age, serious disease or unwilling to participate) (sixty). The final dataset consisted of 214 diabetic persons in whom plasma phospholipid FA were measured 3·1 years apart. The HUNT 1 survey and the inclusion of the Norwegian Personal Identification Number were approved by the Norwegian Data Inspectorate which considered the legal and ethical issues of the study. Data on smoking status, hypertension and CVD were obtained from questionnaires. Weight and height were measured by trained staff at the screening site. BMI was calculated as weight (kg)/height (m2). Blood pressure was measured using a calibrated mercury manometer and the mean of the two measurements was used. Serum total cholesterol was measured with reagents from Boehringer Mannheim using a Hitachi 737 analyser (Boehringer Mannheim GmbH). Serum creatinine was measured using a modified Jaffe's method on a Kone Diagnostics instrument (Konelab Corporation). At baseline, glycosylated Hb (total) was measured using an agar electrophoresis method with a Corning GLYTRAC™ glycosylated Hb set (Corning Medical). During the follow-up, this method was replaced by HPLC (Shimadzu Corporation and Diamat). The measurements were transformed into uniform units (Diamat HbA1c) using validated formulas(Reference Dale, Midthjell and Nilsen19). Non-fasting capillary blood glucose as well as glucose readings in the glucose tolerance test were measured using the Reflocheck method (Boehringer Mannheim GmbH). The plasma samples were prepared and stored at − 80°C until analysis. Plasma lipids were extracted with butanol(Reference Bjerve, Daae and Bremer20) and phospholipids isolated by column chromatography after adding diheptadecanoyl-glycerophosphocholine and butylated hydroxytoluene (Sigma Chemical) as an internal standard and antioxidant, respectively. The phospholipids were transmethylated and quantified by GLC on a Hewlett-Packard 5890A using a 30 m SP2330 fused silica capillary column (inner diameter 0·25 mm and film thickness 0·20 μm; Supelco, Inc.) essentially as described previously(Reference Bjerve, Fischer and Alme21). The results were expressed as mg phospholipid FA/l plasma and recalculated to a percentage by weight (wt%) on the basis of twenty-two identified FA. A normal human plasma sample was included in each run to monitor analytical performance. The between-series CV for the complete study period (n 83) were 3·7, 3·7 and 4·9 %, respectively, for 20 : 4n-6, 20 : 5n-3 and 22 : 6n-3 when measured as mg/l. The corresponding CV were reduced to 2·2, 2·4 and 3·5 % when concentrations were expressed as wt%. In addition to the second blood sample, a FFQ was answered by the participants at the second follow-up. Marine food frequency was reported as lean fish or fatty fish for dinner (per week), fish spread on slices of bread (per d or week) and use of cod-liver oil (yes or no). Ratios between the relevant FA have commonly been used as indicators of desaturase activity(Reference Slagsvold, Thorstensen and Kvitland22, Reference Peter, Cegan and Wagner23). We therefore calculated the FA ratios 16 : 1:16 : 0, 20 : 3n-6:18 : 2n-6 and 20 : 4n-6:20 : 3n-6 as indicators of Δ-9 desaturase, Δ-6 desaturase and Δ-5 desaturase, respectively. We also calculated the PLN3 index as 20 : 5n-3+22 : 6n-3 from wt% concentrations. Harris(Reference Harris24) and Harris & Von Schacky(Reference Harris and Von Schacky25) defined 20 : 5n-3+22 : 6n-3 (wt%) measured in erythrocytes as the omega-3 index, which they reported to be linearly correlated with the similar index measured in plasma phospholipids (omega-3 index(erythrocytes)= omega-3 index(plasma)× 0·97+3·43, r 0·91)(Reference Harris24, Reference Harris and Von Schacky25). To determine biological variation, we calculated the standard deviation of the two plasma phospholipid FA measurements 3·1 years apart as:
 $$\begin{eqnarray} sd_{diff} = \sqrt {\frac {\sum ( d _{i})^{2}}{2 n }}, \end{eqnarray}$$
where d i denotes the difference between the first and the second measurement for each individual and n, the number of individuals(Reference Fraser26). sddiff was divided by the overall mean to give the corresponding CV (CVdiff). The analytical CV (CVa) calculated from the analytical control serum was subtracted from CVdiff to give the within-subject variation 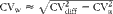 $$CV_{w}\approx \sqrt { CV _{diff}^{2} - CV _{a}^{2}} $$. The between-subject variation (CVb) was similarly obtained from the total variation at the first follow-up (CV1.follow-up) by the formula:
 $$\begin{eqnarray} CV_{b}\approx \sqrt { CV _{1.follow - up}^{2} - ( CV _{a}^{2} + CV _{w}^{2})}. \end{eqnarray}$$
The RCV, i.e. the change in a result that makes it significantly different from a previous result with P < 5 % (bidirectional changes between two measurements in the same patient), was calculated as:
 $$\begin{eqnarray} RCV = 2\cdot 8\times \sqrt { CV _{a}^{2} + CV _{w}^{2}} \end{eqnarray}$$
and the index of individuality(Reference Burtis, Ashwood and Tietz27) was calculated as:
 $$\begin{eqnarray} CV_{w}/CV_{b}. \end{eqnarray}$$
Statistical analysis
Statistical computations were performed using SAS/STAT software version 9.2 (SAS Institute). Baseline characteristics and follow-up values are reported as means and standard deviations, and proportions as appropriate. Values were compared using the Wilcoxon–Mann–Whitney test or Fisher's exact test for contingency tables. The tracking of individual FA between measurements 3 years apart was expressed as Spearman's rank correlation coefficients (r), calculated from the FA percentages. Estimation of the intraclass correlation coefficient (ICC, synonymous to the reliability correlation coefficient) was carried out using a restricted maximum-likelihood method in SAS PROC MIXED (SAS Institute). We use the term ICC instead of reliability correlation coefficient to avoid confusion with Spearman's r. Tracking was further assessed as the proportion of subjects who remained in the same quartile at both examinations. These proportions were compared with proportions expected if all subjects were classified randomly to a quartile (Cochran–Mantel–Haenszel non-zero correlation test). Testing for equality of population correlation was performed using Fisher's Z-transformation.
Results
The mean age of the population at screening was 66·5 (range 43–85) years (Table 1). Glycosylated Hb increased significantly, while total cholesterol was significantly reduced between the first and second follow-ups. Creatinine was not measured at the second follow-up, data from the HUNT 2 survey performed 9 years after the first follow-up (n 102) are therefore given. The increase from 82·9 (sd 16·2) to 101·0 (sd 1·6) mmol/l during these 9 years is higher than reported in non-diabetic populations(Reference Tiao, Semmens and Masarei28, 29) and could reflect the additional effect of diabetic nephropathy. The number of subjects with hypertension increased from 173 (81 %) to 188 (88 %) (P= 0·06, Fisher's exact test for contingency tables). The concentrations of the twenty-two individual FA and relevant ratios at the first and second follow-ups are presented in Table 2, together with Spearman's correlation coefficient and the ICC for the two measurements. SFA accounted for 42 % of the total FA, MUFA for 14 %, n-6 PUFA for 33 % and n-3 PUFA for 11 %. Except for 22 : 1, FA concentrations and FA ratios at baseline and follow-up were highly correlated (P≤ 0·001). Spearman's rank correlation coefficients ranged from 0·21 (20 : 1 and 18 : 3n-3) to 0·68 (20 : 3n-6 and the 20 : 4n-6:20 : 3n-6 ratio). Correlation coefficients for the marine long-chain n-3 FA EPA and DHA were 0·47 and 0·60, respectively. The PLN3 index had a correlation coefficient comparable with EPA and DHA (r 0·55), and the indicators of desaturase activity all showed a highly significant correlation (r 0·64–0·68). The ICC ranged from less than 0·20 (20 : 1, 22 : 1 and 18 : 3n-3) to more than 0·60 (16 : 1, 20 : 3n-9, 20 : 3n-6 and 20 : 4n-6). The ICC for EPA, DHA and the PLN3 index were 0·42, 0·60 and 0·53, respectively. Fig. 1 shows the changes in mean phospholipid FA concentrations during the follow-up in quartiles defined at the first visit. Although regression towards the mean is generally observed, the order of quartile means persisted throughout the study period for most FA, including EPA and DHA.
Population characteristics at baseline and the second follow-up (Mean values and standard deviations; number of participants and percentages)
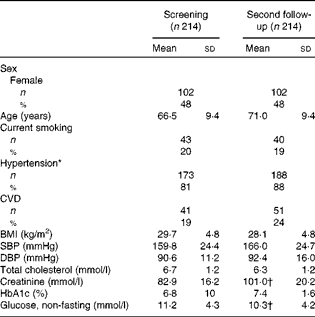
SBP, systolic blood pressure; DBP, diastolic blood pressure; HbA1c, glycosylated Hb.
* SBP ≥ 140 mmHg and/or DBP ≥ 90 mmHg, or antihypertensive medication.
† Data collected 6 years after the second follow-up (n 102).
Concentrations and correlations between plasma phospholipid fatty acid concentrations (wt%) at the first follow-up and the second follow-up 3 years later (Mean values and standard deviations; Spearman's coefficients, intraclass correlation coefficients and 95 % confidence intervals)

PL, phospholipids; N3, n-3; LC, long chain; D9D, Δ-9 desaturase; D6D, Δ-6 desaturase; D5D, Δ-5 desaturase.
* P≤ 0·001.
† D9D ratio, 16 : 1:16 : 0; D6D ratio, 20 : 3n-6:18 : 2n-6; D5D ratio, 20 : 4n-6:20 : 3n-6.
‡ 20 : 5n-3+22 : 6n-3.
§ LC-PUFA: twenty carbon atoms or more, two double bonds or more.
Mean plasma phospholipid fatty acid concentration (wt%) for each of the fatty acids studied at the first follow-up and the second follow-up 3·1 years later. Patients were divided into quartiles according to plasma phospholipid fatty acid concentration at (1) baseline and (2) the same quartiles were analysed at follow-up 3·1 years later. ●, First quartile; ○, second quartile; ▾, third quartile; Δ, fourth quartile.

To further examine the tracking of individual FA, we performed a test for stability of quartile classification using the Cochran–Mantel–Haenszel non-zero correlation test. The probability that a subject would remain in the same DHA quartile from the first to the second follow-up was 44 %. Specifically, 51 % of the subjects who where in the lowest quartile at the first follow-up were still in the lowest quartile at the second follow-up (Table 3). Similarly, 57 % of the subjects belonging to the highest quartile at the first follow-up were still in the highest quartile at the second follow-up (P< 0·01). The corresponding values for EPA were 41, 53 and 44 %, respectively (P< 0·01).

* The values in columns I–IV represent the observed number of subjects in each quartile.
† P values for the intraclass correlation were P< 0·01 (EPA) and P< 0·0001 (DHA) (Cochran–Mantel–Haenszel non-zero correlation test).
The correlations between self-reported marine food frequency (sum intake) and long-chain n-3 FA concentrations measured simultaneously and 3 years earlier were both highly significant for EPA and DHA (Table 4). However, the correlation was significantly higher when EPA was measured simultaneously (r 0·47) when compared with measurements made 3 years earlier (r 0·20, P< 0·01, testing for equality of population correlation using Fisher's Z-transformation). The corresponding values for DHA were 0·44 and 0·19, respectively (P= 0·01). Similar to EPA and DHA, the PLN3 index correlated significantly with self-reported marine food frequency (sum intake) measured simultaneously (r 0·49). However, the indicators of desaturase activity were not significantly correlated with the self-reported marine food frequency. Fig. 2 illustrates the association between fatty fish intake and plasma phospholipid FA concentrations. The long-chain n-3 FA EPA, DHA and sum n-3 all increased significantly with increasing intake of fatty fish, whereas 18 : 2n-6 (linoleic acid), 20 : 4n-6 (arachidonic acid), 22 : 5n-6 (docosapentaenoic acid) and sum n-6 all decreased significantly. Table 5 shows the differential effects of lean fish, fatty fish, fish spread and cod-liver oil on the selected FA. There was a significant trend of increasing concentrations of long-chain n-3 FA with increasing intake of all marine foods. In contrast, concentration of n-6 FA decreased with increasing intake of marine food. The within-subject CV (CVw) of EPA, DHA and the PLN3 index were 39·9, 14·3 and 18·0 %, respectively. The corresponding between-subject CV (CVb) were 33·6, 16·5 and 18·7 %, respectively. Consequently, the RCV and the index of individuality were 112 % and 1·2 (EPA), 41 % and 0·9 (DHA) and, finally, 52 % and 1·0 (PLN3 index).
Pearson's correlation coefficients (r) between plasma phospholipid fatty acids and the self-reported dietary intake of marine foods‡

PL, phospholipids; N3, n-3; LC, long chain; D9D, Δ-9 desaturase; D6D, Δ-6 desaturase; D5D, Δ-5 desaturase.
* P≤ 0·01.
† 0·01 < P≤ 0·05.
‡ Marine food frequency was reported as lean fish or fatty fish for dinner (per week), fish spread on slices of bread (per d or week), cod-liver oil (yes or no). Phospholipid fatty acid concentrations were measured both at the first and second follow-ups, while self-reported dietary intake was only registered at the second follow-up.
§ D9D ratio, 16 : 1:16 : 0; D6D ratio, 20 : 3n-6:18 : 2n-6; D5D ratio, 20 : 4n-6:20 : 3n-6.
∥ 20 : 5n-3+22 : 6n-3.
Association between fatty fish intake and plasma phospholipid fatty acid concentration expressed as percentage by weight (% by wt). Self-reported intake of fatty fish was divided into four groups of increasing intake as described in the Subjects and methods section. (a) 18 : 2n-6 (●), 20 : 2n-6 (○), 20 : 3n-6 (▾), 20 : 4n-6 (△), 22 : 4n-6** (■), 22 : 5n-6 (□), sum n-6* (◆). (b) 18 : 3n-3 (●), 20 : 5n-3* (○), 22 : 5n-3 (▾), 22 : 6n-3** (△), sum n-3* (■). (c) 14 : 0 (●), 16 : 0 (○), 18 : 0 (▾), 20 : 0 (△), 22 : 0 (■), 24 : 0 (□), sum saturated (◆). (d) 16 : 1 (●), 18 : 1 (○), 20 : 1* (▾), 22 : 1 (△), 24 : 1 (■), sum monounsaturated (□). Values are means, with standard deviations represented by vertical bars. * P for trend ≤ 0.01. ** 0.01 < P for trend ≤ 0.05.

Plasma phospholipid concentrations expressed as the percentage by weight of the selected fatty acids according to self-reported marine food frequency‡ (Mean values and standard deviations)

* P≤ 0·01.
† 0·01 < P≤ 0·05.
‡ Self-reported marine food frequency was divided into four groups of increasing intake, except for cod-liver oil (yes or no). P for trend was calculated for all foods except for cod-liver oil (Mann–Whitney U test). Data from the second follow-up.
Discussion
Data on long-term reproducibility as well as on the diagnostic utility of plasma phospholipid FA analysis are limited(Reference Moilanen, Rasanen and Viikari8–Reference Guerra, Demmelmair and Toschke11), and absent for elderly populations and for relevant patient populations. This is an important aspect of a prospective biomarker because lack of reliability may result in a loss of statistical power and a bias towards unity in relative risk estimates(Reference de Klerk, English and Armstrong30). The present study shows a highly significant correlation in plasma phospholipid FA concentrations measured 3 years apart for all major marine FA as well as the PLN3 index. The findings are in accordance with similar studies in youths and adults(Reference Moilanen, Rasanen and Viikari8–Reference Zeleniuch-Jacquotte, Chajes and Van Kappel10). For example, 3-year tracking of FA in serum CE in 759 Finnish children(Reference Moilanen, Rasanen and Viikari8) showed correlation coefficients of 0·47 (EPA) and 0·48 (DHA), respectively. The corresponding correlation coefficients in the present study were 0·47 and 0·60, suggesting that tracking of DHA is higher in phospholipids than in CE. However, DHA is poorly incorporated into CE compared with EPA, illustrated by a DHA:EPA ratio of 0·5 in CE(Reference Moilanen, Rasanen and Viikari8) compared with 3·3 in plasma phospholipids in the present study. Furthermore, dietary changes might be larger in children and adolescents than in the present elderly population. The ICC of EPA and DHA in the present study was 0·42 and 0·60, respectively. Ma et al. (Reference Ma, Folsom and Eckfeldt9) reported long-term reliability (which corresponds to the ICC in the present study) of the FA composition in CE and plasma phospholipids measured 3 years apart in fifty subjects in the Atherosclerosis Risk in Communities study. While the ICC was 0·35 for EPA and 0·48 for DHA in CE, the corresponding ICC in plasma phospholipids were 0·51 and 0·46. Finally, Zeleniuch-Jacquotte et al. (Reference Zeleniuch-Jacquotte, Chajes and Van Kappel10) reported ICC in serum phospholipids of 0·64 (EPA) and 0·66 (DHA) in forty-six healthy women in the New York University Women's Health study. All these studies including the present study show moderate to substantial long-term reliability(Reference Landis and Koch31) of long-chain PUFA in phospholipids and CE, validating their use as a tool to describe disease–exposure relationships in prospective studies. Moreover, the long-term tracking of serum phospholipid EPA, DHA and the PLN3 index is in the same range as other well-known epidemiological lipid variables such as total cholesterol and TAG. In a recent study in healthy children aged from 7 to 11 years, ICC for total cholesterol and TAG were 0·55 and 0·57, respectively(Reference Kaitosaari, Simell and Viikari32). The same investigators have reported the percentage of children who remained in the same tertile of LDL particle size in the range of 37–55 % as compared with 32–53 % (EPA) and 31–57 % (DHA) in the present study (quartiles). In contrast, one study indicated only a fair tracking (Pearson's correlation coefficient between age-specific Z-scores, r 0·31) for long-chain n-3 PUFA. However, this was a small study (n 26) in a quite different population (subjects aged 2–5 years), using TLC to isolate the phospholipids(Reference Guerra, Demmelmair and Toschke11), and neither antioxidants nor nitrogen atmosphere has been reported to protect the PUFA against degradation during the phospholipid isolation steps(Reference Christie33, Reference Rouser, Kritchevsky and Yamamoto34).
There is an ongoing debate concerning which material (adipose tissue/serum/plasma, erythrocytes), lipid compartment (phospholipids/cholesteryl esters, total lipids) and FA marker (EPA/DHA/omega-3 index, PLN3 index) are the most suitable to reflect FA intake and effects(Reference Baylin and Campos3, Reference Harris24, Reference Baylin, Kim and Donovan-Palmer35, Reference Patel, Sharp and Jansen36). The answer depends on several factors, among them the availability and stability of samples, handling requirements and the time period of interest. While adipose tissue is considered a reliable marker of long-term FA intake(Reference Katan, Deslypere and van Birgelen37), sample acquisition disfavours it both in large epidemiological studies, as well as in diagnosing and counselling patients with suspected suboptimal dietary intake of essential FA. Blood samples are generally more available, and FA compositions in whole blood, serum, plasma and erythrocyte membranes all correlate with the dietary intake of marine n-3 FA as reported previously(Reference Ma, Folsom and Shahar1, Reference Baylin, Kim and Donovan-Palmer35, Reference Katan, Deslypere and van Birgelen37) and in the present study.
Another issue is how to present and use phospholipid FA concentrations when examining their effect on clinical outcomes. We measure total plasma phospholipid FA in absolute terms, i.e. mg FA/l plasma, and use these concentrations to assess long- and short-term variation of the GC method. The absolute FA concentrations reflect both the relative distribution of FA as well as changes in the phospholipid pool itself. We therefore use relative FA concentrations expressed as weight percentage in the statistical models to reduce confounding from phospholipid pool concentration changes. Accordingly, Bradbury et al. (Reference Bradbury, Skeaff and Green38) recently reported that relative FA concentrations of myristic and linoleic acid in serum CE and phospholipids predicted cholesterol concentrations, while absolute concentrations did not. In the present study, we find a correlation between the self-reported marine food frequency and EPA and DHA in plasma phospholipids of 0·47 and 0·44, respectively. Ma et al. (Reference Ma, Folsom and Shahar1) reported that the correlation coefficients between FA intake estimated by FFQ and EPA and DHA concentrations in plasma CE were 0·36 and 0·55, respectively, in 3570 subjects in the Atherosclerosis Risk in Communities study. Likewise, Baylin et al. (Reference Baylin, Kim and Donovan-Palmer35) found a correlation coefficient between FA intake estimated by FFQ and EPA and DHA in total plasma FA of 0·28 and 0·31, respectively. In the present study, the PLN3 index, EPA and DHA concentrations in plasma phospholipids showed similar correlations to self-reported marine food intake.
Harris & Thomas(Reference Harris and Thomas39) recently reported that the omega-3 index shows a lower within-subject variation and is less affected by meals when measured in erythrocytes compared with plasma total lipids or plasma phospholipids, concluding that erythrocytes may be the preferred material for assessing n-3 FA status. This is an important observation, but the observed lower variation might also reflect a stronger metabolic control of erythrocyte membrane FA composition. A strong metabolic control might partly override the impact of dietary intake on the index, and thereby limit the usefulness of erythrocyte membranes to assess dietary intake.
The present data support that the plasma phospholipid PLN3 index, similar to the omega-3 index in erythrocytes, is a valuable marker for dietary n-3 FA intake. The Norwegian population, especially the elderly, traditionally has had a high consumption of fish. This is a characteristic we share with other populations throughout the circumpolar north, where fish is abundant and is an important part of the diet. Harris(Reference Harris24) suggested a risk stratification based on the omega-3 index in erythrocytes where values above 8 % were classified to have a low risk, and those below 4 % to have a high risk of CHD. They also reported that the correlation between the omega-3 index in erythrocytes and in plasma phospholipids is higher than 0·9(Reference Harris and Von Schacky25). Using their reported correlation, the mean PLN3 index of 9·28 in the present study population corresponds to an omega-3 index of 12·4, and the omega-3 index decision limits 8·0 and 4·0 % corresponds to PLN3 indices of 4·8 and 0·69, respectively. Although the analytical method used in the present study and the method used by Harris(Reference Harris24) are not directly comparable, it confirms the high intake of long-chain marine FA in our population.
In the present study, the 3-year tracking of EPA showed a correlation coefficient of 0·47. While the correlation between the self-reported intake of marine foods and plasma phospholipid EPA measured simultaneously was equally high (r 0·47), the corresponding correlation between the self-reported intake of marine foods and plasma phospholipid EPA measured 3 years earlier was significantly lower (r 0·20). Altogether, these results suggest that other factors than dietary intake alone regulate the pharmacokinetics of dietary marine FA and how they are incorporated into plasma and cell membrane phospholipids. Several such factors have been described previously(Reference Corpeleijn, Feskens and Jansen12–Reference Oh da, Talukdar and Bae14, Reference Slagsvold, Thorstensen and Kvitland22, Reference Welch, Shakya-Shrestha and Lentjes40). Measurement of lipid FA concentrations does not have the methodological inaccuracies and bias inherent in dietary assessment methods. Analysing the attained concentration of the active substance in the body might therefore eliminate or reduce potential confounding effects of individual or genetic differences in the pharmacokinetics of these FA.
Harris & Thomas(Reference Harris and Thomas39) found a biological variation of EPA+DHA in plasma phospholipids of 13·9 %. They have reported from a controlled 6-week study of twenty healthy subjects who were on stable diets before and during the study period. We report long-term tracking from 214 subjects in a free-living Norwegian population, which could explain the larger biological variation of 26 % in the present study. It is not possible to determine whether the higher, long-term variation observed in the free-living population is due to changes in metabolism, dietary intake or other normally occurring lifestyle changes. Previous long-term studies on serum phospholipid FA concentrations in a free-living population have reported similar tracking and variation as we find in our diabetic population(Reference Moilanen, Rasanen and Viikari8–Reference Zeleniuch-Jacquotte, Chajes and Van Kappel10), and clearly higher than the short-term variation reported by Harris & Thomas(Reference Harris and Thomas39).
A limitation of the present study is that data on dietary intake were available for the diabetic patients only at the second follow-up. Although the Norwegian treatment standards concerning dietary intake of fish and fish oils are the same for newly diagnosed type 2 diabetics as for the general population, we cannot exclude that the study participants changed their diet between the first and second follow-ups. The first follow-up was 14 months (range 6–22) after the baseline screening. During this time interval, their diabetes had been controlled and treated by their general practitioner. Any major dietary changes are therefore likely to have occurred before blood sampling at the first follow-up. Furthermore, we compared the concentrations of EPA, DHA and the PLN3 index at the first follow-up in healthy controls matched for sex, age and municipality in a subset of 195 of the newly diagnosed diabetic patients. The mean differences (wt%) between healthy controls and diabetic patients of EPA, DHA and the PLN3 index were 0·04, 0·49 and 0·53, respectively (M Lindberg and KS Bjerve, unpublished results), suggesting that dietary intakes in the diabetic patients were similar to healthy controls during the initial treatment period before the first follow-up. This also suggests that the results are valid in non-diabetic persons.
Another limitation of the present study is the use of multiple testing of correlations between FA concentrations and dietary fish intake, which, in general, might lead to false conclusions. The reported P values should therefore be interpreted with caution. However, this should not affect the validity of the reported intra- and inter-individual CV, the RCV and the indices of individuality.
The index of individuality describes which effect a repeated measurement would have on reducing false-positive results when using reference limits as cut-off points(Reference Petersen, Sandberg and Fraser41). In the present study, the index of individuality for EPA, DHA and PLN3 index was 1·2, 0·9 and 1·0, respectively, implying that when EPA, DHA or the PLN3 index fall outside their reference limits, the fraction of false positives will be substantially reduced by repeating the measurement once. The index of individuality also reflects the probability of detecting changes in serial results when using RCV(Reference Iglesias, Petersen and Ricos42). The observed indices of individuality for EPA, DHA and the PLN3 index suggest that RCV have a limited value in detecting significant changes between two measurements made in the same patient approximately 3 years apart in a Norwegian population. RCV will probably be lower if the time between measurements is reduced, thereby reducing the patient variability of relevant lifestyle and therapeutic changes, including n-3 FA intake, drug intake and dietary advice between the two measurements. If the individual variability is reduced more than the population variability, the index of individuality will also be lower.
Table S1 (available online) shows RCV and indices of individuality for all n-3 and n-6 FA measured in these patients, but where the analytical variation is calculated from a diagnostic patient routine during 4 years from the beginning of 2008. The calculated RCV and index of individuality of EPA, DHA and the PLN3 index are quite similar to those calculated from the analytical variation observed at the start of the present study more than 20 years ago.
In summary, the biological variation, the RCV and the index of individuality of EPA, DHA and the PLN3 index are all in a range comparable with a large number of common clinical chemical analytes(Reference Fraser26, 43). The analytical precision of the present FA analytical method therefore seems to be well within quality specifications based on biological variation (CVa < 0·50 CVws). This is not necessarily true for all analytical methods. Especially, thin-layer separation of lipid classes could introduce other, potentially serious analytical errors.
With the increasing number of clinical and epidemiological studies using FA analysis as an objective measure of essential FA status, there is a definite need to establish generally available calibrators and control materials. This is a prerequisite for comparing FA analytical results between patients and between studies.
Supplementary material
To view supplementary material for this article, please visit http://dx.doi.org/10.1017/S0007114512002759
Acknowledgements
This study was supported by grants from the Norwegian Council for Cardiovascular Disease, the Norwegian Research Council and the Norwegian Diabetes Association. The skilled technical assistance of Merete Mack and Sylvia Nome Kvam (Department of Laboratory Medicine, Children's and Women's Health, Norwegian University of Science and Technology) is gratefully acknowledged. The HUNT Study is a collaboration between HUNT Research Centre (Faculty of Medicine, Norwegian University of Science and Technology NTNU), Nord-Trøndelag County Council and the Norwegian Institute of Public Health. K. S. B. and K. M. designed the research. M. L. performed the research and data analysis. All authors contributed to the writing of the paper. All authors read and approved the final manuscript. The authors declare that there are no conflicts of interest.


