





Child malnutrition, encompassing both undernutrition and overnutrition, persistently remains as one of the most critical global health challenges despite significant improvements in targeted nutritional interventions. According to the Joint Child Malnutrition Estimates by UNICEF, the WHO and the World Bank, an estimated 148·1 million children under 5 years of age were stunted, 45 million children were wasted and 340 million children were overweight as of 2022(1). The South Asian subregion carries a disproportionate burden of child malnutrition, with an approximately 8 percentage points higher stunting prevalence than the global average and almost twice the wasting rate (14·1 %) than the global average of 6·7 %(2). Alarmingly, more than half of the children worldwide experiencing wasting and severe wasting reside in South Asia(Reference Govindaraj, Premkumar and Sivasankar3).
In Bangladesh, child malnutrition remains a critical concern. The prevalence of stunting among children under 5 years of age was estimated to be 28·0 % in 2020, which was considerably higher than the regional average of 21·8 % in Asia. Although the prevalence of wasting slightly declined from 16·6 % in 2000 to 9·8 % in 2020, it remained above the regional average of 8·9 %(4). Over the past decade, Bangladesh has experienced a significant reduction in the prevalence of underweight children, from 39·8 % to 22·5 %(Reference Rahman, Alam and Ahmed5). However, the country is considered off-track in preventing the rising prevalence of overweight in children(4). Although Bangladesh has made considerable progress in reducing child malnutrition, continued efforts are required to address the remaining higher levels of stunting and wasting.
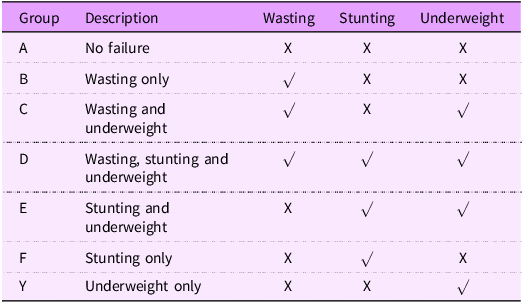
Children with multiple concurrent anthropometric deficits are at an elevated risk of morbidity and mortality(Reference McDonald, Olofin and Flaxman6). However, the overall burden of these overlapping deficits may not be fully captured by individual anthropometric indicators such as stunting, wasting and underweight, as they are not mutually exclusive and can exist together(Reference Al-Sadeeq, Bukair and Al-Saqladi7). The Composite Index of Anthropometric Failure (CIAF) combines three conventional anthropometric indices (underweight, stunting and wasting) for children under 5 years of age and is particularly effective at identifying children with multiple anthropometric failures (Table 1)(Reference Gausman, Kim and Li8). It was first introduced by Peter Svedberg in 2000 to estimate the overall prevalence of child nutritional status by combining these three standard indicators into a single index comprising six subgroups, from ‘A’ indicating no failure to ‘F’ denoting stunting only(Reference Svedberg9). Nandy et al. provided the first detailed CIAF estimates using data from the Indian National Family Health Survey (NFHS) in 2005, with the addition of a seventh subgroup, ‘Y’ for underweight only(Reference Nandy, Irving and Gordon10). In recent years, CIAF has gained increasing traction as a nutritional assessment tool for evaluating child malnutrition in Bangladesh. A study by Islam et al. (2019), one of the early applications of CIAF in Bangladesh, highlighted substantial levels of undernutrition with an estimated prevalence of 48·3 % (95 % CI (47·1 %, 49·5 %)) among children under 5 years of age.
Classification of Composite Index of Anthropometric Failure (CIAF) among under-five children

NAF, no anthropometric failure; CIAF, Composite Index of Anthropometric Failure.
NAF = A; CIAF = sum of B, C, D, E, F, Y.
CIAF offers a singular, comprehensive estimate of multiple overlapping anthropometric deficits, thereby mitigating the underestimation inherent in individual indicators. Since CIAF provides a single estimate, it captures a nuanced, composite picture of multiple overlapping anthropometric deficits, reduces the underestimation of varying levels of malnutrition in the population and aligns with Sustainable Development Goal 2.2, which aims to eradicate all forms of malnutrition by 2030(Reference Gupta, Sharma and Choudhary11,12) . Therefore, in specific nutritional evaluation settings requiring a more detailed assessment, CIAF can be a valuable complementary tool alongside conventional and globally established child nutrition indicators by WHO.
Despite multiple studies using conventional single anthropometric indicators using the previous Bangladesh Demographic and Health Survey (BDHS), Bangladesh’s most recent childhood CIAF estimates from BDHS 2022 have not yet been reported. In addition, a comprehensive trend analysis of childhood CIAF in Bangladesh over the years and its relevant covariates has yet to be explored. Therefore, this study aims to estimate trends in childhood CIAF prevalence, determinants and disparities in Bangladesh using data from five consecutive BDHS surveys. The findings from this study are expected to provide crucial insights into the overall burden of childhood multiple anthropometric failure in Bangladesh and how it changed over time, which, in turn, will inform more targeted and effective nutrition-related interventions to attain SDG 2.2.
Methods
Study design and sample
The present study utilised data from five rounds of the nationally representative cross-sectional BDHS conducted in 2007, 2011, 2014, 2017–2018, and 2022. Data are publicly accessible to registered users through the DHS website (www.dhsprogram.com). The surveys utilise a stratified, multi-stage (cluster), random sampling approach. Data on socio-economic, demographic, environmental and health characteristics of households was obtained by interviewing women aged 15–49 years, along with collecting the anthropometric measurements for children under 5 years of age. These nationally representative surveys collect data on population, health, nutrition and socio-economic indicators, emphasising maternal and child health. A standard questionnaire was used for data collection. Further details on methodology and findings are available in the respective BDHS reports(13–17).
This study was conducted based on a total of 32 096 children aged 0–59 months, comprising 5242 from 2007, 7683 from 2011, 7173 from 2014, 7877 from 2017–2018 and 4221 children from the 2022 BDHS, respectively (Figure 1). For the sampling frame classification, 2001 and 2011 population and housing censuses were used.
Study sample selection process.

Outcome measures and operational definitions
The primary outcome of the study was childhood undernutrition as represented by the CIAF, which was estimated using nutritional indicators of stunting, wasting and underweight. This assessment involved two steps. First, children were classified as stunted, wasted or underweight if their height-for-age, weight-for-height and weight-for-age fell below -2 sd, respectively, based on the WHO 2006 Growth Standards(18). All the BDHS datasets analysed in this study provide children’s height-for-age, weight-for-height and weight-for-age information based on this standard. In the subsequent step, stunted, wasted and underweight children have been aggregated to determine the overall proportion of undernutrition. This aggregation results in seven distinct categories of A to Y: (A) no failure; (B) wasting only; (C) wasting and underweight; (D) wasting, stunting and underweight; (E) stunting and underweight; (F) stunting only; and (Y) underweight only (Table 1). Therefore, a child is considered as undernourished if he or she is suffering from any anthropometric failure (B–Y) above, coded as ‘1’, and no anthropometric failure (A) coded as ‘0’(Reference Svedberg9).
Explanatory variables
The independent variables for childhood undernutrition were selected based on previous literature(Reference Sunuwar, Singh and Pradhan19–Reference Félix-Beltrán, Macinko and Kuhn21). These variables were classified into three categories according to UNICEF’s conceptual framework of malnutrition, including immediate (individual-level factors), underlying (household-level factors) and basic (community-level factors) determinants(22). The individual-level determinants included child characteristics (child age, sex, birth order, birth interval and diarrhoea in the 2 weeks preceding the survey) and parental characteristics (maternal age, education, nutritional status and father’s education). The household-level covariates included socio-economic status (SES) as measured by wealth quintiles. The community-level factors include the place of residence, division and survey year(13–17). Given the complexity in generating data on actual household income, BDHS constructed household SES from selected key household assets. The SES was computed by using principal component analysis, which assigns weights or factor scores to various indicators, and then standardises and sums for each household. The entire sample was subsequently ranked and divided into five equal groups, known as wealth quintiles, ranging from the first quintile (Q1, representing the poorest 20 %) to the fifth quintile (Q5, representing the richest 20 %)(Reference Rutstein and Johnson23).
Data management and analysis
All statistical analyses were performed in Stata version 17.0 (StataCorp). Prior to analysis, influential outliers and missing observations were identified and excluded (Figure 1). The socio-demographic characteristics of the children were calculated by the use of descriptive statistics such as frequencies and proportions. Cross-tabulation was also applied for measuring the prevalence of CIAF concerning the independent variables. The association between independent and outcome variables was analysed using multivariate logistic regression analysis. Multi-collinearity diagnostic test was applied between the independent variables before logistic regression analysis. Decisive criteria were set out at a variance inflation factor value of < 5, and only variables within this limit were included in the multivariate logistic regression. Adjusted OR (AOR) with its corresponding 95 % CI was computed using multivariate logistic regression to identify the factors associated with childhood CIAF. The significance level in all analyses was set based on P-value and 95 % CI, with a threshold set at P < 0·05 (two-tailed). Sampling weights were utilised to adjust for unequal recruitment probabilities and ensure nationally representative estimates. To control the effect of the complex survey design, all the analyses of this study were performed using Stata’s ‘svy’ command.
Concentration index and concentration curve
Econometric analysis was carried out using concentration index (CCI) and concentration curve (CC). CCI measured the inequality of outcome variables (CIAF) across SES, residence and parental education. The index ranges from − 1 to + 1, where the index value of 0 shows no inequality, and larger absolute values reflect greater inequality concentration(Reference Kakwani, Wagstaff and Van Doorslaer24). The CC is obtained by plotting the cumulative proportion of CIAF on y-axis against the increasing percentage of the population ranked by the socio-economic indicator (e.g. SES) on x-axis. A curve above the line of equality (45-degree line) indicates negative CCI values, suggesting disproportionate concentration among the poor, and vice versa(Reference Kakwani, Wagstaff and Van Doorslaer24). We used Stata commands ‘conindex’ and ‘clorenz’ to measure the CCI and to plot the CC, respectively.
Result
Estimated prevalence of childhood Composite Index of Anthropometric Failure
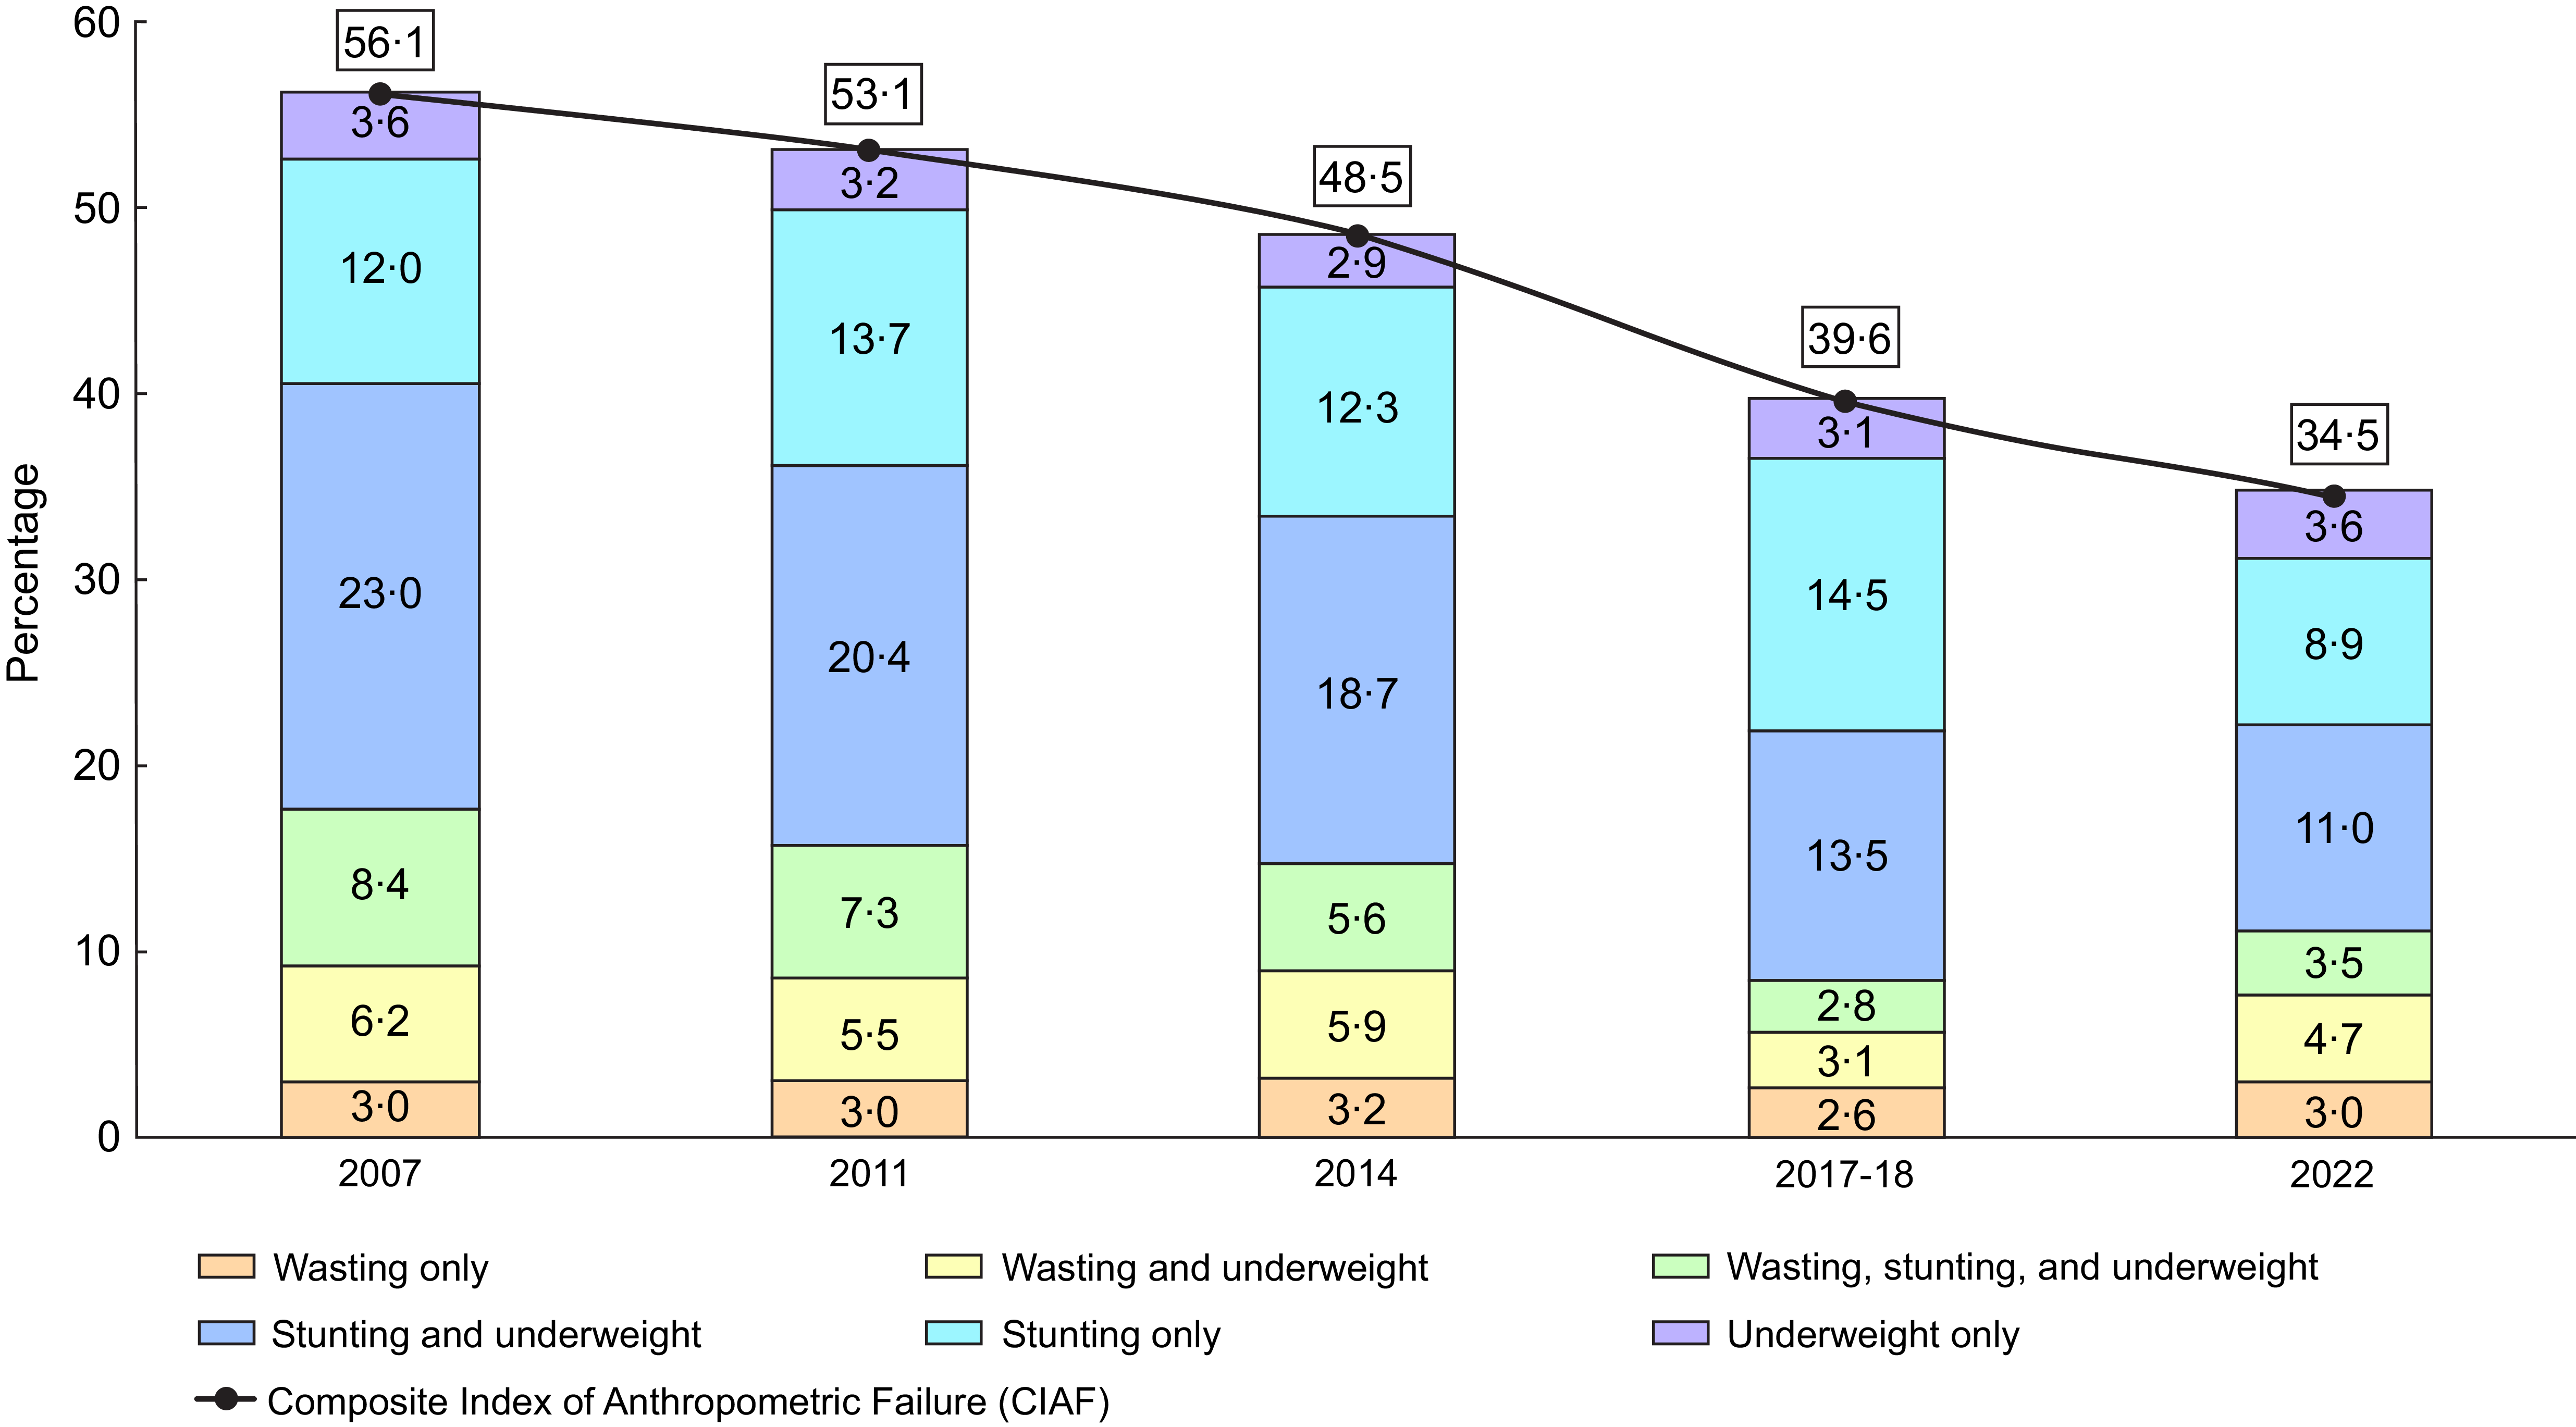
Figure 2 illustrates the trends in overall undernutrition status as measured by CIAF status among under-five children from 2007 to 2022. Childhood CIAF has shown a consistent decline over the periods. It decreased from 56·1 % in 2007 to 53·1 % in 2011, further dropping to 48·5 % in 2014, 39·6 % in 2017–2018 and finally reaching 34·5 % in 2022. The significant reduction in ‘stunting and underweight’ from 23 % (95 % CI: 22, 24) in 2007 to 11 % (95 % CI: 10, 12) in 2022 was a major contributor to the decrease in childhood CIAF. The prevalence of ‘only wasting’ (3·0 %) and ‘only underweight’ (3·6 %) remained unchanged between 2007 and 2022, while only stunting showed a slight decrease from 12 % in 2007 to 8·9 % in 2022.
Trends in childhood CIAF in Bangladesh, 2007–2022. CIAF, Composite Index of Anthropometric Failure.

Additionally, the distribution of under-five undernutrition based on the seven categories of CIAF classification has been summarised in online supplementary material, Supplemental Table 1. In 2007, 56·1 % of the children had one or more forms of CIAF, with stunting (43·4 %), wasting (17·6 %) and underweight (41·1 %). Over time, the prevalence of all anthropometric measures showed a decline, except for wasting and underweight in 2017–2018. By 2022, stunting was observed among 23·4 % of children, wasting in 11·2 % and underweight in 22·6 % (see online supplementary material, Supplemental Figure 1).
Distribution of childhood Composite Index of Anthropometric Failure across socio-demographic and economic characteristics
A total of 32 096 under-five children were included to determine the prevalence, factors and inequity. Among the under-five children, the distribution of age remained relatively similar over the years. The proportion of children living in urban areas has gradually increased from 21·0 % in 2007 to 26·0 % in 2022. The detailed background characteristics of the participants are illustrated in online supplementary material, Supplemental Table 2.
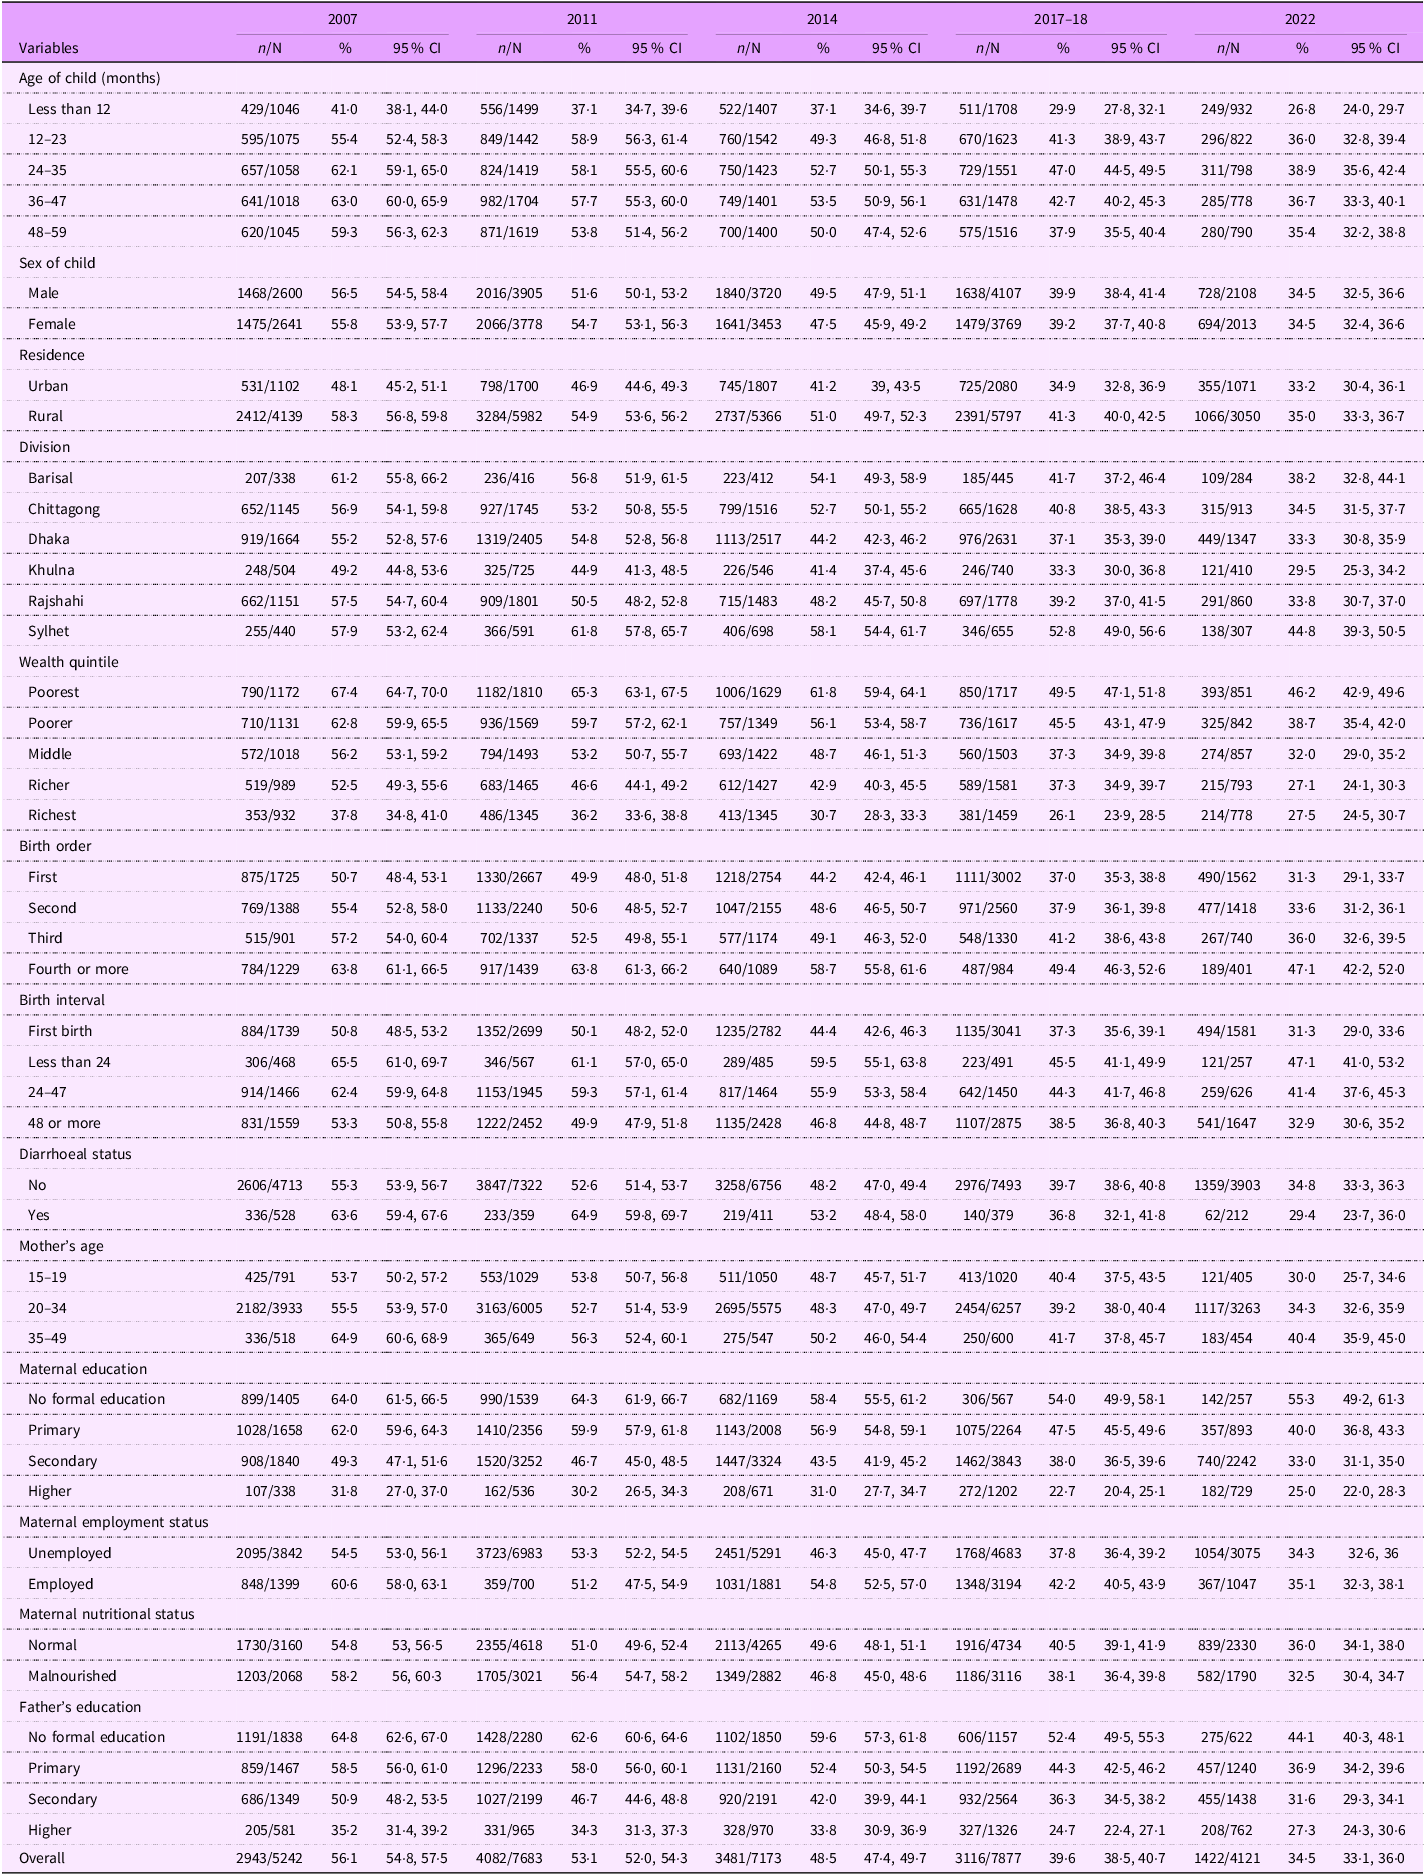
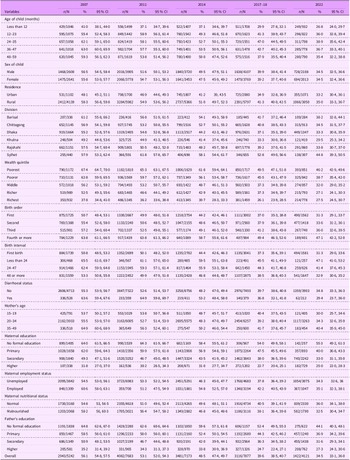
Table 2 presents the estimated prevalence of childhood CIAF across socio-economic and demographic characteristics. The prevalence of CIAF declined over time across most factors, with consistent reductions in all age groups and both sexes. Among children aged less than 12 months, the prevalence of CIAF decreased substantially from 41·0 % in 2007 to 26·8 % in 2022. The CIAF remained higher among rural children, those in lower wealth quintiles, children of uneducated parents and those with higher birth orders. Rural areas consistently demonstrated higher CIAF rates than urban areas, though the rural–urban gap decreased from 10·2 % in 2007 to 1·8 % in 2022. Children born after short birth intervals (< 24 months) consistently had the highest rates of CIAF from 65·5 % in 2007 to 47·1 % in 2022. In terms of SES quintiles, CIAF prevalence among the poorest quintile declined from 67·4 % in 2007 to 46·2 % by 2022, while in the richest quintile this statistic decreased from 37·8 % to 27·5 %. Children from older mothers (35–49 years) had higher CIAF rates in 2007, 2011 and 2022. Children of mothers with no formal education exhibited the highest CIAF rates, decreasing from 64·0 % in 2007 to 55·3 % in 2022. Similarly, in 2022, the prevalence of CIAF among children of fathers with no formal education was 44·1 %, compared to 27·3 % among those whose fathers had attained higher education. Children born to malnourished mothers or those who experienced diarrhoea had higher CIAF prevalence, although the estimates for both conditions declined over time (Table 2).
Prevalence of childhood CIAF by socio-demographic and economic characteristics in Bangladesh from 2007 to 2022
CIAF, Composite Index of Anthropometric Failure.
Factors associated with childhood Composite Index of Anthropometric Failure
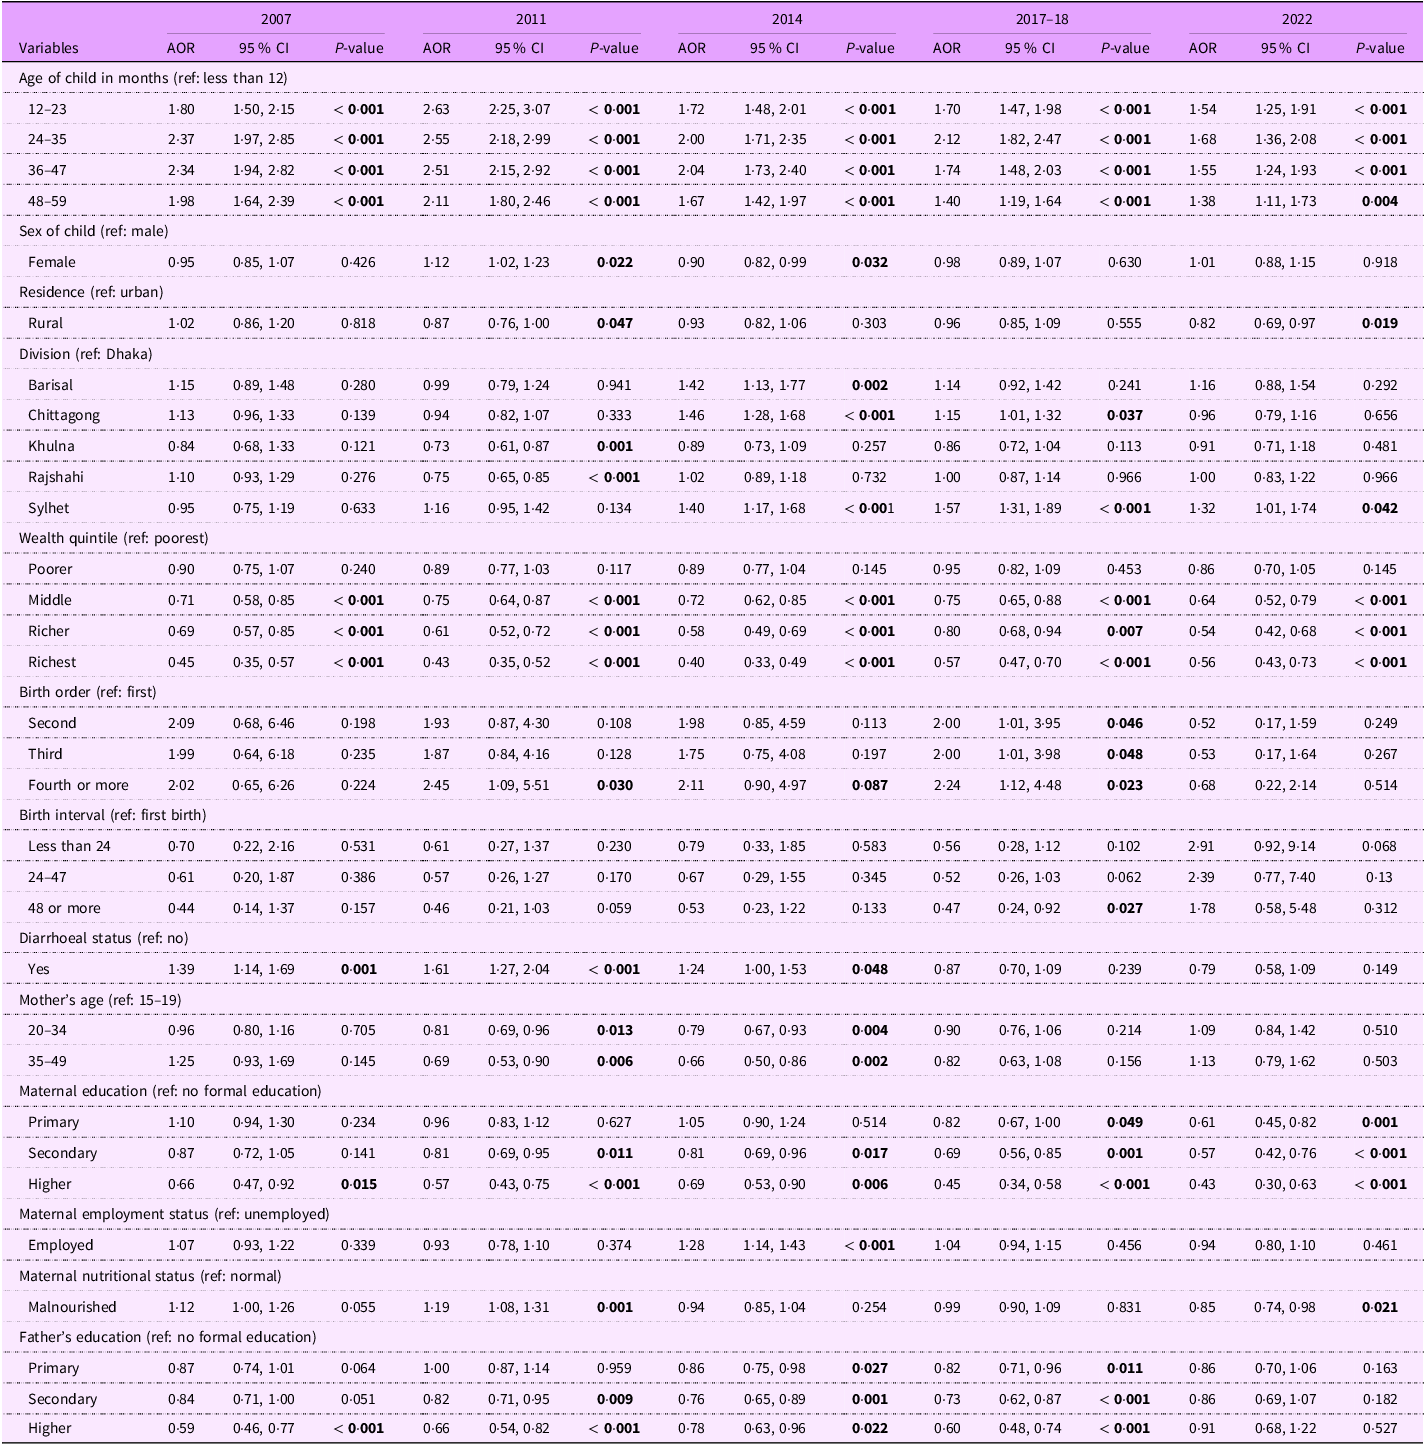
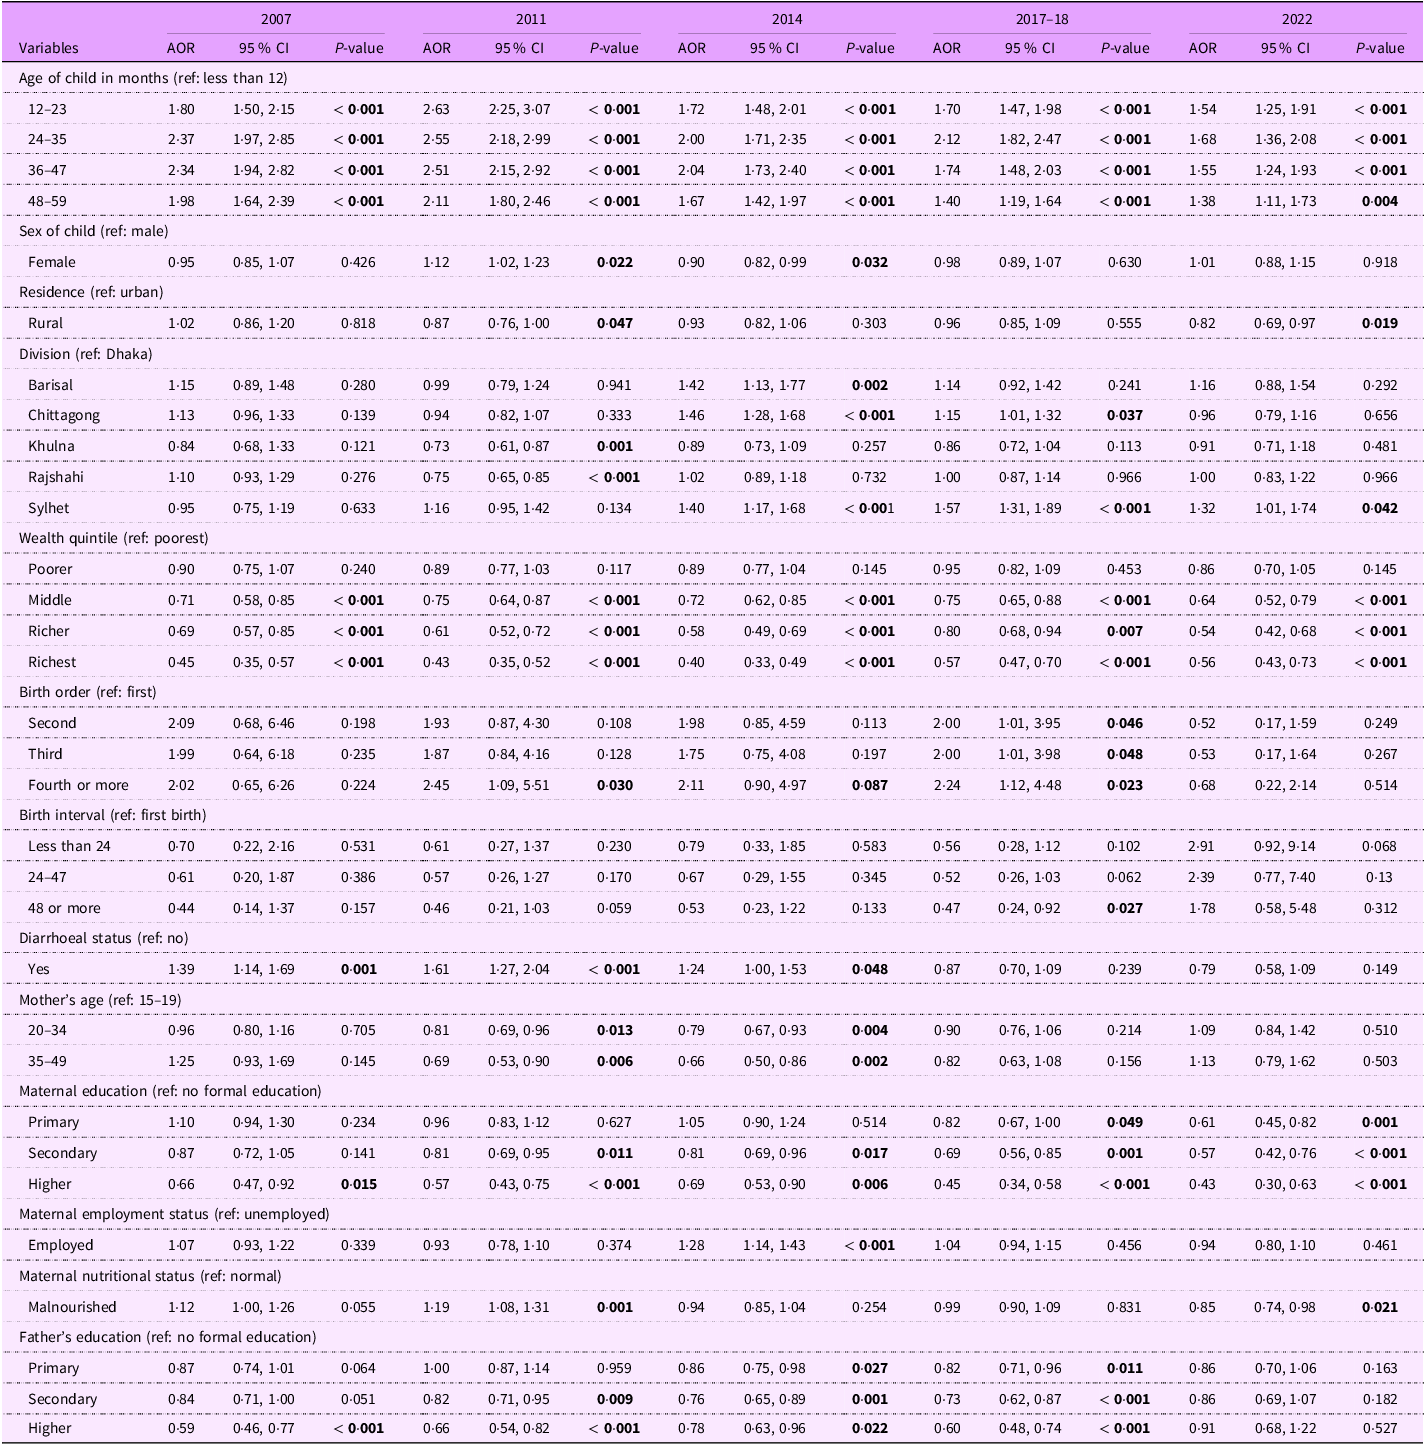
Table 3 presents AOR from multivariate logistic regression models assessing factors associated with childhood CIAF from 2007 to 2022. Child’s age, household SES and maternal education were consistently significant predictors across all survey periods. Children of all age groups between 12 and 59 months exhibited significantly higher odds of CIAF compared to those under 12 months. Sex differences were also observed in different periods. In 2014, female children possessed 10 % (AOR: 0·90, 95 % CI: 0·82, 0·99) lower odds of CIAF compared to male children. However, in 2011, female children were 12 % (AOR: 1·12, 95 % CI: 1·02, 1·23) more likely to be undernourished than their male counterparts. Regarding household SES, an inverse association was observed between household SES and childhood CIAF. Compared to children from the poorest households, those from the richest quintile had significantly lower odds of CIAF. Compared to children living in households with the poorest SES, the odds of being CIAF among children living in households with the richest SES were decreased by 55 % in 2007, 57 % in 2011, 60 % in 2014, 43 % in 2017–2018 and 44 % in 2022. Birth interval was also significantly associated with childhood CIAF in 2011, 2017–2018 and 2022. In addition, higher levels of maternal education were consistently associated with lower CIAF prevalence, with the greatest reduction observed among mothers with secondary or higher education. The odds of being CIAF among under-five children whose mothers attended higher education were 34 % (AOR: 0·66, 95 % CI: 0·47, 0·92), 43 % (AOR: 0·57, 95 % CI: 0·43, 0·75), 31 % (AOR: 0·69, 95 % CI: 0·53, 0·90), 55 % (AOR: 0·45, 95 % CI: 0·34, 0·58) and 57 % (AOR: 0·43, 95 % CI: 0·30, 0·63), less compared to children whose mother had no formal education in 2007, 2011, 2014, 2017–2018 and 2022, respectively. Mother’s nutritional status and father’s education were also significantly associated with childhood CIAF during multiple survey periods (Table 3).
Estimated adjusted OR (AOR) for multivariate logistic regression models of childhood CIAF
CIAF, Composite Index of Anthropometric Failure.
Bold P-values denote statistically significant values.
Estimated inequalities in childhood Composite Index of Anthropometric Failure
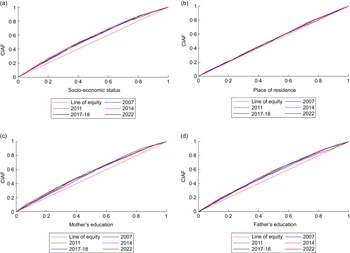
Figure 3 and online supplementary material, Supplemental Table 3A-3D, illustrate persistent inequalities in childhood undernutrition as measured by CIAF by household SES, residence and parental education. CC for all survey years lay above the equality line, indicating a disproportionate burden of CIAF among disadvantaged groups. This pattern is confirmed by consistently negative CCI values, reflecting greater CIAF prevalence among children from lower SES households, rural residence and parents with lower levels of education. Socio-economic inequality remained notable, with CCI values ranging from –0·220 (2007) to –0·175 (2022), peaking in 2014 (–0·241), though modest improvements followed. Residence-based disparities also declined, with CCI improving from –0·068 (2007) to –0·015 (2022), despite a peak in 2014 (–0·074). For maternal education, CIAF remained concentrated among less-educated mothers (CCI: –0.184 in 2007 to –0.153 in 2022), highest in 2011 (–0.204). Similar trends were observed for paternal education, with all CCI values negative, indicating consistent inequality. Overall, while disparities persist, recent data suggest a gradual reduction in undernutrition-related inequities over time. The pro-poor inequality in CIAF was statistically significant for all four factors – SES, residence, mother’s education and father’s education – across all years, with the exception of residence in 2022, where the difference between urban and rural children was no longer significant.
Disparities in childhood CIAF disaggregated by (a) socio-economic status, (b) place of residence, (c) mother’s education and (d) father’s education in Bangladesh (2007 to 2022). CIAF, Composite Index of Anthropometric Failure.

Discussion
This study presents novel estimates on the prevalence, contributing factors and disparities related to childhood undernutrition by aggregating conventional undernutrition indicators and applying them to the BDHS dataset. Our findings suggest that individual measures of stunting, wasting and underweight underestimate the overall burden of undernutrition. Furthermore, prevalence estimates cannot be added to fully capture the extent of undernutrition, as children often present with multiple anthropometric deficits. The use of CIAF allows for the identification of all undernourished children, providing a comprehensive estimate of the undernutrition burden within a population(Reference Gupta, Sharma and Choudhary11). The present study employed the CIAF for the first time to provide a comprehensive assessment of undernutrition among children under 5 years of age in Bangladesh over a 15-year period (2007–2022). The results show that the prevalence of undernutrition, presented as childhood CIAF, has declined steadily throughout the study periods. Factors such as child’s age, household SES and mother’s education were significantly associated with childhood CIAF across all study periods, while various other factors contributed to CIAF during specific time frames. CIAF was found to be more prevalent among children from the poorest wealth quintile, those living in rural areas and those with lower parental education levels; however, these inequities considerably declined over time.
Even though the prevalence of childhood undernutrition based on CIAF in Bangladesh has significantly decreased from 56 % to 35 % over time, it remains higher than in countries such as China (22 %)(Reference Pei, Ren and Yan25) and Yemen (21 %)(Reference Al-Sadeeq, Bukair and Al-Saqladi7), and it is lower than in studies conducted in India (48 %)(Reference Kundu, Hossain and Haque26), Ethiopia (49 %)(Reference Endris, Asefa and Dube27), Tanzania (38 %)(Reference Khamis, Mwanri and Kreppel28) and Malawi (57 %)(Reference Ziba, Kalimbira and Kalumikiza29). Two studies conducted in Bangladesh reported that the overall prevalence of undernutrition among children under 5 years of age, as assessed by childhood CIAF, was 48 % in 2014(Reference Islam and Biswas30) and 52 % in 2021(Reference Chowdhury, Khan and Mondal31), respectively. The Government of Bangladesh targets to decrease the stunting burden to 25 % by the end of 2025. Implementing a comprehensive community-based intervention programme is crucial for effectively addressing undernutrition(Reference Islam and Biswas32). Our research findings align with previous studies indicating that undernutrition is more prevalent among rural children under 5 years of age compared to their urban counterparts. However, similar urban–rural disparities in undernutrition have not been consistently documented in other developing countries, except for India and Bangladesh(Reference Akram, Sultana and Ali33,Reference Rahman and Rahman34) . A community-based study in Bangladesh found that undernutrition affects 48 % of children in rural areas and 58 % in urban areas(Reference Rahman and Rahman34) in 2014. Similarly, in India, the prevalence of undernutrition, as measured by CIAF, was 54 % in urban regions and 64 % in rural regions(Reference Islam and Biswas32). Urban areas in Bangladesh have seen significant progress in recent years, including universal primary education, improved SES, better maternal healthcare, enhanced transportation and increased nutrition awareness, contributing to improved urban nutritional status(Reference Das, Chisti and Malek35). In contrast, rural areas have also experienced substantial progress, with more than a two-thirds reduction of CIAF, reflecting nationwide improvements in health and nutrition programmes. Despite these gains, rural children continue to exhibit slightly higher CIAF rates compared with their urban counterparts in earlier survey years, likely due to slower development in infrastructure, access to healthcare and nutrition-related awareness(Reference Anik, Chowdhury and Khan36).
The present study explored that children under 12 months demonstrated lower odds of childhood CIAF compared to older children. This finding aligns with studies conducted in different countries like Tanzania(Reference Khamis, Mwanri and Kreppel28) and Yemen(Reference Al-Sadeeq, Bukair and Al-Saqladi7). This trend may be attributed to younger children often receiving a more nutritious and balanced diet during early life stages, but as a child grows older, the discontinuation of breast-feeding and increased nutritional demands could contribute to higher vulnerability to malnutrition(Reference Fenta, Zewotir and Muluneh37). Additionally, younger children often receive greater attention and feeding effort from parents compared to their older siblings(Reference Fenta, Zewotir and Muluneh37). Furthermore, this study reveals that children from lower-income households are more likely to be affected by the CIAF compared to their higher-income counterparts. These findings are consistent with previous studies conducted in Ethiopia(Reference Endris, Asefa and Dube27) and Malawi(Reference Ziba, Kalimbira and Kalumikiza29). Our findings also align with previous studies conducted in other developing countries(Reference Islam and Biswas32,Reference Akombi, Agho and Merom38) . This might be because the wealthiest households afford to purchase diverse and sufficient food supplies and have greater access to healthcare services, whereas poorer households face limitations in securing these necessities, contributing to undernutrition among children. Additionally, the analysis revealed that male children consistently had higher odds of being malnourished compared to their female counterparts in multiple survey periods. This underscores the role of gender in childhood undernutrition in Bangladesh and highlights the need for sex-specific nutritional interventions to promote optimal child growth and development. This finding is also consistent with a recent global systematic review and meta-analysis of forty-four studies, which reported a higher risk of stunting, wasting and being underweight among boys compared to girls(Reference Thurstans, Opondo and Seal39). Additionally, this study also aligns with pooled evidence from studies conducted between 2008 and 2020 across thirty-five sub-Saharan African countries, which reported that male children had higher odds of malnutrition(Reference Takele, Gezie and Alamneh40). This is also consistent with previous findings in India(Reference Sinha, Dua and Bijalwan41) and Ghana(Reference Ali, Saaka and Adams42). Similarly, prior studies in Ethiopia(Reference Sewenet, W/Selassie and Zenebe43) and different low-income settings such as Kenya(Reference Masibo and Makoka44), Tanzania(Reference Khamis, Mwanri and Kreppel28) and Indonesia(Reference Torlesse, Cronin and Sebayang45) have reported that being underweight is the most common undernutrition problem among boys compared to girls. This disparity is often attributed to biological growth patterns and the higher morbidity vulnerability of males in early infancy(Reference Svefors, Rahman and Ekström46). Besides, there is a perception that girls are less affected by environmental stress than boys(Reference Wamani, Åstrøm and Peterson47). According to our findings, caesarean delivery was associated with a lower likelihood of CIAF, consistent with findings from an Indian study(Reference Kundu, Hossain and Haque26). Furthermore, we also found that childhood CIAF is significantly associated with maternal and paternal education. Children of lower-educated parents faced higher odds of CIAF than those with higher-educated parents. Consistent with studies in Tanzania(Reference Khamis, Mwanri and Kreppel28) and India(Reference Kundu, Hossain and Haque26), maternal education was positively associated with improved child nutritional status. A Bangladeshi study conducted in 2020 also demonstrated that children of mothers with secondary or higher education experienced less growth failure(Reference Islam and Biswas32). Educated mothers are better equipped to adopt essential nutrition and hygiene practices and utilise information from educational resources and media, contributing to reduced anthropometric failures(Reference Seboka, Hailegebreal and Yehualashet48). Similarly, fathers with formal education likely possess greater knowledge of proper child feeding and hygiene practices, which positively influence child nutrition outcomes. This finding aligns with previous studies conducted in sub-Saharan Africa(Reference Khamis, Mwanri and Kreppel28,Reference Bain, Awah and Geraldine49) . Fathers with formal education might be more knowledgeable on appropriate child feeding and hygiene practices, contributing positively to the prevention of malnutrition and associated failures.
The present study also highlighted significant socio-economic-, residence- and education-related inequalities in childhood CIAF from 2007 to 2022. The CC consistently lying above the equity line indicate that CIAF is disproportionately concentrated among disadvantaged groups, with children from the poorest households, rural residence and lower-educated parents. The persistent negative CCIs underscore enduring socio-economic inequalities, with children from the poorest households continuing to bear a disproportionate burden of CIAF. Although 2014 marked the peak of socio-economic- and residence-related inequality, and 2011 marked the peak of education-related inequity, subsequent years show slight improvement, suggesting progress in reducing disparities. However, substantial inequalities remain. Contrary to our findings, a community-based study in Bangladesh indicated that socio-economic disparities in stunting have increased over time from 2007 to 2014(Reference Chowdhury, Khan and Mondal31). Meanwhile, a global systematic review found that the relative gap in CIAF prevalence between the poorest and richest quintiles has decreased in low- and middle-income countries, including Bangladesh(Reference Vollmer, Harttgen and Kupka50). This could be attributed to the Government of Bangladesh’s targeted poverty reduction initiatives, such as the Social Safety Net Programmes (SSNP), as well as international collaborations with the World Food Programme and the FAO, which have improved access to nutrition, healthcare and education for vulnerable populations. These sustained efforts may have contributed to narrowing disparities and reducing inequality in recent years(Reference Rahman, Alam and Ahmed5). Additionally, rural–urban disparities in child CIAF persist, with rural children facing higher rates. However, the disparities narrowed over the periods, reflecting reduced inequity and the impact of targeted interventions. Furthermore, the consistently negative CI values for maternal and paternal education suggest that children of less-educated parents are more likely to experience CIAF, emphasising the need for policies that promote parental education, particularly among marginalised populations. To address these inequalities, socio-economic support programmes, rural-focused health initiatives and education campaigns for parents are required. These measures are essential to reduce disparities and improve child nutrition outcomes in Bangladesh.
Strengths and limitations
To our knowledge, this study is the first of its kind that systematically investigates socio-economic inequality in childhood undernutrition prevalence using CIAF across multiple time periods for which comparable data are available. Additionally, we utilised the WHO child growth standard to measure the nutritional indicators stunting, wasting and underweight which are the basis for calculating CIAF. The further strength is that the data were collected from across the country, ensuring a nationally representative sample. In addition, using a nationwide population-based dataset provides a large sample size, enhancing the reliability and generalisability of the findings. Additionally, five consecutive surveys data provided a comparison of the findings over time. Furthermore, the application of UNICEF’s conceptual framework on the underlying causes of malnutrition facilitated a more precise assessment of the factors contributing to its burden. Several limitations should also be considered: first, since this study was based on cross-sectional data, it cannot establish a causal relationship between outcome and independent variables. Another limitation involves that the BDHS data were collected retrospectively and based on self-reporting, which may introduce underreporting, information bias and recall bias.
Conclusion
This study highlights a comprehensive overview of trends in under-five undernutrition as measured by childhood CIAF in Bangladesh from 2007 to 2022. The findings reveal a significant decline in childhood CIAF in Bangladesh during this period, with a significant reduction in ‘stunting and underweight’. CIAF was significantly associated with child age, sex, SES and parental education. Although socio-economic-, residence- and education-related inequalities in CIAF persisted, their magnitude decreased over time. To further reduce inequities in undernutrition, it is essential to design and implement evidence-based, targeted and multisectoral strategies. In line with SDG 2.2, policymakers should prioritise integrated nutrition and health interventions to lower CIAF prevalence.
Supplementary material
For supplementary material accompanying this paper visit https://doi.org/10.1017/S1368980026101931
Acknowledgements
The authors are thankful to the USAID’s DHS programme and the National Institute of Population Research and Training (NIPORT), Bangladesh, for providing access to the BDHS dataset. icddr,b is also grateful to the Governments of Bangladesh and Canada for providing unrestricted/institutional support.
Financial support
This research protocol/activity/study was funded by the Department of Foreign Affairs, Trade and Development (DFATD), through Advancing Sexual and Reproductive Health and Rights (AdSEARCH), grant number: SGDE-EDRMS-#9926532, Purchase Order 7428855, Project P007358.
Competing interests
The authors declare that they have no competing interest.
Authorship
Conceptualisation: A.S. and N.S. Data curation: A.S. and N.S. Formal analysis: A.S., N.S. and E.A. Writing – original draft: A.S., N.S. and Ai.Ar. Writing – review and editing: E.A., H.R.M., L.H., S.R., F.R., S.E.A., A.E.R., A.A. and S.M.R. Supervision: S.E.A., A.E.R., A.A. and S.M.R. A.S. and N.S. revised the manuscript in response to comments from all co-authors and addressed all feedback from the journal editor and peer reviewers. All authors have read and agreed to the published version of the manuscript.
Ethics of human subject participation
The study utilised datasets from the publicly available USAID’s Demographic Health Survey (DHS) programme after obtaining approval through formal registration on their website. Informed consent was not necessary because secondary data analysis did not involve interaction with the participants. The DHS strictly maintains the privacy and confidentiality of all the respondents. Additionally, the BDHS were reviewed and approved by the ICF Macro Institutional Review Board (USA) and the Ministry of Health and Family Welfare (MoHFW) of Bangladesh before data collection. Therefore, no additional ethical approval was required. Ethical considerations regarding potential estimation errors were also strictly maintained.
Data availability
The data underlying the results presented in the study are publicly accessible and available from the DHS website (http://dhsprogram.com/data/availabledatasets.cfm). The database has been accessed under a formal request and used exclusively for research purposes. The DHS had no role in the study design and data analysis. Additionally, de-identified data of the present analysis can be available from the corresponding author on reasonable request.
Consent for publication
Not applicable.



 Open access

