





1. Introduction
The disappearance of Glaciar Chacaltaya, located in the Cordillera Real of Bolivia, was already apparent by the turn of the 21st century. Like most glaciers in the tropics, it had been retreating for decades when Ramírez and others (Reference Ramírez2001) predicted it would vanish within the next 10–15 years. Glaciar Chacaltaya disappeared even sooner, vanishing within eight years (by 2009) (Zemp and others Reference Zemp, Nussbaumer, Gärtner-roer, Hoelzle, Paul and Haeberli2011). Its demise may foreshadow the fate of many glaciers in the Cordillera Real.
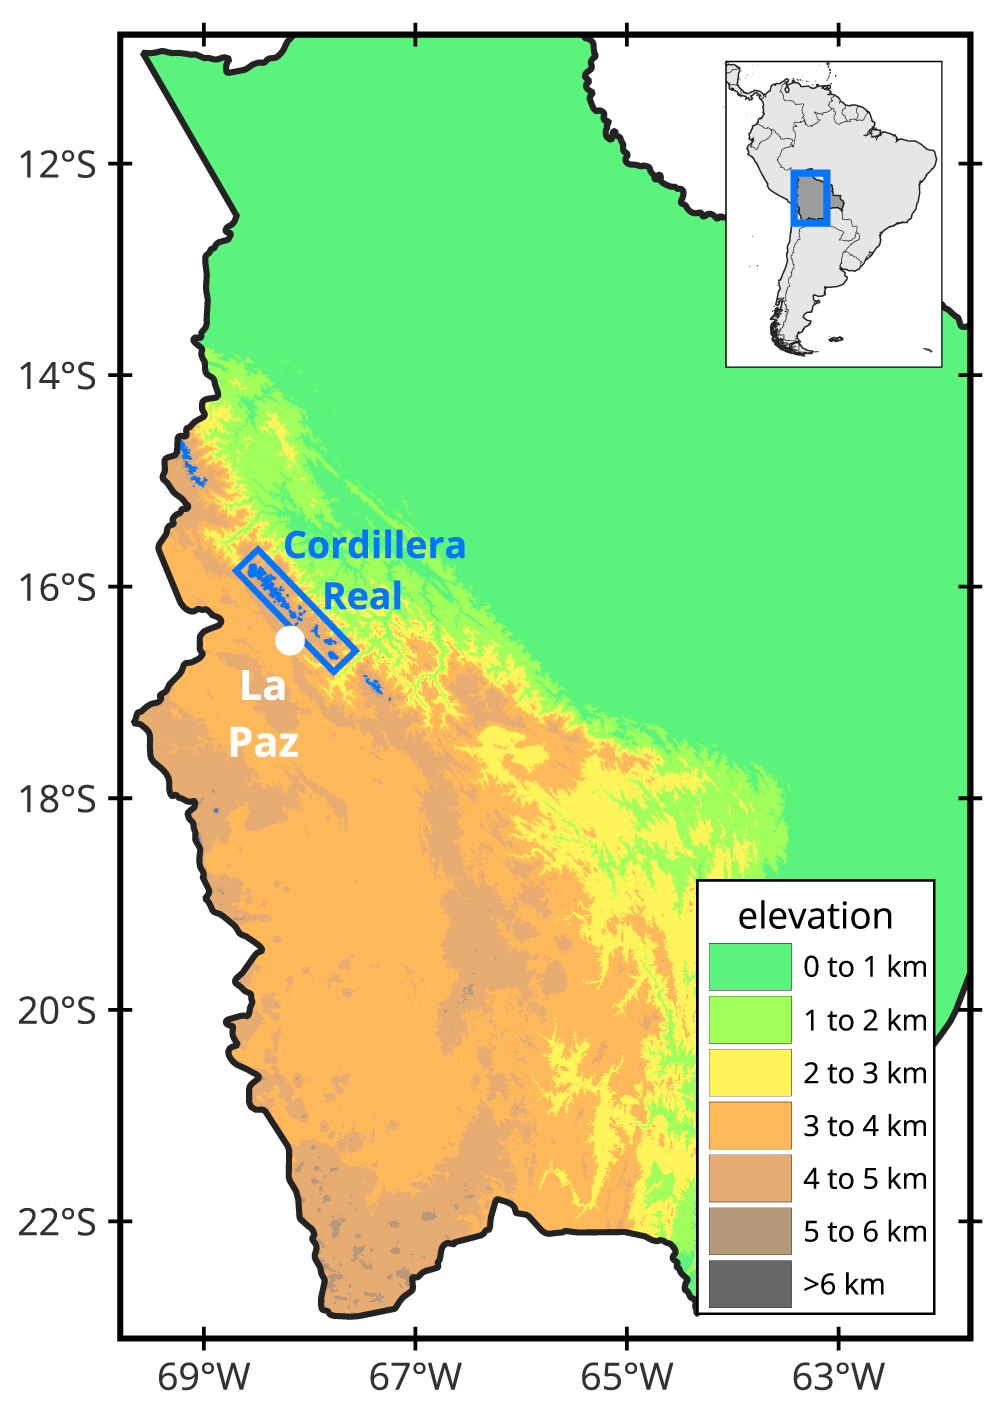
The Cordillera Real is one of the major glacierized ranges in the tropics (Fig. 1). It had 207.32 km2 of glacierized area in 1998, accounting for over 10.8% of the low-latitude glacier area within the Randolph Glacier Inventory version 7.0 (RGI 7.0 Consortium, 2023; hereafter RGI 7.0). Its glaciers experience an outer tropical climate, with small thermal seasonality but a distinct wet season (October to March) and dry season (May to September) (Sagredo and Lowell, Reference Sagredo and Lowell2012; Rabatel and others, Reference Rabatel2013). Meltwater runoff from glaciers in the Cordillera Real is important for downstream communities (Bradley and others, Reference Bradley, Vuille, Diaz and Vergara2006; Schoolmeester and others, Reference Schoolmeester, Johansen, Alfthan, Baker, Hesping and Verbist2018), particularly during the dry season when it helps buffer streamflow (Ribstein and others, Reference Ribstein, Tiriau, Francou and Saravia1995; Vuille and others, Reference Vuille2008). For La Paz, the administrative capital of Bolivia, meltwater from glaciers provides 15% of the annual water supply and 27% during the dry season (Soruco and others, Reference Soruco2015). Its water supplies are predicted to decrease by 12% annually and by 24% during the dry season if the glaciers in the Cordillera Real vanish (Soruco and others, Reference Soruco2015).
Setting of the glaciers in the Cordillera Real. Blue shading indicates glacier extents from the RGI 7.0 for Bolivia. The inset map shows the map region in the context of South America. The background map is the elevation from the SRTM GL1 DEM.
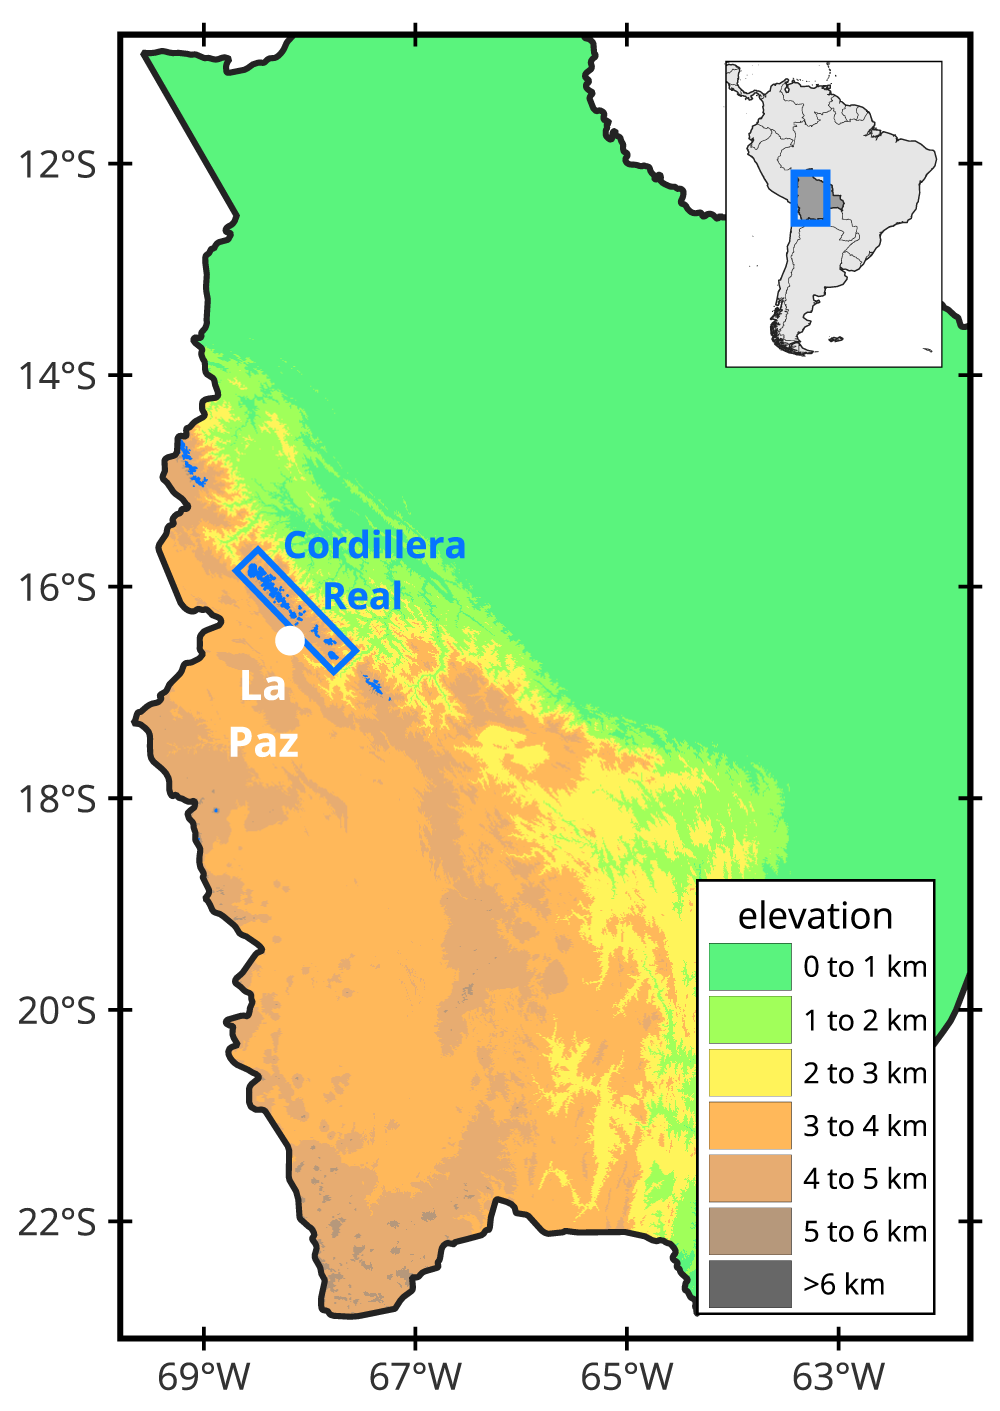
Figure 1 Long description
The map of Bolivia displays elevation ranges with a legend indicating heights from 0 to over 6 km. The Cordillera Real is highlighted in blue, located in the western part of the country. Elevation categories are as follows: 0 to 1 km, 1 to 2 km, 2 to 3 km, 3 to 4 km, 4 to 5 km, 5 to 6 km and over 6 km. The map shows lower elevations in the eastern region and higher elevations in the west, particularly around the Cordillera Real. La Paz is marked with a white dot, situated near the Cordillera Real. An inset map shows the location of Bolivia within South America.
Glaciers in the Cordillera Real are rapidly retreating (Soruco and others, Reference Soruco, Vincent, Francou and Gonzalez2009; Cook and others, Reference Cook, Kougkoulos, Edwards, Dortch and Hoffmann2016; Veettil and others, Reference Veettil, Wang, Simões and Pereira2018; Seehaus and others, Reference Seehaus, Malz, Sommer, Soruco, Rabatel and Braun2020; Huang and Kinouchi, Reference Huang and Kinouchi2024; Adrianzen and Malone, Reference Adrianzen and Malone2026) and are vulnerable to total loss (Ramírez and others, Reference Ramírez2001). More than 80% are smaller than 0.5 km2 (RGI 7.0), a widely used threshold for small glaciers in this region (e.g., Ramírez and others, Reference Ramírez2001; Seehaus and others, Reference Seehaus, Malz, Sommer, Soruco, Rabatel and Braun2020), where edge effects can enhance ablation (Vuille and others, Reference Vuille2008). Furthermore, over 60% of these small glaciers have maximum elevations below 5400 m (RGI 7.0), a threshold for tropical glaciers associated with more negative mass balances and greater vulnerability to vanishing (Rabatel and others, Reference Rabatel2013). Accordingly, this study defines small glaciers as having an area <0.5 km2 and low-lying glaciers as having a maximum elevation <5400 m. Despite the prevalence of these vulnerable glaciers, only one study has quantified glacier disappearance across the Cordillera Real, identifying 34 glaciers that disappeared between 2000 and 2016 (Seehaus and others, Reference Seehaus, Malz, Sommer, Soruco, Rabatel and Braun2020).
The recent fate of glaciers in the Cordillera Real, particularly small glaciers (<0.5 km2), remains unknown. In honor of the International Year of Glaciers’ Preservation, we quantify glacier disappearance in the Cordillera Real from 1998 to 2024. We identify glaciers that existed in 1998 but vanished by 2024, using a recently published multitemporal inventory of glaciers in the Cordillera Real (Adrianzen and Malone, Reference Adrianzen and Malone2026). A CSV file of the 174 glaciers identified as having disappeared, along with ESRI shapefiles of their extents, is provided in the Supplementary materials.
2. Datasets and methods
To track glacier demise, we used a recently published multitemporal inventory of glaciers in the Cordillera Real (Adrianzen and Malone, Reference Adrianzen and Malone2026; hereafter A&M26), which maps glacier extents for 1992, 1998, 2005, 2010, 2016 and 2024. In this study, we selected the extents for 1998, 2010 and 2024 to determine how many glaciers have vanished between 1998–2010 and 2010–2024. These years are sufficiently spaced to resolve changes in small glaciers and were least affected by ephemeral snow cover. The 1998 inventory also enables comparison with version 7.0 of the Randolph Glacier Inventory (RGI 7.0). We additionally used equilibrium line altitude (ELA) data from the World Glacier Monitoring Service (WGMS, 2025; hereafter WGMS) for Zongo Glacier and the void-filled Shuttle Radar Topography Mission 30 m digital elevation model (SRTM GL1).
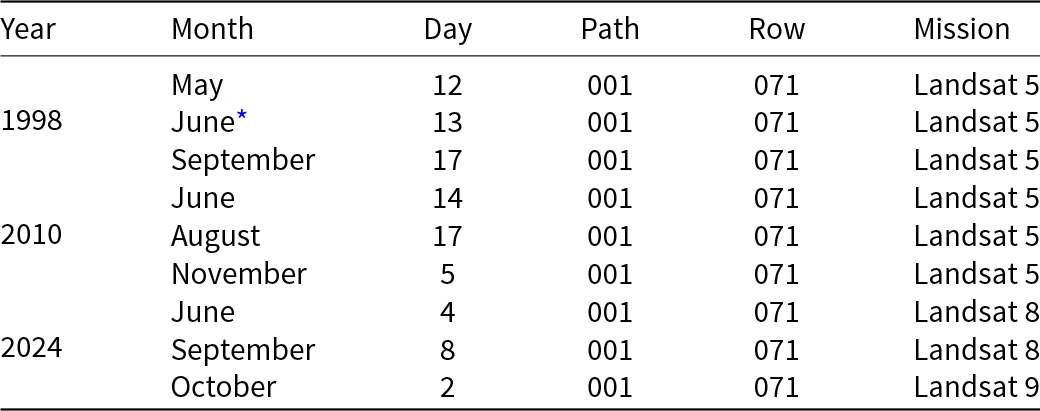
The A&M26 inventory was constructed using Landsat Collection 2, Tier 1 top-of-atmosphere reflectance data, with scene selection designed to minimize the influence of ephemeral snow cover. At least three scenes with minimal visible cloud cover over glacierized areas and minimal snow cover in the surrounding landscape were selected per year (Table 1), following the composite method of Taylor and others (Reference Taylor, Quincey, Smith, Potter, Castro and Fyffe2022). All years include a late dry-season scene (September), and two years include scenes from October to December, when ephemeral snow cover is least prevalent at glaciers in the outer tropics of Peru (Kochtitzky and others, Reference Kochtitzky, Edwards, Enderlin, Marino and Marinque2018; Malone and others, Reference Malone, Broglie and Wrightsman2022). For each year, a composite image was generated for glacier mapping using the median pixel value across the selected scenes.
Dates, paths, rows and missions of Landsat scenes used to construct the A&M26 inventory.
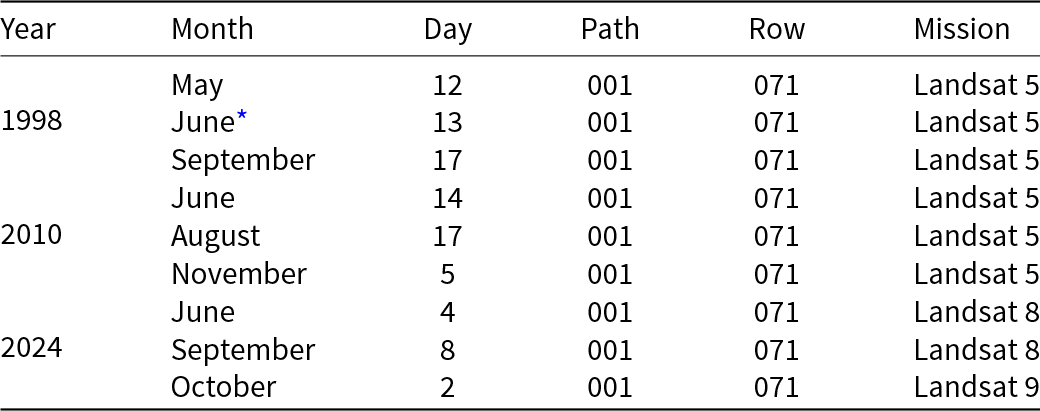
Table 1 Long description
The table lists Landsat scene acquisition dates used for an inventory, along with the satellite mission and the WRS path and row. Every entry uses path 001 and row 071, indicating a consistent scene footprint across all dates. The dates span three periods: 1998 with three scenes in May, June, and September; 2010 with three scenes in June, August, and November; and 2024 with three scenes in June, September, and October. All 1998 and 2010 scenes are from Landsat 5. In 2024, the scenes come from Landsat 8 for June and September and Landsat 9 for October. One entry includes an asterisk, which indicates that this scene was used by the Randolph Glacier Inventory, Version 7.0, to construct its inventory for the Cordillera Real.
* Landsat scene used to construct the RGI 7.0 for the Cordillera Real.
Glacierized areas were delineated in the A&M26 inventory using well-established techniques for clean-ice glaciers, which comprise most glaciers in Bolivia (Cook and others, Reference Cook, Kougkoulos, Edwards, Dortch and Hoffmann2016). Pixels were classified using the Normalized Difference Snow Index (Hall and others, Reference Hall, Riggs and Salomonson1995), and proglacial lakes were removed following the methods of Hanshaw and Bookhagen (Reference Hanshaw and Bookhagen2014). Glacier extents were visually inspected against the composite scene and its individual scenes, and margins were adjusted where needed. Potential misclassification in shadows was partially resolved by including scenes from the austral spring, when solar angles are higher than in scenes from June, July and August. However, some shadow-affected pixels may remain. Debris-covered ice was not explicitly mapped or corrected for, leading to some glaciers appearing smaller in the A&M26 inventory than in the RGI 7.0 (see Appendix B of Adrianzen and Malone, Reference Adrianzen and Malone2026). The minimum glacier size included in the inventory is 0.0054 km2 (6 pixels), which is smaller than in previous studies (0.01 km2; Seehaus and others, Reference Seehaus, Malz, Sommer, Soruco, Rabatel and Braun2020; Taylor and others, Reference Taylor, Quincey, Smith, Potter, Castro and Fyffe2022). To exclude ephemeral snow, glaciers in the 1998, 2010 and 2024 inventories were required to intersect glacierized areas in the 1992 inventory. Glacier complexes were subdivided into individual glaciers using ice divides from the RGI 7.0. Area uncertainties are reported as 2-σ values and were estimated following Hanshaw and Bookhagen (Reference Hanshaw and Bookhagen2014), with the glacier perimeter defined as the length of the boundary not shared with adjacent glaciers (Paul and others, Reference Paul2017). Further details about the methods used to produce the inventory are described in Adrianzen and Malone (Reference Adrianzen and Malone2026).
In this study, we classified glaciers as having vanished if less than 0.0054 km2 of glacierized area remained in 2010 or 2024 within a glacier basin that existed in 1998. We considered differences in glacierized area to be significant if their 2-σ uncertainty intervals did not overlap. To evaluate changes in glacierized area, we calculated the area-elevation distribution (i.e., hypsometry) of the glacierized area in 1998 and 2024 using the SRTM GL1 DEM. Since this DEM was acquired in 2000, the 2024 hypsometry does not capture subsequent surface lowering. We estimated a regional ELA using WGMS data for Zongo Glacier based on the most recent decade of data (2012–21). To evaluate the potential fate of the remaining glaciers, we compared this updated ELA and end-of-century ELA projections from Turner and others (Reference Turner, Vuille and Rabatel2025) to the 2024 hypsometry and to the maximum glacier elevations reported in the A&M26 inventory.
3. Results
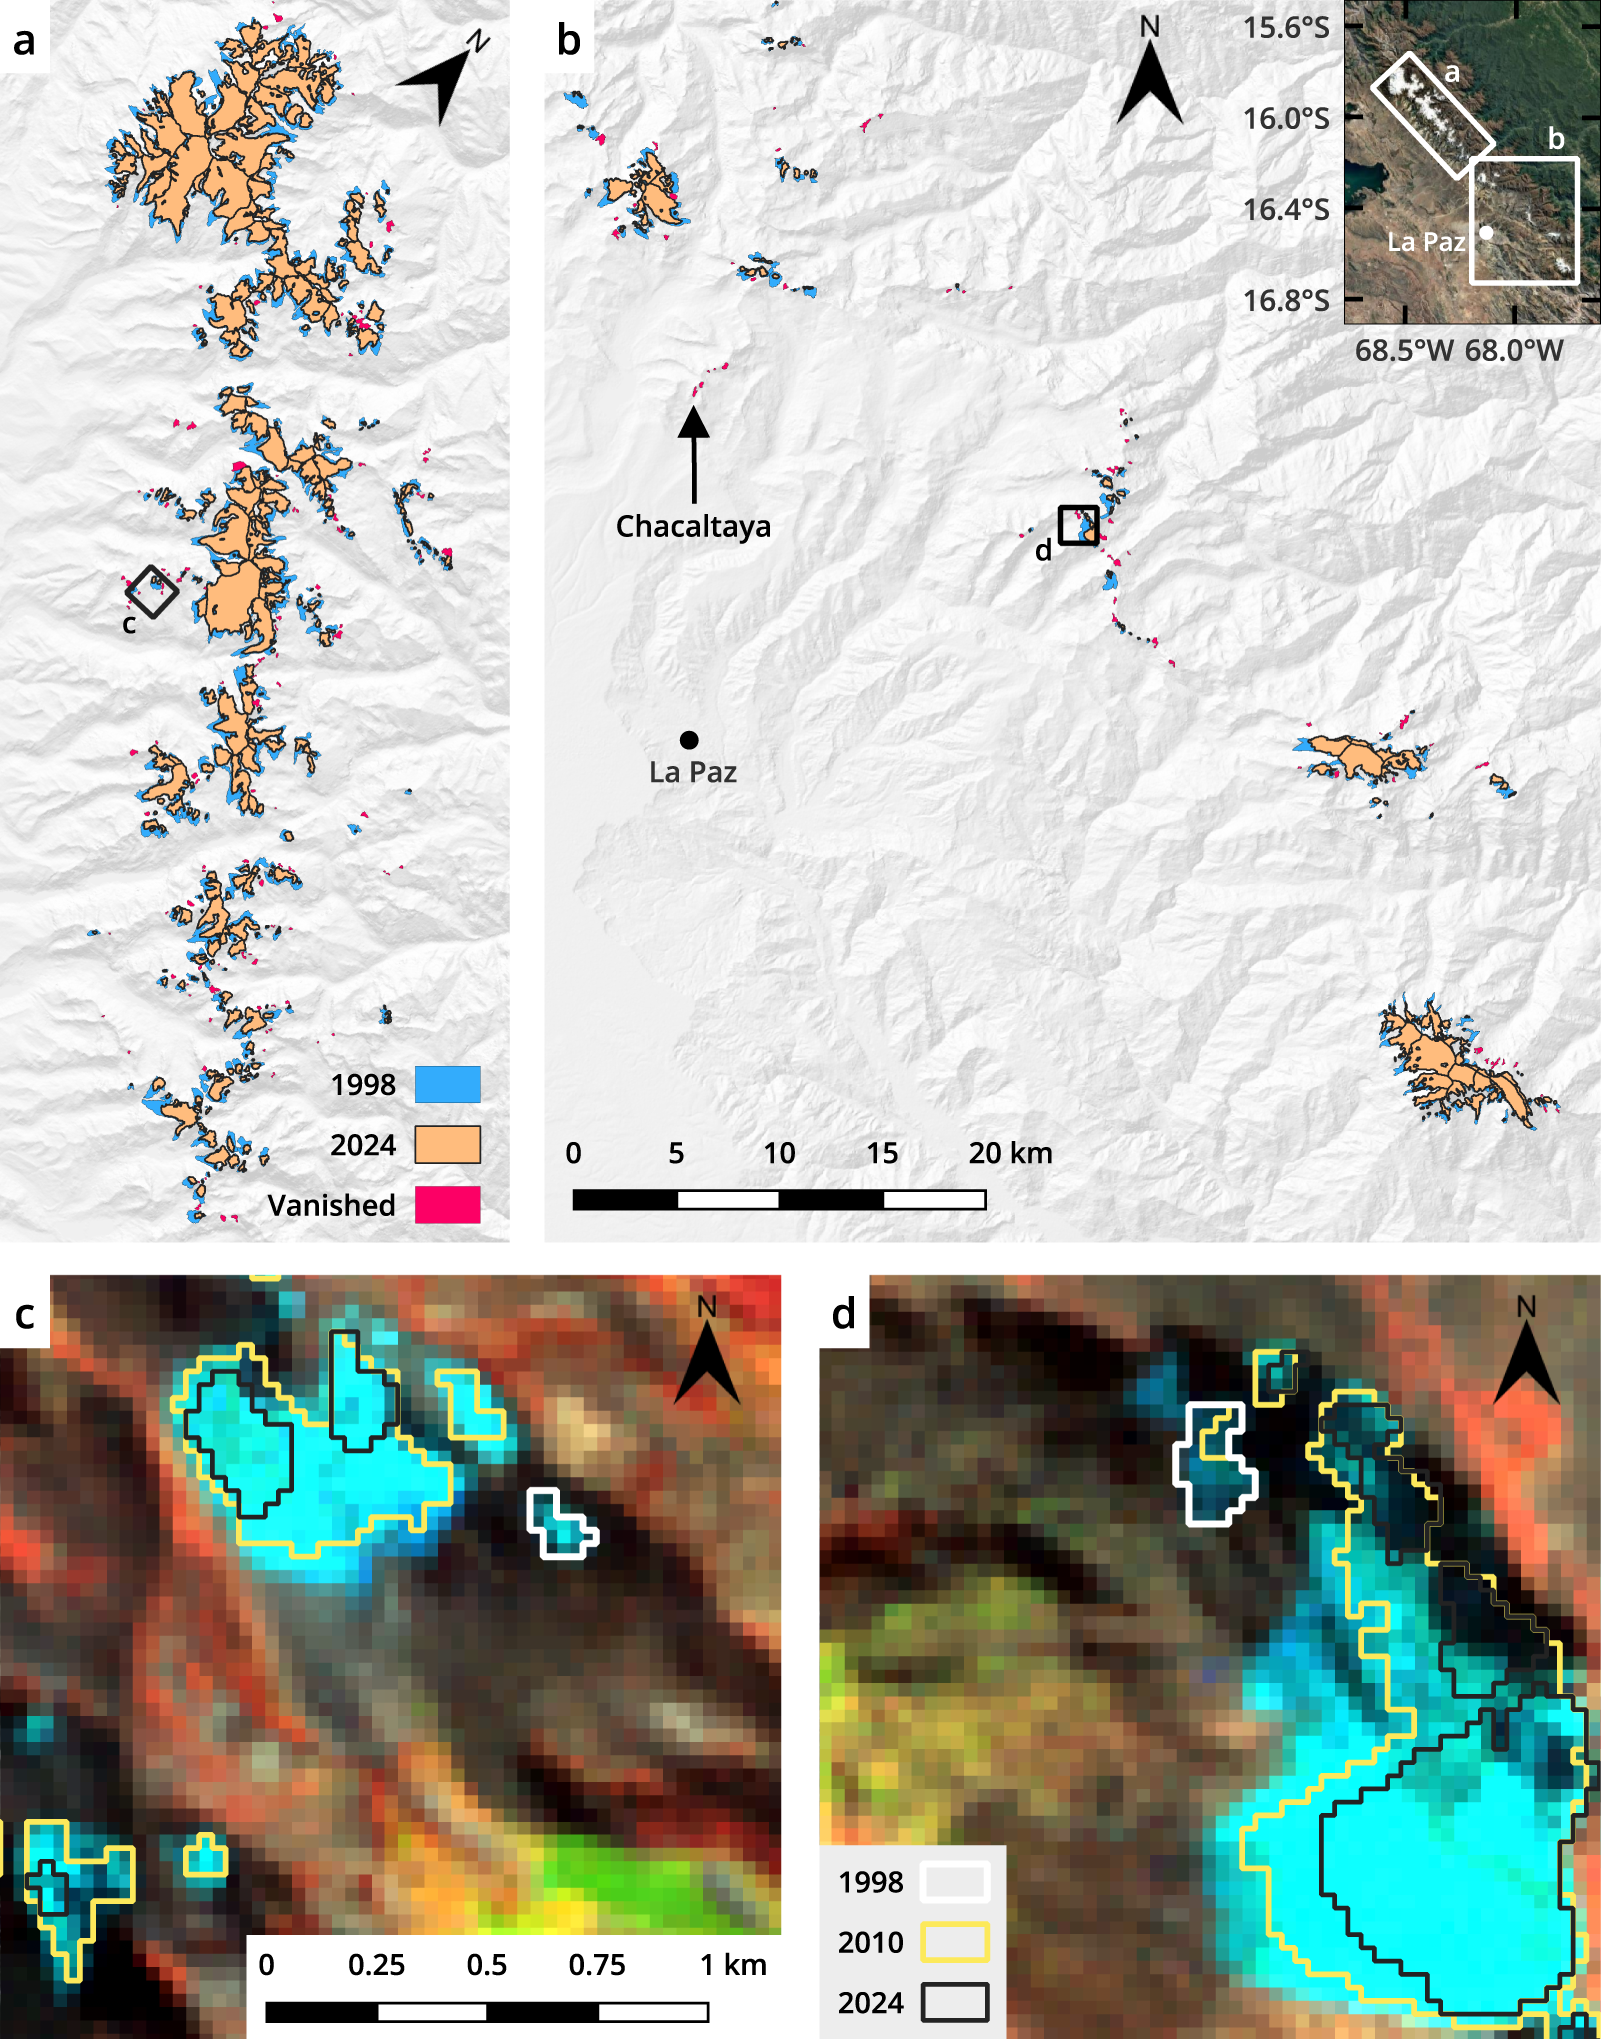
Glaciers in the Cordillera Real retreated rapidly between 1998 and 2024, and many disappeared (Figs. 2a and 2b). The glacierized area decreased by 70.96 ± 9.60 km2, representing a 33.2 ± 4.7% loss (Table 2). Over this interval, 174 glaciers vanished, constituting 30.5% of the glaciers in 1998. The glaciers that vanished had a total area of 6.01 ± 0.29 km2 in 1998, which accounts for 8.5 ± 1.2% of the total area loss between 1998 and 2024. Over one-third (62 of 174) of the glaciers that disappeared were glaciers included in the A&M26 inventory but not included in the RGI 7.0, of which about 40% (25 of 62) were smaller than 0.01 km2 (i.e., the size cutoff for the RGI 7.0). Restricting the analysis to only glaciers in the A&M26 inventory found within glacierized areas in the RGI 7.0, 112 of 488 glaciers vanished (23.0%), with a combined area of 5.00 ± 0.27 km2. The inventory of glaciers that have vanished is provided in the Supplementary materials.
(a) and (b) Glacier change in the Cordillera Real from 1998 to 2024, highlighting glaciers that vanished. The inset map in (b) shows the 1998 glacier extents and the regions displayed in (a) and (b). The location of Glaciar Chacaltaya, which disappeared by 2009, is noted in (b). The background map in (a) and (b) is a hillshade of the SRTM GL1 DEM. (c) Example of a glacier that vanished between 1998 and 2010, with a 1998 area equal to the median area of glaciers that vanished over this interval (0.0135 km2). (d) Same as for (c) but for a glacier that vanished between 2010 and 2024, with a 1998 area of 0.0342 km2. The locations of (c) and (d) are noted in (a) and (b), respectively. The background map in (c) and (d) is a false-color composite (R-SWIR2, G-NIR, B-Green) of the 1998 Landsat composite scene. Only the 1998 extent of the example glacier in (c) and (d) is shown by the white outline.
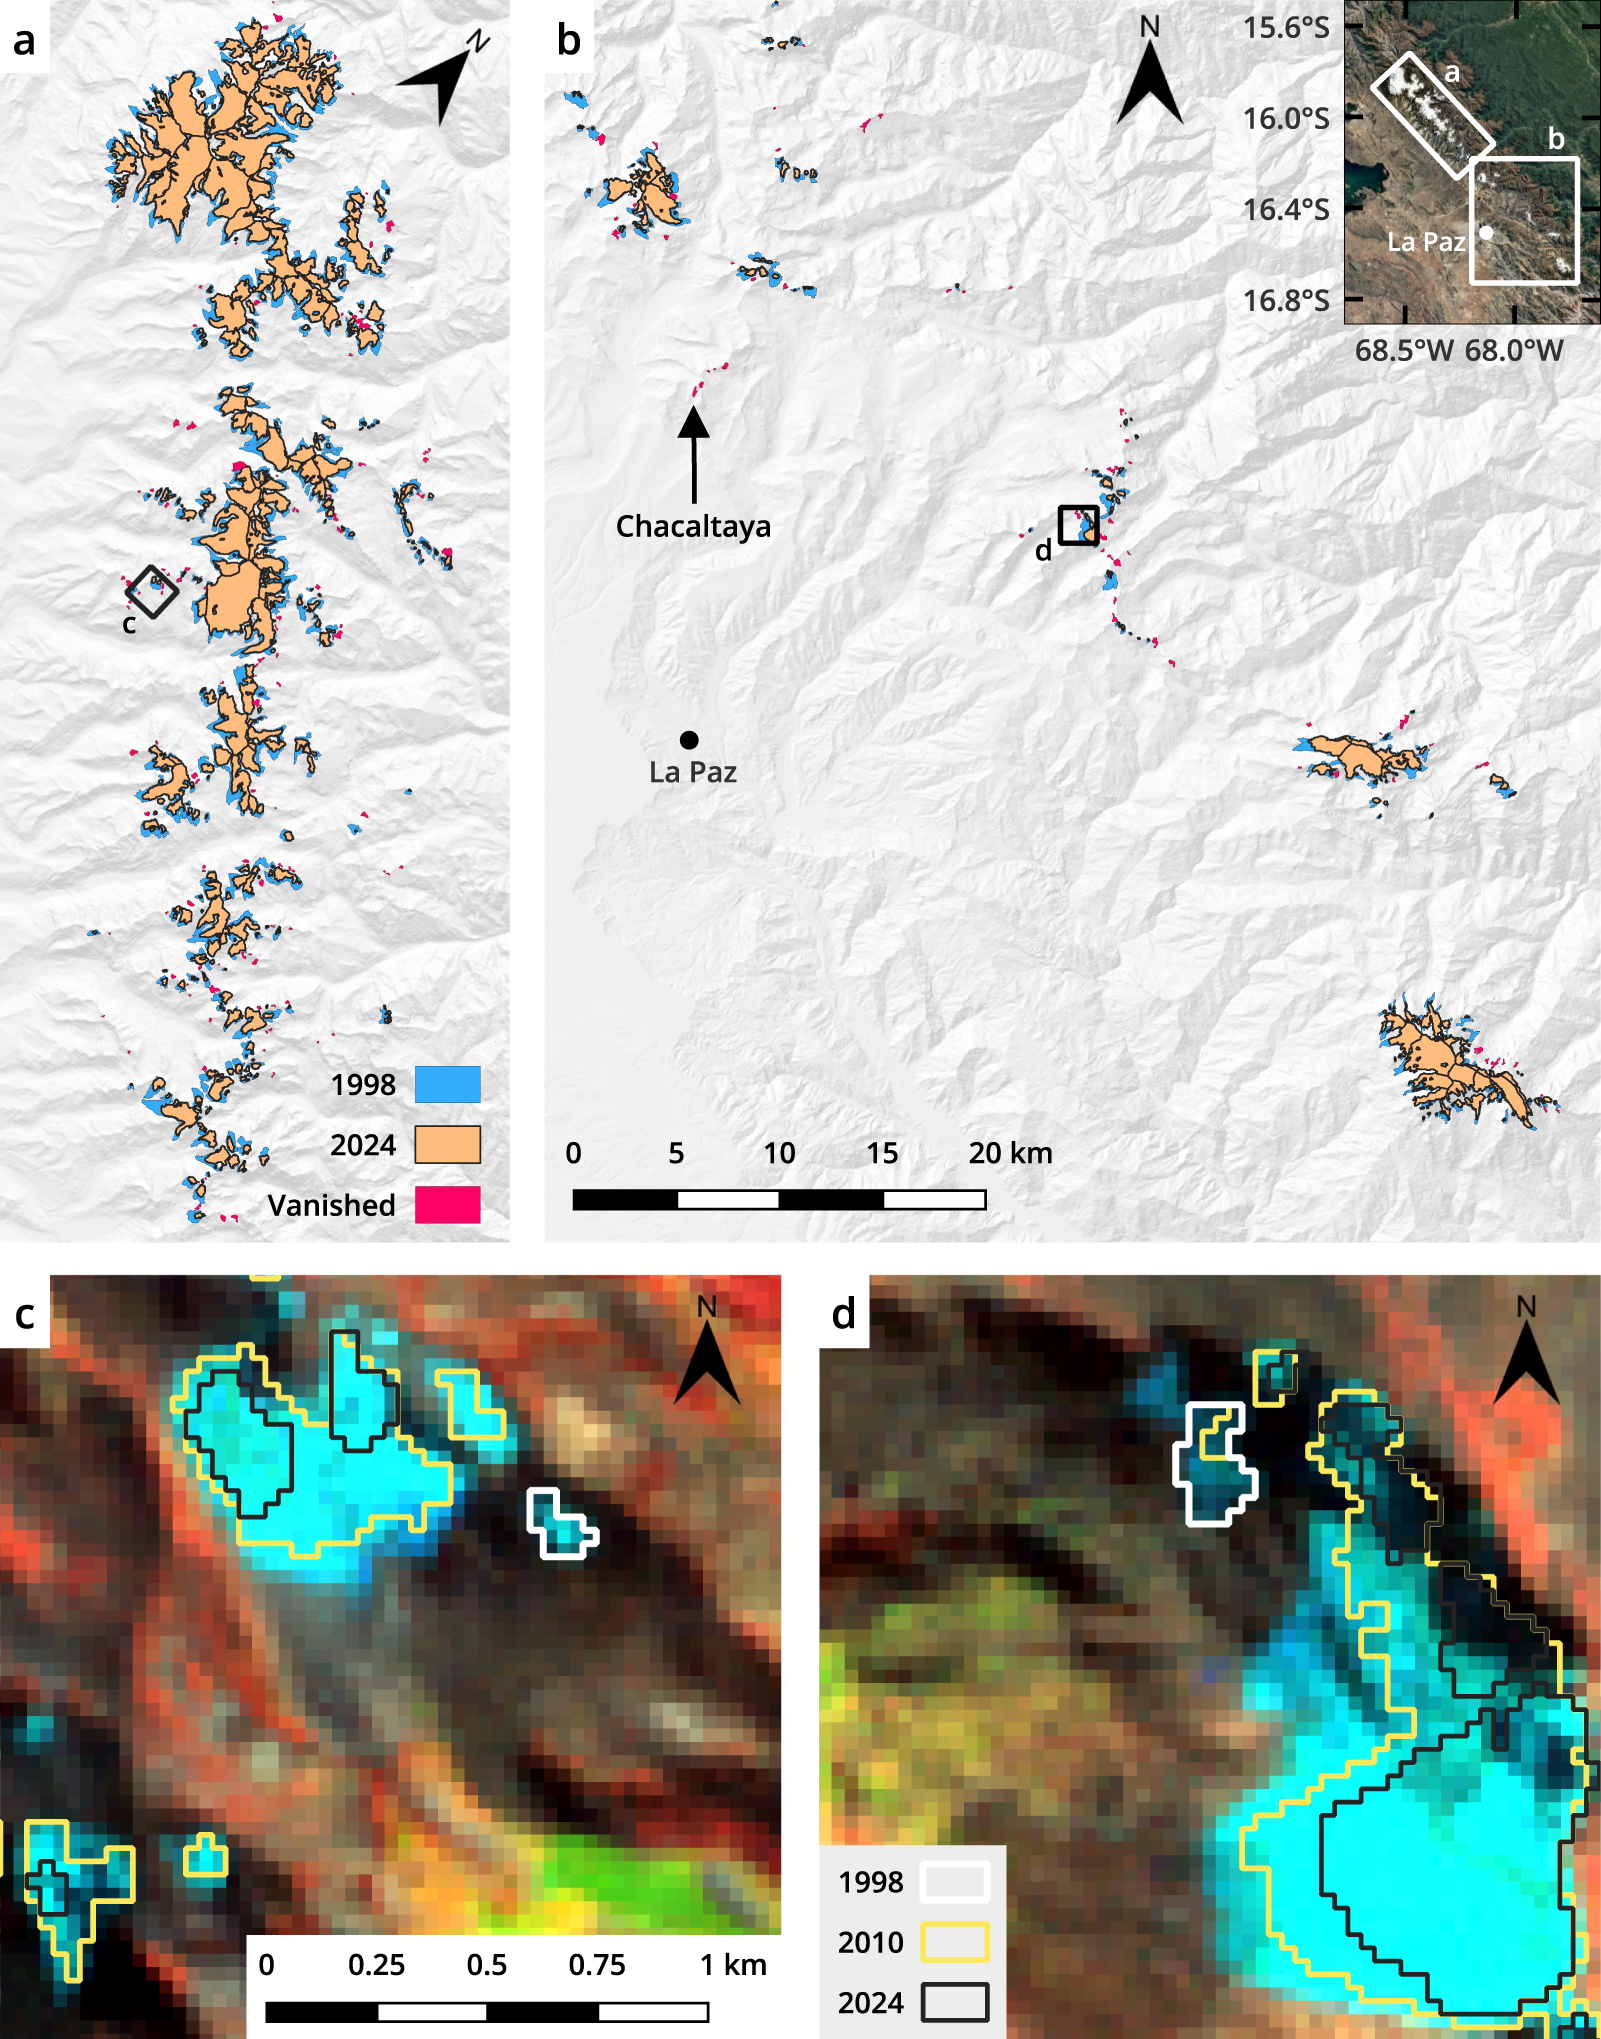
Figure 2 Long description
A) Map showing glacier changes in the northern section of the Cordillera Real from 1998 to 2024. Glaciers from 1998 are marked in blue, 2024 in orange and vanished glaciers in pink. The map highlights the spatial distribution of glaciers along the mountain range, with clusters of vanished glaciers visible. B) Map of the southern section of the Cordillera Real noting the key details in A) and including the location of Glaciar Chacaltaya, which disappeared by 2009. The inset map shows the 1998 glacier extents and regions displayed in A) and B), with coordinates 15.6°S to 16.8°S and 68.0°W to 68.5°W. C) Detailed view of a glacier that vanished between 1998 and 2010, with the 1998 extent outlined in white. The map uses a false-color composite (R-SWIR2, G-NIR, B-Green) from the 1998 Landsat scene. D) Similar view as C) for a glacier that vanished between 2010 and 2024, with the 1998 extent outlined in white and additional outlines for 2010 and 2024 extents. The scale bars indicate distances in kilometers.
Number* (area [km2] ± uncertainty [km2]) of the glaciers analyzed in this study.

Table 2 Long description
The table reports, for 1998, 2010, and 2024, the number of glaciers and their combined area in square kilometers, with an uncertainty range for each area total. For all glaciers, the count declines from 570 in 1998 to 561 in 2010 and 509 in 2024, while total area drops from 213.96 to 175.01 to 143.00 square kilometers. Vanished glaciers are not listed for 1998, then increase from 85 in 2010 to 174 in 2024, with associated areas rising from 1.77 to 6.01 square kilometers. Overall, the inventories indicate substantial loss in total glacier area over time alongside a growing number of glaciers classified as vanished. Counts across years may not be directly additive because shrinking glaciers can split into multiple mapped basins in later inventories, which can inflate summed counts relative to earlier totals.
* As glaciers have shrunk, some have fragmented into multiple glacierized areas, which the later inventories count as separate glacier basins, meaning the sum of All glaciers and Vanished glaciers in 2010 and 2024 is greater than the total number of glaciers in 1998.
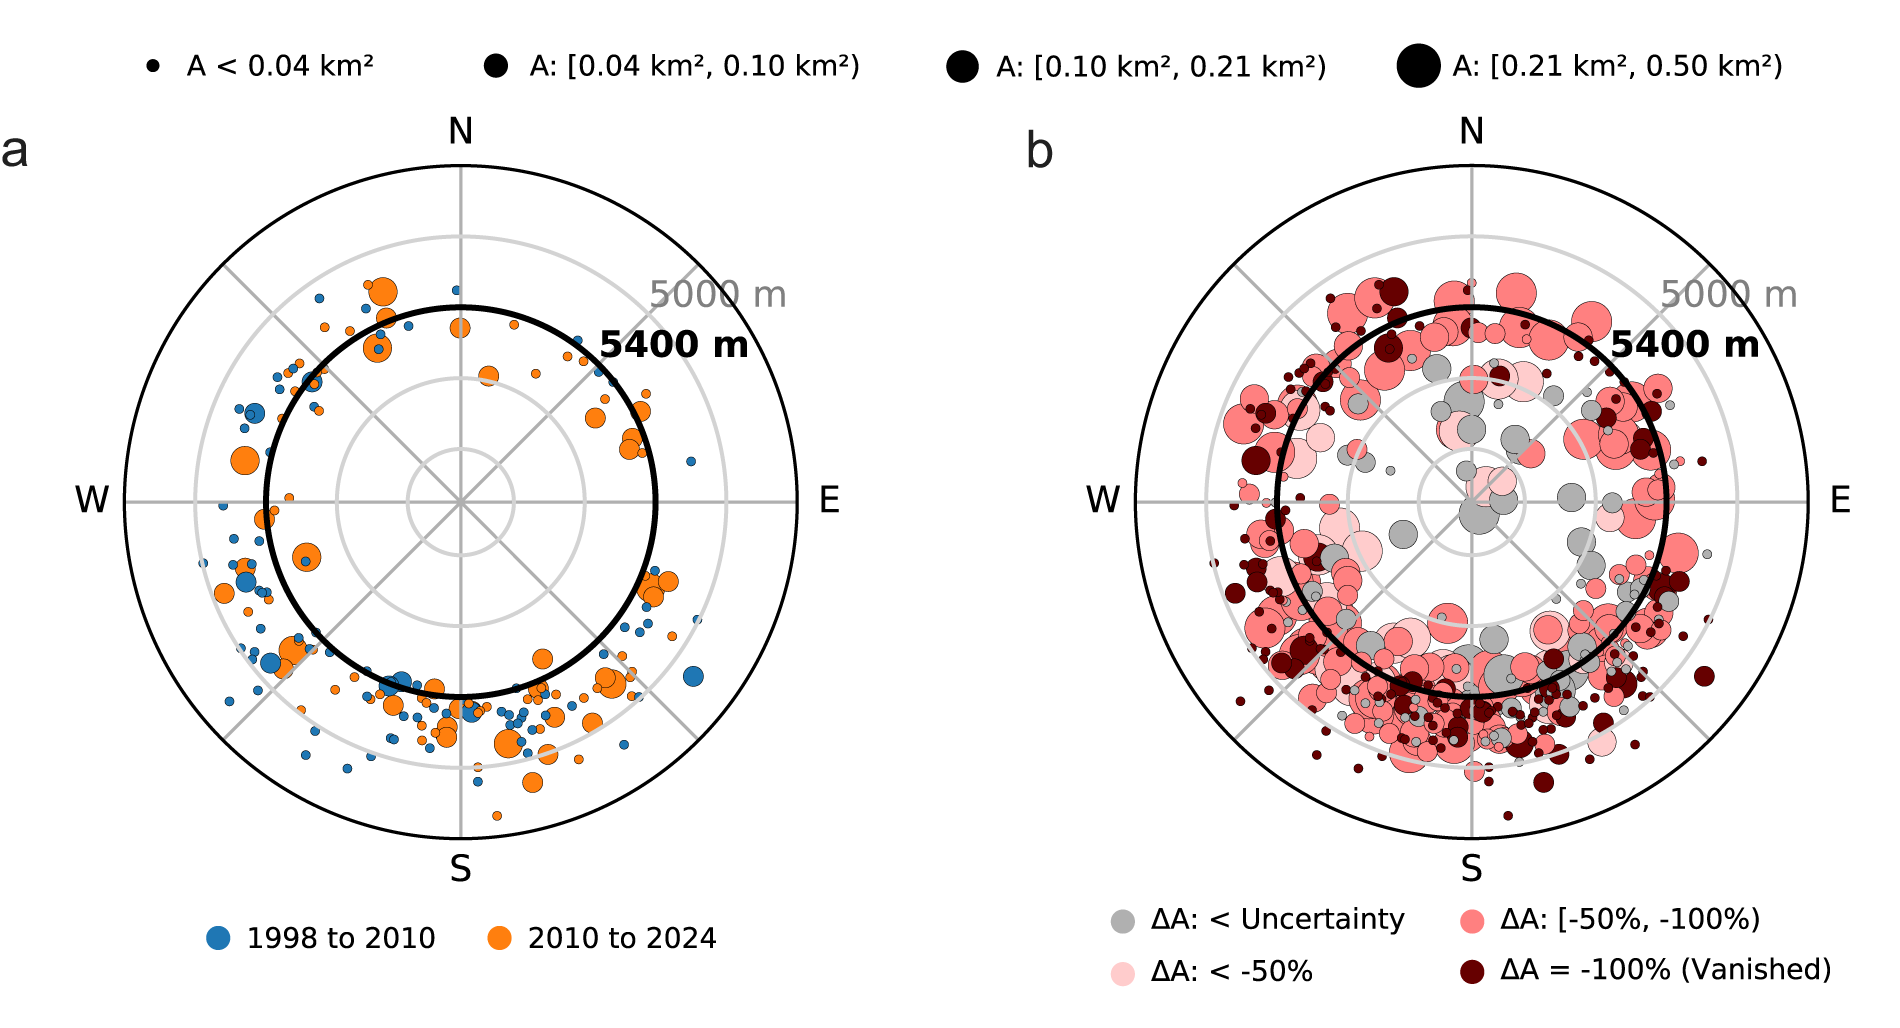
The glaciers that vanished were exclusively small glaciers (<0.5 km2), and most were low-lying (maximum elevation <5400 m) (Fig. 3a). All had an area in 1998 of <0.21 km2, and 27 (15.5%) had an area in 1998 of <0.01 km2. All had a maximum elevation in 1998 <5800 m, and 79.9% had a maximum elevation <5400 m (i.e., low lying). There is less clarity on the aspect of the glaciers that disappeared. Most (62.6%) faced southward in 1998 (aspects of South, Southeast or Southwest), but this tendency reflects the greater abundance of glaciers <0.21 km2 with these aspects. Glaciers <0.21 km2 experienced greater proportional loss if facing northward (aspects of North, Northeast or Northwest) than facing southward (51.2% vs 44.9%). The glaciers that vanished between 2010 and 2024 tended to have larger areas and higher maximum elevations in 1998 than those that vanished between 1998 and 2010 (Figs 2c and 2d and 3a).
(a) Area (dot size), maximum elevation (distance from center), and mean aspect (angle) of the 174 glaciers that disappeared, as well as the interval over which they vanished (dot color), and (b) relative area change (dot color) between 1998 and 2024 of the 467 small glaciers in the Cordillera Real. Glaciers that remain in 2024 but whose area change is smaller than the uncertainty in their change are noted in gray. Lower elevations are plotted toward the outside at 400 m intervals. The cutoff elevation for low-lying glaciers (5400 m) is bolded.
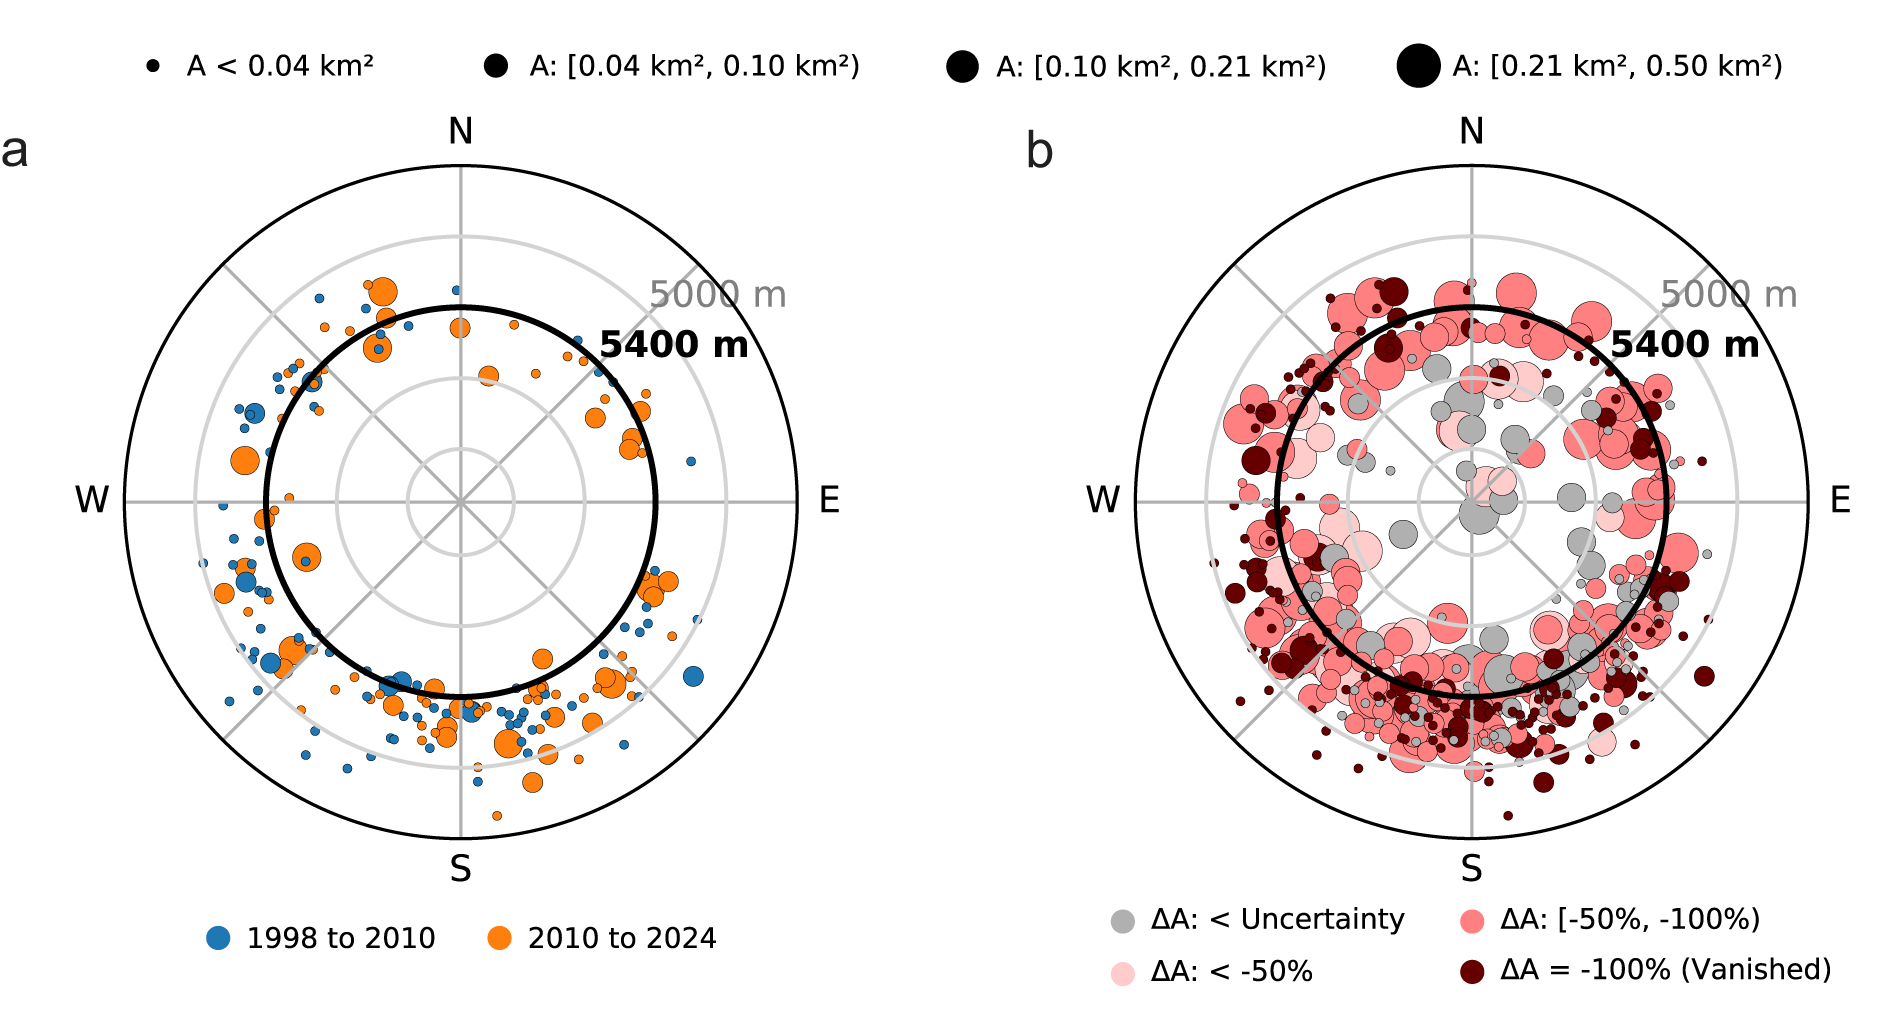
Figure 3 Long description
A A polar scatter plot for glaciers that vanished between 1998 and 2024 with compass labels N, E, S and W. Concentric circles are shown, with an outer label “5000 m” and a bold circular ring labeled “5400 m”. Points of varying dot sizes are distributed around the circle, with many points near the lower half between W and E around S. A legend above shows dot-size bins labeled: “A < 0.04 km2”, “A: [0.04 km2, 0.10 km2]”, “A: [0.10 km2, 0.21 km2]” and “A: [0.21 km2, 0.50 km2]”. A legend below shows two categories labeled “1998 to 2010” and “2010 to 2024”. b A polar scatter plot of relative glacier loss with compass labels N, E, S and W. Concentric circles are shown, with an outer label “5000 m” and a bold circular ring labeled “5400 m”. Points of varying dot sizes are distributed around the circle, with many points near the lower half around S and additional points around the full circle. A legend below lists four categories labeled: “delta A: < Uncertainty”, “delta A: [-50 percent, -100 percent)”, “delta A: < -50 percent” and “delta A = -100 percent (Vanished)”.
While all the glaciers that vanished were small and most were low-lying, only 37.3% of small glaciers in 1998 vanished by 2024 (Fig. 3b). No small glaciers with maximum elevations above 5800 m have disappeared, and most (82.6%) have lost less than half of their area. For those with maximum elevations between 5400 and 5800 m, only 22.2% vanished, but the majority (67.1%) that remain have lost at least half of their area. Even among small, low-lying glaciers, less than half (48.6%) disappeared by 2024. However, most of those that remain have lost more than half of their area. Thus, despite predictions of the widespread demise of small glaciers in the Cordillera Real, the majority (62.7%) remain, though many may yet vanish.
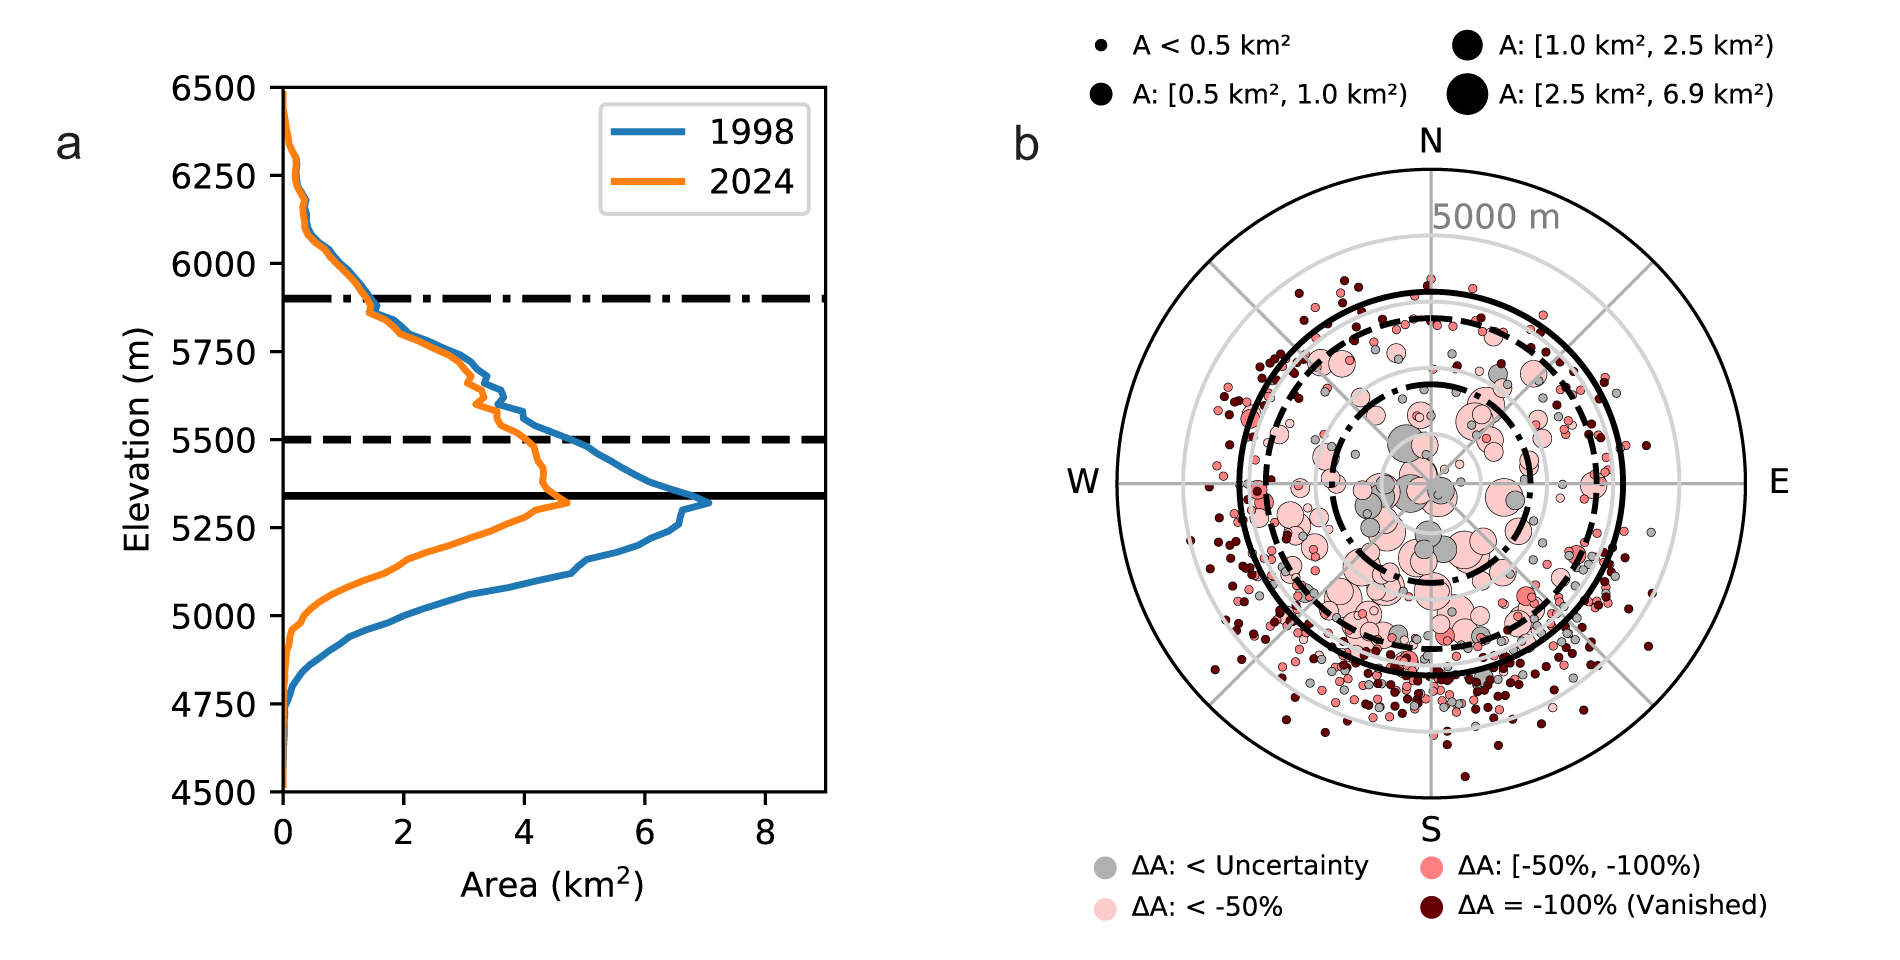
The loss of small and low-lying glaciers is part of a broader, elevation-dependent reduction in glacierized area across the Cordillera Real (Fig. 4a). The mean ELA at Zongo glacier is 5340 ± 10 m based on 2012–21 data from the WGMS. Most (74.3%) of the glacierized area loss between 1998 and 2010 occurred below 5340 m. By the end of this century, the ELA at Zongo Glacier is projected to rise to about 5500 m under an intermediate-emissions future (SSP2-4.5) and to about 5900 m under a high-emissions future (SSP5-8.5) (Turner and others, Reference Turner, Vuille and Rabatel2025). Only 46.8% of the remaining glacierized area is above 5500 m, and 8.4% is above 5900 m. For an ELA of 5500 m, only 24.2% of the remaining small glaciers from 1998 have a maximum elevation above this threshold (Fig. 4b). The majority (78.8%) of larger (≥0.5 km2) glaciers in 1998 had a maximum elevation above 5500 m, but many (39.7%) have fragmented into smaller units with lower maximum elevations. For an ELA of 5900 m, only 5.8% of the remaining small glaciers from 1998 and 35.9% of the larger glaciers from 1998 have a maximum elevation above this threshold.
(a) Glacierized area distribution with respect to elevation in 20 m bins, and (b) relative area change (dot color) between 1998 and 2024 for the 570 glaciers in the Cordillera Real with respect to their area (dot size), maximum elevation (distance from center), and mean aspect (angle). Glaciers that remain in 2024 but whose area change is smaller than the uncertainty in their change are noted in gray. Lower elevations are toward the outside at 400-m intervals. The regional ELA estimate (5340 m) from mass balance data at Zongo glacier from 2012 to 2021 is bolded. Projected end-of-century ELAs from Turner and others (Reference Turner, Vuille and Rabatel2025) are shown as dashed (SSP2-4.5) and dash-dotted (SSP5-8.5) lines.

Figure 4 Long description
A) A line graph with legend entries 1998 and 2024. The horizontal axis label is Area (km superscript 2). The horizontal axis shows 0, 2, 4, 6, 8. The vertical axis label is Elevation (m). The vertical axis shows 4500, 4750, 5000, 5250, 5500, 5750, 6000, 6250, 6500. Three horizontal reference lines are drawn across the plot: one solid line near 5340 m, one dashed line at 5500 m and one dash-dotted line near 5900 m. The 1998 curve starts near area 0 at about 4750 m, increases to about 6.8 km2 near 5325 m, then decreases with increasing elevation, reaching about 0.5 km2 near 6000 m and near 0 by about 6500 m. The 2024 curve starts near area 0 at about 4900 m, increases to about 4.6 km2 near 5325 m, then decreases with increasing elevation, reaching about 0.6 km2 near 6000 m and near 0 by about 6500 m. B) A polar scatter plot of relative glacier loss with cardinal direction labels N, E, S, W. Concentric rings are shown, with a ring labeled 5000 m. Many circular markers of varying sizes are plotted. A size legend at the top shows four marker sizes labeled: A less than 0.5 km superscript 2; A: (0.5 km2, 1.0 km2); A: (1.0 km2, 2.5 km2); A: (2.5 km2, 6.9 km2). A symbol legend at the bottom shows four categories labeled: delta A: less than Uncertainty; delta A: less than negative 50 percent; delta A: (negative 50 percent, negative 100 percent); delta A equals negative 100 percent (Vanished). Two circular reference lines are drawn as a dashed circle and a dash-dotted circle.
4. Discussion
This study quantifies glaciers that have disappeared in the Cordillera Real and refines our understanding of the region’s most vulnerable glaciers. We identify substantially more glaciers that have vanished than previously noted by Seehaus and others (Reference Seehaus, Malz, Sommer, Soruco, Rabatel and Braun2020) (174 vs 34). Although the A&M26 inventory from 1998 is statistically indistinguishable from the RGI 7.0 in terms of glacierized area (Supplementary Table S1, Fig. S1 and Fig. S2), it contains 82 glaciers not included in the RGI 7.0 (Supplementary Fig. S3), which may partly explain the larger number of glaciers identified as having vanished. Restricting the analysis to glaciers present in both inventories, we find that 40 glaciers vanished between 1998 and 2010, and 72 glaciers vanished between 2010 and 2024. The glaciers that disappeared were exclusively small (<0.5 km2) and most were low-lying (maximum elevation <5400 m) (Fig. 3a), consistent with expectations that small, low-lying glaciers are the most vulnerable to complete loss (Ramírez and others, Reference Ramírez2001; Vuille and others, Reference Vuille2008; Rabatel and others, Reference Rabatel2013). Our findings on greater loss rates at lower elevations and relative stability at higher elevations (Figs 3b and 4a and 4b) are broadly consistent with past studies in the region (Soruco and others, Reference Soruco, Vincent, Francou and Gonzalez2009; Liu and others, Reference Liu, Kinouchi and Ledezma2013; Veettil and others, Reference Veettil, Wang, Simões and Pereira2018; Seehaus and others, Reference Seehaus, Malz, Sommer, Soruco, Rabatel and Braun2020; Huang and Kinouchi, Reference Huang and Kinouchi2024).
Our study may overcount the number of glaciers that have vanished due to methodological aspects of the A&M26 inventory. It uses a smaller minimum size threshold (≥0.0054 km2) than other studies (≥0.01 km2; Seehaus and others, Reference Seehaus, Malz, Sommer, Soruco, Rabatel and Braun2020; Taylor and others, Reference Taylor, Quincey, Smith, Potter, Castro and Fyffe2022), which could result in ephemeral snow patches in 1998 being misclassified as glaciers. However, glaciers in the 1998 A&M26 inventory were required to at least partially intersect glacierized areas in its 1992 inventory, which reduces the likelihood of including ephemeral snow cover. A larger minimum size threshold may exclude some tiny glacierized areas present in 2024, thereby increasing the number of glaciers classified as vanished. Reanalyzing the A&M26 inventory using only glaciers ≥0.01 km2 results in fewer glaciers in 1998 (539 vs 570) but more glaciers classified as having disappeared by 2024 (203 vs 173). Additional uncertainty arises from identifying glacierized areas using the NDSI, which is best suited for clean-ice glaciers and may not detect debris-covered ice (Racoviteanu and others, Reference Racoviteanu, Paul, Raup, Khalsa and Armstrong2009). Although glaciers in Bolivia are predominantly clean ice (Cook and others, Reference Cook, Kougkoulos, Edwards, Dortch and Hoffmann2016), some glaciers identified as having vanished may persist under debris cover. Future studies could use synthetic aperture radar coherence (Atwood and others, Reference Atwood, Meyer and Arendt2010) to identify ice beneath debris cover, and this inventory can help guide targeted field validation studies of glaciers that have vanished in the Cordillera Real.
The demise of small and low-lying glaciers in the Cordillera Real is expected due to regional warming (Fernández‐Duque and others, Reference Fernández-Duque2023). This warming is raising freezing level heights, which are positively correlated with ELAs (Vuille and others, Reference Vuille2018; Turner and others, Reference Turner, Vuille and Rabatel2025). We find that the average ELA from 2012 to 2021 at Zongo Glacier (5340 ± 10 m) is about 200 m higher than the previously reported value from 1991 to 2006 (5144 ± 67 m) by Rabatel and others (Reference Rabatel2012). The previously reported ELA has been used as a representative regional ELA (Seehaus and others, Reference Seehaus, Malz, Sommer, Soruco, Rabatel and Braun2020; Huang and Kinouchi, Reference Huang and Kinouchi2024), and our updated estimate likely better reflects the current regional value. Most (74.3%) glacierized area loss occurred below this value (Fig. 4a), and nearly all (92.5%) of the glaciers that vanished had a maximum elevation below this more recent ELA value (Fig. 4b). Of the small glaciers from 1998 that remain, 114 (38.9%) have a maximum elevation below 5340 m, suggesting continued vulnerability under present climate conditions.
Glaciers in the Cordillera Real, especially small glaciers, are likely to continue vanishing in response to recent and projected warming. While individual glaciers can persist below the regional ELA due to topographic shading and avalanching, which can be important processes for small glaciers (DeBeer and Sharp, Reference DeBeer and Sharp2009; Florentine and others, Reference Florentine, Harper, Fagre, Moore and Peitzsch2018; Securo and others, Reference Securo2024), most remaining small glaciers below the regional ELA are out of equilibrium with the current climate, having lost an average of 64.7% of their 1998 extents by 2024 (Fig. 3b). Small glaciers, more broadly, are retreating at a faster rate than larger glaciers, with relative loss rates amplified by a factor of 2–8 compared to larger glaciers (Supplementary Table S2). Larger glaciers are also at risk, as they can fragment during retreat into smaller glacierized areas susceptible to edge effects, further enhancing ablation (Vuille and others, Reference Vuille2008). Projected future warming is expected to increase ELAs to levels that will imperil most of the remaining glaciers (Fig. 4b). Consequently, the fate of small glaciers – and glacierized areas more broadly – in the Cordillera Real will depend strongly on the magnitude of current and future warming.
5. Conclusions
This study provides an updated assessment of the fate of small (<0.5 km2) glaciers in the Cordillera Real. We find that 174 glaciers vanished between 1998 and 2024, representing about a third (30.5%) of the glaciers present in 1998. These losses, however, account for only 8.5% of the total glacierized area loss over this interval. All the glaciers that vanished were small, and most (79.9%) were low-lying (maximum elevation < 5400 m). Nearly all (92.5%) had a maximum elevation below the mean ELA at Zongo Glacier between 2012 and 2021 (5340 ± 10 m). Small glaciers that remain below this elevation are largely out of equilibrium with the current climate, and many will continue to shrink. Continued warming and its associated ELA rise will imperil much of the remaining glacierized area, especially small glaciers. More than two decades after predictions of widespread loss of small glaciers in the Cordillera Real, the majority (62.7%) of small glaciers remain, yet many are likely to vanish as warming continues.
Supplementary material
The supplementary material for this article can be found at https://doi.org/10.1017/aog.2026.10055.
Data availability statement
The inventories of glaciers that have vanished are available as a CSV file and an ESRI shapefile in the Supplementary material section. Supplementary Table S3 describes the variables in the file. The glacier inventory used in this study, which spans from 1992 to 2024 at roughly 6-year intervals, can be found in the Supplementary materials of Adrianzen and Malone (Reference Adrianzen and Malone2026) at https://doi.org/10.3390/rs18060905. Version 7.0 of the Randolph Glacier Inventory can be accessed at https://www.glims.org/RGI/. The SRTM GL1 DEM and GLO-30 DEM can be accessed at https://opentopography.org/. Data on the ELA for Zongo Glacier can be accessed from the WGMS at https://wgms.ch/data_databaseversions/. Landsat scenes can be accessed from the United States Geological Survey at https://earthexplorer.usgs.gov/ or through Google Earth Engine at https://earthengine.google.com/.
Acknowledgements
GA and ETB were supported in part by a National Aeronautics and Space Administration (NASA) grant or cooperative agreement. Any opinions, findings, conclusions or recommendations expressed in this material are those of the authors and do not necessarily reflect the views of NASA. This work was supported through a NASA grant awarded to the Illinois/NASA Space Grant Consortium. ETB also received support from the University of Illinois Chicago’s Liberal Arts and Sciences Undergraduate Research Initiative (LASURI) award. We also appreciate the feedback and suggestions from Dr Frank Paul and two anonymous reviewers. The authors acknowledge that generative AI (ChatGPT, GPT-5.3) was used to assist with language editing for clarity, grammar and conciseness. Generative AI was not used to perform analyses, interpret findings or produce figures. All content was reviewed and verified by the authors.



 Open access

