


Hypertension (HTN) is a major contributor to CVD and a significant cause of premature mortality worldwide(Reference Mills, Stefanescu and He1). According to the WHO, only 54 % of adults with HTN are diagnosed, 42 % receive treatment and just 21 % successfully control their condition(2). These statistics highlight the urgent need to raise awareness and develop more effective management strategies for HTN. Over the past four decades, global average blood pressure (BP) levels have remained relatively stable or experienced slight declines(Reference Mills, Stefanescu and He1). However, the prevalence of HTN has increased, especially in low- and middle-income countries(Reference Mills, Bundy and Kelly3). In 2010, approximately 31·1 % of adults worldwide (1·39 billion people) had HTN, with a higher prevalence in low- and middle-income countries (31·5 %) compared with high-income countries (28·5 %)(Reference Mills, Stefanescu and He1). This disparity persisted and intensified over the decade, with low- and middle-income country accounting for 82 % of all global HTN cases by 2019(Reference Schutte, Srinivasapura Venkateshmurthy and Mohan4). The higher rates of uncontrolled HTN in low- and middle-income country pose a severe challenge to these countries’ healthcare systems, which are often limited in resources and carry substantial social and economic impacts(Reference Schutte, Srinivasapura Venkateshmurthy and Mohan4).
The rising prevalence and mortality of cardio-metabolic disorders such as HTN are primarily attributed to population ageing and increased exposure to lifestyle-related risk factors, including poor diet quality (characterised by high Na intake and low potassium consumption) and insufficient physical activity(Reference Mills, Bundy and Kelly3,Reference Hashemi, Mehdizadeh Khalifani and Rahimlou5,Reference Mohammadifard, Rahimlou and Amani-Beni6) . Moreover, the risk and progression of HTN can vary significantly by sex and body weight status, suggesting the importance of examining these factors in relation to dietary patterns(Reference Everett and Zajacova7,Reference Landi, Calvani and Picca8) . While various indices have been developed to evaluate dietary patterns and their relationship with metabolic diseases(Reference Mohamadi, Shiraseb and Mirzababaei9–Reference Norouzzadeh, Teymoori and Farhadnejad11), the inconsistent and sometimes contradictory findings from previous studies on dietary quality indices and cardiometabolic conditions underscore the need for more comprehensive dietary quality assessment(Reference Vahid, Hoge and Hébert12,Reference Wang, Schmidt and Lennon13) .
In recent years, the Global Diet Quality Score (GDQS) has emerged as a novel index that comprehensively evaluates diet quality by addressing both nutrient adequacy and chronic non-communicable disease risk(Reference Bromage, Batis and Bhupathiraju14). Unlike traditional dietary indices that typically focus on one aspect, the GDQS integrates both components while offering practical advantages in implementation(Reference Bromage, Batis and Bhupathiraju14). Its food-based format eliminates the need for food composition tables, and its versatility allows application across diverse food cultures, enabling cross-national and temporal dietary quality comparisons(Reference Bromage, Batis and Bhupathiraju14). The score reflects the consumption of nutritious foods (higher intake yields higher scores) and unhealthy foods or those harmful in excess (lower intake yields higher scores)(Reference Bromage, Batis and Bhupathiraju14).
The GDQS has been validated across various populations and outcomes, including type 2 diabetes (T2D)(Reference Fung, Li and Bhupathiraju15), CVD(Reference Damigou, Kouvari and Chrysohoou16), obesity(Reference Fung, Li and Bromage17) and metabolic syndrome (MetS)(Reference Hosseini-Esfahani, Daei and Ildarabadi18), which most studies have been conducted in high-income countries(Reference Norde, Bromage and Marchioni19). Also, to our knowledge, limited studies have addressed the possible association between adherence to a diet with a high GDQS score and HTN risk, though existing evidence suggests a potential protective effect. The Nationwide Cohort Study in Chinese adults found that a higher GDQS score was related to a reduced risk of new-onset HTN(Reference Liu, Zhao and Dai20). Similarly, a study conducted in an Iranian population reported that a higher GDQS score can be associated with lower risk of elevated BP as an important component of MetS(Reference Hosseini-Esfahani, Daei and Ildarabadi18).
Given the high prevalence of MetS in the Iranian population, as well as the differences in Iranian dietary habits compared with Western societies (where most GDQS-chronic disease studies have been conducted), and the lack of prospective study examining specifically the relationship between GDQS and the risk of HTN in Middle Eastern populations, this study aimed to investigate the association between GDQS and the risk of developing HTN in Iranian adults, using data from the Tehran Lipid and Glucose Study (TLGS).
Methods and materials
Study population
The current study was conducted within the framework of the Tehran Lipid and Glucose Study (TLGS), the protocol of which has been comprehensively described elsewhere(Reference Mirmiran, Farhadnejad and Teymoori21,Reference Azizi, Ghanbarian and Momenan22) . This is an ongoing population-based study that has been conducted since March 1999 and aims to determine risk factors for noncommunicable diseases. Phase one of TLGS was conducted cross-sectionally (1999–2001), and six phases of the TLGS have been completed so far. The base population includes more than 15 000 individuals aged ≥ 3 years. Data collection has been conducted every 3 years, and thus phases two to six were conducted in 2002–2005, 2006–2008, 2009–2011, 2012–2015 and 2015–2018, respectively.
In the third survey of the TLGS (2006–2008), 3686 participants were randomly selected for dietary assessment out of 12 523 total participants. In the fourth survey (2009–2011), 7956 randomly selected participants agreed to complete the dietary assessment. For the current study, participants with complete dietary data from the third survey and new participants from the fourth survey were included. Participants from the third survey who reported energy intake below 800 kcal/d or above 4200 kcal/d (n 233) were excluded. However, if their energy intake was within the normal range in the fourth survey (n 100), their dietary intake from the fourth survey was included as baseline data. After excluding participants with over- or under-reported energy intake in the fourth survey (n 502), a total of 8914 participants with complete dietary data were included. Energy intake cut-offs of 800–4200 kcal/d were applied to exclude implausible dietary reports, following established nutritional epidemiology guidelines(Reference Willett23). Participants with energy intakes outside this range in the third survey were excluded unless their fourth survey intake was within the acceptable range, in which case the latter was used as baseline data to maximise valid data inclusion.
For the present study, among 7644 individuals aged ≥ 18 years, participants with any type of CVD (n 408), a history of cancer (n 35), pregnant or lactating women (n 154) and those with missing data on HTN (n 52) or HTN at baseline (n 1276) were excluded. Some participants may have fallen into more than one category. Of the 6019 participants at baseline who were followed up, 301 participants were lost to follow-up, and 5718 participants remained for the final analysis (follow-up rate: 95·0 %).
Measurements
The study’s methodology, including the assessment of demographic and clinical characteristics, anthropometric data, biochemical features, dietary intake and physical activity levels, has been described in detail previously(Reference Farhadnejad, Mokhtari and Teymoori24). A pretested questionnaire was used to collect data on demographic characteristics, including age, sex, smoking status, educational level, marital status, occupation, medical history and more. BP was measured using a mercury sphygmomanometer and the Korotkoff sound technique, with participants seated and rested for 15 min. Measurements were taken twice on the right arm, with a minimum interval of 30 s. The average of these two readings was recorded as the participant’s BP. SBP was determined by the first audible sound, and DBP was recorded at the point of sound disappearance.
Anthropometric assessment
Anthropometric indices, including height, weight and waist circumference, were measured according to standard protocols. Weight was measured using a digital scale with an accuracy of 100 g, with participants wearing minimal clothing and no shoes. Height was measured to the nearest centimeter using a tape measure, with participants standing without shoes, shoulders relaxed and in a normal posture. Waist circumference was measured at its narrowest point at the end of a natural exhalation. BMI was calculated by dividing weight (in kilograms) by the square of height (in meters).
Dietary intake assessment
Nutritional data of participants during the third and fourth phases of TLGS were obtained using a valid and reliable 168-item semiquantitative food frequency questionnaire(Reference Asghari, Rezazadeh and Hosseini-Esfahani25). In this way, individuals’ usual food intake during the past year was collected by experienced and trained interviewers in a face-to-face manner. Participants were asked to report the frequency of their consumption of each food component of the questionnaire during the past year by day, week, month or year. The portion sizes of consumption reported for each food item were based on household measurements and converted to daily intakes in grams. We used the United States Department of Agriculture food composition table to compute energy and nutrient content of consumed foods. For local food items that were not available in United States Department of Agriculture food composition table, the Iranian food composition table was used(Reference Azar and Sarkisian26). For combined foods (such as pizza), the nutrients were calculated based on the sum of the nutrients of the food items that make up that food.
Global diet quality score scoring
The GDQS is a comprehensive dietary measure designed to assess nutrient adequacy and predict the risk of chronic noncommunicable diseases. The scoring method for this dietary index, as developed by Bromage et al., has been previously described in detail(Reference Bromage, Batis and Bhupathiraju27). This index assesses dietary habits based on the consumption of twenty-five distinct food groups, which are categorised into healthy (GDQS+) and unhealthy (GDQS−) components (online Supplementary Table 1). Sixteen food groups, including various vegetables, fruits, proteins and whole grains (e.g. citrus fruits, other fruits, dark green leafy vegetables, cruciferous vegetables, deep orange vegetables, other vegetables, legumes, deep orange tubers, nuts and seeds, whole grains, liquid oils, fish and shellfish, poultry and game meat, low-fat dairy and eggs), are classified as healthy components. These groups are scored on a scale of 0 to 4 points, with higher scores reflecting greater consumption (GDQS+). Seven unhealthy food groups, including processed meat, refined grains and baked goods, sweets and ice cream, sugar-sweetened beverages, juice, white roots and tubers and purchased deep-fried foods, are scored using a 2-1-0 system. For these components, higher scores are assigned for lower consumption (GDQS−). Two potentially unhealthy food groups (red meat and full-fat dairy) have unique scoring systems to account for their consumption levels. Red meat is scored as 0-1-0, while full-fat dairy is scored as 0-1-2-0, with lower consumption corresponding to higher scores (GDQS−). The final GDQS is calculated by summing the scores from all twenty-five food groups, resulting in a total score ranging from 0 to 49. This score provides a comprehensive assessment of an individual’s diet quality.
Physical activity assessment
The physical activity levels of participants were assessed using the Modifiable Activity Questionnaire, which has been validated for the Iranian adult population(Reference Momenan, Delshad and Sarbazi28). This questionnaire asked participants to report the frequency and duration of each physical activity they engaged in. The type of activities, as well as their frequency per day, month or year, were evaluated based on the nature of the activity. Physical activity levels were expressed as metabolic equivalent hours per week (MET-h/week).
Biochemical measurements
After fasting for 12–14 h, venous blood samples were collected from all participants between 07.00 and 09.00 at the TLGS research laboratory in a sitting position. These samples were used to measure the concentrations of total cholesterol (TC), LDL-cholesterol, HDL-cholesterol, TAG and fasting plasma glucose (FPG). Within 30–45 min of collection, the blood samples were centrifuged for 10 min at 3000 rpm, and all measurements were performed on the same day using a Selectra 2 autoanalyser (Vital Scientific). TC was measured by enzymatic method using cholesterol esterase and cholesterol oxidase. HDL-cholesterol was measured after the precipitation of apo B-containing lipoproteins by phosphotungstic acid, using the same enzymatic method as for TC. The inter-assay and intra-assay CV were 2 % and 0·5 % for HDL-cholesterol and 2 % and 0·5 % for TC, respectively. TAG were measured enzymatically using glycerol phosphate oxidase, with inter-assay and intra-assay CV of 1·6 % and 0·6 %, respectively. The tests for TC, TAG and HDL-cholesterol were performed using kits from Pars Azmoun Company. FPG was measured by enzymatic calorimetric method with glucose oxidase and using glucose kits (Pars Azmoun Company), and both inter-and intra-assay CV for FPG was 2·2 %.
Definitions
Hypertension: Hypertension was determined in participants based on SBP/DBP ≥ 140/90 mm Hg for individuals aged < 60 years and SBP/DBP ≥ 150/90 mm Hg for those aged ≥ 60 years or using current antihypertensive medication(Reference James, Oparil and Carter29).
Statistical analysis
SPSS version 20 (Statistical Package for Social Sciences) software was used for data analysis. Kolmogorov–Smirnov test and histogram chart were used to assess the normality of variables. Subjects were divided into tertiles according to the score of GDQS. Mean (sd) or median (IQR 25–75) was reported for continuous variables. Data were presented as percentage for categorical variables. Linear regression and χ 2 test were used to test the differences across tertiles of GDQS for continuous and categorical variables, respectively.
The GDQS was divided into tertiles to assess the dose–response relationship between diet quality and hypertension risk, ensuring sufficient sample size per group for statistical power while enhancing interpretability for public health recommendations. Tertiles were preferred over quartiles or quintiles to maintain simplicity and comparability with similar studies. Also, GDQS was analyaed as a continuous variable to estimate the risk reduction per unit increase in GDQS score for clinical interpretability.
For participants who developed hypertension during follow-up, follow-up time was calculated as the duration from study entry to their last normotensive visit plus half the time interval between this visit and the subsequent examination at which hypertension was first detected, given the chronic nature of hypertension and the 3-year interval between TLGS follow-up phases. For those who remained normotensive until their last follow-up, person-time was calculated as the duration from study entry to their final examination, which varied according to the last attended phase. Total person-time was then used in survival analyses.
Cox regression analysis was used to determine the relationship between GDQS and the risk of developing HTN. Hazard ratio (HR) and 95 % CI of HTN were reported across tertiles of GDQS and its main subgroups (healthy and unhealthy dietary components of GDQS). Covariates in Cox regression models were selected through univariate Cox regression (retaining variables with P value < 0·2 for association with incident HTN) and supported by prior literature on diet quality and cardiovascular outcomes. Three Cox regression models were used to assess the possible association between GDQS and incident HTN. For analysis among total study population, model 1 adjusted for basic confounders (age and sex), model 2 included additional lifestyle factors (BMI, smoking, physical activity and energy intake) and model 3 further adjusted for socio-economic factors and clinical variables (education status, marital status, occupation status, baseline values of SBP, FPG and baseline TAG to HDL-cholesterol ratio).
The proportional hazards assumption for all variables included in the Cox models was examined prior to the analyses. Assessment was conducted using Schoenfeld residuals and visual inspection of log–minus–log survival plots. No evidence of violation of the proportionality assumption was observed, confirming the validity of applying the Cox proportional hazards model.
Subgroup analysis was also conducted to determine the HR of HTN across tertiles of GDQS and its main subgroups based on obesity and sex status. Finally, the multivariable-adjusted HR (95 % CI) for HTN across tertiles of GDQS and its main subgroups were determined based on sensitive analyses defined by T2D status, MetS, hypertriglyceridaemia and age. It is important to note that in sub group and sensitivity analysis, models 1 and 2 were combined into a single model 1 to enhance readability and reduce complexity. P values < 0·05 will be considered as a significant level. P trend was calculated using the median GDQS score per tertile as a continuous variable in Cox regression analyses. All of 5718 participants included to analysis had complete data on exposure, outcome and confounding variables.
Results
The mean (sd) age and BMI of the study participants were 37·7 (sd 12·8) years and 26·6 (sd 4·7) kg/m2, respectively. Mean (sd) score of GDQS for all participants was 25·3 (sd 4·4). During the 7·8-year follow-up, 1302 (18 %) new cases of HTN were identified.
Table 1 presents the baseline characteristics of participants according to GDQS. Participants in the higher GDQS tertiles tended to be older, more likely to be female, had a higher BMI, were more physical active, had a greater likelihood of smoking, had higher education levels, were more often married and showed elevated levels of SBP, DBP, FPG and HDL-cholesterol, along with increased energy and protein intake. The consumption of healthy components of GDQS, such as various types of fruits and vegetables, legumes, nuts and seeds, whole grains, liquid oils, fish and shellfish, poultry and game meat, low-fat dairy products, and eggs, increased across the tertiles of GDQS. The intake of unhealthy components, including high-fat dairy products, red meat, sweets and ice cream, white roots and tubers, purchased deep-fried foods and juice increased, while the consumption of processed meats, refined grains and baked goods and sugar-sweetened beverages decreased across the tertiles of GDQS.
Baseline characteristics of participants according to tertiles of global diet quality score
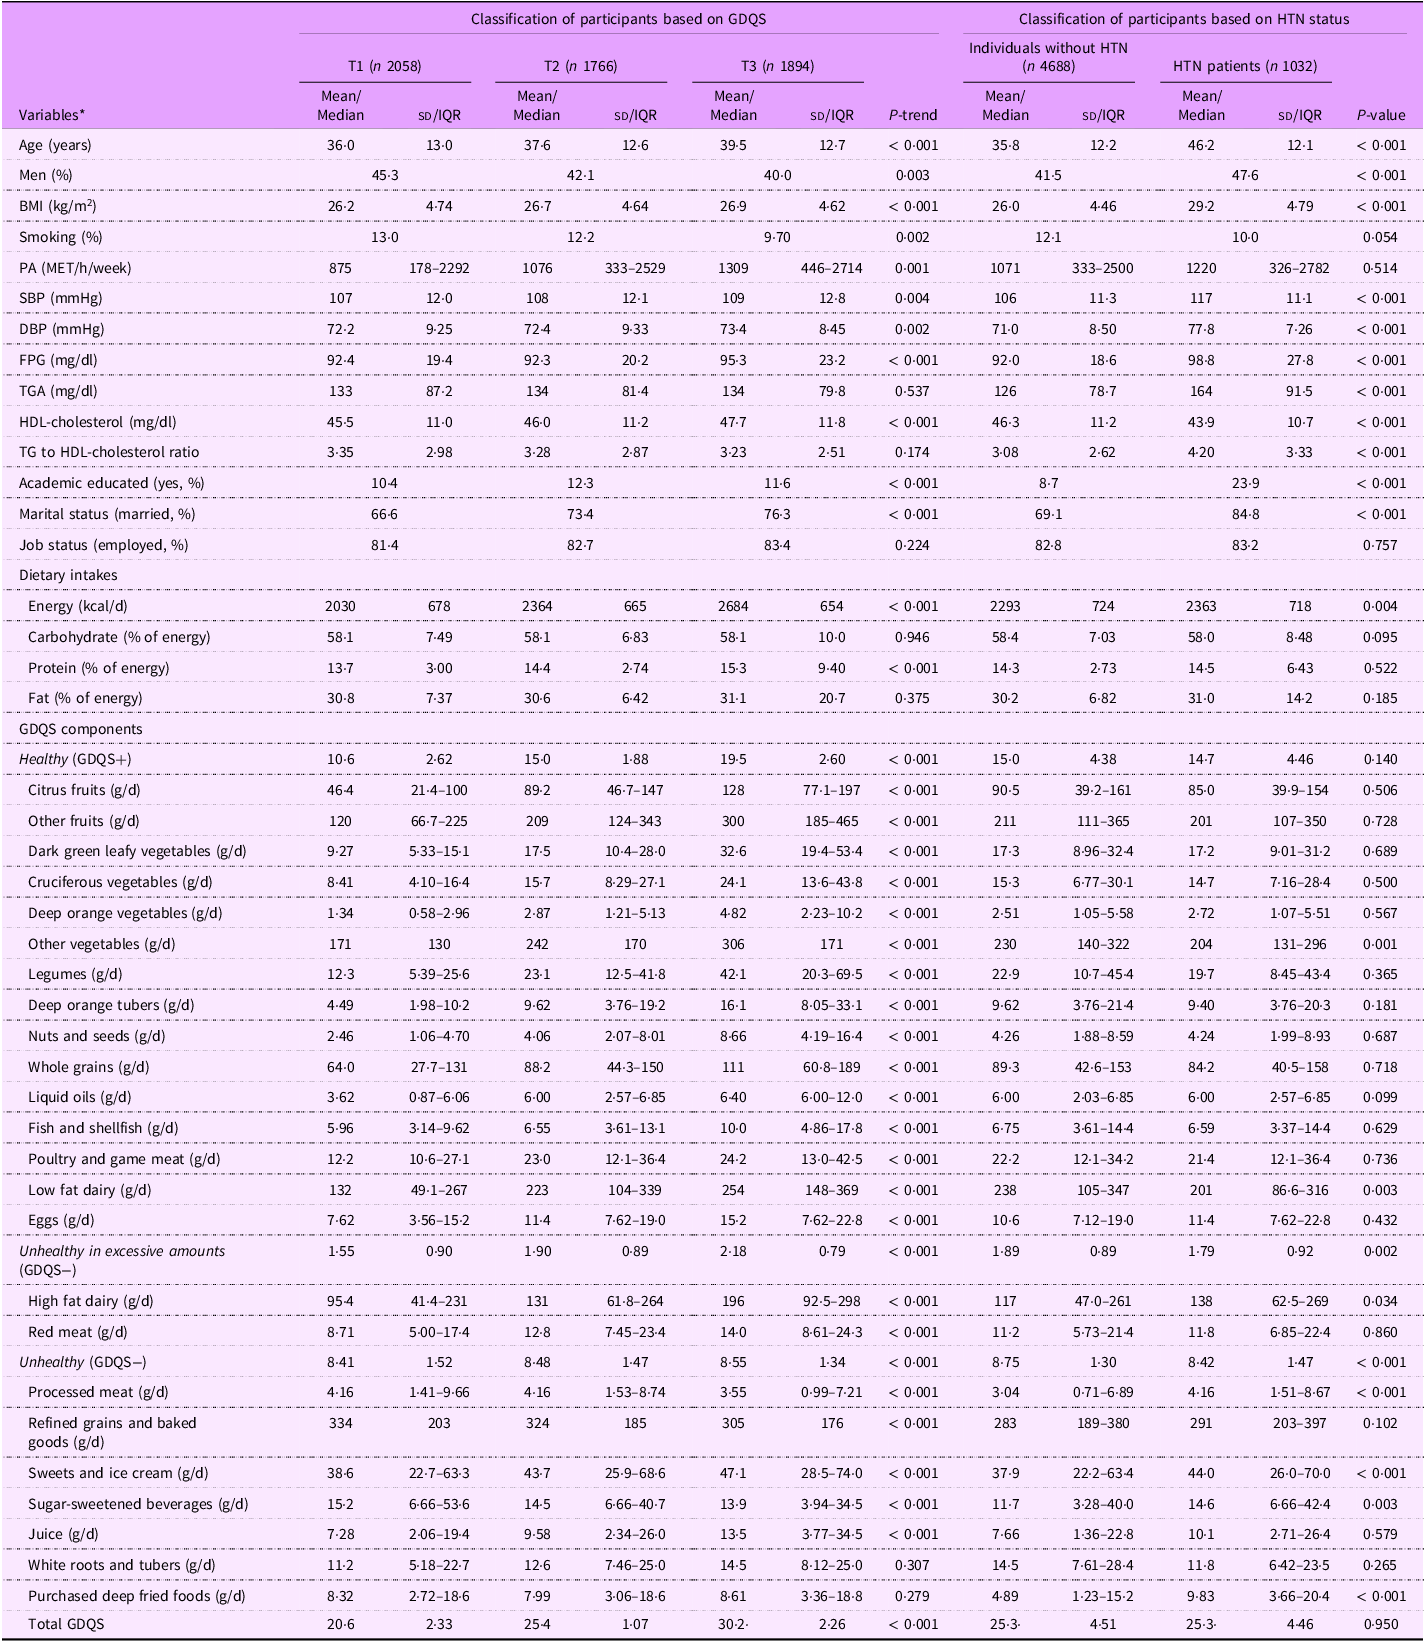
PA, physical activity; FPG, fasting plasma glucose; GDQS, global diet quality score; HTN, hypertension; IQR, interquartile range.
Data represented as mean (sd), or median (IQR 25–75) for continuous variables and percent for categorical variables.
* Linear regression and χ 2 test were used to test the differences across tertiles of GDQS for continuous and categorical variables, respectively.
Table 1 also presents the baseline characteristics of participants based on HTN status. Compared with non-HTN participants, those with HTN were generally older, more likely to be men, had a higher BMI, had higher education levels, were more often married and showed elevated SBP, DBP, FPG, TGS and TAG to HDL-cholesterol ratio, along with lower HDL-cholesterol levels. Also, the intakes of energy and unhealthy GDQS components (GDQS−), including high-fat dairy products, processed meat, sweets and ice cream, sugar-sweetened beverages and purchased deep fried foods in HTN patients was higher than those in non-HTN group. However, the intakes of low fat dairy and other vegetables as healthy GDQS components (GDQS+) in non-HTN group were higher than those with HTN. For other variables, no significant differences were observed between the two groups.
The HR (95 % CI) for HTN across tertiles of the GDQS and its main subgroups (healthy and unhealthy dietary components) are reported in Table 2. We observed that the healthy dietary components of GDQS (GDQS+) were associated with a reduced risk of HTN in the age- and sex-adjusted model (HR: 0·83; 95 % CI: 0·71, 0·96; P trend = 0·018) and remained significant in the multivariable-adjusted model (HR: 0·78; 95 % CI: 0·65, 0·92; P trend = 0·005). However, no significant association was found between the unhealthy components of GDQS (GDQS−) and HTN risk based on any of Model 1 (HR: 1·09; 95 % CI: 0·94, 1·26; P trend = 0·251), Model 2 (HR: 1·06; 95 % CI: 0·91, 1·23; P trend = 0·391) and Model 3 (HR: 1·14; 95 % CI: 0·98, 1·33; P trend = 0·059). Higher GDQS scores were associated with a reduced risk of HTN across all models, including model 1 (HR: 0·85; 95 % CI: 0·73, 0·98; P trend = 0·036), model 2 (HR: 0·82; 95 % CI: 0·69, 0·96; P trend = 0·019 and model 3 (HR: 0·83; 95 % CI: 0·70, 0·98; P trend = 0·034).
Hazard ratio (95 % CI) of hypertension incidence across tertiles of global diet quality score and its main subgroups
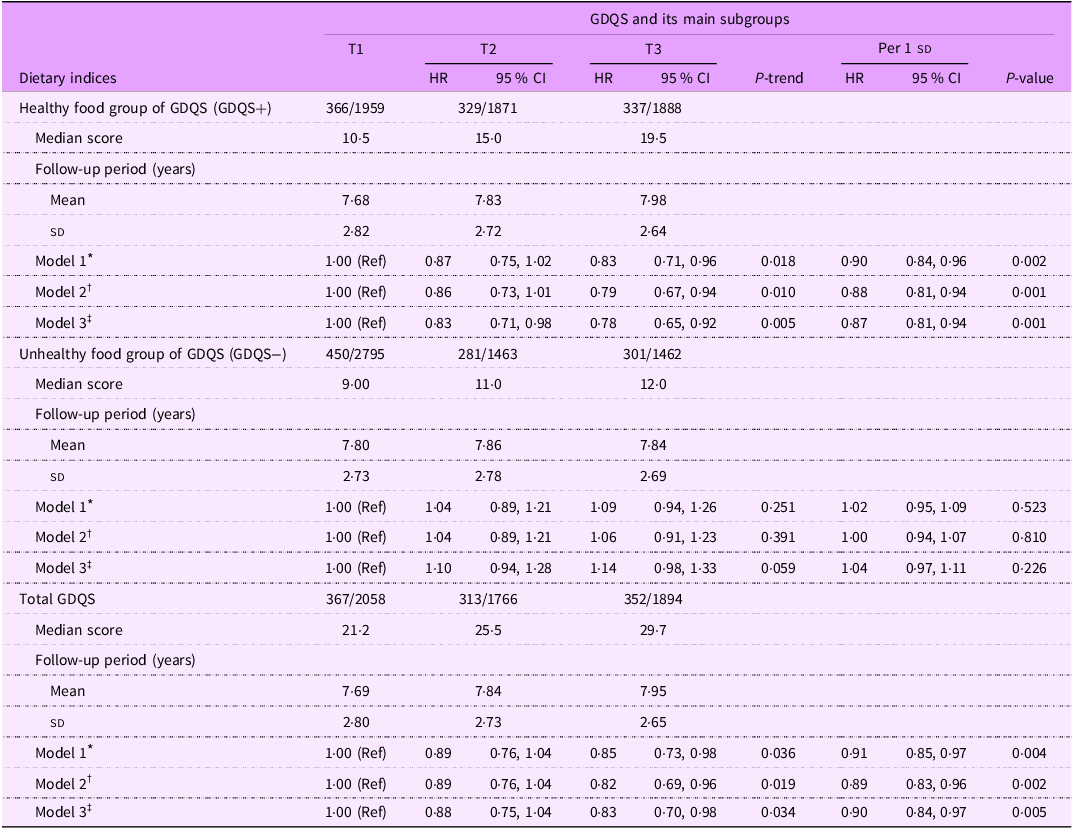
Abbreviations: GDQS; global diet quality score.
GDQS+ were classified as healthy food group of GDQS (sixteen dietary components) that included various vegetables, fruits, proteins, and whole grains. For this food group, higher scores reflecting greater consumption.
GDQS− were classified as unhealthy food group of GDQS that included seven unhealthy components (processed meat, refined grains and baked goods, sweets and ice cream, sugar-sweetened beverages, juice, white roots and tubers, and purchased deep-fried foods) and two potentially unhealthy food groups (red meat and full-fat dairy). For this food group, higher scores reflecting lower consumption.
* Model 1: adjusted for age and sex.
† Model 2: adjusted for model 1 and BMI, smoking, physical activity and energy intake.
‡ Model 3: adjusted for model 2 and education status, marital status, job status, baseline values of systolic blood pressure, fasting blood sugar, and baseline triglycerides to HDL-cholesterol ratio.
Table 2 also shows the possible association of each sd increment in GDQS score and its components with risk of HTN. In the final model, each sd increment in GDQS score and its healthy components (GDQS+) was associated with a reduction risk of HTN by 10 % (HR: 0·90; 95 % CI: 0·84, 0·97; P = 0·005) and 13 % (HR: 0·87; 95 % CI: 0·81, 0·94; P = 0·001), respectively. However, no significant association was observed between each sd increment in unhealthy components of GDQS (GDQS−) and risk of HTN (HR: 1·04; 95 % CI: 0·97, 1·11; P = 0·226).
Subgroup analyses presented in Table 3 showed that, among obese individuals, the healthy components of GDQS (GDQS+) were associated with a significant reduction in HTN risk (HR: 0·75; 95 % CI: 0·57, 0·99; P = 0·044). In addition, an inverse association between GDQS and HTN risk was observed in obese individuals (HR: 0·75; 95 % CI: 0·58, 0·98; P trend = 0·041). However, in multivariable adjusted model, no significant relationship was reported between the unhealthy components of GDQS (GDQS−) and HTN risk among obese individuals (HR: 1·11; 95 % CI: 0·87, 1·40; P = 0·392). In normal-weight and overweight participants, each sd increment in the healthy components of GDQS (GDQS+) was associated with a 14 % reduction in HTN risk (HR: 0·86; 95 % CI: 0·75, 0·95; P = 0·003), and each sd increment in GDQS score was associated with a 10 % reduced risk of HTN (HR: 0·90; 95 % CI: 0·82, 0·99; P = 0·034). However, there was no significant association between each sd increment in the unhealthy components of GDQS (GDQS−) and incidence of HTN in normal-weight and overweight participants (HR: 1·07; 95 % CI: 0·98, 1·17; P = 0·106). In female participants, both the healthy components of GDQS (GDQS+) (HR: 0·76, 0·60, 0·96; P trend = 0·023) and total GDQS score (HR: 0·77, 0·62, 0·97; P trend = 0·028) were inversely related to HTN risk. Moreover, among females, each sd increase in the healthy components of GDQS (GDQS+) was associated with an 11 % reduction in HTN risk (HR: 0·89; 95 % CI: 0·80, 0·99; P = 0·032), and each sd increase in GDQS score was associated with a 10 % reduction in HTN risk (HR: 0·90; 95 % CI: 0·82, 0·99; P = 0·044). However, no significant association was observed between the unhealthy components of GDQS (GDQS−) and HTN risk among females (HR: 1·13; 95 % CI: 0·92, 1·38; P = 0·240). In males, each sd increase in the healthy components of GDQS (GDQS+) was associated with a 14 % reduction in HTN risk (HR: 0·84; 95 % CI: 0·75, 0·94; P = 0·003), and each sd increase in GDQS was associated with an 11 % reduction in HTN risk (HR: 0·89; 95 % CI: 0·80, 0·99; P = 0·036). However, there was no significant association between each sd increment in the unhealthy components of GDQS (GDQS−) and risk of HTN in men (HR: 1·08; 95 % CI: 0·98, 1·20; P = 0·111).
Subgroup analysis for the association of global diet quality score and its main subgroups with the hypertension incidence based on obesity and sex status
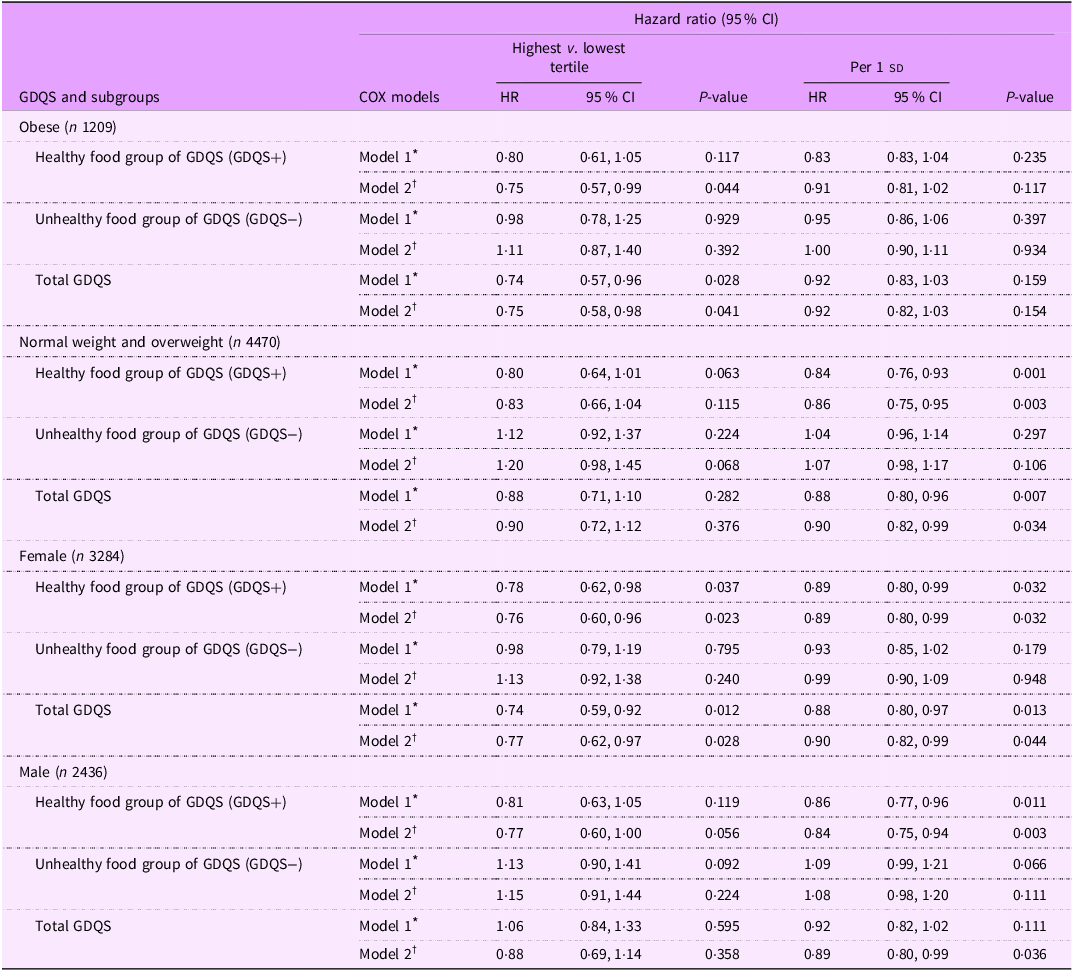
sd value of each score; GDQS, global diet quality score.
GDQS+ were classified as healthy food group of GDQS (sixteen dietary components) that included various vegetables, fruits, proteins and whole grains. For this food group, higher scores reflecting greater consumption.
GDQS− were classified as unhealthy food group of GDQS that included seven unhealthy components (processed meat, refined grains and baked goods, sweets and ice cream, sugar-sweetened beverages, juice, white roots and tubers and purchased deep-fried foods) and two potentially unhealthy food groups (red meat and full-fat dairy). For this food group, higher scores reflecting lower consumption.
* Model 1: adjusted for age and sex (except for sex subgroups), BMI, smoking, physical activity and energy intake.
† Model 2: adjusted for model 1 and education status, marital status, job status, baseline values of systolic blood pressure, fasting blood sugar and TGA to HDL-cholesterol ratio.
Table 4 presents multivariable-adjusted HR and 95 % CI for HTN based on subgroup analyses defined by diabetic status, MetS, hypertriglyceridaemia and age. In the final model, the healthy dietary components of the GDQS (GDQS+) were inversely associated with the risk of HTN after excluding participants with T2D (HR: 0·78, 95 % CI: 0·64, 0·94, P = 0·009), MetS (HR: 0·75, 95 % CI: 0·59, 0·94, P = 0·014), hypertriglyceridaemia (HR: 0·71, 95 % CI: 0·56, 0·90, P = 0·005), those older than 65 years (HR: 0·78, 95 % CI: 0·65, 0·94, P = 0·009) and those younger than 30 years (HR: 0·77, 95 % CI: 0·64, 0·92, P = 0·006). Additionally, in the final model, each 1 sd increase in the healthy components of the GDQS (GDQS+) was associated with a reduced risk of HTN: (HR: 0·88, 95 % CI: 0·81, 0·95, P = 0·003) for non-diabetic participants, (HR: 0·86, 95 % CI: 0·78, 0·95, P = 0·004) for those without MetS, (HR: 0·86, 95 % CI: 0·77, 0·95, P = 0·006) for participants without hypertriglyceridaemia, (HR: 0·88, 95 % CI: 0·81, 0·95, P = 0·002) for participants younger than 65 years and (HR: 0·86, 95 % CI: 0·70, 0·93, P = 0·001) for those older than 30 years.
Sensitivity analysis for the association of global diet quality score and its main subgroups with the hypertension incidence after excluding different population groups
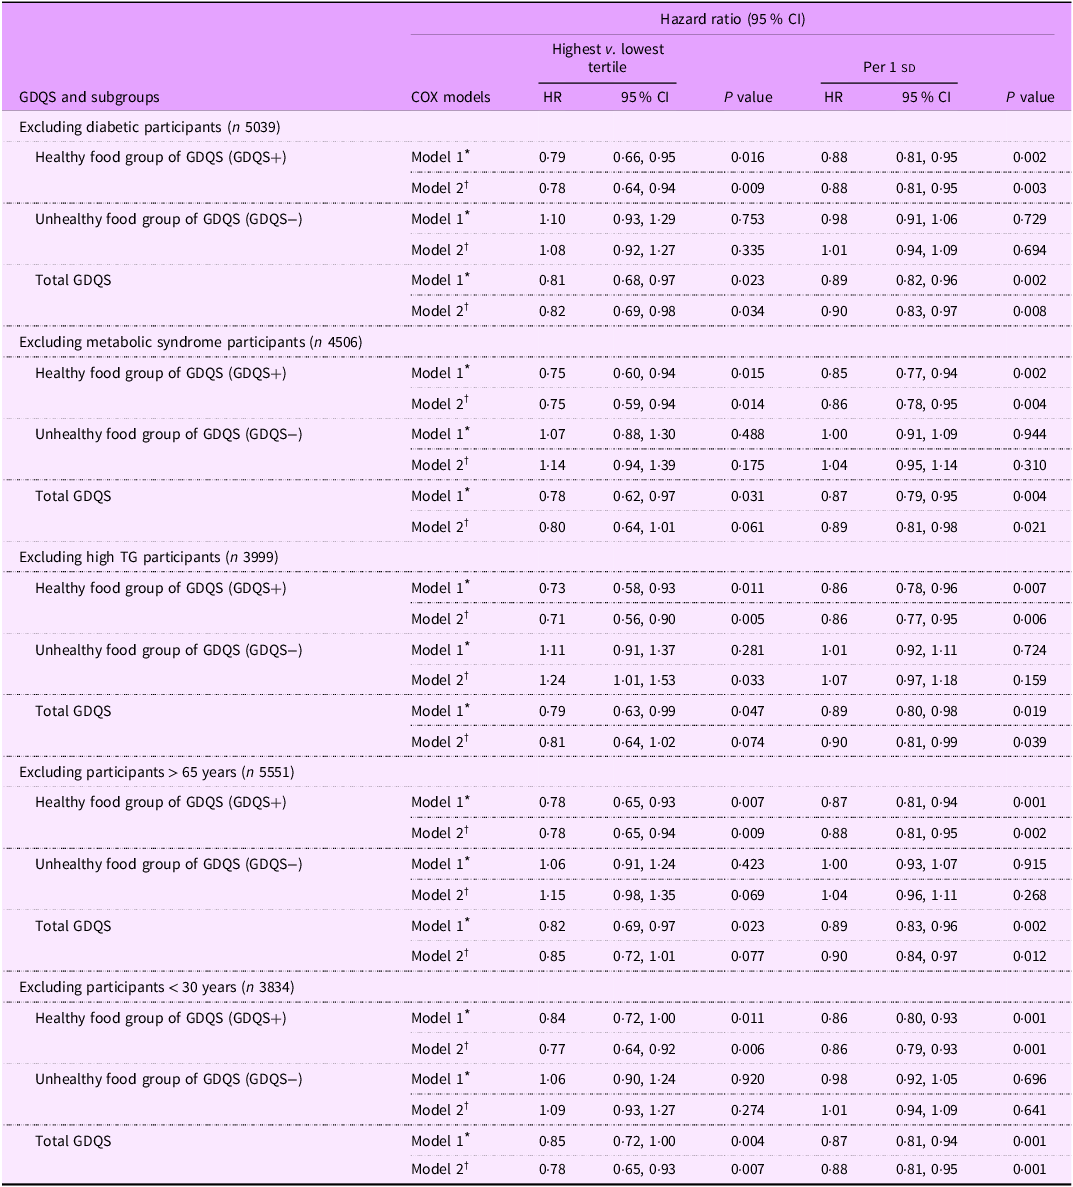
sd value of each score; GDQS, global diet quality score.
GDQS+ were classified as healthy food group of GDQS (sixteen dietary components) that included various vegetables, fruits, proteins and whole grains. For this food group, higher scores reflecting greater consumption.
GDQS− were classified as unhealthy food group of GDQS that included seven unhealthy components (processed meat, refined grains and baked goods, sweets and ice cream, sugar-sweetened beverages, juice, white roots and tubers and purchased deep-fried foods) and two potentially unhealthy food groups (red meat and full-fat dairy). For this food group, higher scores reflecting lower consumption.
* Model 1: adjusted for age and sex (except for sex subgroups), BMI, smoking, physical activity and energy intake.
† Model 2: adjusted for model 1 and education status, marital status, job status, baseline values of systolic blood pressure, fasting blood sugar and TGL: HDL-cholesterol ratio.
Based on Table 4, a significant positive association was observed between the unhealthy components (GDQS−) and HTN risk after excluding participants with hypertriglyceridemia (HR: 1·24, 95 % CI: 1·01, 1·53, P = 0·033). However, in the final model, the unhealthy dietary components of the GDQS (GDQS−) were not associated with the risk of HTN after excluding participants with T2D (HR: 1·08, 95 % CI: 0·92, 1·27, P = 0·335), MetS (HR: 1·14, 95 % CI: 0·94, 1·39, P = 0·175), those older than 65 years (HR: 1·15, 95 % CI: 0·98, 1·35, P = 0·069) and those younger than 30 years (HR: 1·09, 95 % CI: 0·93, 1·27, P = 0·274).
Furthermore, as shown in Table 4, the GDQS was also inversely associated with HTN risk in model 1 after excluding participants with diabetes (HR: 0·81, 95 % CI: 0·68, 0·97, P = 0·023), MetS (HR: 0·78, 95 % CI: 0·62, 0·97, P = 0·031), hypertriglyceridaemia (HR: 0·79, 95 % CI: 0·63, 0·99, P = 0·047), individuals older than 65 years (HR: 0·82, 95 % CI: 0·69, 0·97, P = 0·023) and those younger than 30 years (HR: 0·85, 95 % CI: 0·72, 1·00, P = 0·004). This association remained significant in the final model only for subjects after excluding participants with T2D (HR: 0·82, 95 % CI: 0·69, 0·98, P = 0·034) and among those younger than 30 years (HR: 0·78, 95 % CI: 0·65, 0·93, P = 0·007). Moreover, in the final model, each 1 sd increase in the GDQS was associated with a reduced risk of HTN: (HR: 0·90, 95 % CI: 0·83, 0·97, P = 0·008) for non-diabetic participants, (HR: 0·89, 95 % CI: 0·81, 0·98, P = 0·021), for those without MetS, (HR: 0·90, 95 % CI: 0·81, 0·99, P = 0·039), for participants without hypertriglyceridaemia, (HR: 0·90, 95 % CI: 0·84, 0·97, P = 0·012) for participants younger than 65 years and (HR: 0·88, 95 % CI: 0·81, 0·95, P = 0·001) for those older than 30 years.
Discussion
This prospective study investigated the association between GDQS adherence and HTN risk in Iranian adults. We found that higher adherence to GDQS was associated with a lower risk of HTN. Participants in the highest tertile of GDQS had a significant 17 % lower risk of developing HTN compared with those in the lowest tertile, with this protective effect being even stronger (22 % risk reduction) for the healthy components of the diet (GDQS+). However, no significant association was observed between the unhealthy components of GDQS (GDQS−) and HTN risk.
The GDQS, as a recently developed dietary assessment tool, has been evaluated across various metabolic conditions(Reference Bromage, Batis and Bhupathiraju27). While some studies have examined its relationship with different metabolic disorders, research specifically focusing on HTN risk remains limited. The existing evidence on GDQS and BP has mainly emerged from studies investigating broader metabolic outcomes, with heterogeneous results across studies. Specifically, while some research has indicated protective associations between GDQS and HTN or BP(Reference Hosseini-Esfahani, Daei and Ildarabadi18,Reference Liu, Zhao and Dai20) , others have reported contrary findings, particularly in sex-specific analyses(Reference Bromage, Andersen and Tadesse30).
Our study, conducted on a large population-based sample of men and women with a mean follow-up of 7·8 years, showed that higher adherence to the GDQS, particularly its healthy components, was inversely associated with the risk of HTN in Iranian adults. To our knowledge, only one prior study has directly examined the association between GDQS and HTN, conducted in a Chinese adult population, which similarly demonstrated that a higher GDQS score was associated with a reduced risk of new-onset HTN(Reference Liu, Zhao and Dai20). In a cohort study from the Tehran Lipid and Glucose Study, higher adherence to the healthy component of the GDQS was significantly associated with a lower incidence of MetS, whereas the unhealthy component showed no significant association. However, for high BP specifically, both healthy and unhealthy GDQS components showed inverse associations with high BP incidence, reducing the risk by 15 % and 10 %, respectively(Reference Hosseini-Esfahani, Daei and Ildarabadi18). Contrary to these protective effects, a cross-sectional study in Ethiopian adults, which aimed to evaluate the performance of the GDQS in capturing diet quality outcomes, reported a positive association between GDQS and HTN in men(Reference Bromage, Andersen and Tadesse30). This contradictory finding likely reflects their cross-sectional study design, which cannot establish temporality, and differences in population characteristics, including the focus on younger adults (15–49 years) with a different dietary pattern.
While the healthy components of GDQS showed a protective effect in our study, we found no significant association between unhealthy components and HTN risk. One explanation for this null association relates to the relatively low consumption of unhealthy food groups in our study population. Despite using a validated FFQ with trained interviewers, we acknowledge that dietary misreporting remains a concern, as participants commonly underreport consumption of foods they perceive as unhealthy, which could have masked potential associations. It is also plausible that the protective effects of healthy dietary components outweighed the detrimental impact of unhealthy foods. Consistent with our findings, the ATTICA study found that higher consumption of healthy food groups was more strongly and significantly associated with a lower risk of cardiometabolic outcomes, including CVD and T2DM, compared with the avoidance of unhealthy foods, which showed no significant association in adjusted models(Reference Damigou, Kouvari and Chrysohoou16). In a prospective study of Mexican women, improvements in GDQS over a 2-year period were associated with less weight and waist circumference gain, with benefits largely driven by increased intake of healthy foods. While certain unhealthy foods were linked to greater weight gain, the associations for healthy components were generally stronger and more consistent(Reference Angulo, Stern and Castellanos-Gutiérrez31). These findings suggest that the protective effects of higher GDQS on HTN risk are primarily driven by its healthy dietary components. Consequently, dietary interventions and public health strategies for HTN prevention might be more effective when prioritising the incorporation of healthy, nutritious foods over solely restricting less healthy choices.
The biological plausibility of these findings is supported by the presence of various bioactive compounds in the healthy components of GDQS, including antioxidants, flavonoids, potassium, Mg and dietary fibre. These nutrients exert synergistic effects on vascular health and BP regulation through several interrelated mechanisms. Potassium, for instance, facilitates vasodilation by modulating vascular smooth muscle tone and counteracting the effects of Na, thereby reducing blood volume and peripheral resistance(Reference Haddy, Vanhoutte and Feletou32). It also enhances nitric oxide (NO) production, which promotes endothelial function and arterial compliance(Reference Oberleithner, Callies and Kusche-Vihrog33). Flavonoids, a class of polyphenols abundant in fruits and vegetables, are known to upregulate endothelial nitric oxide synthase activity, increase NO bioavailability and suppress pro-inflammatory cytokines such as TNF-α and IL-6, thereby reducing vascular inflammation and oxidative stress(Reference Li and Zhang34). Mg contributes by blocking Ca channels and inducing smooth muscle relaxation, which lowers vascular resistance(Reference Cunha, Umbelino and Correia35). Dietary fibre may lower BP through improved insulin sensitivity and glycaemic control(Reference Mao, Huang and Zhu36). Moreover, fibre-rich foods are often rich sources of potassium and Mg, reinforcing the BP-lowering effects(Reference Haddy, Vanhoutte and Feletou37,Reference McRae38) . Overall, the interplay of these bioactive compounds in the healthy components of GDQS highlights their collective role in promoting vascular health and effectively regulating BP.
Based on our findings, the protective associations between GDQS and HTN risk were particularly pronounced among females and obese individuals. The stronger association observed in females appears to have some underlying mechanisms. Women generally demonstrate greater health consciousness and adherence to dietary recommendations and have higher overall diet quality compared with men(Reference Feraco, Armani and Amoah39,Reference Vinke, Navis and Kromhout40) . Furthermore, sex-specific hormonal factors, particularly oestrogen, may interact with dietary components to enhance their protective effects against HTN through improved endothelial function and reduced oxidative stress(Reference Xiang, Liu and Zhou41,Reference SenthilKumar, Katunaric and Bordas-Murphy42) . The more pronounced protective effect among obese individuals could be explained by their heightened susceptibility to dietary modifications. Obesity is a well-established risk factor for HTN(Reference Li, Cheng and Xu43), operating through mechanisms involving inflammation, oxidative stress(Reference Manna and Jain44), endothelial dysfunction(Reference Lobato, Filgueira and Akamine45), insulin resistance and increased sympathetic nervous system activation(Reference Shariq and McKenzie46). Therefore, the nutrient-dense foods emphasised in the healthy components of GDQS, which possess anti-inflammatory and antioxidant properties, may have a more substantial impact in this high-risk group by effectively targeting these pathophysiological mechanisms. This enhanced benefit aligns with previous studies that reported healthy dietary patterns showed stronger protective associations with HTN among individuals with higher BMI(Reference Livingstone and McNaughton47,Reference Magriplis, Panagiotakos and Kyrou48) , suggesting that improving diet quality could be an especially effective strategy for HTN prevention in this vulnerable population. Our results emphasise the importance of tailoring dietary recommendations to specific population subgroups and highlight the potential benefits of promoting GDQS adherence, particularly among women and individuals with obesity, as a strategy for HTN prevention. Future research should investigate the biological and behavioural mechanisms underlying the stronger protective associations between GDQS and HTN risk observed in obese individuals and females, to optimise dietary recommendations for these populations.
The persistence of these protective associations after excluding participants with metabolic conditions and across different age groups suggests that our findings are not driven by particular high-risk subgroups and supports the robustness of the GDQS–HTN relationship in our population. Furthermore, while the healthy components consistently showed protective effects, the unhealthy components demonstrated null or weak positive associations across all sensitivity analyses, reinforcing our main findings regarding the differential impacts of healthy and unhealthy dietary components on HTN risk. Specifically, the strongest protective association for healthy components was observed among participants without hypertriglyceridemia. This was also the only subgroup where unhealthy components showed a significant positive association with HTN risk. This finding suggests that individuals with normotriglyceridaemic profiles may be more metabolically sensitive to both the beneficial effects of healthy foods and the potential adverse impacts of unhealthy dietary patterns. Moreover, the persistence of protective associations across different age groups indicates that adopting a high-quality diet could be beneficial for HTN prevention throughout adulthood, emphasising the importance of lifelong healthy dietary habits in mitigating HTN risk and promoting overall cardiovascular health.
Our findings have important public health implications, suggesting that a diet rich in high-quality components, including a variety of fruits and vegetables, plant-based and lean animal proteins, whole grains and healthy fats, may protect against HTN, especially among females and individuals with obesity. These findings indicate that the GDQS could be integrated into national dietary guidelines as a practical tool for assessing and promoting overall diet quality. It’s simple, food-based scoring system makes it suitable for use in primary care, public health monitoring and nutrition education programs. However, barriers such as economic constraints, including the higher cost and limited availability of healthy GDQS components, limited nutritional knowledge and cultural food preferences, may hinder widespread adoption(Reference Yarmohammadi, Mozafar Saadati and Ghaffari49). To support implementation, strategies such as culturally adapted nutrition education campaigns, integration into existing public health programs and policy support to improve access to healthy foods may be needed. Future research should investigate the biological mechanisms underlying the stronger protective effects observed in females and obese individuals, evaluate the effectiveness of dietary modifications based on GDQS principles for HTN prevention in high-risk populations and examine how cultural dietary patterns might influence the implementation of GDQS recommendations in clinical practice.
To our knowledge, this study is the first in a Middle Eastern population to prospectively examine the association between GDQS and HTN risk, providing unique insights into this region. Its strengths include a large cohort with a suitable follow-up period (mean of 7·8 years), enhancing the reliability of our findings. Data on dietary patterns and physical activity were gathered using valid and reliable questionnaires. Moreover, the use of the validated GDQS, which has been applied in various regions worldwide, makes our results comparable to studies conducted in different global contexts. In addition, subgroup analyses were conducted, further elucidating how the relationship of GDQS with HTN risk may vary in different demographic and clinical groups, further increasing the robustness and generalisability of our findings. However, some limitations should be considered. While our prospective design provides stronger evidence than cross-sectional studies, the observational nature of the research prevents us from establishing definitive causal relationships. Although the use of questionnaires to assess physical activity and dietary intake may introduce measurement errors and recall bias, we minimised these issues by using validated and reliable questionnaires specifically developed for the Iranian population. Despite adjusting for multiple confounders, residual confounding such as unmeasured socio-economic factors or environmental influences may still be present. Another limitation concerns the generalisability of our findings, as participants were recruited from an urban population, which may not reflect dietary patterns or HTN risk in rural areas of Iran. Furthermore, potential changes in dietary habits during the 7·8-year follow-up period were not captured, which may have influenced the observed long-term associations.
Conclusions
In conclusion, this study is the first to examine the association between adherence to GDQS and risk of HTN in a Middle Eastern population. The results indicate that greater adherence to GDQS, particularly its healthy components, is linked to a lower risk of HTN, with stronger associations observed in women and individuals with obesity. Our findings support the potential value of incorporating the GDQS into dietary recommendations for HTN prevention; however, further intervention studies are needed to determine whether these associations are causal.
Supplementary material
For supplementary material accompanying this paper visit https://doi.org/10.1017/S1368980025101511
Acknowledgements
We express our appreciation to the participants for their enthusiastic cooperation and the staff of the Research Institute for Endocrine Sciences, Shahid Beheshti University Medical Sciences, Tehran, Iran, for their valuable help.
Financial support
This work was supported by the Research Institute for Endocrine Sciences, Shahid Beheshti University Medical Sciences, Tehran, Iran.
Competing interests
The authors declare no competing interests.
Authorship
P.M., H.F. and F.T. contributed to the conception, hypothesis and design of the study. H.F., N.S., S.H-N., M.K.J., M.N., P.M. and F.T. contributed to the research, statistical analyses and manuscript preparation. H.F. and F.A. supervised the study. All authors contributed to the manuscript review and critical intellectual content. All authors approved the final version of the manuscript. P.M. and N.S. equally contributed to this work (equally first author).
Ethics of human subject participation
Informed written consent was obtained from all participants. All procedures performed in studies involving human participants adhered to the ethical standards of the institutional and/or national research committee and with the 1964 Helsinki Declaration and its later amendments or comparable ethical standards. The study protocol was approved by the research council of the Research Institute for Endocrine Sciences, Shahid Beheshti University of Medical Sciences.
Data availability
The datasets analysed in the current study are available from the corresponding author on reasonable request.


 Open access