

Various energy evaluation systems have been developed and used for animals and man. Systems with a net energy (NE) approach account for differences in utilisation efficiencies of macronutrients. The impact of diet composition on the utilisation efficiency of digestible energy (DE) and/or metabolisable energy (ME) is shown in man( Reference Elia and Cummings 1 ), pigs( Reference Noblet, Fortune and Shi 2 – Reference van Milgen, Noblet and Dubois 4 ) and various fish species( Reference Carter and Brafield 5 – Reference Schrama, Saravanan and Geurden 10 ). In net ME systems for humans, the utilisation efficiency for ATP production of fat and protein is, respectively, 98 and 80 % relative to the efficiency of glucose( Reference Elia and Cummings 1 ). Most NE systems for animals were developed for growing and lactating animals( Reference Noblet, Fortune and Shi 2 , Reference Lofgreen and Garrett 11 , Reference Just 12 ). Consequently, in such NE systems for animals, the utilisation efficiency of nutrients is a combination of the utilisation efficiency for ATP production and the type of energy retained (protein or fat). In the Dutch NE system for growing pigs, the utilisation efficiency for growth is 46, 91 and 78 % for, respectively, digestible protein, digestible fat (dFat) and ileal digestible starch( 13 ).
Energy evaluation for growing fish is predominantly done on DE basis( Reference Bureau, Kaushik and Cho 7 , 14 ), thus assuming that the utilisation efficiency of DE for energy retention (k gDE) is independent of dietary nutrient composition. In addition, in calculations of dietary energy requirements for growth by applying factorial models, which is commonly applied in fish( Reference Cho and Bureau 15 – Reference Glencross 17 ), kgDE is assumed to be constant; that is, independent of the composition of the digested nutrients. Energy utilisation efficiencies of digestible macronutrients, such as those used in NE evaluation systems for pigs( Reference Noblet, Fortune and Shi 2 , 13 ), are not available for fish. Literature is inconsistent regarding fish-species differences in energy utilisation efficiency. In an across fish species comparison, k gDE was positively related to the trophic level, but could also be explained by difference in dietary proximate composition( Reference Schrama, Saravanan and Geurden 10 ). However, the energy efficiency of protein deposition was 9 % higher in Atlantic salmon compared with rainbow trout when fed the same experimental diets( Reference Azevedo, Van Milgen and Leeson 18 ). Moreover, several fish species are believed to have a limited metabolic capacity for the utilisation of dietary carbohydrates( Reference Kaushik 19 – Reference Hemre, Mommsen and Krogdahl 21 ). This would imply lower energy efficiencies of digestible carbohydrates in these fish species, such as diabetes in humans can affect food energetic values( Reference Elia and Cummings 1 ).
The study objectives were as follows: (1) to estimate the energy efficiency of digestible nutrients (protein, fat and carbohydrates) in fish; and (2) to assess whether these efficiencies differ between fish species: Nile tilapia (a glucose tolerant fish) v. rainbow trout (a glucose ‘intolerant’ fish). This was performed by re-examining data of nine studies undertaken with rainbow trout( Reference Dias 22 – Reference Richard 28 )(I Geurden, Institut National de la Recherche Agronomique (INRA), unpublished results) and eight studies in Nile tilapia( Reference Schrama, Saravanan and Geurden 10 , Reference Duyster 29 – Reference Bone 35 ).
Methods
Experiments used for this study needed to have sufficient data to calculate energy retention (RE) and digestible macronutrient intake (crude protein (CP), fat and total carbohydrates). Specific details on experiments included are given in the online Supplementary Tables S1–S3. Tilapia experiments were carried out at the experimental fish facilities (De Haar Vissen) of Wageningen University, and all procedures involving fish were carried out according to the Dutch law on experimental animals and approved by the Wageningen University Animal Experimental Committee. The rainbow trout experiments were performed at the fish facilities of INRA (Donzacq or St Pée-sur-Nivelle), according to the Guidelines of the National Legislation on Animal Care of the French Ministry of Research.
Fish, experimental unit and housing
All Nile tilapia (Oreochromis niloticus) experiments were carried out with male fish of the Swansea Silver GMT (Genetically Male Tilapia) strain. The initial body weight ranged between studies from 41 to 138 g (online Supplementary Table S1). Tilapia were kept in groups of twenty to forty fish per tank at a water temperature of 26·9 to 28·3°C. Tilapia tanks were connected to a recirculating system for water purification (gas exchange, solid removal and NH4 + removal by nitrification). All rainbow trout (Oncorhynchus mykiss) experiments were carried out with diploid fish of mixed sex, which had an initial body weight ranging between studies from 14 to 421 g (online Supplementary Table S2). These trout were reared at the experimental fish farm of the Institut National de la Recherche Agronomique in Lées-Athas or in Donzacq (France). For trout, group size ranged from forty-five to 100 fish per tank, water quality was maintained by flow-through and water temperature was constant within each experiment, being either 8 or 18°C. For the present study, tank (i.e. group of fish) was used as the experimental unit: sixty-eight tilapia and 156 trout tanks.
Diets and feeding
In total, twenty-three and forty-five diets were used in the tilapia and trout experiments, respectively. A large range of ingredients were included in the diets (online Supplementary Table S3), being related to the specific aims of the various experiments. Consequently, also a large between-diet variability in macronutrient composition was present (Table 1). Except for the large variability in macronutrients, all diets were formulated to be balanced for each fish species regarding vitamin, mineral and essential fatty acid content and amino acid profiles. In all trout and two of the tilapia experiments, fish were fed twice daily to apparent satiation. In the other seven tilapia experiments, fish were fed restrictively (online Supplementary Tables S1 and S2). Feed intake on DM basis ranged between experiments from 7·6 to 23·2 g/(kg0·8×d) and from 7·8 to 15·2 g/(kg0·8×d) for, respectively, tilapia and trout.
Proximate and digestible nutrient contents of Nile tilapia (n 23) and rainbow trout diets (n 45) of experiments included in the data set to estimate the energy efficiency of digestible nutrients (Mean values and standard deviations)
Min, minimum; Max, maximum; CP, crude protein; GE, gross energy; DP, digestible protein; DE, digestible energy.
Measurements
In tilapia, digestibility of nutrients and balances of energy and N were measured on the same fish (tanks), whereas digestibility of diets for trout was measured in fish other than those in which balance measurements were performed. For digestibility measurements in tilapia and trout, respectively, acid-insoluble ash and chromium oxide were used as inert markers, both being supplemented to the diets (online Supplementary Table S3). In seven of the tilapia experiments, faeces were collected by settling tanks, and in all trout and one tilapia experiment by Choubert collectors (online Supplementary Tables S1 and S2). For details on the collection procedure by settling tank, see Amirkolaie et al. ( Reference Amirkolaie, Verreth and Schrama 36 ) for tilapia and by Choubert collectors (see Choubert et al.( Reference Choubert, De la Noüe and Luquet 37 ) for trout). Faeces were daily stored at −20°C and pooled per tank. Both tilapia and trout faeces were freeze-dried before analysis. Tilapia diets and faeces were analysed for DM, CP, fat, ash, acid-insoluble ash and energy content as described by Schrama et al.( Reference Schrama, Saravanan and Geurden 10 ). For tilapia, total carbohydrate content of diet and faeces was calculated as DM minus CP minus fat minus ash. Trout diets and faeces were analysed for DM, CP, fat, chromium oxide and energy content as described by Dias( Reference Dias 22 ). For trout, ash was not analysed in faeces. Consequently, carbohydrate content was calculated from the measured energy content, CP and fat content, using 23·6, 39·5 and 17·2 kJ/g as the combustible energy content of CP, fat and carbohydrates, respectively( 14 ). Analytical methods and procedures were identical between experiments within species. From daily feed intake, dietary macronutrient composition and apparent digestibility coefficients of nutrients, the daily intake of digestible protein (dCP), dFat and digestible total carbohydrates (dCarb) was calculated.
For both fish species, N and energy balances were measured by the comparative carcass analyses technique. For number of fish sampled for initial and final body composition (see online Supplementary Tables S1 and S2). DM, CP, fat and energy content of fish were determined as described by Schrama et al.( Reference Schrama, Saravanan and Geurden 10 ) (for tilapia) and by Dias( Reference Dias 22 ) (for trout). Parameters of energy and N balance were calculated per tank as follows: N intake as feed intake times dietary N content; digestible N intake as N intake times N digestibility; N retention as final N body mass minus initial N body mass; N losses through branchia and urine as digestible N intake minus N retention; gross energy (GE) intake as feed intake times dietary energy content; DE intake as GE intake times energy digestibility; branchial urinary energy losses as N losses through branchia and in urine times the energy concentration of NH3-N (24·9 kJ/g( Reference Bureau, Kaushik and Cho 7 ), assuming all N being excreted as NH3-N); ME intake as DE intake minus branchial urinary energy losses; RE as final minus initial body energy quantities; heat production as ME minus RE; energy retained as protein was calculated as N retention times 6·25 times 23·7 kJ/g; and energy retained as fat was calculated as RE minus energy retained as protein. In addition, fat retention efficiency was calculated as an indication for the extent of de novo synthesis of fat as follows: fat retained divided by dFat intake.
To account for differences in body weight between fish species and experiments, digestible nutrient intakes, as well as N and energy balance parameters, were expressed per unit of metabolic body weight, being calculated as geometric mean body weight (BWg)=(√BWi×BWf), and then expressed on mean metabolic body weight (kg0·8) as (BWg/1000)0·8 where BWi and BWf are the initial and final fish body weight in g, respectively.
Statistical analysis
All statistical analyses were performed with Statistical Analysis Systems statistical software package version 9.1 (SAS Institute). Energetic efficiencies of digestible macronutrients were estimated separately for both species by multiple regression analysis of dCP, dFat and dCarb (in g/(kg0·8×d)) on RE (in kJ/(kg0·8×d)):
 $${\rm RE}_{j} \,{\equals}\,\mu {\plus}\beta 1{\times}{\rm dCP}_{j} {\plus}\beta 2{\times}{\rm dFat}_{j} {\plus}\beta 3{\times}{\rm dCarb}_{j} {\plus}e_{j} ,$$
where µ is the intercept being a measure of energy mobilisation at fasting (i.e. fasting heat production (FHP)); β1, β2 and β3 are, respectively, the energetic efficiencies of dCP (k NE;dCP), dFat (k NE;dFat) and dCarb (k NE;dCarb) (in kJ/g digested nutrient intake); j= 1, .., n; and n is 68 and 156 for tilapia and trout, respectively. Using the approach of Noblet et al.( Reference Noblet, Fortune and Shi 2 ), NE was calculated in this paper from Equation (1) as RE plus µ (i.e. NE=RE+FHP). Several studies in fish have demonstrated that environmental factors (e.g. water temperature, water O2 level, stocking density) can strongly affect the DE requirements for maintenance (DEm) without altering the energetic utilisation of DE (or ME)( Reference Lupatsch and Kissil 38 – Reference Lupatsch, Santos and Schrama 41 ). In a recent review( Reference Schrama, Saravanan and Geurden 10 ), a substantial between-study variability in DEm within several fish species was noted. Therefore, in order to obtain an unbiased estimation of energetic efficiency, a fixed effect of experiment was included into the statistical model (Equation (1)). Residual analyses were performed if non-included factors in the model (e.g. like initial body weight, body composition factors, ratio of protein:fat deposition) could explain part of the residual variation. Similarly, it was assessed if the relationships of dCP, dFat and dCarb with RE were polynomial. All aforementioned analyses were performed separately for rainbow trout and tilapia. Finally, a combined mixed model was run (with linear components of dCP, dFat and dCarb) to test whether the estimated energy efficiencies (β1, β2 and β3; i.e. k NE;dCP, k NE;dFat, k NE;dCarb) differed between Nile tilapia and rainbow trout. P<0·05 was considered significant.
Results
In the data set for estimating the energetic efficiency of digestible nutrients, mean dietary GE content was higher in the feeds for trout than in those for tilapia (22·4 v. 20·5 kJ/g DM; Table 1). This was because of the higher fat content and lower carbohydrate content of trout diets. For both fish species, a substantial between-diet variability in macronutrient composition was present. No large differences in mean apparent digestibility coefficient of nutrients over experimental diets were present between both fish species. Mean digestibility of CP and fat over diets was above 90 %. Variability between diets regarding nutrient digestibility was comparable between trout and tilapia (Table 1). For both fish species, variability in digestibility was larger for carbohydrates compared with CP and fat. Carbohydrate apparent digestibility ranged from 12 to 93 % and from 34 to 91 % between tilapia diets and trout diets, respectively. The higher GE content together with the similar energy digestibility resulted in a higher mean DE content for the trout diets than for the tilapia diets (17·3 v. 18·6 kJ/g DM; Table 1). This large variability in carbohydrate digestibility was predominantly because of the inclusion of ingredients with a high NSP content (cellulose, guar gum, wheat bran and so on) into some of the experimental diets (see online Supplementary Table S3). Averaged for all tilapia diets (n 23), 51, 23 and 26 % of DE originated from, respectively, digestible CP, fat and carbohydrates and the same for the trout diets (n 45) were 47, 35 and 18 %, respectively. The variability in digestible nutrient content between diets (Table 1) within the tilapia, as well as trout data sets, was larger than the variability in digestible nutrient intake per unit metabolic body weight (Table 2), owing to the differences in feed intake between experiments being included into the data sets. The CV between diets in intake of dCP, dFat and dCarb was, respectively, 43, 77 and 58 % for tilapia and 29, 28 and 43 % for trout.
Digestible nutrient intake and energy balance of Nile tilapia and rainbow trout fed different diets (n 23 and n 45, respectively) included in the data set to estimate the energy efficiency of digestible nutrients (Mean values and standard deviations)
Min, minimum; Max, maximum; dCP, digestible protein intake; dFat, digestible fat intake; dCarb, digestible carbohydrate intake; GE, gross energy; DE, digestible energy; ME, metabolisable energy.
Despite the fact that fish were fed to satiation in two of the eight tilapia experiments (eight of twenty-three diets) and in all trout experiments, averaged GE, DE and ME intakes over diets were slightly higher for tilapia (Table 2). Although mean ME intake over diets was higher in tilapia, RE was lower in tilapia compared with trout. This lower RE was predominantly related to a larger part of the energy being retained as fat in trout than in tilapia (63 v. 53 %; Table 2). Averaged over diets, in tilapia a larger proportion of the ME intake was lost as heat compared with trout (52 v. 46 %). For all energy balance parameters, the variability between diets was larger in the tilapia than in the trout data set (Table 2). Averaged over diets, fat retention efficiency was 1·07 and 0·90 in the tilapia and trout data set, respectively. In ten of the twenty-three tilapia diets (four of the eight tilapia diets fed until apparent satiation) and in seven of the forty-five trout diets, fat retention efficiency was above 1, indicating that de novo fat synthesis occurred.
By multiple linear regression of dCP, dFat and dCarb on RE (i.e. NE), the energetic efficiencies of dCP, dFat and dCarb were, respectively, 11·5 (49 %), 35·8 (91 %) and 11·3 kJ/g (66 %) for tilapia and 15·1 (64 %), 35·0 (89 %) and 12·1 kJ/g (70 %) for trout (Table 3; Equations (2) and (3)). k NE;dCP was significantly higher in trout than in tilapia (P<0·05), whereas k NE;dFat and k NE;dCarb were similar for trout and tilapia (P>0·05). For both fish species, the fixed effect of experiment was significant in the multiple linear regression model (P<0·001; Equations (2) and (3), Table 3), indicating that the intercepts (an indicator of FHP) differed between experiments within species. Using the mean dietary dCP, dFat and dCarb content within each species (Table 1) and the estimated fixed effect of experiment, DEm per experiment were calculated. Averaged over the eight tilapia experiments, DEm was 71 kJ/(kg0·8×d) and ranged from 56 to 89 kJ/(kg0·8×d). For the nine trout experiments, mean DEm was 67 kJ/(kg0·8×d) and DEm ranged from 41 to 91 kJ/(kg0·8×d).
Estimated net energy equation in Nile tilapia and rainbow trout in comparison with net energy formulas in pigs
NE, net energy; RE, retained energy; dCP, digestible protein; dFat, digestible fat; dCarb, digestible carbohydrates (comprising of starch, sugars and NSP); dRest, the remaining dietary fraction being digestible DM minus dCP minus dFat minus ST and minus the digestible ash fraction (see Noblet et al. ( Reference Noblet, Fortune and Shi 2 )); dSTe, enzymatically digestible starch; dSTf, the amount of starch that is digested after microbial fermentation; ST, starch (both enzymatically and fermentable degradable); dNSP, digestible NSP.
* In the estimated equation of the present study, NE is expressed in kJ/(kg0·8×d) and digestible nutrient intakes (dCP, dFat and dCarb) in g/(kg0·8×d). Using the approach of Noblet et al. ( Reference Noblet, Fortune and Shi 2 ), NE in the present study was calculated as retained energy plus the fasting heat production (being the intercept, µ, from Equation (1)). In the NE formulas for pigs, NE is expressed in MJ/kg feed and digestible nutrients in g/kg feed.
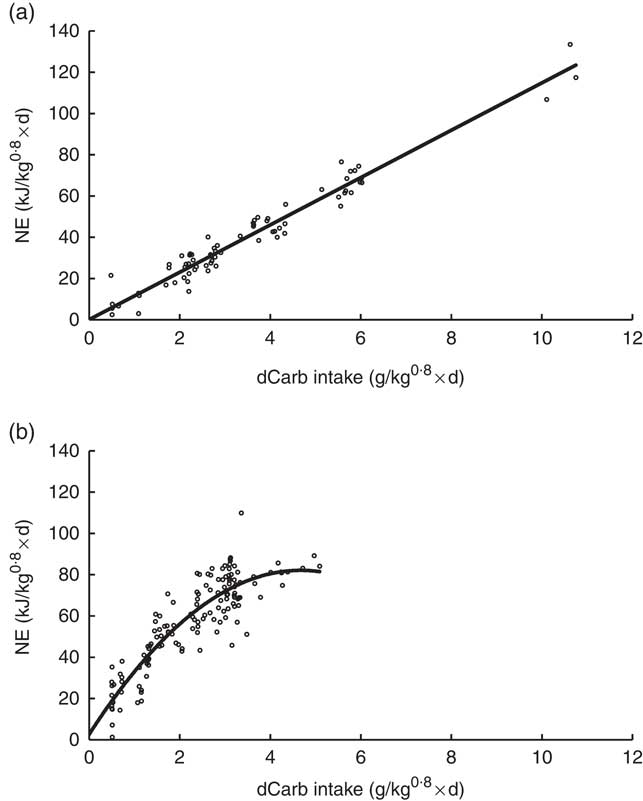
In Nile tilapia, all digestible nutrient intakes were linearly related to RE in the multiple regression model (i.e. for none of the digestible nutrients a polynomial factor was significant; P>0·05). However, in trout the quadratic polynomial of dCarb was significant (P<0·01), whereas for dCP and dFat only the linear component was significant (Equation (4), Table 3). In Fig. 1, the relationship between dCarb and NE (corrected for zero dCP and dFat) in tilapia and trout is given. For tilapia, NE increased linearly with dCarb (Fig. 1(a)). In trout, NE also increased with increasing dCarb, but the increase in NE levelled off between an intake of dCarb of 3 to 4 g/(kg0·8×d) (Fig. 1(b)). The linear relationships between NE and dCP and between NE and dFat in both fish species are given in the online Supplementary Fig. S1.
Relationship between net energy (NE) and digestible carbohydrate (dCarb) intake for Nile tilapia (a) and rainbow trout (b). The NE values are corrected for variation in digestible protein (dCP) and digestible fat (dFat). This was performed as follows: the measured retained energy value for each data point in the data set was increased with the estimated fasting heat production to obtain the NE value, which was then corrected towards zero dCP and dFat intake in order to have only the effect of dCarb on NE. This was carried out using Equation (2) for Nile tilapia and Equation (4) for rainbow trout (Table 3).
Discussion
In aquaculture, until now energy evaluation and feed formulation of feed were based on the DE content of diets. This DE approach does not take into account the fact that utilisation efficiency for energy retention might be affected by the nutrient composition of DE (i.e. the ratio between digestible protein, fat and carbohydrates, respectively, dCP, dFAT and dCarb). The assumption that the energy utilisation efficiency is independent of the diet composition is also applied in the commonly used factorial approach for calculating the dietary energy requirements in fish; see for example Cho & Bureau( Reference Cho and Bureau 15 ), Lupatsch et al. ( Reference Lupatsch, Kissil and Sklan 16 ) and Glencross( Reference Glencross 17 ). In the Dutch( 13 ) and French( Reference Noblet, Fortune and Shi 2 ) NE evaluation system for pigs, the impact of the nutrient composition of DE is accounted for by relating/predicting the energy retention as multiple linear function of the different types of digestible nutrients intake (see Table 3). In these NE approaches for pigs, linear relationship enables to estimate the NE value of a diet/ingredient independent of the feeding level (i.e. digestible nutrient intake). The present study demonstrated that for Nile tilapia all digestible nutrients were linearly affecting the energy retention, resulting in an NE formula being independent of feeding level. However, in trout this is not the case. The impact of dCarb on energy retention was curvilinear (Fig. 1(b)), which has the implication that the NE value of a diet (ingredient) is dependent on the feed intake (i.e. dCarb intake) of the trout.
The correctness of the estimated NE formulas strongly depends on the quality of the available and used data sets. The diets included should be within physiological ranges of the fish species. Therefore, only studies were included into the data sets where we were sure that amino acid pattern, vitamin and mineral content were not limiting. The power of the statistical analyses is dependent, for example on contrasts in X-variable used (dCP, dFat and dCarb). Therefore, within the data sets a substantial contrast in dietary macronutrient composition was required. Compared with practical diets, for tilapia some diets were high in protein and fat content. However, the very clear linear relationships between ER and digestible nutrient intake for tilapia can be seen as an indication that the diets were not too extreme (Fig. 1 and online Supplementary Fig. S1). For trout, some diets were very high in digestible carbohydrate content (dCarb) – that is, high dietary starch. The curvilinear response between dCarb and ER (Fig. 1(b)) might be an indication that these diets were outside the physiological normal range. The high R 2 (>0·91) of the estimated equations supports our opinion that these NE formulas have relevance for practical feed formulation. In the tilapia data set, only eight out of the twenty-three diets were fed to satiation. There is a possibility that the estimated NE formulas are influenced by this; again the high linearity of the responses does not support this. Other factors effecting the quality of the estimated NE formulas are those that bias the estimated digestible macronutrient intakes (dCP, dFat and dCarb). First of all the method of faeces collection, which were Choubert collectors and settling tanks, may have led to an underestimation of digestible nutrient intake. Moreover, in both data sets, the digestibility of carbohydrates was determined indirectly, which may have increased the error of the estimated dCarb intake. The NE formulas would have been more valuable, if like for pigs (see Table 3) the carbohydrate fraction would have been split into a starch (enzymatically digestible) and a NSP (including crude fibre; inert or being fermentable) fraction. Therefore, future nutritional studies in fish will increase their relevance if the carbohydrate fraction is studied in more detail.
The curvilinear relation of dCarb with energy retention indicates that at higher intakes of carbohydrates the potential for energy retention (i.e. NE value) diminishes, which confirms the general consensus that trout (and more general carnivorous fish species) poorly metabolises glucose( Reference Glencross, Blyth and Bourne 42 ). In fish, the absorption of glucose from the intestine originating from digested starch is highly efficient( Reference Furuichi and Yone 43 ). Furthermore, increasing intakes of digestible carbohydrates result in elevated blood glucose levels in almost all species( Reference Furuichi and Yone 43 , Reference Bergot 44 ). Cold water fish such as the rainbow trout exhibit a postprandial hyperglycaemia, and the clearance of the glucose from blood stream takes more time when compared with warm water fish( 14 ). Excretion of glucose in the urine and through the gills has been observed in hyperglycaemic fish( Reference Hemre, Mommsen and Krogdahl 21 , Reference Bureau 45 ). Owing to this partial postprandial excretion of glucose, Bureau( Reference Bureau 45 ) stated that in rainbow trout the digestible starch reduced the ME value. In addition, it was initially hypothesised that limited glucose phosphorylation capacity would also limit metabolic utilisation of glucose( Reference Walton and Cowey 46 ). However, later studies have shown that almost all teleosts are capable of regulating glucose storage, but there is a persistent high level of endogenous glucose production independent of carbohydrate intake level, which may lead to a putative competition between exogenous (dietary) glucose and endogenous glucose as the source of energy, which may explain the poor dietary carbohydrate utilisation in fish. Both aforementioned observations most likely explain the curvilinear relationship that was observed for trout in our study. On the basis of the curve (see Fig. 1(b)), it seems that at a dCarb intake of about 3–3·5 g/(kg0·8×d) trout cannot utilise any extra amount of digestible carbohydrates. In contrast, tilapia did not show any limit to utilise dCarb. It requires future assessment to check whether this curvilinearity is representative for all salmonids/carnivorous fish species or whether this is specific for trout alone.
k NE;dCarb in Nile tilapia (66 %) was lower than the efficiency for enzymatic digested starch (k NE;dStach) in pigs either using the French NE system (84 %)( Reference Noblet, Fortune and Shi 2 ) or the Dutch NE system (78 %)( 13 ) (Table 3). The lower k NE;dCarb in tilapia compared with pigs might be due to an overestimation of measured digestibility coefficients of nutrients in fish because of issues of leaching of nutrients from both feed and faeces into the water( Reference Hua and Bureau 47 , Reference Glencross, Evans and Dods 48 ). This aspect of leaching might also have affected the energy efficiencies of the other nutrients (protein, k NE;dCP; fat, k NE;dFat). Most likely, the observed lower k NE;dCarb in tilapia may relate to the fact that in the present study no distinction was made between enzymatic digested carbohydrates and fermentable carbohydrates (i.e. NSP). In pigs, the energetic efficiency in the NE formulas is about 70 % lower for carbohydrates that are fermented in comparison with the energetic efficiency of ileal digested starch (k NE;dstarch; Table 3)( Reference Noblet, Fortune and Shi 2 , 13 ). Most likely also in fish the energetic efficiency of ‘digested’/fermented NSP is lower than k NE;dStarch. However, in most fish species NSP is considered inert and the extent of microbial fermentation is marginal. However, this is most likely related to the water temperature (warm v. cold water fish species). In Nile tilapia, it was shown that NSP fermentation is present on the basis of positive digestibility coefficients for NSP and the increase in volatile fatty acids in the distal part of the intestine( Reference Amirkolaie, Verreth and Schrama 36 , Reference Amirkolaie, Leenhouwers and Verreth 49 ). In addition, in a diet rich in NSP originating from DDGS, about 17 % of the DE originated from fermented/digested NSP( Reference Haidar, Petie and Heinsbroek 50 ). In the data set on Nile tilapia used in the present study, on average 26 % of the DE intake was coming from digested carbohydrates. It is also most likely that a part of this carbohydrate-related DE originated from NSP. Therefore, the estimated NE formula for tilapia might improve when the carbohydrate fraction is split into enzymatically digested and fermented components. This becomes more relevant when more NSP-rich ingredients are included into fish diets. It can be hypothesised that the observed lower k NE;dCarb is an indication for lower capacity of all fish species to utilise absorbed glucose as is documented for salmonids( Reference Polakof and Panserat 51 , Reference Walton and Cowey 52 ). However, the data of the present study do not support such a glucose intolerance of tilapia, because the relationship between dCarb and RE remained linear over a wide range of dCarb intakes (Fig. 1(a)). In the diets with highest levels of dCarb intake, the fat retention efficiency was about 200 % (Table 2), indicating a large de novo fat synthesis capacity in tilapia( Reference Figueiredo-Silva, Saravanan and Schrama 53 ).
k NE;dCP of Nile tilapia estimated in this study is similar to the k NE;dCP used in NE formulas for pigs (Table 3). However, the estimated k NE;dCP for rainbow trout was dependent on how the dCarb fraction was included in the formula (linear v. quadratic; see Table 3). Using a linear relationship for dCarb, the k NE;dCP was significantly higher in trout compared with tilapia and thus also pigs. When including the quadratic component of dCarb, the estimated k NE;dCP was not (or less) different from tilapia and pigs. Ignoring the quadratic component for dCarb in trout thus introduces an artefact in the estimation of k NE;dCP, which is related to the poor utilisation of glucose by trout. Diets with a low dCP content often coincide with a high dCarb content, whereas at high dCP levels the reverse occurs. In the NE formula for trout where only linear components are used, the estimated k NE;dCarb was different from that of tilapia; this indicates that in such a ‘linear’ NE formula for trout the k NE;dCP is overestimated. This observation of biased estimations of the k NE;dCP might imply that in other fish species with limited ability to metabolise glucose, the estimates of energetic efficiency for protein might also be influenced. For example, the higher energetic efficiency of DE (or ME) for protein deposition in salmon compared with trout might also be related to differences in glucose tolerance( Reference Azevedo, Van Milgen and Leeson 18 ).
The estimated k NE;dCP in tilapia and in trout (including the quadratic component of dCarb; Equation (4), Table 3) is very much comparable with the values used for pigs( Reference Noblet, Fortune and Shi 2 , 13 ). This is opposite to the initial premise that terrestrial animals (such as pigs) would have a lower k NE;dCP because of the differences in N excretion compared with fish: urea synthesis v. direct excretion of NH4 + via the gills( Reference Walton and Cowey 46 , Reference Walton and Cowey 52 ). We currently lack a good explanation for this observation. Diets with an imbalanced amino acid composition are known to have a reduced protein efficiency(e.g. ( Reference Saravanan, Geurden and Figueiredo-Silva 54 )). However, one could speculate that all diets, which were included in the tilapia and trout data set, had imbalances in the dietary amino acid profile. However, to our good knowledge, all studies included into the data sets had a balanced amino acid profile according to National Research Council( 14 ). Applying the NE approach to other fish species would be interesting to validate whether the observed equal k NE;dCP compared with pigs is universal for fish.
k NE;dFat estimated in the present study (Table 3) indicate that both carnivorous (rainbow trout) and omnivorous (Nile tilapia) fish species can utilise dietary fat as efficiently as terrestrial farm animals (ranging from 84 to 91 %). This is again striking considering the large differences in trophic level between pigs, trout and tilapia. The observation in the present study for relatively constant utilisation efficiencies for both digested protein and digested fat (k NE;dCP; k NE;dFat) confirms the hypothesis that difference in energetic efficiency for growth in relation to trophic level is induced by difference in nutrient composition of the test diets( Reference Schrama, Saravanan and Geurden 10 ), which is also in line with the recent finding in Asian seabass( Reference Glencross, Blyth and Bourne 42 ).
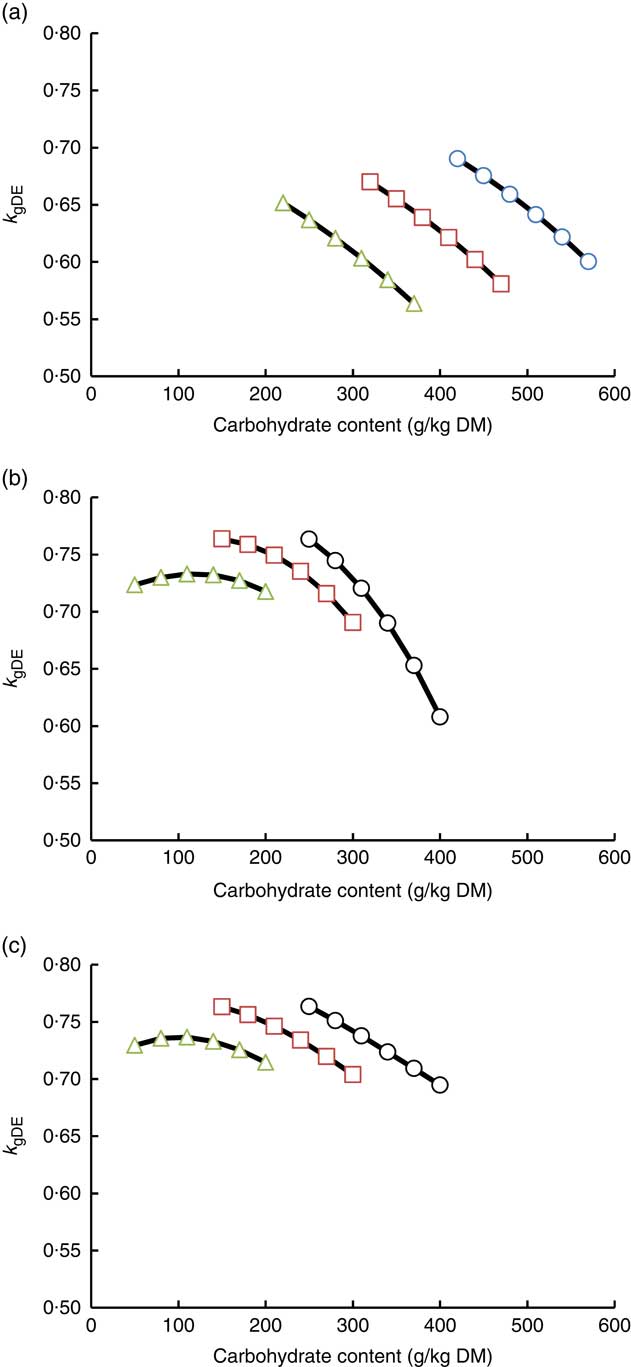
Until now, for most fish species, energy evaluation is based on a DE approach. In the DE approach of energy evaluation, it is assumed that the relationship between RE and DE intake is independent of diet composition. In other words, the efficiency of k gDE is assumed not to be altered by nutrient composition of DE (the source of DE). The current estimated NE formulas for tilapia and trout show that fat is more efficiently used for NE in comparison with protein and carbohydrates. In fact, the k gDE of a diet can be calculated from the estimated NE formulas in combination with the dietary digestible nutrient composition/intake (i.e. for tilapia being a function of k NE;dCP k NE;dFat and k NE;dCarb). In Fig. 2(a), the impact of digestible nutrient composition on k gDE is depicted for Nile tilapia using the estimated NE formula (2) from Table 3. Because dCP, dFAT and dCarb are all linearly related to NE, the calculated k gDE is independent of the feeding level. The calculations demonstrate that increasing the digestible carbohydrate, as well as the digestible protein content, results in a decline in k gDE (Fig. 2(a)) and increasing the fat content increases k gDE (data not shown). These findings are in line with the observation of a reduction in k gDE when dietary fat is exchanged with dietary starch( Reference Pfeffer, Rodehutscord and Pfeffer 6 , Reference Schrama, Saravanan and Geurden 10 , Reference Glencross, Blyth and Bourne 42 ). In Fig. 2(b), the impact of digestible nutrient composition on k gDE is depicted for rainbow trout using the estimate NE formula (4) in which dCarb is included as having a curvilinear response in NE from Table 3. In Fig. 2(b), it is assumed that the digestibility of the nutrients is not altered with changing dietary composition. As a consequence of this quadratic response of dCarb, the NE of a diet and ingredient is dependent on the actual intake of dCarb. In other words, the NE value is dependent on the feeding level (feed consumption) of the trout. This also implies that the k gDE in trout is dependent on the feeding level (data not shown). With increasing DE intake, the NE value declines. This is also an explanation for the often observed curvilinear relationship between DE and RE in various fish species( Reference Glencross 17 , Reference Glencross, Hawkins and Evans 55 – Reference Glencross, Hien and Phuong 57 ). Fig. 2(b) shows that in contrast to tilapia the impact of changes in dietary nutrient composition on k gDE is not linear. The impact of increasing the dietary dCarb content on k gDE is dependent on both dCP and dFat contents. At high protein levels, the actual dCarb contents of the diets are lower and thus the change in dCarb has a smaller impact on k gDE, whereas in diets with a low protein content the impact of increasing the carbohydrate content (starch content) is larger. The reduction of k gDE owing to higher dietary carbohydrates was also observed in a recent study on Asian seabass (Lates calcarifer)( Reference Glencross, Blyth and Bourne 42 ), suggesting that this species also has a limited capacity to utilise dietary carbohydrates. The outcome of the present study for rainbow trout also shows that the NE value of a starch-rich ingredient is dependent upon the remaining composition of the diet and the actual inclusion level. The energetic value of the starch-rich ingredient will decline with the inclusion level more strongly in a low-protein diet compared with a high-protein diet (Fig. 2(b)). In trout, the digestibility of starch declines with increasing starch levels (e.g.( Reference Glencross, Rutherford and Bourne 58 )). Therefore, in Fig. 2(c) this declining digestibility of starch was included in the calculation of k gDE. The same pattern in k gDE was still present, but the decline in k gDE was less extreme at low dietary protein levels compared with the situation in which digestibility of starch was fixed. Thus, the decline in digestibility of carbohydrates with increasing inclusion levels partially dampens the reduction in k gDE.
Impact of dietary composition on utilisation efficiency of digestible energy for energy retention (k
gDE) derived from Equation (2) for tilapia (a) and Equation (4) for trout assuming a constant carbohydrate digestibility (b) and for trout assuming a dose-dependent response in carbohydrate digestibility (c). NE equations are given in Table 3. The exchange of fat by carbohydrates on weight basis in the diets is depicted for three dietary protein levels. In the calculations, all diets contained 10 % crude ash, and the digestibility of protein, fat and carbohydrates was fixed at, respectively, 91, 93 and 67·5 % for Nile tilapia and 91, 90 and 70 % for rainbow trout in (b). In (c), the calculations for trout were done assuming that carbohydrate digestibility was 90 % at a dietary carbohydrate content of 50 g/kg and declining linearly to 55 % at a carbohydrate content of 400 g/kg. The NE equation for trout is dependent on the applied feeding level, which is because of the quadratic component for digestible carbohydrates in Equation (4). The estimations of k
gDE for trout were carried out by calculating the increase in retained energy when the feed intake was increased from 13 to 13·1 g/(kg0·8×d). a: ![]() , 30 % crude protein (CP);
, 30 % crude protein (CP); ![]() , 40 % CP;
, 40 % CP; ![]() , 50 % CP; b and c:
, 50 % CP; b and c: ![]() , 35 % CP;
, 35 % CP; ![]() , 45 % CP;
, 45 % CP; ![]() , 55 % CP.
, 55 % CP.
Conclusion
This study shows that the efficiency with which the DE is used for energy retention is affected by the composition of the DE – that is, dCP, dFat and dCarb. However, this effect of the composition of digestible nutrient intake on the energetic utilisation efficiency was different between Nile tilapia and rainbow trout. For Nile tilapia dCP, dFat and dCarb are linearly related to the energy retention. The estimated energetic efficiencies of dCP, dFat and dCarb for NE retention were 49, 91 and 66 %, respectively, showing large similarity with pigs. For trout, dCP and dFat were linearly related to NE, but dCarb was not linearly, but curvilinearly, related to NE. With increasing dCarb intake the increase in NE levelled off, which indicates the limited capacity to handle starch/glucose by rainbow trout (a carnivorous, glucose intolerant fish). In this study, NE formulas for Nile tilapia and rainbow trout were derived to predict the potential for energy retention of diets/ingredients. The curvilinear relationship between dCarb and NE in trout implies that the actual NE value of a diet depends on daily dCarb intake, which is dependent on the feeding level, dietary carbohydrate content and digestibility.
Acknowledgements
The present study was funded by Wageningen University, The Netherlands, and INRA, France, as part of the INRA-WUR Aquaculture platform.
The authors’ contributions are as follows: J. W. S., I. G. and S. J. K. initiated the idea and concept of the study; I. G. and S. J. H. provided and constructed the trout data set; J. W. S. and L. T. H. provided and constructed the tilapia data set; J. W. S. and M. N. H. performed the statistical analysis and wrote the paper; and all authors reviewed the data, aided in the result interpretation and critically reviewed, read and approved the final manuscript; S. J. K. undertook the work when the author was with INRA, St Pée sur Nivelle, France.
The authors declare that there are no conflicts of interest..
Supplementary Material
For supplementary material/s referred to in this article, please visit https://doi.org/10.1017/S0007114518000259


