


Introduction
The construction industry, which is vital to the maintenance and development of infrastructure across the United States (US), is experiencing high demand for workers (Associated Builders and Contractors 2023). In 2023, there were more than 8.4 million tradesworkers in construction and extraction occupations (US Department of Labor, Bureau of Labor Statistics 2022). Over the next ten years, employment is expected to vary by trade, with some trades, such as electricians, expected to grow faster than the average for all US occupations (US Department of Labor, Bureau of Labor Statistics 2023). However, there is also a simultaneous shortage of workers who have completed training or apprenticeship programmes in the trades (known as skilled workers), with projections indicating that, to meet demand, the number of new workers entering the industry would need to increase by 540,000 workers annually (Associated Builders and Contractors 2023). This shortage can be attributed to an ageing skilled trade workforce that is approaching retirement, as well as attrition from construction occupations (Associated Builders and Contractors 2023; US Department of Labor, Bureau of Labor Statistics 2023), compounded by a decline in workers entering skilled trades (Associated Builders and Contractors 2023). Therefore, to meet industry demand, it is necessary to both increase the number of new skilled workers who enter the industry and reduce attrition from the construction workforce.
Apprenticeship programmes are essential pipelines of skilled workers in the construction industry, providing skills that are immediately transferable to jobs in the trades and a direct pathway to enter the construction workforce (US Department of Labor, Office of Apprenticeship 2022). In the US, apprenticeship programmes include both classroom education and on-the-job training (Washington State Department of Labor & Industries 2024). Typically, programmes take 2 to 4 years to complete (US Department of Labor, Office of Apprenticeship 2022), but can be completed in less than 1 year or up to 6 years depending on the occupation (Farrell and Lawhorn Reference Farrell and Lawhorn2022). Apprenticeships must be registered with either the Department of Labor’s Office of Apprenticeship or State Apprenticeship Agencies (Bilginsoy Reference Bilginsoy2003; US Department of Labor, Office of Apprenticeship 2023b). Programs can either be operated solely by employers, or jointly between employers and trade unions (Bilginsoy Reference Bilginsoy2003). As of 2023, nearly 200,000 workers were actively registered across construction apprenticeship programs in the US, representing an increase in apprenticeship enrolment of 77% over the last decade (US Department of Labor, Office of Apprenticeship 2023c). Increasing the number of new workers who enter the industry through successful completion of apprenticeship programs is a potential method to address the issue of skilled worker shortages because 92% of workers who complete apprenticeship programs retain employment after graduation (Jones et al Reference Jones, Hertel-Fernandez and DeCarlo2021). However, completion rates in apprenticeship programs remain low, with more than 65% of apprentices leaving their programs before completion (i.e., ‘cancellation’) (Jones et al Reference Jones, Hertel-Fernandez and DeCarlo2021; US Department of Labor, Office of Apprenticeship 2023c). To promote retention in apprenticeship programs and therefore increase the number of apprenticeship graduates who enter the industry, it is necessary to identify factors that may contribute to cancellation from apprenticeship programs, such as gender and race/ethnicity.
Despite a recent initiative by the US Department of Commerce to increase the number of women in the trades (US Department of Commerce 2022), construction occupations remain male-dominated, with females comprising only 4.3% of tradesworkers in construction and extraction occupations in 2023 (US Department of Labor, Bureau of Labor Statistics 2022); this issue is not trade-specific and impacts all construction occupations (US Department of Labor, Bureau of Labor Statistics 2022). The industry also continues to systematically exclude participation of minorities, particularly women (Dainty and Lingard Reference Dainty and Lingard2006). In construction, the traditional culture of working long hours is perceived to demonstrate commitment to the job, with an expectation to work overtime when needed (Dainty and Lingard Reference Dainty and Lingard2006; Fielden et al Reference Fielden, Davidson, Gale and Davey2000). However, compared to their male counterparts, tradeswomen often have greater family responsibilities, and with less work-life balance support or flexibility provided by the industry, tradeswomen may be forced to choose between advancing their career and family duties (Fielden et al Reference Fielden, Davidson, Gale and Davey2000). On an individual level, women in the construction industry are often discriminated against, and disproportionately experience skill underutilisation, overcompensation (undertaking physical tasks exceeding what the body is physically prepared to undertake, increasing risk of injury), bullying, and sexual harassment due to their gender (Curtis et al Reference Curtis, Meischke, Stover, Simcox and Seixas2018; Goldenhar et al Reference Goldenhar, Swanson, Hurrell, Ruder and Deddens1998; Goldenhar and Sweeney Reference Goldenhar and Sweeney1996). Sanitary facilities for women and personal protective equipment that fits women’s bodies are often lacking, leading to safety hazards that uniquely affect tradeswomen (Curtis et al Reference Curtis, Meischke, Stover, Simcox and Seixas2018; Goldenhar and Sweeney Reference Goldenhar and Sweeney1996; Ontario Women’s Directorate 2006; Onyebeke et al Reference Onyebeke, Papazaharias, Freund, Dropkin, McCann, Sanchez, Hashim, Meyer, Lucchini and Zuckerman2016). These concerns often go unreported due to tradeswomen’s more tenuous job security compared to their male counterparts and the potential for retaliation (Goldenhar and Sweeney Reference Goldenhar and Sweeney1996). Research has indicated that these gendered exposures not only negatively impact health and well-being of tradeswomen (Curtis et al Reference Curtis, Meischke, Stover, Simcox and Seixas2018; Goldenhar et al Reference Goldenhar, Swanson, Hurrell, Ruder and Deddens1998; Goldenhar and Sweeney Reference Goldenhar and Sweeney1996) but also contribute to lower rates of recruitment and retention of women into the industry (Goldenhar et al Reference Goldenhar, Swanson, Hurrell, Ruder and Deddens1998; Wagner and Kulwiec Reference Wagner and Kulwiec2022), which may include apprenticeship programs. The percentage of women in construction occupations varies by trade; three trades with the highest percentage of female workers are painters (10.4%), sheet metal workers (6.5%), and floor layers (5.8%). The trades with the fewest women, by percentage, are glaziers (<1%), boilermakers (<1%), equipment operators (1%), and bricklayers (1.5%).
The US construction industry is predominantly White (87.1%), and 40.3% of construction workers identify as Hispanic or Latino (US Department of Labor, Bureau of Labor Statistics 2022). Racial and ethnic minorities disproportionately also experience bullying and discrimination (Riggall et al Reference Riggall, Skues and Wise2017). Industries that are primarily White, such as construction, often exclude racially minoritised workers, with these workers often relegated to lower-salary positions with fewer opportunities for occupational advancement (Byars-Winston et al Reference Byars-Winston, Fouad and Wen2015; Isingizwe et al Reference Isingizwe, Eiris and Gheisari2023). As higher-paying and managerial positions tend to be dominated by non-Hispanic White workers, racially and ethnically minoritised workers who are new to the industry may be discouraged, leading to attrition from both the industry and their apprenticeship programs (Isingizwe et al Reference Isingizwe, Eiris and Gheisari2023).
Representation of racially and ethnically minoritised workers in construction also varies by trade (US Department of Labor, Bureau of Labor Statistics 2022). Black workers, who represent 7.2% of construction tradesworkers, have higher representation in trades such as plumbers, pipefitters, and steamfitters (10.1%); sheet metal workers (9.9%); and construction labourers (9.1%), but have notably lower representation in trades such as brickmasons, blockmasons, and stonemasons (1.1%); carpet, floor, and tile installers (1.5%); and cement masons (1.9%) (US Department of Labor, Bureau of Labor Statistics 2022). Asian workers represent only 1.3% of construction workers but have higher representation in the plumbing, pipefitters, and steamfitters trade (2.2%) compared to other trades (US Department of Labor, Bureau of Labor Statistics 2022). Hispanic or Latino workers (of any race) represent the majority of workers in drywall installation (74.3%), roofing (63.1%), painting (60.6%), floor installation (61.1%), brick masons (50.5%), construction labourers (51.9%), and cement masonry (50.5%), but have lower representation in sheet metal trades (16.9%), equipment operation (20.7%), and electrical trades (24.6%) (US Department of Labor, Bureau of Labor Statistics 2022). This variability in racial and ethnic representation across trades points to the importance of investigating barriers to recruitment and retention of minoritised groups within individual trades, rather than considering all construction occupations uniformly.
These poor inclusivity dynamics do not create a welcoming environment for tradeswomen and racial minority workers who are new to the industry. Bilginsoy (Reference Bilginsoy2003) investigated attrition in construction industry apprenticeship programmes using construction apprentice data from the US Department of Labor’s (US DOL) Apprenticeship Information Management System (AIMS) from 1989 to 1995 (Bilginsoy Reference Bilginsoy2003). Bilginsoy found that female apprentices were 15% more likely to cancel apprenticeship programs compared to men, and non-White apprentices were 12% more likely to cancel an apprenticeship program compared to their White counterparts (Bilginsoy Reference Bilginsoy2003). In a subsequent study using AIMS data from 1995 to 2003, Berik and Bilginsoy (Reference Berik and Bilginsoy2006) found these trends are exacerbated for women who also identify with an ethnic or racial minority, with apprenticeship cancellation rates being the highest among Black females (Berik and Bilginsoy Reference Berik and Bilginsoy2006). However, research to date has not investigated the intersectionality between gender, race, and other demographic or occupational factors, and whether there are differences in apprenticeship completion and cancellation among apprentices who identify with multiple minoritised groups.
Another important factor in completing an apprenticeship programme is the organisational structure of apprenticeship programmes. Bilginsoy (Reference Bilginsoy2003) also identified that the incidence of cancellation from apprenticeship programmes is twice as high for apprentices in unilateral employer-only programmes compared to apprentices in union-management joint programmes, with apprentices in union-management joint programmes 38% more likely to complete their apprenticeship (Bilginsoy Reference Bilginsoy2003), suggesting that unions have a positive impact on apprentice retention. Furthermore, other research using US DOL apprenticeship data from apprentices enrolling in 1989–1991 (Berik and Bilginsoy Reference Berik and Bilginsoy2000) indicated that union-management joint programs are particularly effective at increasing apprenticeship enrolment and graduation rates among tradeswomen, while research in 2011 using Oregon’s state apprenticeship dataset (Berik et al Reference Berik, Bilginsoy and Williams2011) indicated that union-management joint programs can increase graduation rates among racially minoritised apprentices, suggesting that unions can play a crucial role in integrating minoritised (female and non-White) apprentices into the trades.
In this study, we investigate factors related to construction apprenticeship programme cancellation and completion in the United States from 2013 to 2023. Our goal is to characterise completion and cancellation rates among construction apprentices and investigate the hypotheses that tradeswomen, racial/ethnic minorities, and non-unionised apprentices are disproportionately less likely to complete an apprenticeship programme compared to their male, White, and unionised counterparts, respectively. To do so, we analysed data descriptively to learn about completion and cancellation and then used a discrete-time time-to-event analysis (Suresh et al Reference Suresh, Severn and Ghosh2022) of construction apprentice data collected by the US DOL’s Office of Apprenticeship (US Department of Labor, Office of Apprenticeship 2023c) to investigate apprentice cancellation. This work extends prior research (Berik and Bilginsoy Reference Berik and Bilginsoy2006; Bilginsoy Reference Bilginsoy2003) by using more recent data and a larger time period, including a larger number of apprentices and construction trades, and incorporating additional state data, potentially offering new insights and improving generalisability. Furthermore, we also investigate how intersecting demographic characteristics, such as gender/race and gender/ethnicity, impact apprenticeship program completion; the inclusion of an intersectional lens allows for a richer exploration of the outcomes for minoritised construction workers.
Ultimately, identifying factors that impact construction apprentice completion rates is crucial, not only to meet worker demand in the industry but also to identify barriers to entry for minority groups and promote equity in the construction industry.
Methods
Data description
The Registered Apprenticeship Partners Information Database System (RAPIDS), which succeeded AIMS, is a database of apprentices and apprenticeship programmes across all industries and occupations in the United States, maintained by the US DOL’s Office of Apprenticeship (US Department of Labor, Office of Apprenticeship 2023c). The RAPIDS dataset (US Department of Labor, Office of Apprenticeship 2023c) contains data reported from the 41 states and territories that directly report to it, and incomplete data from the remaining states (Connecticut, Maryland, Minnesota, Oregon, Washington) and Washington DC, which maintain their own data systems. These states with incomplete data may be missing apprentice entries or some demographic information for reported apprentice entries (US Department of Labor, Office of Apprenticeship 2023c). These states were not explicitly excluded from the study, but given that entries may lack certain demographic information, they are more likely to be filtered out by subsequent exclusion criteria. Data from New York are not included in the dataset, and data from Delaware prior to 2021 are not included. We grouped states into census divisions, using the nine United States Census Bureau state divisions (East North Central, East South Central, Middle Atlantic, Mountain, New England, South Atlantic, West North Central, West South Central, and Pacific) (US Census Bureau 2021). Guam and Puerto Rico, which were in the dataset but are not represented in the United Census Bureau divisions (US Census Bureau 2021), were grouped into a separate category for territories.
RAPIDS contains annual individual-level data in person-period format (Suresh et al Reference Suresh, Severn and Ghosh2022) for every apprentice in a registered programme in the United States, including industry and occupation information, unionisation status, apprenticeship programme details, and demographic data for each apprentice (age, gender, race/ethnicity, education, state, and disability status), as well as whether apprentices completed their programme, cancelled, or are actively registered in their programme. Cancellation from the apprenticeship programme was considered our event of interest, and we dichotomised apprentices into ‘cancelled’ (i.e., left the programme prior to completion) and ‘not cancelled’ (i.e., completed the programme or actively registered in the programme) for this analysis.
We restricted the RAPIDS dataset to construction apprentices and defined the study period as starting on January 1, 2013, and ending June 16, 2023; to prevent the inclusion of follow-up time in which cancellation could not be observed, only apprentices who began their programmes after the start of the study period were included (n = 599,674). At this stage, apprentices, who did not have a start or exit date, (aside from those who are active and do not have an exit date) were excluded from the study. Figure 1 shows participant exclusion and inclusion from the dataset and its effects on sample size. Apprentices who were active in apprenticeship programmes (actively registered) at the end of the study period were not excluded, but right censored at the end of the study period in June 2023. We also excluded apprentices with statuses other than completion of programme, cancellation of programme, or actively registered, as the focus of this study is retention and attrition (after this stage, n = 596,480).
Participant inclusion and exclusion from the initial dataset.

We categorised occupations into the 18 construction trades per the US Bureau of Labor Statistics (US Department of Labor, Bureau of Labor Statistics 2023), only including trades that have been approved for use in a Registered Apprenticeship Program by the Office of Apprenticeship (US Department of Labor, Office of Apprenticeship 2023a): boilermakers, carpenters, operating engineers and equipment operators, labourers, drywall installers, electricians, elevator constructors, flooring installers, glaziers, insulators, ironworkers, cement masons, painters, plumbers, roofers, and sheet metal workers. Entries where the occupation could not be categorised into one of these 18 trades (e.g., automotive mechanic, HVAC technician) were excluded (after this stage, n = 506,874).
Using the start date and exit date, we calculated follow-up time for each apprentice. We also calculated the number of years spent in the programme for each apprentice, using the difference between the reporting year and the programme start date. Apprentices who exited the dataset (via completion or cancellation) after year 8 of their programme were excluded from the study (after this stage, n = 503,859); 99.4% of apprentices exited by year 8, so apprentices who took longer were not representative of the population or were presumably affected by data entry error. Lastly, apprentices who did not have data or did not self-identify for unionisation, census division, gender, age, race, ethnicity, or education were also excluded, as this study investigated these demographic predictors of programme completion and cancellation. After all exclusions, the final dataset was composed of n = 335,212 apprentices.
Data analysis
We first analysed data descriptively, calculating the proportion of apprentices who cancelled, completed or were actively registered in their programme by relative time (year of programme). We also calculated the proportion of apprentices that cancelled, completed, or were active in their programmes stratifying by trade, gender, census division, race, ethnicity, unionisation status, and age. Chi-square tests for equality of proportions were used to determine whether cancellations rates were significantly different in these strata; for age and programme year, a chi-square test for trend in proportions was used to determine whether cancellation follows a linearly increasing trend with increasing age and programme year respectively. We plotted cumulative cancellation rates to characterise cancellation by programme year, for the overall apprentice sample, and stratified by gender, race, and unionisation status. To ensure that apprentices excluded due to missing demographic and occupational predictors were not systemically different from included apprentices, descriptive statistics of these excluded apprentices were compared to included apprentices. Subsequently, we conducted a discrete-time time-to-event analysis (Suresh et al Reference Suresh, Severn and Ghosh2022) of apprentice programme cancellation. We fit a logistic regression model to this dataset to investigate time-to-event, with the binary outcome of event (cancellation), including gender, age cohort, race, ethnicity, education, census division, trade, unionisation status, and programme year as predictors, and controlling for programme start year. Active apprentices were not excluded from the study but were right-censored at the end of the study period to ensure that censoring was noninformative (Lagakos Reference Lagakos1979; Ranganathan and Pramesh Reference Ranganathan and Pramesh2012). Exclusion of active apprentices would bias results, as it would exclude right-censored follow-up times of active apprentices, impacting the likelihood function of the time-to-event analysis (Lagakos Reference Lagakos1979). We fit a second model investigating cancellation stratified by gender to ensure that factors related to tradeswomen’s cancellations were not lost due to their low representation in the dataset and included the same variables as in the main logistic regression model. For categorical variables other than ethnicity (gender, race, census division, education level, unionisation status, and trade), we used the group with the largest sample size as the reference group; for ethnicity, we used non-Hispanic or Latino apprentices as the reference group, and for age cohort, we used the youngest age cohort (<25 years of age) as the reference group. The exponentiated coefficient for each variable of the logistic regression model represents a relative risk; specifically, an odds ratio (OR) of cancellation relative to the reference group, holding all other variables constant. Variance inflation factors (VIFs) were calculated to test for multicollinearity; predictors with VIF>5 were excluded from the model.
Results
Descriptive statistics
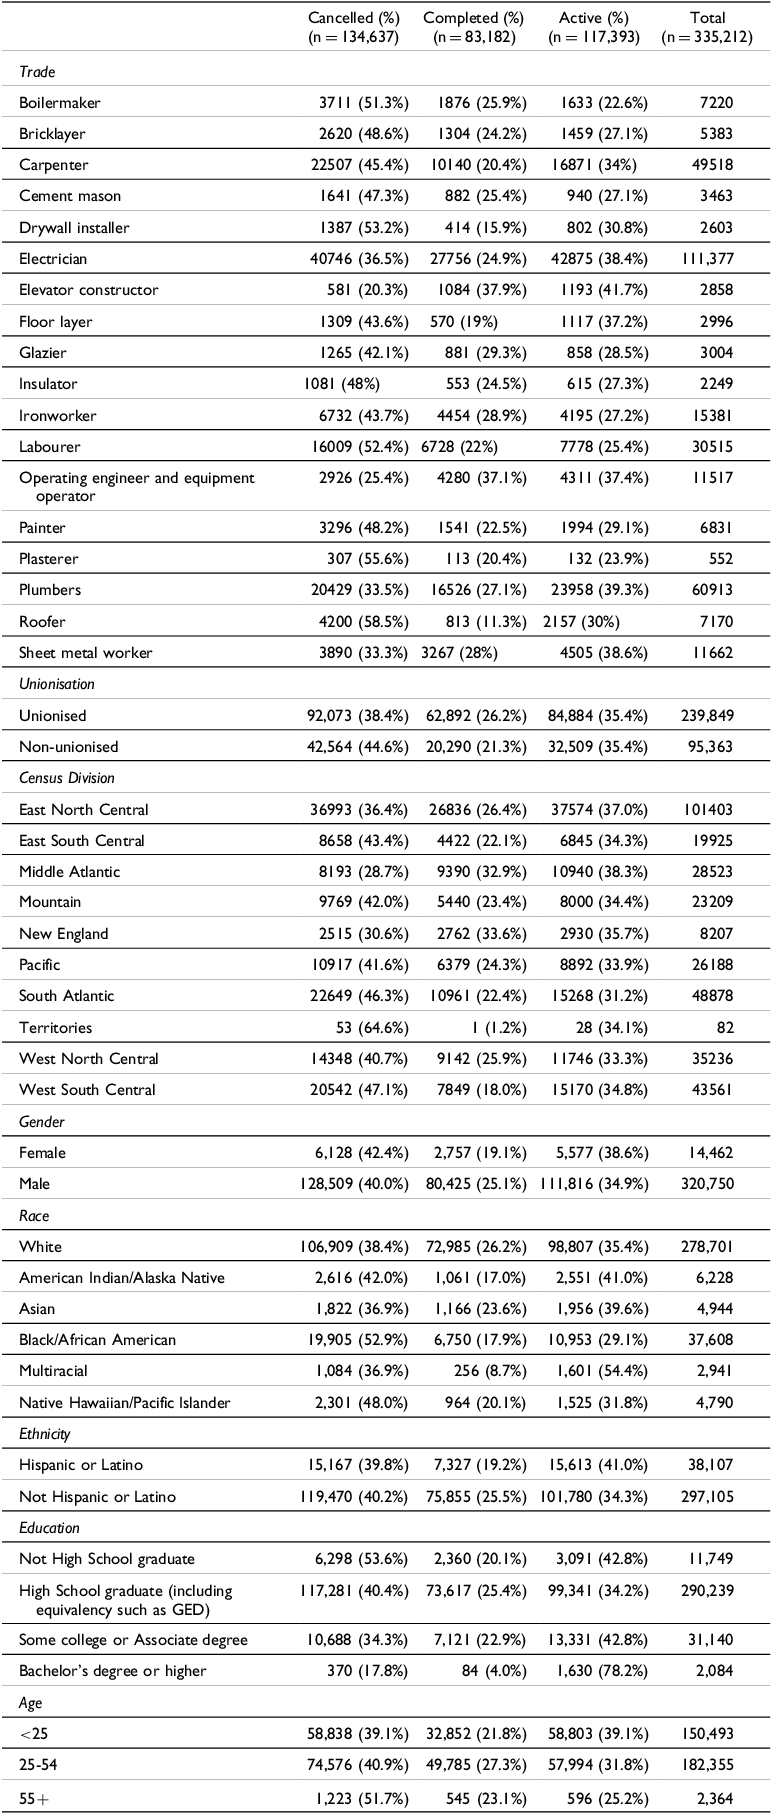
Individual characteristics and demographic information of apprentices in the dataset (n = 335,212) are summarised in Table 1. Apprentices were predominantly male (95.7%) and White (83.1%), with 71.6% of apprentices being union affiliated. In total, 54.4% of apprentices were between the ages of 25 and 54, with an additional 44.9% of apprentices younger than 25 years of age.
Characteristics of apprentices in dataset (n = 335,212)

Comparing apprentices included in our study to those who were excluded due to missing demographic and occupational data (Supplemental Table 1), the distribution of apprentices by gender, union status, and education status was similar between included and excluded apprentices. A large proportion of the excluded apprentices were excluded due to missing race, ethnicity, and age data; thus, the distribution of excluded apprentices in these demographic factors varies from that of included apprentices. However, the cancellation rate among included apprentices (40.1%) is similar to that of the excluded apprentices (43.8%), suggesting that there are no systemic differences in cancellation between included apprentices and those excluded for missing demographic/occupational information.
Overall, 40.1% of apprentices (n = 134,637) cancelled their apprenticeship programmes, while 24.8% completed (n = 83,182) and 35.0% were actively registered (n = 117,393) in their programmes at the end of the study period. Completion stratified by occupational and individual characteristics is shown in Table 2. There were significant differences (p < 0.001) in cancellation rates between trades, unionisation status, gender, census divisions, education levels, and races. When stratifying by apprenticeship trade, cancellation was highest among apprentices in roofing (58.5%), plastering (55.6%), and drywall installing (53.2%) programmes. Rates of cancellation were significantly higher (p < 0.001) among non-unionised apprentices (44.6%) than unionised apprentices (38.4%), and significantly higher (p < 0.001) among females (42.4%) than males (40.0%). When stratified by census divisions, cancellation was highest in the West South Central (47.1%) and Territories (64.6%) divisions, and lowest in the Middle Atlantic division (28.7%). Rates of cancellation were highest among Black/African American apprentices (52.9%) when stratified by race; there was no significant difference in cancellation between Hispanic/Latino and non-Hispanic/Latino apprentices. Cancellation rates showed a significantly increasing linear trend by age cohort (p < 0.001), with rates of cancellation highest among those older than the age of 55, and a significantly decreasing linear trend by programme year, with rates of cancellation highest among those in the first year of their programmes.
Apprentice Status by Demographic and Occupational Data (n = 335,212)
Cancellation rates were also considered descriptively by programme year (Table 3). A total of 20.3% of apprentices cancelled within the first year of their programmes. Cancellation rates decreased as apprentices progressed through their programmes; by year 8, of those still actively enrolled, none cancelled from their programmes.
Cancellation rates by programme year (n = 335,212)
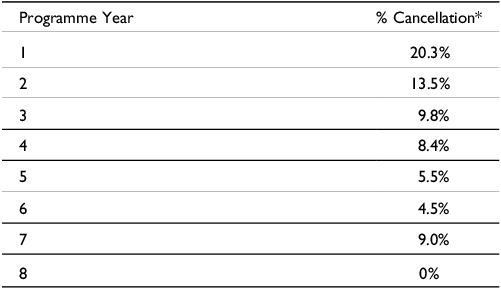
* % Cancellation reflects the number of cancellations in a programme year, out of the total who began that programme year, and is not a reflection of the total who started at the beginning of the programme.
Note. Most construction apprenticeship programmes range in length from 3 to 5 years.
Time-to-event analysis
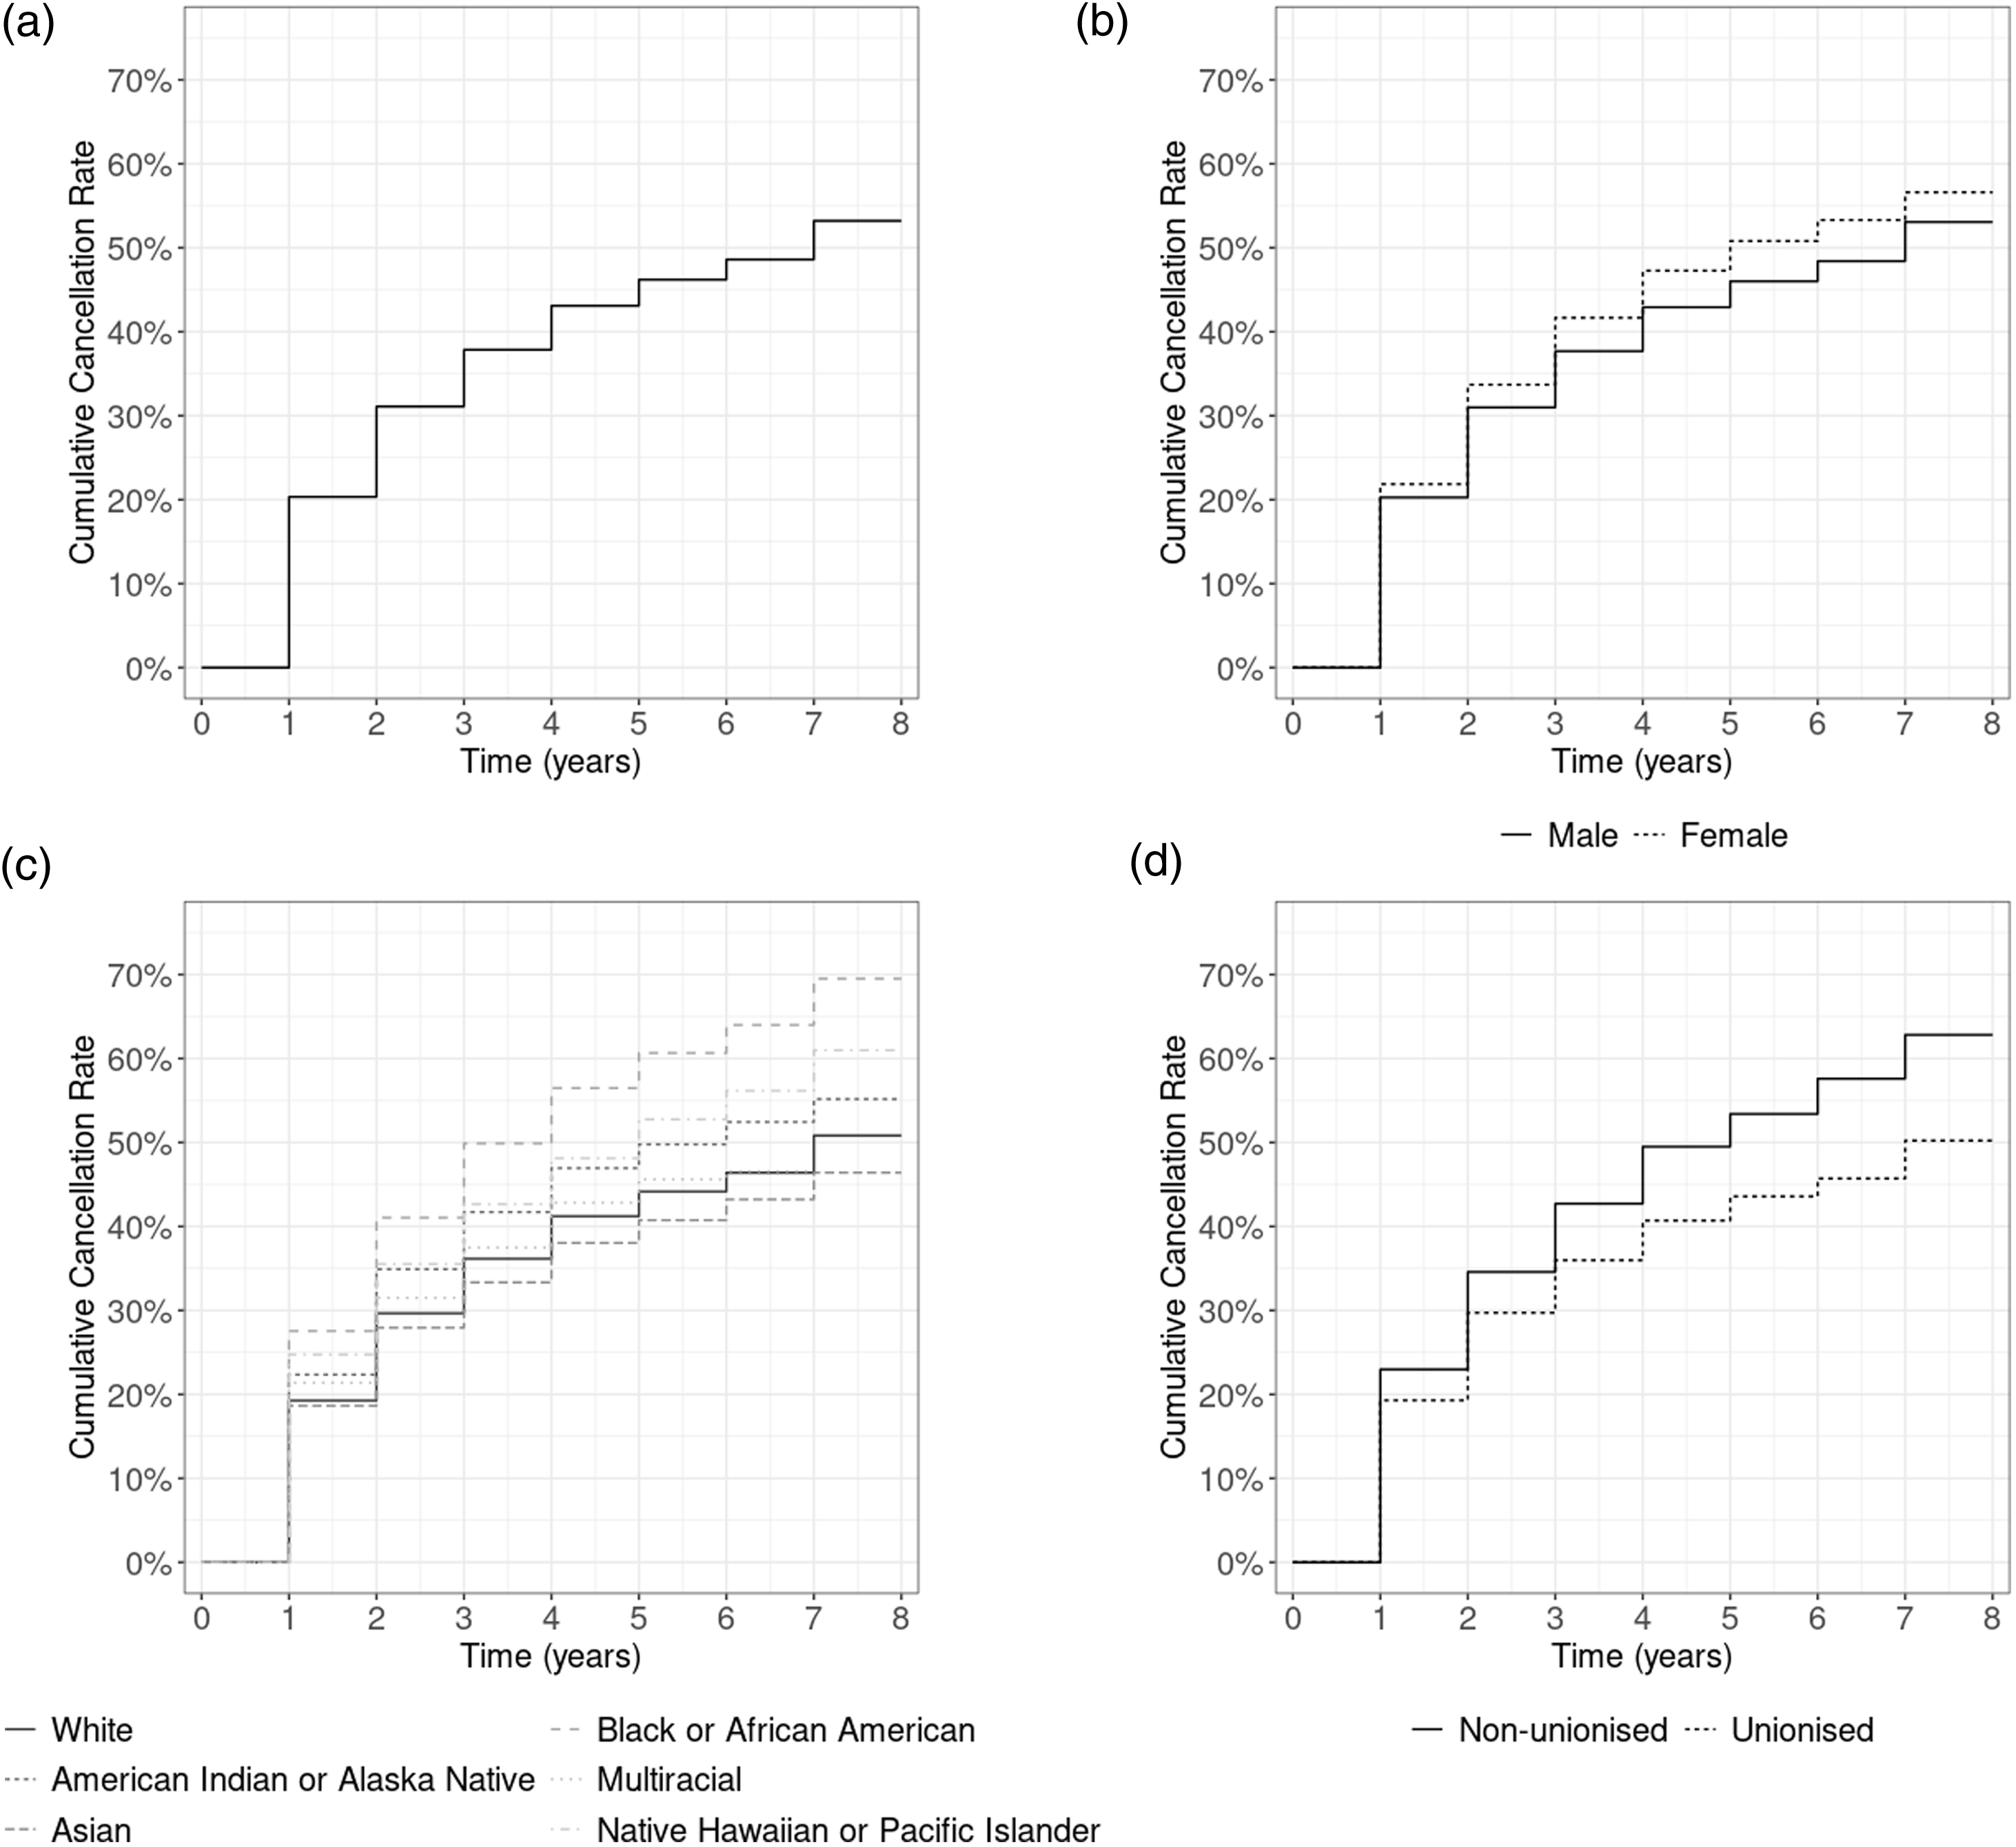
Figure 2 depicts a curve of cumulative cancellation rates by programme year. Overall cumulative cancellation rates are shown in Figure 2a. Female apprentices have higher rates of cancellation at all time points (Figure 2b). Similarly, Black apprentices have the highest rates of cancellation at all time points, with White and Asian apprentices having the lowest cancellation rates at all time points (Figure 2c). Unionised apprentices had lower cancellation rates overall compared to non-unionised apprentices (Figure 2d).
Cumulative cancellation rates of apprentices by programme year. (a). Overall cumulative cancellation rates for apprentices in the dataset; (b). cumulative cancellation rates stratified by gender; (c). cumulative cancellation rates stratified by race; (d). cumulative cancellation rates stratified by unionisation.
All variables included in our time-to-event model had VIF<2.3, indicating multicollinearity among variables was not a concern. Results from the regression model (Table 4) show that females had significantly higher odds of cancellation (OR: 1.11; 95% CI: 1.08, 1.15), and apprentices older than 55 had significantly higher odds of cancellation (OR: 1.07; 95% CI: 1.00, 1.15). Compared to White apprentices, Asian apprentices had significantly lower odds of cancellation (OR: 0.79; 95% CI: 0.75, 0.83), while American Indian/Alaska Native, Black/African American, and multiracial apprentices had significantly higher odds of cancellation compared to White apprentices. Apprentices who did not graduate high school had significantly higher odds of cancellation (OR: 1.16; 95% CI: 1.13, 1.20) compared to high school graduates, while apprentices with some college or Associate degree had significantly lower odds (OR: 0.98; 95% CI: 0.95, 1.00). When compared to the East North Central division (which had the largest sample size), only the Middle Atlantic (OR: 0.63, 95% CI: 0.61, 0.65) and New England (OR: 0.74, 95% CI: 0.71, 0.77) had significantly lower odds of cancellation; all other divisions had significantly higher odds.
Time-to-event analysis for cancellation (n = 335,212)
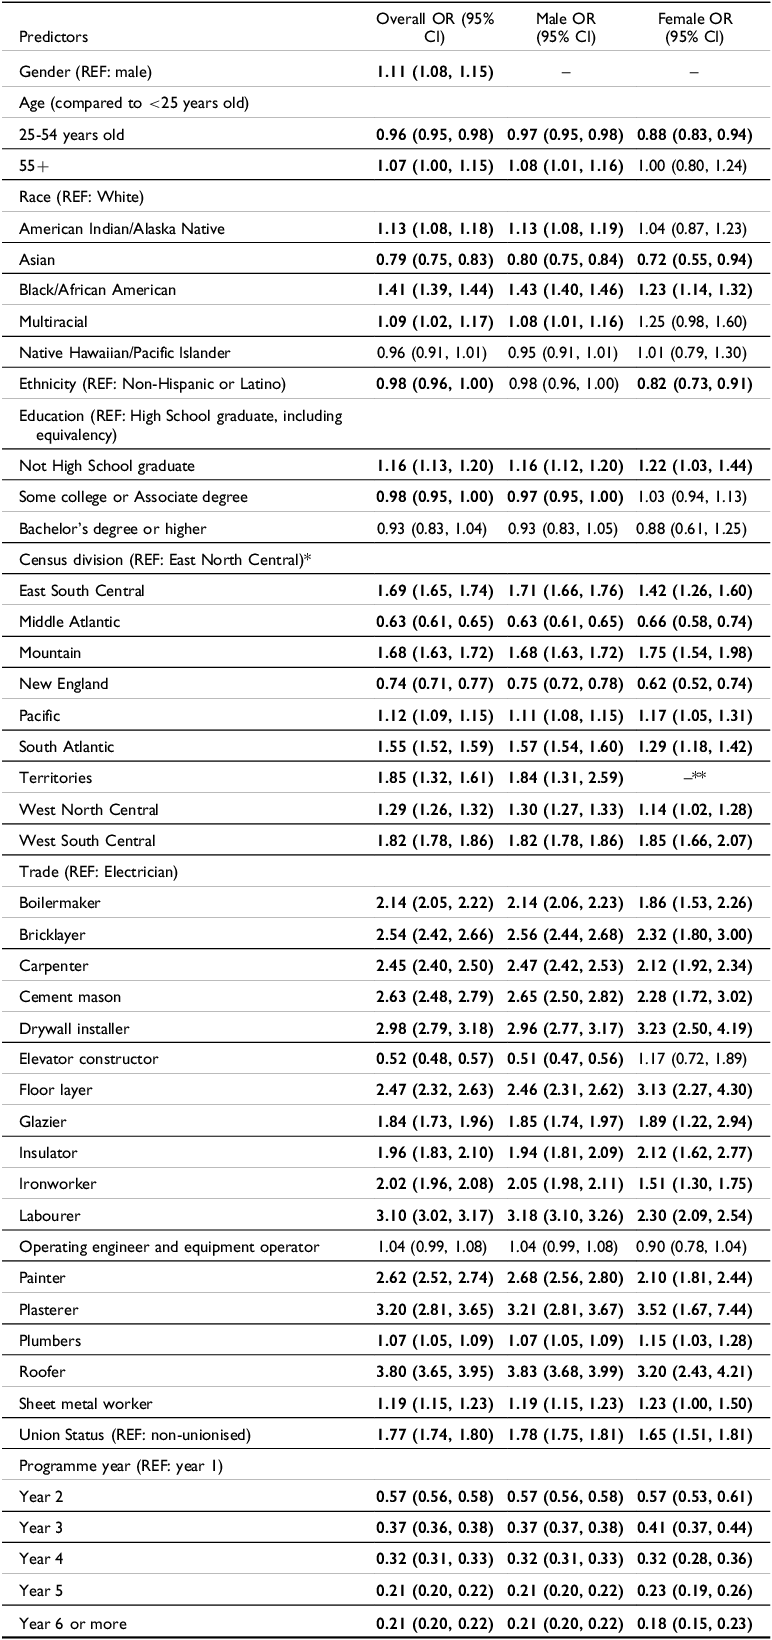
Bold indicates p < 0.05. *States within each Census division are as follows (US Census Bureau 2021): East North Central = IN, IL, MI, OH, WI; East South Central = AL, KY, MS, TN; Middle Atlantic = NJ, NY, PA; Mountain = AZ, CO, ID, NM, MT, UT, NV, WY; New England = CT, ME, MA, NH, RI, VT; Pacific = AK, CA, HI, OR, WA; South Atlantic = DE, DC, FL, GA, MD, NC, SC, VA, WV; Territories = GU, PR; West North Central = IA, KS, MN, MO, NE, ND, SD; West South Central = AR, LA, OK, TX. **OR not calculated as there is n = 1 in this group.
Compared to electricians (which had the largest sample size), elevator constructors were the only trade that had significantly lower odds of cancellation (OR: 0.52; 95% CI: 0.48, 0.57); all other trades had significantly higher odds. Operating engineers and equipment operators did not differ significantly from electricians. Non-unionised apprentices had significantly higher odds of cancellation from their programme than unionised apprentices (OR: 1.77; 95% CI: 1.74, 1.80). Progressing further through a programme was significantly associated with lower odds of cancellation, such that those in later programme years had significantly lower odds of cancellation compared to those in the first year of their apprenticeship programme.
Our gender-stratified logistic regression model (Table 4) yielded few notable differences in cancellation trends by gender. Male apprentices older than 55 had significantly higher odds of cancellation (OR: 1.08; 95% CI: 1.01, 1.16) while this was not apparent for female apprentices older than 55 (OR: 1.00; 95% CI: 0.80, 1.24). Amongst males, odds of cancellation were not significantly different between Hispanic and non-Hispanic apprentices, but Hispanic females had significantly lower odds of cancellation (OR: 0.82; 95% CI: 0.73, 0.91) than non-Hispanic females. Trends in cancellation by trade remained mostly similar when stratified by gender; however, while male elevator constructors had significantly lower odds of cancellation (OR: 0.51; 95% CI: 0.47, 0.56), female constructors did not have significantly lower odds of cancellation (OR: 1.17; 95% CI: 0.72, 1.89). Regional differences in cancellation remained similar when stratified by gender. Trends in cancellation by programme year did not vary notably when stratified by gender; both male and female apprentices in later programme years had significantly lower odds of cancellation when compared to apprentices in the first year of their apprenticeship programme.
Discussion
In this study, we observed that gender and racial disparities persist in construction apprenticeship completion in the United States. Our study yielded findings comparable to those reported by Bilginsoy (Reference Bilginsoy2003) who investigated determinants of apprenticeship completion rates using US DOL AIMS data through 1995 (Bilginsoy Reference Bilginsoy2003). In that study, the odds of female apprentice cancellation were 15% higher than males. In comparison, approximately 30 years later, we found the odds of female cancellation to be 11% higher than males. This suggests that despite a doubling in the number of women entering construction apprenticeship programs since 2016 (Hegewisch Reference Hegewisch2024), barriers remain for females to both enter and complete apprenticeship programs on parity with males. In our analysis, we investigated odds of cancellation for six racial and ethnic groups and found that the odds of cancellation were increased for American Indian/Alaska Native apprentices (13% increased), Black/African American Apprentices (41%), and multiracial apprentices (9%) relative to White apprentices. This result was consistent with the observation by Bilginsoy (Reference Bilginsoy2003) that non-White apprentices had increased odds of cancellation compared to White apprentices. Asian apprentices had a 21% decrease in cancellation relative to White apprentices, and the cancellation rate for Hispanic workers (of any race) was comparable to White apprentices. Our results also reinforce earlier findings (Bilginsoy Reference Bilginsoy2003) that enrolment in a union apprenticeship program significantly decreases the odds of cancellation.
Results from our time-to-event analysis found that apprentices are most likely to cancel from programmes in their first year of the programme, with 20.3% of apprentices cancelling in year 1. Apprentices who progress farther into their programmes become less likely to cancel. The odds of cancellation in later years of apprenticeship programmes are significantly lower when compared to the first year of the programme; this was consistent in both male and female apprentices. Therefore, our results suggest that focusing interventions that promote retention on first-year apprentices could positively impact completion rates.
A major strength of this analysis was the use of the large, comprehensive dataset, RAPIDS, which covered a large proportion of construction apprentices across the country and provided information on apprenticeship programme completion and cancellation, as well as demographic and occupational factors that may be related to programme completion. Previous iterations of the RAPIDS dataset, such as those used by Bilginsoy (Reference Bilginsoy2003), only captured 14 states in the United States, whereas the version we used here includes complete coverage of 41 states and partial coverage of six states. Thus, this analysis has greater coverage across the United States, increasing the generalisability of our findings. This is particularly important as our time-to-event analysis showed regional differences in cancellation, which could not be explored with less comprehensive datasets. The demographic data captured in RAPIDS also allowed us to use an intersectional lens to investigate how holding multiple identities (such as gender/race, gender/ethnicity) could impact apprenticeship completion. From our stratified time-to-event analysis, we saw females (of all races) were significantly more likely to cancel from apprenticeship programmes as compared to males (of all races). However, when looking at differences in odds of cancellation among females by ethnicity, Asian females were less likely to cancel than White females, and Black/African American females were more likely to cancel than White females indicating that the experience of females in apprenticeship programmes may further be influenced by their racial identity. Similar trends were seen for males by ethnicity. While our work has taken steps to identify potential disparities among demographic groups, future, targeted work is needed to both understand and address the disparities.
Based on the results presented here, we highlight three primary implications for the industry: (1) the economic implications of these apprenticeship completion trends; (2) the differences in opportunity provided to individual workers based on the demographic trends in completion; and (3) the importance of unionisation in the construction industry.
The apprenticeship programme completion trends identified in this study have an impact on the ability of the construction industry to meet worker demand. Construction is a male and White dominated industry (US Department of Labor, Bureau of Labor Statistics 2022), and in our time-to-event analysis, we observed significantly higher odds of apprenticeship cancellation among workers minoritised in the construction industry (i.e., female and racially or ethnically minoritised apprentices). Research has shown that gender discrimination, lack of respect towards tradeswomen, challenges with work-life balance, and inadequate workplace health and safety support for women may contribute to these retention issues persisting over time (Curtis et al Reference Curtis, Meischke, Stover, Simcox and Seixas2018; Hegewisch and Mefferd Reference Hegewisch and Mefferd2021). To continue to meet skilled worker demand and grow the construction industry, promoting the recruitment and retention of groups that have been historically underrepresented in the construction industry will be vital. Researchers have investigated the role of women’s committees (Shaw et al Reference Shaw, Hegewisch and Phil2018), mentorship (Curtis et al Reference Curtis, Meischke, Simcox, Laslett, Monsey, Baker and Seixas2022), and Lean In circles (Lean In 2024) as potential interventions to increase the participation of women in the trades.
Our analysis showed variability in the odds of cancellation across trades for women, with women being more likely to cancel from apprenticeship programmes in drywall installation, roofing, or floor laying as compared to apprenticeship programmes for electricians or operating engineers. Exploring trade-specific supports, policies, programmes, and characteristics in trades with decreased odds of cancellation for women may provide effective and applicable strategies that can be adopted by other trades to address women’s underrepresentation and increase programme retention. This highlights the importance of investigating trade-specific barriers to apprenticeship programme retention rather than treating the construction industry as a uniform body.
The lower rates of apprenticeship programme completion among female and racially minoritised workers impact the access to individual opportunities for these workers when compared to their male and White counterparts, respectively. On average, jobs in the trades provide workers with higher pay than other jobs that do not require a college degree, for example, jobs in service industries such as hospitality, retail, or caregiving (US Department of Commerce 2022). With lower recruitment and retention of minoritised workers in construction apprenticeship programmes, these worker groups face barriers to accessing the economic opportunities that their male and White counterparts do through a job in the construction trades. Work in the construction trades provides family-sustaining wages in the United States, consistent in-demand employment, job ladders, and benefits (including health insurance). Most construction workers also benefit from lucrative overtime pay and the ability to take time off between or at the conclusion of projects. Female and racially minoritised workers who enter the industry often face discrimination and may not have the same potential for career advancement as their male or White counterparts (Byars-Winston et al Reference Byars-Winston, Fouad and Wen2015; Curtis et al Reference Curtis, Meischke, Stover, Simcox and Seixas2018; Goldenhar et al Reference Goldenhar, Swanson, Hurrell, Ruder and Deddens1998; Goldenhar and Sweeney Reference Goldenhar and Sweeney1996; Isingizwe et al Reference Isingizwe, Eiris and Gheisari2023) making it harder to recruit and retain female and racially minoritised workers because of discrimination in the industry. Without changes that address these issues of discrimination, these lower rates of retention among tradeswomen and minoritised groups can persist (Burrows Reference Burrows2023). Regional differences exist in apprenticeship cancellation, with results indicating lower cancellation in the Middle Atlantic and New England regions. While our analysis did not investigate reasons for why these differences exist, future research could look at state and regional factors such as prevailing wages, support for unions in the state (e.g., is it a right to work state), social safety nets available in the state, access to paid family leave, and other state policies or programs that could impact apprenticeship completion. Additionally, the regions selected, while informed by the US Census Bureau groupings, are ultimately arbitrary geographical groupings. Combining states into regions in other ways could result in different trends, and looking at states individually could result in richer context. Future work could investigate how state-based policies or practices may be related to apprenticeship completion, for all apprentices but also minoritised apprentices.
We observed that across all years of the apprenticeship programme, apprentices were more likely to drop out of non-union apprenticeship programmes than union-affiliated apprenticeship programmes. Unions provide higher earning potential, with unionised workers having wages up to 15% higher than their non-unionised counterparts (US Department of the Treasury 2023). Furthermore, unions provide access to fringe benefits (Leigh and Chakalov Reference Leigh and Chakalov2021; US Department of the Treasury 2023; Walters and Mishel Reference Walters and Mishel2003) and policies for retirement and workplace grievances (US Department of the Treasury 2023). The benefits of unionisation are particularly important for minoritised worker groups, as unions are impactful in decreasing discrimination and inequality (Leigh and Chakalov Reference Leigh and Chakalov2021) by employing practices that often aim to address racial and gender wage gaps and provide protections such that pay and benefits of minoritised workers match their non-minoritised counterparts respectively (US Department of the Treasury 2023). Unionisation also has impacts on workplace health and safety (Ford and Freund Reference Ford and Freund2022; US Department of the Treasury 2023). Unionised workers experience lower injury rates and less time lost from work due to injury (Amick et al Reference Amick, Hogg-Johnson, Latour-Villamil and Saunders2015; Economou and Theodossiou Reference Economou and Theodossiou2015; Robson et al Reference Robson, Landsman, Latour-Villamil, Lee and Mustard2022). Union policies promote safer workplaces (US Department of the Treasury 2023), and union worksites have lower rates of workplace health and safety inspection violations than non-union worksites (Ford and Freund Reference Ford and Freund2022). Unions are also well-placed to advocate for the health and safety of minoritised workers, such as addressing the lack of appropriately fitting personal protective equipment (PPE) and sanitary facilities for tradeswomen (Curtis et al Reference Curtis, Meischke, Stover, Simcox and Seixas2018; Goldenhar and Sweeney Reference Goldenhar and Sweeney1996; Ontario Women’s Directorate 2006; Onyebeke et al Reference Onyebeke, Papazaharias, Freund, Dropkin, McCann, Sanchez, Hashim, Meyer, Lucchini and Zuckerman2016); these improvements in workplace health and safety can, in turn, improve recruitment and retention of minoritised workers into the trades.
Limitations
This study has several limitations. While RAPIDS contained 503,859 eligible apprentices within our study period, 168,647 of these apprentices were excluded due to missing demographic or occupational information, which may reduce the generalisability of these results due to potential systemic differences. However, descriptive results showed that the excluded apprentices were not notably different on the available demographic and occupational factors than the included apprentices, suggesting that results are less likely to be biased due to these exclusions. Furthermore, this study is more exhaustive than previous research, including a larger number of apprentices and trades from across the country, which also promotes generalisability. Despite the robust nature of the RAPIDS dataset, there remain states that have not been fully integrated into this system, as they maintain their own databases (US Department of Labor, Office of Apprenticeship 2023c). Therefore, the results of this study may not be generalisable to states not included in the dataset. This dataset also relies on report from individual apprenticeship programmes; therefore, there is potential for variability in the quality of data collected depending on the programme and general reporting biases.
This study only includes construction workers who enter the trades via an apprenticeship. Therefore, these results are not generalisable to workers who enter the trades without enrolling in an apprenticeship programme. Workers who enter the trades without enrolling in an apprenticeship programme are likely to be more vulnerable workers, such as those who have not completed high school (Washington State Department of Labor & Industries 2024), are not proficient in English (which may create challenges in enrolling in apprenticeship programmes) (CPWR 2010), or are of immigrant or migrant status (Mitchell Reference Mitchell2016). This may put them not only at increased risk for injury and illness related to work (Abdalla et al Reference Abdalla, Apramian, Cantley, Cullen, Mock, Nugent, Kobusingye and Smith2017), but also may contribute to higher turnover and attrition from the construction industry, lower wages, and fewer worker protections.
The RAPIDS dataset includes a large number of observations. While this gives us a robust population for making inferences around factors associated with cancellation, the large sample size also allows us to find very small significant differences, which may or may not be meaningful. The RAPIDS dataset also only collects information on two genders and does not allow for investigation of the experiences of gender non-binary apprentices. The dataset also does not provide context about apprentice programme cancellation. Understanding the reasons for cancellation would provide useful information regarding the barriers to recruitment and retention that the industry faces, especially among underrepresented groups such as tradeswomen, or ethnically or racially minoritised workers. Investigating reasons for apprentice programme cancellation, for example, using survey or qualitative interview methods, could provide an actionable follow-up to this study and could inform potential interventions to improve outcomes for minoritised groups.
Conclusions
Construction apprenticeship programmes are an important pathway for skilled workers to enter the industry. Given that construction jobs are high-quality (e.g., offer high pay, stability, and opportunity for advancement), and females and racially minoritised groups have lower rates of apprenticeship completion, identifying factors that impact apprenticeship completion is important, both for occupational justice and in order to meet worker demand.
Our findings highlight three main implications of these apprenticeship completion trends: the impact on the economy, the differences in individual opportunity, and the importance of unionisation in the trades. Reducing barriers to apprenticeship programme completion can help address the worker shortage in the industry. Identifying and acting on factors that impact recruitment and retention of females and racially minoritised workers into apprenticeship programmes can promote equity both within and outside the workplace.
Supplementary material
The supplementary material for this article can be found at https://doi.org/10.1017/elr.2024.50
Funding statement
This project was supported by CPWR - The Center for Construction Research and Training under the National Institute for Occupational Safety and Health (NIOSH) cooperative agreement 5U60OH009762. Additional support came from NIOSH federal training grant T42OH008433. The content is solely the responsibility of the authors and does not necessarily reflect the official views of CPWR or NIOSH.
Competing of interests
None Declared.
Pranav Srikanth is a PhD Candidate in the Department of Environmental and Occupational Health Sciences at the University of Washington. His research interests include the occupational experiences of vulnerable worker groups, the psychosocial impacts of work, and methods of exposure control in workplaces.
Marissa G Baker is an Assistant Professor in the Department of Environmental and Occupational Health Sciences at the University of Washington. Her research interests include how work impacts physical and mental health and the occupational experiences of underrepresented or vulnerable groups.
Hendrika Meischke is a professor in the Department of Health Systems and Population Health at the University of Washington. Her research interests are in occupational stress and burnout, prehospital emergency care, and emergency preparedness and response, as well as language health equity in care delivery.
Noah Seixas is a Professor Emeritus in the Department of Environmental and Occupational Health Sciences. Dr. Seixas’ career focused on quantitative exposure assessment for occupational epidemiology and health risks to precariously employed and vulnerable worker groups.
Christopher Zuidema is a Clinical Assistant Professor in the Department of Environmental and Occupational Health Sciences at the University of Washington. His research interests include environmental exposure assessment, industrial hygiene, and occupational health.


 Open access