


Immigrants from South Asia to Western countries have an increased risk for developing type 2 diabetes (T2D)(Reference Abate and Chandalia1). In a previous study from Oslo, the age-adjusted prevalence of T2D among 40-to 59-year-old immigrant women from South Asia was 27·5 %, with an OR for developing diabetes of 11·0 compared with Western women(Reference Jenum, Holme and Graff-Iversen2). Several risk factors for diabetes are combined in the metabolic syndrome (MetS), which is found to be prevalent among female Pakistani immigrants in Norway(Reference Hjellset, Bjorge and Eriksen3). In addition to possible genetic factors, the increased risk of T2D may be explained by an unhealthy lifestyle, related to diet(Reference Wandel, Raberg and Kumar4), low levels of physical activity(Reference Lindstrom and Sundquist5) and psychosocial factors(Reference Hjellset, Ihlebaek and Bjørge6). Many South Asian immigrants attain low socio-economic status (SES) in the host country, regardless of status in their country of origin. Generally, low SES has been found to be a predictor of obesity and chronic diseases in Norway, as well as in many other Western countries(Reference Elstad and Otnes7–Reference Roskam and Kunst9). However, low SES is often not accounted for when explaining the high prevalence of these conditions in immigrant groups.
Studies from different parts of the world have shown that lifestyle interventions aimed at weight reduction through a healthier diet and increased physical activity may reduce the risk of developing T2D in high-risk individuals(Reference Tuomilehto10). Several population-based initiatives employing the principles derived from these interventions are in the process of being implemented(Reference Schwarz, Lindstrom and Kissimova-Scarbeck11). In contrast, little research has been carried out to explore which socio-economic strata get the largest benefit from such interventions. It is an intriguing and important question whether health promotion programmes are beneficial for people in lower-SES groups who often have the greatest needs, or whether such programmes contribute to even larger inequalities in health by greater improvements among those already best off. A few studies have looked into these matters, and have reported inconsistent results(Reference Wikstrom, Peltonen and Eriksson12–Reference Middelkoop and van der Wal14).
Unfortunately, national public health programmes in Europe do not reach many immigrants because of language barriers, illiteracy, and different cultural perceptions on health, disease and other factors. Health personnel tend to view the immigrant population as a particularly challenging group(Reference Hussain-Gambles, Leese and Atkin15). Some culturally adapted approaches to behavioural changes have been tried out to reduce the risk of T2D among South Asian immigrants, but the outcomes have been diverging(Reference Khunti, Camosso-Stefinovic and Carey16). There is a lack of randomised controlled trials to elucidate to what extent risk factors of T2D may be beneficially influenced by culturally adapted approaches, especially among non-Western immigrants living in Western countries.
There has been a shift in preventive health care, from information and influence to empowerment, and more dialogue and participation. An important part of recent health promotion ideology is an increased emphasis on process as much as on results(Reference Green and Tones17), and on understanding the relationship between behaviour and health(Reference Sørensen and Graff-Iversen18). This health promotion ideology reflects characteristics in the relationships between the provider and the recipient, and might entail cooperating and accepting without judging the other's performance, feelings and choices(Reference Fisher, Thorpe and Devellis19).
The purpose of the present study was to investigate whether a culturally adapted education programme, focusing on blood glucose physiology and its regulation by physical activity and nutrition, would improve the T2D-related risk factor profile, including reducing the MetS, in Pakistani immigrant women. The intervention was based on this recent health promotion ideology and adapted to meet the needs of immigrant women with different SES backgrounds, especially those with low levels of education and literacy.
Research design and methods
Trial design
The InnvaDiab (Immigrant Diabetes) study being part of the European Union project DE-PLAN (Diabetes in Europe – Prevention using Lifestyle, Physical Activity and Nutritional Intervention) was a randomised controlled trial carried out in 2006–8 in a suburban area (Søndre Nordstrand) of Oslo, Norway, with participants individually randomised into an intervention and a control group. This area contains the highest proportion of Pakistani immigrants of the districts of Oslo (12 %).
Participants
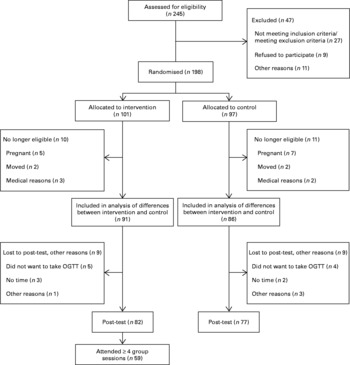
Eligible participants were all female adults, aged ≥ 25 years, living in the area and born in Pakistan or in Norway by two Pakistani parents. Exclusion criteria were pregnancy, known T2D or CVD, taking antihypertensive or antidiabetic medication, or a close relative already included in the project. Based on previous experience(Reference Hussain-Gambles, Leese and Atkin15), a multi-recruitment approach was used. Community members were consulted to provide assistance in the study, and the eligibility criteria were set as wide as possible. The recruitment strategy included visits to mosques, Norwegian classes for foreigners and other gatherings in the local community. An Urdu-, Punjabi- and English-speaking research assistant was in charge of the recruitment and interested women were contacted by phone and invited to participate in the project. A total of 245 women were invited to the study, and 198 women participated (Fig. 1). The study was carried out in the local mother and child health clinic.
Flow chart showing the number of eligible and excluded participants, the number of participants allocated to the intervention and control groups and the number of participants lost to follow-up, as well as reasons for loss to follow-up. OGTT, oral glucose tolerance test.
All participants went through a clinical assessment after a 12 h overnight fast, 1–3 weeks before and after the intervention programme. Venous blood samples were drawn from an antecubital vein and a standardised oral glucose tolerance test was performed in subjects with fasting plasma glucose < 8 mmol/l. Self-reported sociodemographic data were collected through a pre-coded questionnaire.
The intervention: a culturally adapted education programme
The intervention group was divided into nine subgroups of ten to twelve women who were offered six educational sessions, each lasting 2 h, during a 7 ± 1-month period. The main focus was on the physiological importance of blood glucose and its regulation by diet and physical activity, and on knowledge about the Pakistani lifestyle in Pakistan and Norway(Reference Jenum, Holme and Graff-Iversen2, Reference Mellin-Olsen and Wandel20). One particular goal was that all participants in the intervention group should obtain the necessary knowledge and understanding about how to influence their blood glucose level in everyday life. Since many of the participants had low levels of literacy, mainly culturally adapted pictures and figures were used during the education sessions. Printed materials were not handed out during the intervention to minimise the risk of contamination between the intervention and the control groups. All communication in the intervention group went through the preferred language, either with multilingual personnel or with an interpreter. All research personnel were female.
The education approach was based on the principles of empowerment, including participation and cooperation without assuming responsibility for the other person's performance, and accepting without judging the other's feelings and choices(Reference Fisher, La Greca and Greco21). The teaching and the group discussions focused on the effect of refined carbohydrates, such as sugar, white bread and rice, on blood sugar, and the health benefits of cutting down on these, and exchanging them with whole-grain foods. The information and further discussions included the health benefits of using plenty of vegetables, beans and lentils, in line with the traditional Pakistani diet, and of eating more fatty fish. The teaching focused less on protein and fat content of the diet, but the differences in terms of health of consuming SFA and unsaturated fatty acids were explained to the participants, and good sources for unsaturated fatty acids, such as rapeseed and olive oil, were discussed. Information on the blood glucose- and insulin-raising effect of simple sugars and starch(Reference Vander, Sherman and Luciano22) was repeated. After the first group session, the participants were given one brief individual feedback (3–5 min) concerning diet and physical activity, based on the results of their blood tests.
Education was also given about the beneficial effect of light physical activity on blood glucose, especially the effect of post-meal walking(Reference Høstmark, Ekeland and Beckstrøm23). Women were encouraged to walk for 1 h (approximately 5000 steps) twice per week throughout the trial period. Subgroups practising this type of walking were arranged during day- and afternoon time. Child care was offered, and walking paths where baby carriages could be brought were chosen. Furthermore, good walking shoes were provided, since many participants did not have footwear suitable for outdoor walking.
The control group was also given feedback on blood sugar levels, and received lifestyle advice in one single (short version) group session after the follow-up tests.
Outcome measures
Primary outcome variables of the intervention were blood glucose levels measured fasting and 2 h after the oral glucose tolerance test. Secondary outcomes were fasting and 2 h plasma insulin and C-peptide, and fasting serum lipids (HDL-cholesterol and TAG), glycated Hb (HbA1c), blood pressure, waist circumference and BMI.
Blood glucose was measured with a glucometer (Ascensia Contour, Bayer HealthCare). All blood glucose strips had the same serial number(Reference Steele, Schrock and Baum24). Plasma insulin and C-peptide were measured at the Hormone Laboratory, and lipoproteins at the Department of Clinical Chemistry, both at the Aker University Hospital, Oslo, Norway. Total cholesterol, HDL-cholesterol and TAG were analysed using enzymatic and colorimetric methods (GRO-PAP; CHOD-PAP; Roche). HbA1c was measured using a DCA 2000+ (Bayer). Blood pressure was measured in the sitting position on the right arm with an A&D Medical plus digital blood pressure monitor (UA-767; A&D Company Ltd) the mean of all three recordings was used. Waist circumference was measured with a regular non-elastic band at midway between the inferior margin of the last rib and the crest of the ilium in a horizontal plane. Body weight was measured in light clothing, without shoes, using an A&D Personal Precision Scale (UC-321; A&D Company Ltd). Height was measured to the nearest 0·5 cm with a metrical measuring device (KaWe personal check meaningj device; Kirchner & Wilhelm GmbH+Co. KG). BMI was calculated as weight in kg divided by height in m2. Cut-off points at 23·0, 25·0, 27·5 and 30 were used, as recommended for South Asian populations by the WHO expert consultation on obesity(25).
Measures of the MetS were used as defined by the International Diabetes Federation(26), central obesity (definition for increased risk among South Asian women: ≥ 80 cm) plus any two of the following: serum TAG >1·7 mmol/l; serum HDL-cholesterol < 1·29 mmol/l; systolic blood pressure >130 mmHg; diastolic blood pressure >80 mmHg; fasting blood glucose ≥ 5·6 mmol/l; or previously diagnosed T2D. The incremental area under the glucose v. time curve was calculated by the trapezoidal rule(27).
Sociodemographic information included age, years of education (both from Pakistan and Norway) and work status. Additionally, the number of years residing in Norway and command of the Norwegian language were assessed. For comparing blood values and BMI across the indicators of sociodemographic strata at baseline, years in Norway were recoded into ‘ ≤ 10 years’ = 1, ‘11–19 years’ = 2 and ‘>19 years’ = 3 and education into three groups with ‘ ≤ 7 years’ = 1, ‘8–12 years’ = 2 and ‘>12 years’ = 3. Income-generating work status was measured with a dichotomous variable with ‘working’ = 0 and ‘not working’ = 1. Command of the Norwegian language was recoded from five response categories to a dichotomous variable with ‘good’ (average–very good) = 0 and ‘poor’ (quite poor–poor) = 1.
Sample size
Sample size was calculated on the basis of a presumed 10 % reduction in 2 h glucose, a significance level of 5 % and a power of 80 %. A sample size of eighty-two patients per group was necessary, given an anticipated dropout rate of 15 %.
The flow chart (Fig. 1) shows the reasons for being excluded and for leaving before the follow-up. The individuals included were randomised to either an intervention (n 101) or a control (n 97) group, using concealed randomisation. For allocation of the participants, a computer-generated list of random numbers was used. Participants were allocated on a 1:1 ratio using random block sizes of 10. The allocation sequence was concealed from all personnel, including the researchers and assistants enrolling and assessing participants.
Statistical methods
Data were analysed using SPSS 16.0 and PASW 17.0 and 18 (SPSS, Inc.). ANCOVA tests were used to explore age-adjusted mean blood values at baseline in different sociodemographic groups and to analyse differences in these means. For these purposes, both intervention and control groups were included.
To estimate the effect of the intervention, we first compared differences in change between all subjects allocated to the intervention and control groups, respectively, except for twenty-one women (ten in the intervention group and eleven in the control group) who met the exclusion criteria at follow-up (pregnancy, medical conditions and use of antihypertensive medication, or no longer resided in the study area; see Fig. 1). Thus, this analysis was based on data from ninety-one women in the intervention group and eighty-six women in the control group. For those with missing values at follow-up, we conducted the ‘last value carried forward method’. As not all subjects in the intervention group attended all group sessions, we performed a subgroup analysis that included participants having attended four or more group sessions and the follow-up (treatment-received group (TRG), n 59).
Blood variables, blood pressure, BMI and waist circumference are presented as means (95 % CI) before and after the intervention period. Within the control and intervention groups, values before and after the intervention were compared using a paired t test. Differences in change between the groups were compared using independent-samples t tests, and proportions were compared using χ2 statistics and McNemar's test.
Age-adjusted logistic regressions including those in the intervention group coming to follow-up tests were used to analyse the relationships between baseline sociodemographic characteristics and changes in blood values (fasting glucose, glucose after 2 h glucose load, HDL-cholesterol and TAG) and BMI.
Ethics
The present study was conducted according to the guidelines laid down in the Declaration of Helsinki and all procedures involving human subjects were approved by the Norwegian Data Inspectorate and the Regional Committee for Medical Research Ethics. The project has been registered in the ClinicalTrials.gov system with trial no. NCT00425269. The contract no. of DE-PLAN is 2004310. Written informed consent was obtained from all subjects.
Results
Baseline data
At baseline, women were between 25 and 62 years old, with a mean age of 41 years in the intervention group and 42 years in the control group (Table 1). Residence in Norway spanned from 0 to 35 years (mean 18 and 19 years in the intervention and control groups, respectively). More than half of the women rated their command of the Norwegian language as poor. The mean length of education was reported to be 9 years (range 0–19 years), BMI varied appreciably, from 19·6 to 52·4 kg/m2 (mean 29·4 and 29·8 kg/m2 in the intervention and control groups). More than half of the subjects had BMI ≥ 27·5. None of the women had a known diagnosis of T2D before the intervention; however, T2D was detected at baseline in 13·9 % (n 14) and 12·4 % (n 12) in the intervention and control groups, respectively. About 60 % of the women in the intervention group attended four or more group sessions.
Characteristics of the population sample, randomly divided into the intervention and control groups (Mean values, ranges and percentages)

The baseline values of blood glucose (fasting and 2 h), HDL, TAG and BMI according to sociodemographic characteristics are reported in Table 2. Fasting blood glucose was lower and HDL higher among those with higher education. There were no significant differences in blood values or BMI across various lengths of stay in Norway, Norwegian language skills or work status.
Levels of blood values and BMI at baseline according to socio-economic status characteristics in the intervention and control groups combined* (Mean values and 95 % confidence intervals)
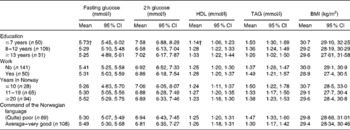
* Age-adjusted mean intake and differences between the groups explored through the ANCOVA function.
† Mean values were significantly different between educational groups for fasting glucose (P= 0·032) and HDL (P= 0·008).
Changes in biochemical markers, BMI and waist circumference
Intervention and control group
At baseline, there were no significant differences between the control and intervention groups in any of the blood variables, blood pressure, BMI or waist circumference. The improvement from baseline to follow-up was significantly larger in the intervention group than in the control group for fasting blood glucose and fasting insulin (between-group differences − 0·16 mmol/l, P= 0·003 and − 5·8 pmol/l, P= 0·036; Table 3). Within the intervention group, there were significant reductions of 0·16 mmol/l in fasting (P= 0·003) and of 0·53 mmol/l in 2 h glucose (P= 0·001). There were also small, but significant reductions in glucose incremental AUC, 2 h C-peptide and diastolic blood pressure in the intervention group.
Metabolic syndrome-related blood variables at baseline and follow-up in the control and intervention groups (Mean values and 95 % confidence intervals)
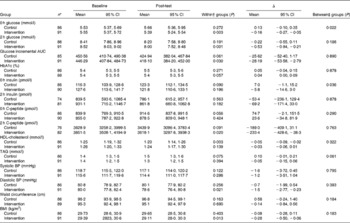
HbA1c, glycated Hb; BP, blood pressure.
* Number of subjects at baseline. A total of eighty-two in the intervention group and seventy-seven in the control group came to follow-up. Analysis with the last value carried forward for missing values was performed at follow-up.
† Paired-samples t test for change in baseline to follow-up within the groups.
‡ Independent-samples t test for differences in absolute change between the groups.
Treatment-received group and socio-economic status group
When comparing the TRG with those in the control group coming to follow-up, we found improvements during the treatment period for several of the measurements related to the MetS (Table 4). The improvements were larger in the TRG than in the control group for fasting glucose, ( − 0·24 mmol/l, P= 0·020), fasting insulin ( − 10·1 pmol/l, P= 0·019), TAG ( − 0·1 mmol/l, P= 0·046) and BMI ( − 0·48 kg/m2, P= 0·035). Within the TRG, there were significant favourable changes for fasting and 2 h glucose, HbA1c, glucose incremental AUC, diastolic blood pressure and BMI.
Metabolic syndrome-related blood variables at baseline and follow-up in the control* and treatment-received group (TRG†) (Mean values and 95 % confidence intervals)
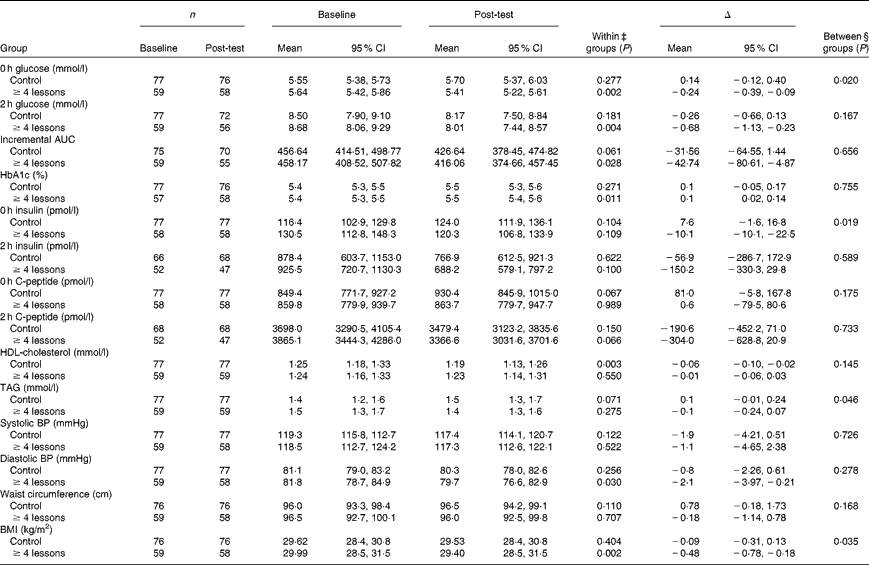
HbA1c, glycated Hb; BP, blood pressure.
* Only subjects who met both baseline and follow-up testing are included.
† Subjects in the intervention group who attended at least four group sessions.
‡ Paired-samples t test for change in baseline to post-test within the groups.
§ Independent-samples t test for difference in absolute change between the groups.
At baseline, there were higher values for TAG (P= 0·014), systolic blood pressure (P= 0·045) and diastolic blood pressure (P= 0·026) among subjects in the TRG than those who attended less than four group sessions or did not meet for follow-up examinations. Mean age, years lived in Norway and years of education did not differ between the groups.
Changes in fasting glucose, 2 h glucose, HDL-cholesterol, TAG and BMI during the intervention were not significantly related to SES, years in Norway or command of the Norwegian language (data not shown).
Proportion of participants with the metabolic syndrome
At baseline, similar proportions had the MetS in the intervention and control groups (44 and 41 %). During the intervention period, twenty (23 %) women in the control group and eleven (12 %) women in the intervention group developed the MetS. During the study period, six (7 %) women in the control group and thirteen (14 %) women in the intervention group regressed from the MetS. The change in the proportion of women with the MetS from baseline to follow-up was significant in the control group (P= 0·011). At follow-up, 42 % in the intervention group and 57 % in the control group had the MetS (NS). Comparing the TRG with the control group showed the same trends, and the change in the proportion of women with the MetS from baseline to follow-up was significant (P= 0·023) in the control group.
Discussion
The results of the present study show that it is possible to obtain positive changes in risk factors for T2D in Pakistani immigrant women in Norway with the use of a culturally adapted and non-directive intervention. We observed improvements in blood glucose, insulin, C-peptide and diastolic blood pressure during the lifestyle intervention programme. Furthermore, attendance in the intervention programme halted the rapid development of the MetS as observed in the control group. It seems that the positive effects increased with the number of group sessions attended, thus apparently being dose-dependent.
There was no noticeable impact of SES on changes in fasting glucose, 2 h glucose, HDL or TAG. These results are in line with one of the important intentions of the intervention, namely to reach even those participants who usually do not benefit from preventive efforts, such as the low-SES groups. The InnvaDiab intervention was also adapted to women with low levels of acculturation and there was no need for good command of the Norwegian language to benefit from the intervention. The results indicate that this cultural adaptation has been adequate, as there were no differences in changes in blood parameters according to years in Norway or command of the Norwegian language.
The main goal of the InnvaDiab study was to give the Pakistani immigrant women knowledge and tools to regulate their blood sugar through changes in diet and physical activity. The programme was tailored to meet the participants' everyday lives and challenges as mothers and providers of food for their families. Any lifestyle change they might choose would have to fit their cultural, social and family situation. In order to develop positive outcome expectancies(Reference Ursin and Eriksen28), and positive lifestyle strategies, it was important to avoid advice and doctrines of what to do and what not to do. Thus, we focused on simple education concerning how to regulate blood sugar levels in a way that enabled them to adjust their everyday dietary habits and physical activity levels. This was an integrated intervention with focus on both diet and physical activity. The goal was not to find out which of those two components could account for the main effect, but rather to evaluate the effect of the combined programme. This culturally adapted intervention with focus on empowerment seems to have been successful by giving the participants a better opportunity to cope with everyday situations, and, in addition, providing them with ways of regulating their blood sugar.
According to Bandura(Reference Bandura29), the individuals must be confident in their own ability to carry out actions that lead to behavioural changes. The so-called ‘self-efficacy’ theory argues that behavioural change is dependent on many determinants, such as earlier experiences, emotional activation, verbal encouragement and observational learning. This line of reasoning fits into the empowerment ideology that may result in behavioural changes that will promote health(Reference Fisher, Thorpe and Devellis19).
A meta-analysis of randomised controlled trials with lifestyle intervention to prevent T2D showed a reduction of 0·84 mmol/l in 2 h plasma glucose concentration after 1-year follow-up(Reference Yamaoka and Tango30), which is somewhat more than that observed in the present study. However, these studies were generally of longer duration than the present study, and the participants tended to be of an even higher risk of T2D than our participants, with higher fasting and post-oral glucose tolerance test glucose concentrations. The most important feature of the participants in the present study is that they are immigrants, with a cultural background different from the host population. Kousar et al. (Reference Kousar, Burns and Lewandowski31) showed that a culturally adapted lifestyle intervention in Australia had the potential to reduce fasting blood glucose among Pakistani immigrant women with the MetS. Most of the participants in the present study had not reached a similar level of pathology at baseline as those described in the Australian study. However, the rapid development of the disorder in the control group during the 7-month intervention period is alarming. The present results indicate that the intervention had the capacity to halt this development, even if several women in the intervention group also developed the MetS.
The multi-recruitment strategy may have given selection bias, by recruiting those most interested in lifestyle changes. However, the participant characteristics were comparable with those of Pakistani women in a large population-based study previously carried out in Oslo, as regards the prevalence of overweight (80 % with BMI >25 kg/m2), the number of years of education (mean 8 years), years in Norway (mean 16 years) and the number of children (mean 3·5)(Reference Kumar, Meyer and Wandel32).
Since the intervention group received more attention than the control group, a potential Hawthorne effect cannot be completely ruled out. However, in the present study, we have followed both groups through the chain of potential changes after the intervention. We found shifts in knowledge about diabetes risk factors(Reference Kjøllesdal, Hjellset and Bjørge33), perceptions about healthy eating(Reference Råberg Kjøllesdal, Hjellset and Bjørge34), intentions to change dietary habits(Reference Johansen, Bjorge and Hjellset35, Reference Råberg Kjøllesdal, Hjellset and Bjørge36) and actual changes in food intake(Reference Johansen, Bjorge and Hjellset35) in the intervention group that corresponded with the main teaching messages. No such changes were found in the control group.
Conclusion
Pakistani immigrant women participating in a culturally adapted and empowerment-focused lifestyle education programme about blood glucose control improved their T2D-related risk factor profile and slowed the development of the MetS. The lifestyle intervention was successful in reaching also those with the lowest levels of SES.
Acknowledgements
This study was funded by the Norwegian Research Council (166977/166998), the DE-PLAN Project (2004310), the Norwegian Directorate of Health, the Throne Holst Foundation (2875) and the Jahre Foundation. Many people have contributed in different stages of the project. We want to especially thank Monica Morris, Aisha Asghar Ali, Anica Munir, Marianne Lunde, Eva Kristensen and Nina Konglevoll, and all the participating women who gave us of their time and shared their knowledge and experiences with us. We also want to thank Professor Stein Atle Lie for statistical advice. Reebok provided shoes. M. W., G. H.-O. and K. I. B. planned and supervised the project. H. R. E. and A. T. H. supervised the project. B. B. and V. T.-H. conducted the intervention and coordinated the data collection. M. K. R. K. performed the statistical analyses. M. K. R. K. and V. T.-H. drafted the manuscript. All authors contributed in the final stage of the writing. The authors declare that there is no conflict of interest.



