


According to a recent global estimate, dietary factors were responsible for 22 % of total deaths and 15 % of disability-adjusted life years(1). Additionally, a high BMI contributed to 8·4 % of total deaths and 5·9 % of disability-adjusted life years(2). These figures underscore the importance of identifying modifiable risk factors, such as eating behaviours, that impact diet quality and obesity. Eating behaviour is influenced not only by environmental and psychosocial factors but also by biological rhythms regulated by the circadian system, which govern hunger, satiety, metabolism and meal timing(Reference Flanagan, Bechtold and Pot3). Hitherto, the importance of chronobiology in understanding eating behaviours has received little attention. However, its potential significance is now being increasingly recognised, and a new field of study called chrono-nutrition is emerging(Reference Flanagan, Bechtold and Pot3,Reference Lotti, Pagliai and Colombini4) .
Circadian rhythms, which are controlled by the master clock in the hypothalamus, govern key biological processes including sleep–wake cycles and eating behaviour(Reference Roenneberg and Merrow5). External factors such as light and food intake influence these rhythms(Reference Almoosawi, Vingeliene and Gachon6), and proper circadian function is crucial for metabolic health(Reference Henry, Kaur and Quek7). Whether individuals are morning- or evening-orientated (the chronotype)(Reference Adan, Archer and Hidalgo8) is related to their eating patterns. Evening chronotypes, for instance, tend to eat later in the day and consume more energy in the evening(Reference Dashti, Scheer and Saxena9). Chrono-nutrition explores various eating behaviours related to these rhythms, including the timing, frequency and regularity of eating(Reference Flanagan, Bechtold and Pot3,Reference Fiore, Scapaticci and Neri10–Reference St-Onge, Ard and Baskin13) .
An increasing number of epidemiological studies have investigated the associations of chrono-nutrition behaviours with diet quality and adiposity measures(Reference Canuto, da Silva Garcez and Kac14–Reference Murakami, Shinozaki and Livingstone31), but the results are far from consistent. Given that chrono-nutrition behaviours are highly inter-related(Reference Pons-Muzzo, de Cid and Obon-Santacana30,Reference Murakami, Shinozaki and Livingstone31) , likely creating a synergy that impacts dietary intake and health, investigating the role of single chrono-nutrition characteristics (e.g. eating frequency and breakfast skipping) in isolation in relation to dietary intake and health may not fully capture the complexity(Reference Kim, Conlon and Farsijani32). Compared with this kind of reductionist paradigm, in which much nutrition research has been embedded(Reference Jacobs and Steffen33), patterning of chrono-nutrition behaviours using data-driven analytic methods allows for the identification of naturally occurring combinations of behaviours and their joint associations with dietary intake and health outcomes(Reference Pons-Muzzo, de Cid and Obon-Santacana30–Reference Kim, Conlon and Farsijani32,Reference Leech, Worsley and Timperio34,Reference Aqeel, Guo and Lin35) . The most widely used a posteriori (data-driven) techniques for capturing patterns of eating behaviour in nutritional epidemiology include clustering (both algorithm-based and model-based) and principal component analysis (PCA)(Reference Newby and Tucker36–Reference Harrington, Dahly and Fitzgerald40). Both of these methods are statistically quite different from each other. Whereas clustering (a person-centred approach) separates persons into mutually exclusive groups based on the differences in input variables, PCA (a variable-centred approach) separates input variables into groups based on correlations between variables, with persons receiving a score for each of the derived factors (or components)(Reference Newby, Muller and Hallfrisch41–Reference Thorpe, Milte and Crawford43). Although few in number, recent studies have examined patterns of chrono-nutrition behaviours using a posteriori methods(Reference Pons-Muzzo, de Cid and Obon-Santacana30,Reference Kim, Conlon and Farsijani32,Reference Leech, Worsley and Timperio34,Reference Aqeel, Guo and Lin35,Reference Leech, Timperio and Livingstone44–Reference Horn, Laupsa-Borge and Andersen51) . For example, in a national representative sample of Australian adults(Reference Leech, Worsley and Timperio34), three patterns (groups) were identified using latent class analysis: ‘conventional’, ‘later lunch’ and ‘grazing’. Participants with a ‘grazing’ pattern had poorer diet quality as well as higher adiposity (only women), compared with those with a ‘conventional’ or ‘later lunch’ pattern(Reference Leech, Timperio and Livingstone44).
However, most of these studies have used only a limited number of chrono-nutrition variables, such as timing and frequency of eating(Reference Santonja, Bogl and Degenfellner49), energy intake (EI) distribution across the day(Reference Palla and Almoosawi45–Reference Cardoso, Sanches and Correia47,Reference Horn, Laupsa-Borge and Andersen51) and distribution of eating occasions across the day(Reference Leech, Worsley and Timperio34,Reference Leech, Timperio and Livingstone44,Reference Jayedi, Shafiei Neyestanak and Djafarian50) , for pattern identification. Furthermore, while it is well known that chrono-nutrition behaviours differ between workdays and non-workdays(Reference Phoi, Rogers and Bonham11,Reference Murakami, Shinozaki and Livingstone31,Reference Murakami, Shinozaki and McCaffrey52) , these important differences have not been sufficiently taken into account in previous studies(Reference Pons-Muzzo, de Cid and Obon-Santacana30,Reference Kim, Conlon and Farsijani32,Reference Leech, Worsley and Timperio34,Reference Aqeel, Guo and Lin35,Reference Leech, Timperio and Livingstone44–Reference Horn, Laupsa-Borge and Andersen51) . Finally, almost all of these previous studies have employed clustering(Reference Pons-Muzzo, de Cid and Obon-Santacana30,Reference Kim, Conlon and Farsijani32,Reference Leech, Worsley and Timperio34,Reference Aqeel, Guo and Lin35,Reference Leech, Timperio and Livingstone44,Reference Chau, Pan and Chen46–Reference Horn, Laupsa-Borge and Andersen51) . Certainly, clustering is good at identifying sub-populations with similar characteristics, but it may not always be optimal for evaluating the relationship between the patterns identified and health outcomes, mainly because the statistical power is limited by the need to use a reference category(Reference Thorpe, Milte and Crawford43,Reference Wirfalt, Drake and Wallstrom53) and the uneven sizes of the clusters(Reference Thorpe, Milte and Crawford43). In contrast, to our knowledge, only one study among adolescents has applied PCA(Reference Palla and Almoosawi45). The continuous nature of the PCA factors is advantageous and appears more useful in association analyses(Reference Sotres-Alvarez, Herring and Siega-Riz39,Reference Thorpe, Milte and Crawford43) , which would provide additional evidence as to whether empirically derived patterns are sufficiently meaningful(Reference Newby, Muller and Tucker54). In fact, in the context of dietary pattern analysis, PCA is much more dominant than clustering when it comes to investigating diet–disease relationships(Reference Wingrove, Lawrence and McNaughton55,Reference Jannasch, Kroger and Schulze56) .
Therefore, the primary aim of this study was to identify chrono-nutrition behaviour patterns using PCA. We used a comprehensive set of chrono-nutrition behaviour variables assessed using 11-d event-based ecological momentary assessment food diaries. The secondary aim was to investigate the associations of chrono-nutrition behaviour patterns with sociodemographic and lifestyle characteristics of participants, diet quality and general and abdominal obesity.
Methods
Dataset
Participants
This cross-sectional analysis was based on data from the Who, What, When, Where and Why for Healthy Eating Study (5W Study) conducted between February and April 2023 in twenty-six (of forty-seven) prefectures in Japan. Detailed descriptions of the 5W Study are available elsewhere(Reference Murakami, Shinozaki and Livingstone31,Reference Murakami, Shinozaki and McCaffrey52,Reference Murakami, Shinozaki and Livingstone57) , and the study schedule is shown in online Supplementary Figure 1. Briefly, the target population comprised of apparently healthy Japanese aged 20–69 years living in private households. We decided to include 110 individuals for each of five sex-specific, 10-year age categories (i.e. 20–29, 30–39, 40–49, 50–59 and 60–69 years), resulting in 1110 individuals in total. While the 5W Study was designed to include multiple research objectives, the main one was a comprehensive examination of the relative validity of the Meal-based Diet History Questionnaire using the 4-d diaries of food intake for each of the ten sex- and age-stratified categories. Thus, the sample size for each category (n 110) was determined based on the recommendation made by Cade et al. that for validation studies, a sample size of 100 or more is desirable(Reference Cade, Thompson and Burley58). In recruiting, we excluded dietitians, individuals living with a dietitian, those who have been recently receiving dietary counselling from a doctor or dietitian, those taking insulin treatment for diabetes, those undergoing dialysis treatment, pregnant or lactating women and those who did not have adequate Internet access or who indicated that they would have difficulty answering questionnaires online. Only one person per household was permitted to participate.
Participants were recruited from the local community. Recruitment and data collection were conducted by 264 trained research dietitians with expertise in food diary assessment(Reference Murakami, Shinozaki and Livingstone59,Reference Murakami, Livingstone and Masayasu60) . Using the snowball sampling procedure, the number of individuals approached for the 5W Study was 1796, 1110 of which agreed to participate (response rate 61·8 %). Each participant received an honorarium to the value of 4000 Japanese yen (US$1·00 = 143·84 Japanese yen as of 4 June 2025) after completing the study. The study was conducted in accordance with the guidelines of the Declaration of Helsinki, and all procedures were approved by the Ethics Committee of the University of Tokyo Faculty of Medicine (protocol code: 2022235NI; date of approval: 24 November 2022). Written informed consent was obtained from all participants.
Eleven-day event-based ecological momentary assessment diaries of eating
Eating behaviour was assessed using 11-d event-based ecological momentary assessment diaries of eating(Reference Maugeri and Barchitta61,Reference Shiffman, Stone and Hufford62) . In this approach, participants were asked to record each eating occasion at the time it occurred, rather than at prespecified time points. In the ecological momentary assessment, participants’ current eating behaviours are repeatedly sampled in their natural environment in real time(Reference Maugeri and Barchitta61,Reference Shiffman, Stone and Hufford62) . This approach helps reduce recall bias, maximises ecological validity (i.e. generalisability to daily life and natural environments) and allows capture of intra-individual behaviours over time and across settings (e.g. workdays v. non-workdays) in a real-world context(Reference Maugeri and Barchitta61,Reference Shiffman, Stone and Hufford62) . We considered 11 d to be sufficient because a recent study showed that the minimum number of days required to obtain reliable estimates of meal timing variables – including overnight fasting duration, midpoint of overnight fasting, number of eating episodes per day, daily period of greatest energetic intake and timing of the last eating episode – over a 1–3-year period was 3 d(Reference Peterson, Lee and Huybrechts63).
As detailed descriptions of these diaries are available elsewhere(Reference Murakami, Shinozaki and Livingstone31,Reference Murakami, Shinozaki and McCaffrey52) , only a brief summary is provided here. In short, the 11-d diaries, consisting of 7-consecutive-day food timing diaries and 4-non-consecutive-day (two workdays and two non-workdays) weighed food intake diaries, were used to collect data on a sufficient number of non-workdays (at least 4 d) while not compromising the feasibility and simplicity of the conduct of the survey.
After receiving written and verbal instructions by a research dietitian, each participant was requested to maintain a record of food timing (start clock time), both in and out of the home, for 7 consecutive days. Participants were also asked to select the most appropriate eating occasion name from the prescribed list (breakfast, lunch, dinner and snack), as well as to indicate if the recording day was either a workday or a non-workday. Additionally, participants were asked to record the time of going to bed, time of finishing preparation for sleep and sleep latency (i.e. the length of time of the transition from full wakefulness to sleep) on the previous day and the time of waking. Online Supplementary Figures 2 and 3 show the original Japanese and translated English versions of food timing diaries, respectively. Research dietitians checked the completeness of the food timing diaries via phone, Internet or in-person three times during the 7-d period (for day 1, days 2–3 and days 4–7), and if necessary, additional information was added.
The procedure used to complete the 4-d food intake diaries was similar to the 7-d food timing diaries, but more detailed descriptions were requested (as described elsewhere(Reference Murakami, Shinozaki and Livingstone59,Reference Murakami, Livingstone and Masayasu60) ). Briefly, each recording period comprised four non-consecutive days (two workdays and two non-workdays). Each participant was issued recording sheets and a digital scale (KS-732WT, Dretec; ±2 g precision for 0–500 g and ±3 g precision for 500–2000 g). After receiving written and verbal instructions by a research dietitian, each participant was requested to document and weigh all items eaten or drunk, both in and out of the home, on each of the recording days. On occasions when weighing was problematic (e.g. dining out), they were instructed to document as much information as possible, including the brand name of the food and the consumed portion size (based on typical household measures), as well as the details of leftovers. The completed recording sheets used in each recording day were submitted directly to the research dietitian, who then reviewed the forms and, whenever necessary, sought additional information or modified the record via phone or in-person interview. All collected records were then reviewed by the research dietitians and trained staff at the study centre.
A recording day was considered valid if the diary sheet was reviewed and confirmed as complete by a research dietitian. Days with zero recorded eating events were retained if participants confirmed that no food was consumed on those days, indicating that these were true non-eating days rather than missing records. Sleep-related variables recorded in the diaries were also reviewed by research dietitians, and no missing data were observed for sleep timing variables. In accordance with a standardised procedure, the portion sizes estimated using household measures were converted into weights, and the individual food items were coded based on the 2020 version of the Standard Tables of Food Composition in Japan(64).
Anthropometric measurements
Anthropometric measurements were conducted using standardised procedures by research dietitians, family members or others (e.g. nurses and fitness club staff)(Reference Murakami, Shinozaki and Livingstone31). Body height (to the nearest 0·1 cm) and weight (to the nearest 0·1 kg) were measured, while the participant was wearing lightweight indoor clothes only, without shoes. Waist circumference was measured at the level of the umbilicus (to the nearest 0·1 cm) at the end of a normal respiration, while the participant was standing erect and with the arms at the side and the feet together. A 3-m steel tape measure (Echo Metals; product code: 0536216) and a 1·5-m measuring tape (Pocket; product code: HE0085) were used to measure height and waist circumference, respectively. Because uniform weight-measuring equipment could not be used across all settings, any available scale was permitted.
To maximise feasibility, measurements were allowed to be conducted in various settings (e.g. at the research dietitian’s workplace or at the participant’s home). Priority was given to measurements performed by research dietitians; when this was not feasible, measurements by family members or other individuals were permitted. Overall, approximately 40 % of measurements were conducted by research dietitians (43·6 % for height, 38·2 % for weight and 40·4 % for waist circumference), 40 % by family members (36·5 %, 39·9 % and 42·9 %, respectively) and 20 % by others (19·9 %, 21·9 % and 16·7 %, respectively). Excluding measurements not conducted by research dietitians would have substantially reduced the sample size; therefore, all available measurements were retained in the present analysis.
Assessment of other variables
Information on other variables was collected using a questionnaire.
Data handling
Analytic sample
From the initial sample of 1110 participants (online Supplementary Figure 4), we retained participants who completed all survey components needed for this analysis (first questionnaire and diaries of food timing and of food intake; n 1088). We then excluded participants whose diaries of food timing or food intake were incomplete (i.e. fewer than seven valid days for food timing or fewer than four valid days for food intake, for which a valid day was defined as a day with a diary reviewed and confirmed as complete by the research dietitian; n 3), whose data in the diaries of food intake were considered insufficient in terms of data quality (n 1), and whose diaries of food intake were conducted in a consecutive manner (n 1). We further excluded participants who reported 7 d’s working per week during the preceding month (because this condition may have substantial influence on eating patterns; n 19), provided missing information on education level (n 3) or had < 2 d’s data on workdays or < 2 d’s data on non-workdays in the 11-d food diaries (n 1). Finally, in accordance with our previous single-variable analysis(Reference Murakami, Shinozaki and Livingstone31), we excluded participants who provided implausible questionnaire data on sleep time, wake time or meal timing (e.g. 99.99 h; n 13), although these exclusions were not required for the present analysis. Notably, including these thirteen participants did not materially change the results (data not shown).
Since further exclusion of participants classified as underweight (BMI < 18·5 kg/m2(65), n 82) or of those not in paid employment (n 63) did not alter the findings of the present study (data not shown), these participants were retained in the analysis, resulting in a final analysis sample of 1047 participants.
Diet quality
As a measure of diet quality, the Healthy Eating Index (HEI)-2020(Reference Shams-White, Pannucci and Lerman66) was used. The HEI-2020 is an established, 100-point scale to assess compliance with the 2020–2025 Dietary Guidelines for Americans(67), with a higher score indicating a better quality of overall diet. The HEI-2020 consists of nine adequacy components (e.g. total fruits, total vegetables, greens and beans and whole grains) and four moderation components (e.g. Na and added sugars). The HEI-2020 completely aligns with the HEI-2015(Reference Shams-White, Pannucci and Lerman66). Our previous analyses suggest that the HEI-2015 (and HEI-2020) sufficiently aligns with Japanese dietary behaviour for assessing diet quality(Reference Murakami, Livingstone and Fujiwara68,Reference Oono, Murakami and Fujiwara69) .
The calculation of HEI-2020 was conducted based on the 4-d weighed food diaries. Estimated intakes of energy and nutrients and component scores needed for the calculation of HEI-2020 were calculated using the 2020 version of the Standard Tables of Food Composition in Japan(64) and the Japanese version(Reference Murakami, Livingstone and Fujiwara68) of the US Food Patterns Equivalents Database(Reference Bowman, Clemens and Friday70), respectively. The mean HEI-2020 total and component scores over the 4-d period were used for each individual. All dietary calculations were performed using Microsoft Excel 365 (Microsoft Corporation).
Adiposity measures
BMI (kg/m2) was calculated as body weight (kg) divided by the square of body height (m). General obesity was defined as BMI ≥ 25 kg/m2 according to the Japan Society for the Study of Obesity(71); this cut-off value is the same as that for Asian adults according to the WHO(65). Abdominal obesity was defined as waist circumference ≥ 90 cm for males and ≥ 80 cm for females, on the basis of cut-off points for Asian adults according to the WHO(65).
Basic characteristics
In this study, biological sex was self-selected as either male or female. Age at the start of the study was calculated based on birth date. Self-reported information on the following variables was also used in this study: education level (junior high school or high school, junior college or technical school, university or higher and other), employment status (none, student, part-time paid job and full-time paid job), annual household income (< 5 million Japanese yen, ≥ 5 to < 8 million Japanese yen and ≥ 8 million Japanese yen), living alone (no or yes), smoking status (never, past and current) and experience of shift work during the preceding 3 months (no or yes). Physical activity was categorised as low, middle and high according to the Japanese short version of the International Physical Activity Questionnaire(Reference Craig, Marshall and Sjostrom72–74).
According to Goldberg cut-off principle(Reference Black75,Reference Black76) , misreporting of EI derived from the 4-d weighed food diaries was evaluated on the basis of the ratio of mean daily EI (kcal/d) to BMR (kcal/d). As described in detail elsewhere(Reference Murakami, Shinozaki and Livingstone31), participants were categorised into acceptable, under- or over-reporters of EI by assessing their EI:BMR against the respective physical activity level determined by the International Physical Activity Questionnaire(Reference Craig, Marshall and Sjostrom72–74). BMR was estimated according to an equation specifically developed for Japanese adults(Reference Ganpule, Tanaka and Ishikawa-Takata77,Reference Miyake, Tanaka and Ohkawara78) .
Based on the Munich ChronoType Questionnaire(Reference Ghotbi, Pilz and Winnebeck79,Reference Kitamura, Hida and Aritake80) , self-reported information on sleep timing (sleep time and wake time) was derived from the 11-d diaries of eating for workdays and non-workdays separately (online Supplementary Table 1). Then, average sleep duration was calculated(Reference Murakami, Shinozaki and Livingstone31). Furthermore, chronotype was defined based on the Munich ChronoType Questionnaire concept of chronotype(Reference Ghotbi, Pilz and Winnebeck79), using the midpoint of sleep(Reference Murakami, Shinozaki and Livingstone31).
Chrono-nutrition behaviours
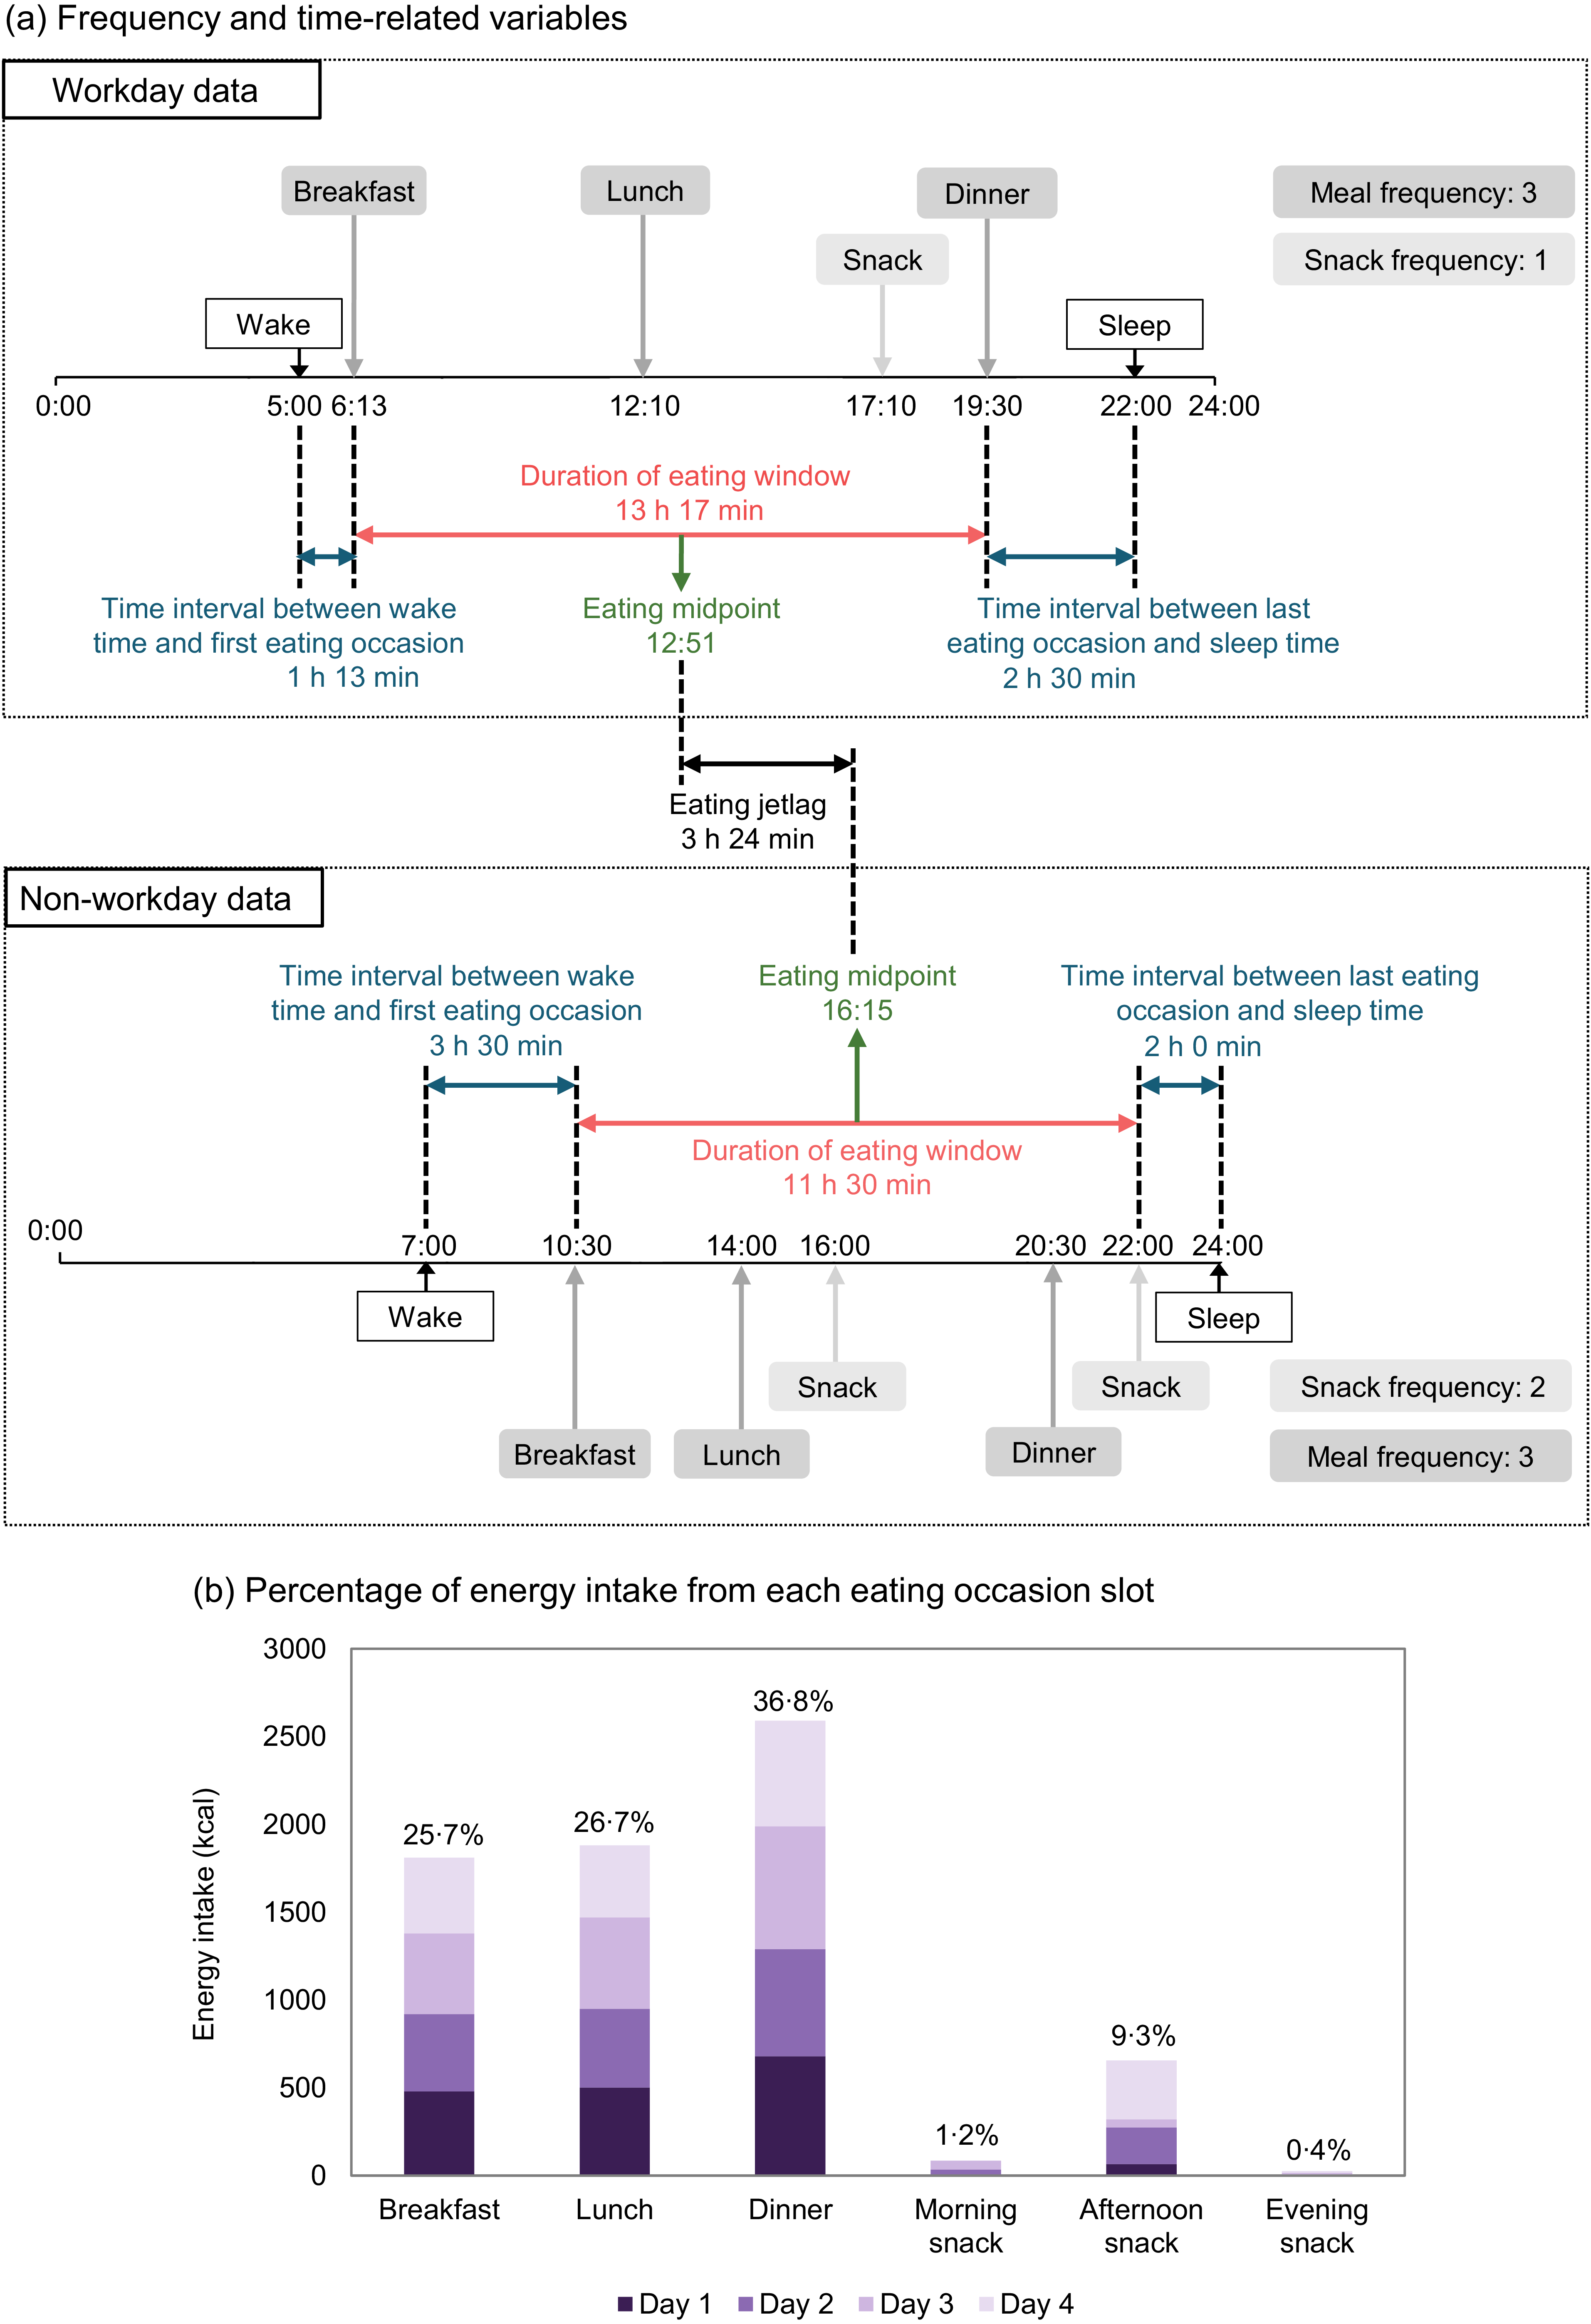
Figure 1 shows an overview of the nineteen chrono-nutrition behaviour variables used to identify chrono-nutrition behaviour patterns. These variables were selected a priori according to a comprehensive literature review on chrono-nutrition behaviours(Reference Flanagan, Bechtold and Pot3,Reference Dashti, Scheer and Saxena9–Reference St-Onge, Ard and Baskin13,Reference Pons-Muzzo, de Cid and Obon-Santacana30–Reference Kim, Conlon and Farsijani32,Reference Leech, Worsley and Timperio34,Reference Aqeel, Guo and Lin35) . On the basis of data from the 11-d diaries of eating, we created the following variables for workdays and non-workdays separately (see Figure 1(a)): meal frequency, snack frequency, eating midpoint, duration of eating window, time interval between wake time and first eating occasion and time interval between last eating occasion and sleep time. In this study, we considered that meals included breakfast, lunch and dinner while snacks included all other eating occasions including morning snack, afternoon snack and evening snack(Reference Murakami and Livingstone16,Reference Murakami, Shinozaki and Livingstone31,Reference Murakami, Shinozaki and McCaffrey52,Reference Murakami, Livingstone and Masayasu60) . Of note, all eating occasions recorded in 11-d diaries of eating which consisted of beverages or water only were excluded when creating the variables listed above(Reference Murakami, Shinozaki and Livingstone31,Reference Murakami, Shinozaki and McCaffrey52) . For each variable, daily mean values were calculated for each individual and for workdays (median 7 d) and non-workdays (median 4 d) separately(Reference Murakami, Shinozaki and Livingstone31,Reference Murakami, Shinozaki and McCaffrey52) . Then, we created the variable ‘eating jetlag,’ as originally defined by Zeron-Rugerio et al. (Reference Zeron-Rugerio, Hernaez and Porras-Loaiza24), based on the eating midpoint. Eating jetlag was calculated as the absolute difference between the mean eating midpoint on workdays and that on non-workdays(Reference Murakami, Shinozaki and Livingstone31,Reference Murakami, Shinozaki and McCaffrey52) .
Overview of chrono-nutrition behaviour variables used to identify chrono-nutrition behaviour patterns. All values shown here are fictitious but realistic ones. (a) On the basis of data from the 11-d event-based ecological momentary assessment diaries of eating, the following variables were created for workdays and non-workdays separately: meal frequency, snack frequency, eating midpoint, duration of eating window, time interval between wake time and first eating occasion and time interval between last eating occasion and sleep time. Meals included breakfast, lunch and dinner, while snacks included all other eating occasions including morning snack, afternoon snack and evening snack. For each variable, daily mean values were calculated for each individual and for workdays (median 7 d) and non-workdays (median 4 d) separately. Then, the variable eating jetlag was created based on eating midpoint as the absolute difference between the mean value of eating midpoint on workdays and that on non-workdays. (b) On the basis of data from the 4-d event-based ecological momentary assessment weighed food diaries, the energy intake from each eating occasion slot (i.e. breakfast, lunch, dinner, morning snack, afternoon snack and evening snack) was determined. Here, morning snacks were defined as snacks consumed before 12.00, afternoon snacks as snacks consumed between 12.00 and 19.00 and evening snacks as snacks consumed after 19.00. For these variables, all eating occasions were considered (including those which consisted of beverages only), and both workday and non-workday data were combined together, because of the limited number of recording days available (2 d for each). The percentage of energy intake from each eating occasion slot was calculated as the sum of energy intake from each slot over the 4-d period divided by the total energy intake over the 4-d period.

Furthermore, on the basis of data from the 4-d weighed food diaries, we derived the EI from each eating occasion slot (i.e. breakfast, lunch, dinner, morning snack, afternoon snack and evening snack). We defined morning snacks as snacks consumed before 12.00, afternoon snacks as snacks consumed between 12.00 and 19.00 and evening snacks as snacks consumed after 19.00, mainly based on the previous finding on the timing of meal and snack intake among Japanese(Reference Murakami, Livingstone and Masayasu60). For these variables, all eating occasions were considered (including those which consisted of beverages only), and both workday and non-workday data were combined together, because of the limited number of recording days available (2 days for each). The percentage of EI from each eating occasion slot was calculated as the sum of EI from each slot over the 4-d period divided by the total EI over the 4-d period (see Figure 1(b)). Detailed descriptions of the definitions of chrono-nutrition behaviour variables are also available in online Supplementary Table 1.
Statistical analysis
Identification of chrono-nutrition behaviour patterns
Statistical analyses were conducted using the SAS statistical software (version 9.4; SAS Institute Inc.). To derive chrono-nutrition behaviour patterns, PCA was performed based on the nineteen chrono-nutrition behaviour variables (described in the previous section), using the PROC FACTOR procedure. All time-related variables were converted into decimal format, based on which all the analyses were conducted. We used the default option of PROC FACTOR for standardising the input variables to have a mean of 0 and a sd of 1. The derived factors are linear combinations of the included variables that explain as much as possible of the variation in the original variables. The factors were rotated by orthogonal transformation (varimax rotation) to provide a simpler structure having greater interpretability. The number of retained factors was determined by evaluating the scree plot and the combination of chrono-nutrition behaviour variables for the identified factors. The proportion of variance explained by the respective factors was determined by dividing the sum of squares of the respective factor loadings by the number of variables (n 19). Factor loadings are correlation coefficients between individual chrono-nutrition behaviour variables and chrono-nutrition behaviour patterns. A factor loading of |0·45| or higher was considered meaningful for interpretation, and patterns were labelled based on variables with the highest factor loadings for each pattern. Factor scores for each participant and for each pattern were obtained by adding the standardised value of each of the nineteen variables weighted by the factor loading for each pattern. These scores represent standardised variables with a mean of 0 and a sd of 1.
Analyses of chrono-nutrition behaviour patterns
Descriptive data are presented as means and SDs for continuous variables (except for those with skewness of > |1·0|, for which medians and 25th and 75th percentiles are shown) and as the numbers and percentages for categorical variables. For analysis, participants were categorised into quartiles according to each of the chrono-nutrition behaviour pattern scores. The associations between chrono-nutrition behaviour patterns (quartile categories) and chrono-nutrition behaviour variables (both those used and not used in PCA) were examined using a linear trend test. To examine the associations between chrono-nutrition behaviour patterns (quartile categories) and selected sociodemographic and lifestyle characteristics, we used the Mantel–Haenszel χ 2 test for categorical variables and a linear trend test for continuous variables.
Multiple linear regression models were constructed using the PROC GLM procedure to examine the associations between chrono-nutrition behaviour patterns and diet quality. The adjusted means (95 % CIs) for the HEI-2020 total and component scores were calculated for quartile categories of each of the chrono-nutrition behaviour pattern scores. Potential confounding factors considered were sex, age, education level, employment status, annual household income, living alone, smoking status, physical activity, experience of shiftwork during the preceding 3 months, reporting status of EI, chronotype and sleep duration. Finally, we examined the associations between chrono-nutrition behaviour patterns and general or abdominal obesity on the basis of multiple logistic regression using PROC LOGISTIC procedure, by adjusting for the same potential confounding factors shown above, in addition to the HEI-2020 total score. The adjusted OR (95 % CI) for general or abdominal obesity were calculated for quartile categories of each of the chrono-nutrition behaviour pattern scores (with the lowest quartile assigned as a reference). Linear trends with increasing levels of chrono-nutrition behaviour patterns were tested for by assigning each participant the median value for the category of chrono-nutrition behaviour patterns and modelling this value as a continuous variable (using multiple linear regression for diet quality and multiple logistic regression for obesity). The associations between the prespecified exposure variables and outcomes were examined based on a priori hypotheses. Because these analyses were conducted to evaluate predefined relationships rather than to explore numerous unrelated associations, formal adjustment for multiple comparisons was not applied. All reported P values are two-tailed, and P values < 0·05 were considered statistically significant.
Results
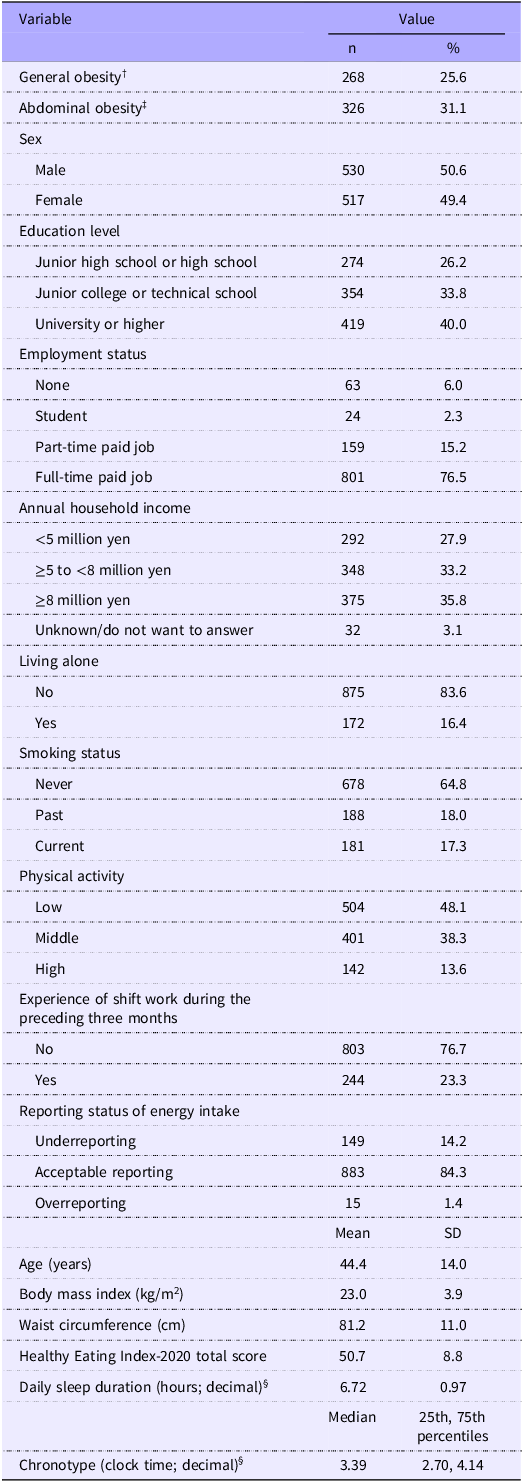
This analysis included 1047 Japanese adults (530 males and 517 females) with a mean age of 44·4 years (sd 14·4; Table 1). The mean HEI-2020 total score was 50·7 (sd 8·8). The prevalence of general and abdominal obesity was 25·6 % and 31·1 %, respectively. In the final analytic sample, the 11-d monitoring period comprised 11 517 person-days. Across these observation days, only 2 d (0·02 %) contained zero eating events; in both cases, participants confirmed that no food was consumed. No missing data were observed for sleep timing variables in the final analytic sample, indicating excellent adherence to the diary protocol.
Basic characteristics of study participants (n 1047) *

* Values are numbers (percentages) of participants for categorical variables and means and standard deviations for continuous variables (except for chronotype, for which median and 25 and 75th percentiles are shown, because of its skewness of >1.0).
† General obesity was defined as body mass index ≥25 kg/m2 for both sexes.
‡ Abdominal obesity was defined as waist circumference ≥90 cm for male individuals and ≥80 cm for female individuals.
§ These time-related variables are shown in decimal format, with the unit of hours; decimal (e.g., 6.72 means a duration of 6 h 43 min) and clock time; decimal (e.g., 3.39 means 3:23 AM).
Chrono-nutrition behaviour patterns
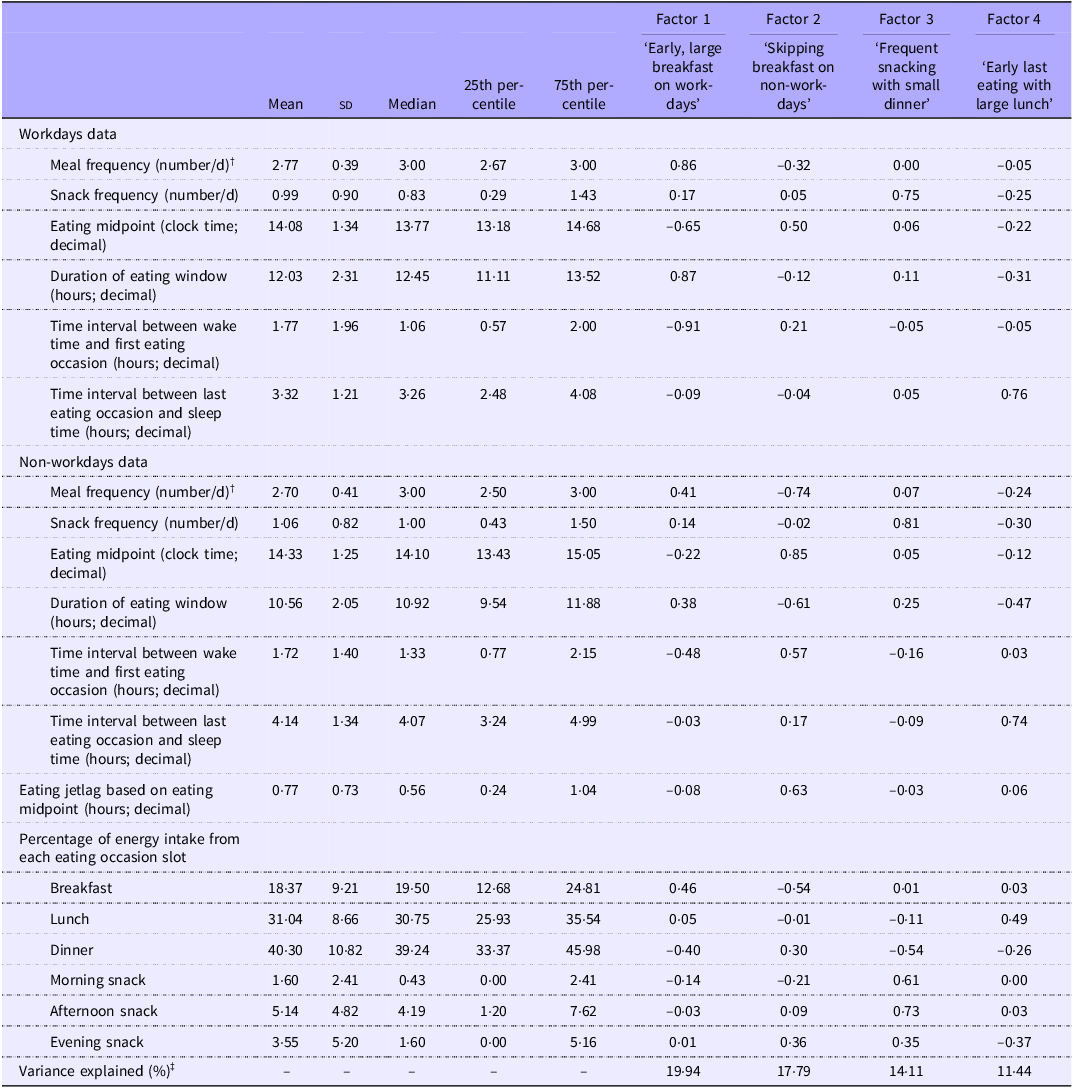
Using PCA based on the nineteen selected chrono-nutrition behaviour variables, we identified four key chrono-nutrition behaviour patterns (Table 2). Factor 1, labelled the ‘early, large breakfast on workdays’ pattern, was characterised by higher meal frequency (factor loading: 0·86), earlier eating midpoint (–0·65), longer eating window (0·87) and shorter time interval between wake time and first eating occasion (–0·91) on workdays. Similar but weaker loadings were observed on non-workdays (e.g. shorter time interval between wake time and first eating occasion; –0·48). This pattern was also characterised by higher EI from breakfast (0·46).
Factor loadings for chrono-nutrition behaviour patterns (n 1047) *

* Chrono-nutrition behaviour patterns were identified using principal component analysis based on the nineteen variables listed here. All time-related variables are shown in decimal format, with the unit of clock time; decimal (e.g. 14.08 means 14.05) and hours; decimal (e.g. 12.03 means a duration of 12 h 2 min).
† Meals included breakfast, lunch and dinner.
‡ Total variance explained was 63·27 %.
Factor 2, labelled the ‘skipping breakfast on non-workdays’ pattern, was characterised by lower meal frequency (–0·74), later eating midpoint (0·85), shorter eating window (–0·61) and longer time interval between wake time and first eating occasion (0·57) on non-workdays. Weaker associations were observed on weekdays (e.g. later eating midpoint; 0·50). This pattern was additionally characterised by larger eating jetlag (0·63) and lower EI from breakfast (–0·54).
Factor 3, labelled the ‘frequent snacking with small dinner’ pattern, was characterised by higher snack frequency on both workdays (0·75) and non-workdays (0·81), higher EI from morning (0·61) and afternoon (0·73) snacks and lower EI from dinner (–0·54). Factor 4, labelled the ‘early last eating with large lunch’ pattern, was characterised by a larger time interval between last eating occasion and sleep time (0·76 for workdays and 0·74 for non-workdays), larger EI from lunch (0·49) and shorter eating window on non-workdays (–0·47). The total variance explained by factors 1–4 was 63 %.
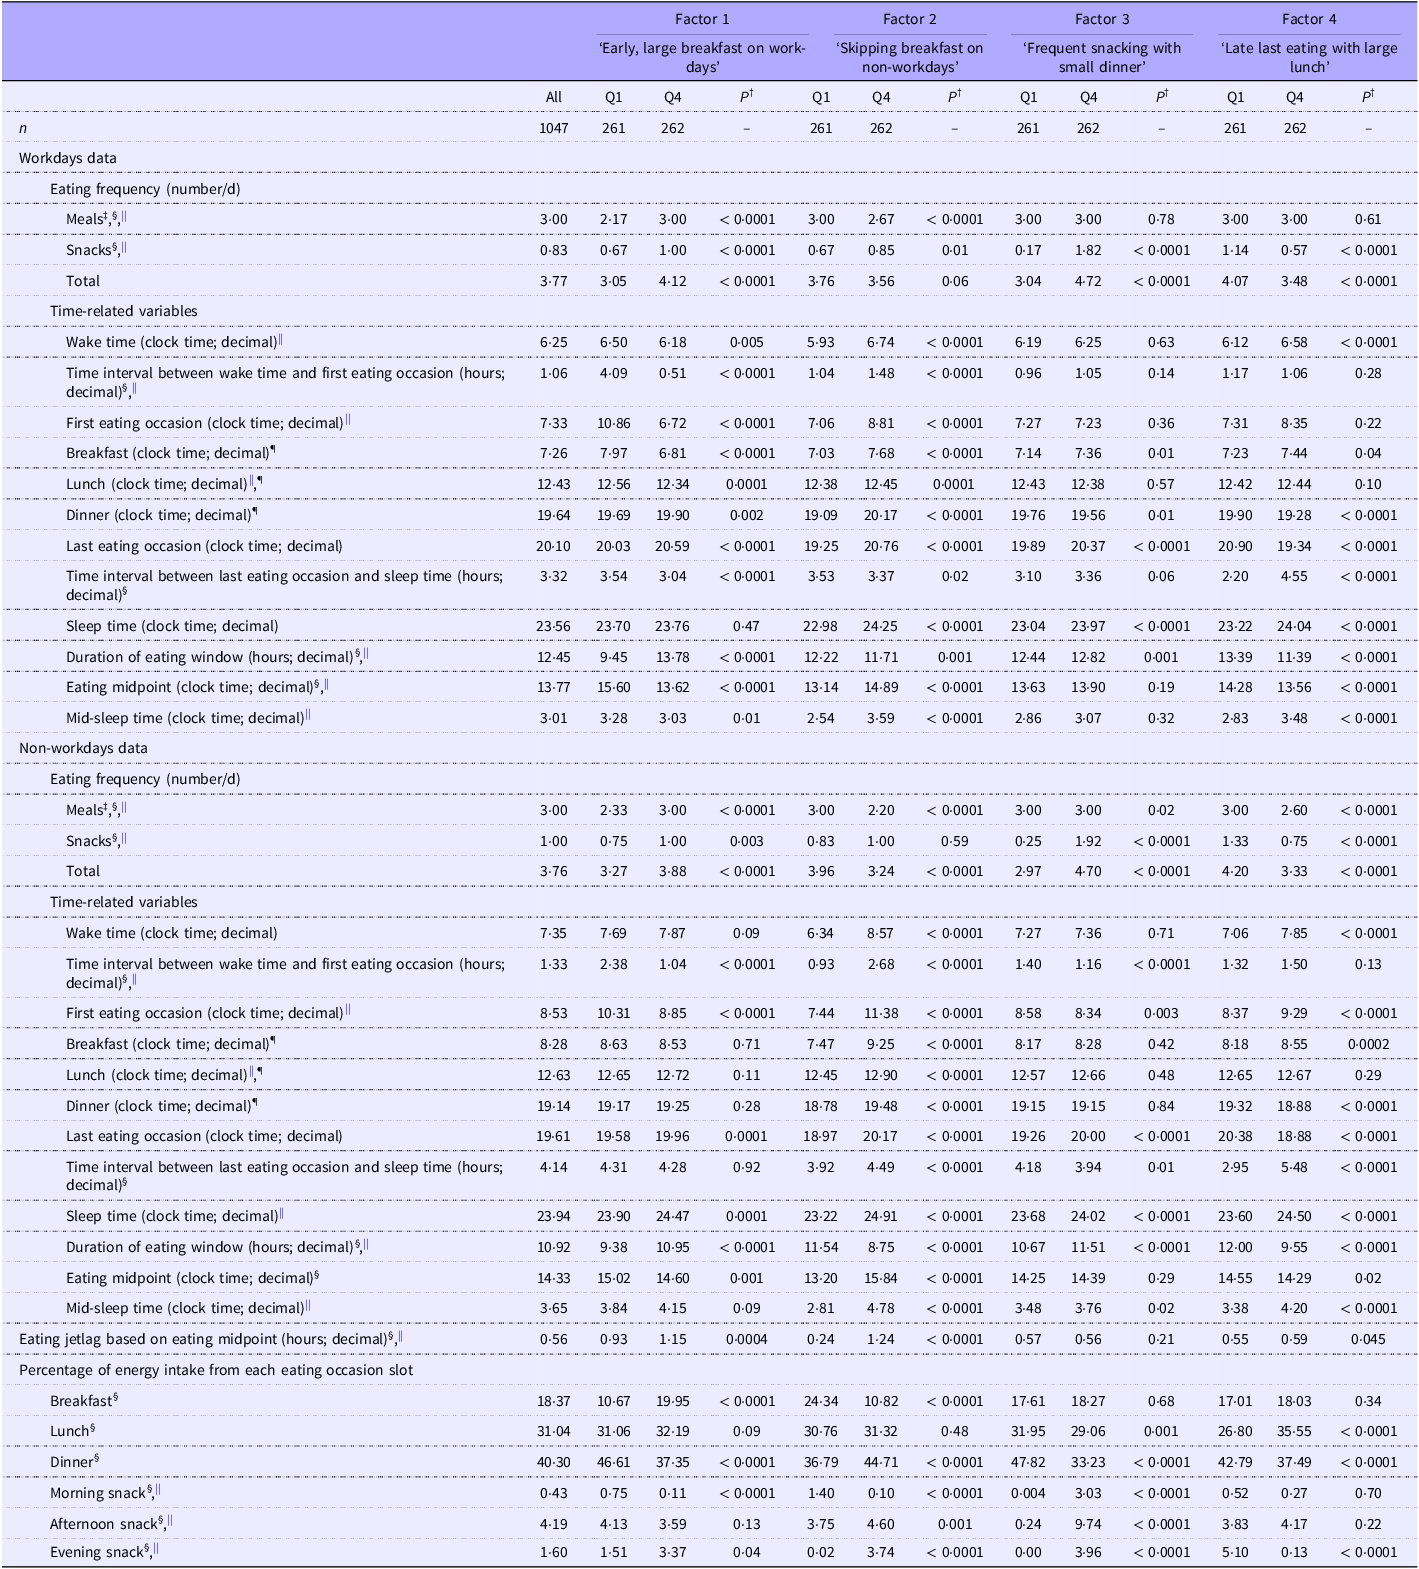
These patterns were well supported by other time-related variables that were not used for the pattern identification (Table 3). For example, a higher score for the ‘early, large breakfast on workdays’ pattern was associated with earlier timing of wake up, first eating occasion and breakfast on workdays (but not necessarily with those on non-workdays). A higher score of the ‘skipping breakfast on non-workdays’ pattern was associated with later timing of wake up, first eating occasion and breakfast, which was especially marked on non-workdays relative to workdays. A higher score of the ‘frequent snacking with small dinner’ pattern was associated with later timing of last eating occasion and sleep time (on both workdays and non-workdays). A higher score of the ‘early last eating with large lunch’ pattern was associated with later timing of wake up, first eating occasion (non-workdays only), breakfast and sleep time but also with earlier timing of last eating occasion and dinner.
Chrono-nutrition behaviour characteristics of study participants according to the lowest and highest quartiles of chrono-nutrition behaviour patterns *

Q, quartile.
* Values are means unless otherwise indicated. Only data for the first and fourth quartiles are shown for simplicity. All time-related variables are shown in decimal format, with the unit of clock time; decimal (e.g. 06.25 means 06.15, while 23.56 means 23.34) and hours; decimal (e.g. 01.06 means a duration of 1 h 4 min).
† For all variables, a linear trend test was used (based on all four quartiles; n 1047).
‡ Meals included breakfast, lunch and dinner.
§ Variables used to identify chrono-nutrition behaviour patterns based on principal component analysis.
|| Values are medians (for variables with skewness of > |1·0|).
¶ Participants who did not mention the consumption of breakfast (n 78 for workdays and 87 for non-workdays), lunch (n 5 for workdays and 10 for non-workdays) or dinner (n 1 for workdays and 2 for non-workdays) in the weighed food diaries were excluded.
Associations between chrono-nutrition behaviour patterns and participant characteristics
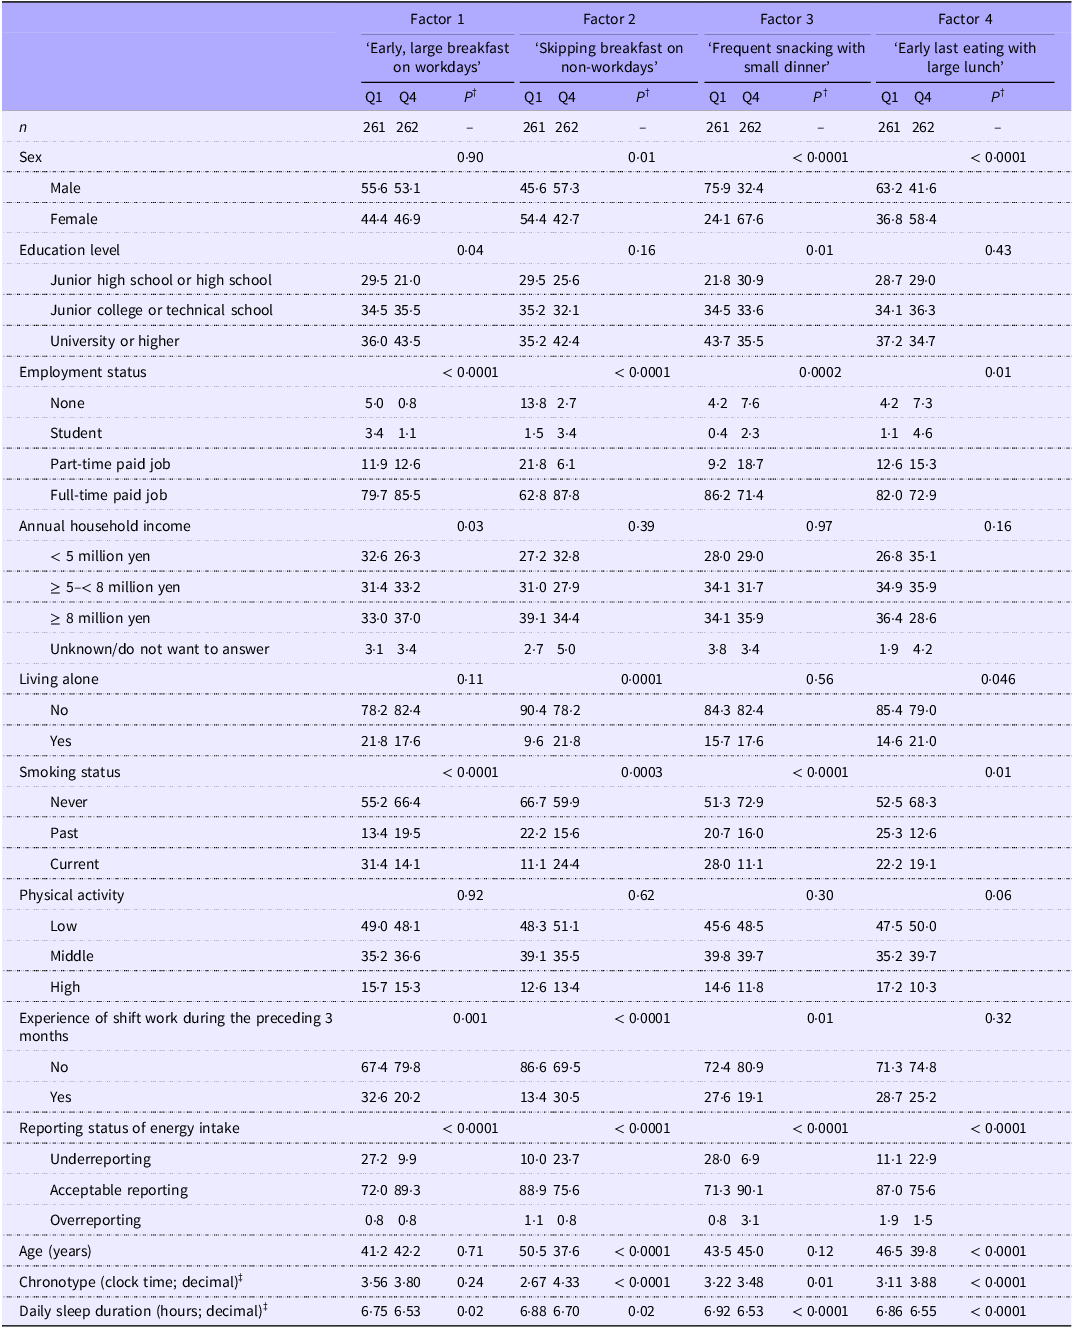
Table 4 shows participant characteristics according to the lowest and highest quartiles of each score of the four chrono-nutrition behaviour patterns. Compared with participants in the lowest quartile of the ‘early, large breakfast on workdays’ pattern score, those in the highest quartile were more likely to have higher education level, full-time paid jobs and higher household income and be never or past smokers, acceptable reporters of EI and shorter sleepers (all P < 0·05). They were also less likely to have undertaken shift work during the preceding 3 months (P = 0·001). Participants in the highest quartile of the ‘skipping breakfast on non-workdays’ pattern score were distinguished from those in the lowest quartile as being more likely to be younger, males, current smokers, under-reporters of EI, later chronotypes and shorter sleepers, have full-time paid jobs, live alone and have undertaken shift work during the preceding 3 months (all P < 0·05). Compared with the lowest quartile of participants in the ‘frequent snacking with small dinner’ pattern score, those in the highest quartile were more likely to be female, never smokers, acceptable reporters of EI, later chronotypes and shorter sleepers and have lower education level and in non-paid work or part-time paid jobs (all P < 0·05). They were also less likely to have undertaken shift work during the preceding 3 months (P = 0·01). Compared with participants in the lowest quartile of the ‘early last eating with large lunch’ pattern score, those in the highest quartile were more likely to be female, never smokers, under-reporters of EI, younger, later chronotypes and shorter sleepers, have non-paid work and live alone (all P < 0·05).
Sociodemographic and lifestyle characteristics of study participants according to the lowest and highest quartiles of chrono-nutrition behaviour patterns *

Q, quartile.
* Values are percentage of participants for categorical variables, means for age and daily sleep duration and medians for chronotype (skewness of > 1·0). Only data for the first and fourth quartiles are shown for simplicity.
† For categorical variables, the Mantel–Haenszel χ 2 was used; for continuous variables, a linear trend test was used (based on all four quartiles; n 1047).
‡ These time-related variables are shown in decimal format, with the unit of clock time; decimal (e.g. 03.56 means 03.34) and hours; decimal (e.g. 06.75 means a duration of 6 h 45 min).
Associations between chrono-nutrition behaviour patterns and diet quality
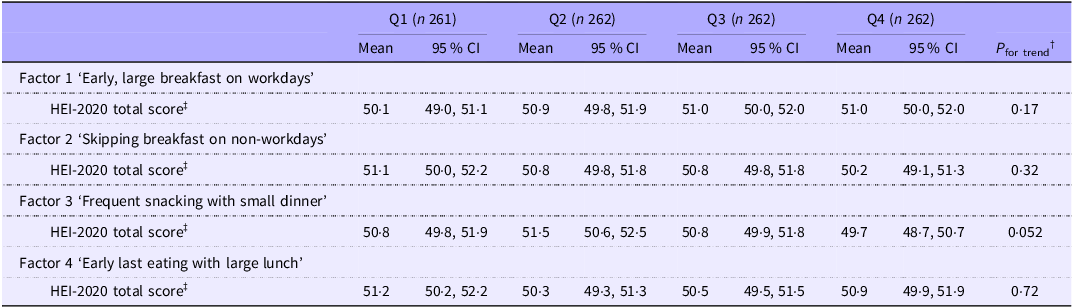
Associations between chrono-nutrition behaviour patterns and diet quality (HEI-2020) are shown in Table 5. After adjustment for potential confounders, none of the four patterns were significantly associated with the HEI-2020 total score (all P > 0·05). The ‘frequent snacking with small dinner’ pattern showed a non-significant trend towards a lower HEI-2020 total score (P = 0·052). As described in online Supplementary Table 2, significant associations (P < 0·05) were observed for some components (e.g. positive associations between the ‘early, large breakfast on workdays’ pattern and total fruits, whole fruits, dairy products, total protein foods, seafood and plant proteins and added sugars), but these are considered exploratory.
Associations between chrono-nutrition behaviour patterns and diet quality (n 1047) *

Q, quartile; HEI-2020, Healthy Eating Index-2020.
* Values are adjusted means (95 % CI). Adjustment was made for sex (male or female), age (years, continuous), education level (junior high school or high school, junior college or technical school and university or higher), employment status (none, student, part-time paid job and full-time paid job), annual household income (< 5 million yen, ≥ 5 to < 8 million yen, ≥ 8 million yen and unknown/do not want to answer), living alone (no or yes), smoking status (never, past and current), physical activity (low, middle and high), experience of shiftwork during the preceding 3 months (no or yes), reporting status of energy intake (underreporting, acceptable reporting or overreporting), chronotype (clock time; decimal, continuous) and sleep duration (h/d; decimal, continuous).
† Multiple linear regression models were used by assigning each participant the median value for the category of chrono-nutrition behaviour patterns and modelling this value as a continuous variable.
‡ Calculated as the sum of all component scores. A maximum score is 100.
Associations between chrono-nutrition behaviour patterns and obesity
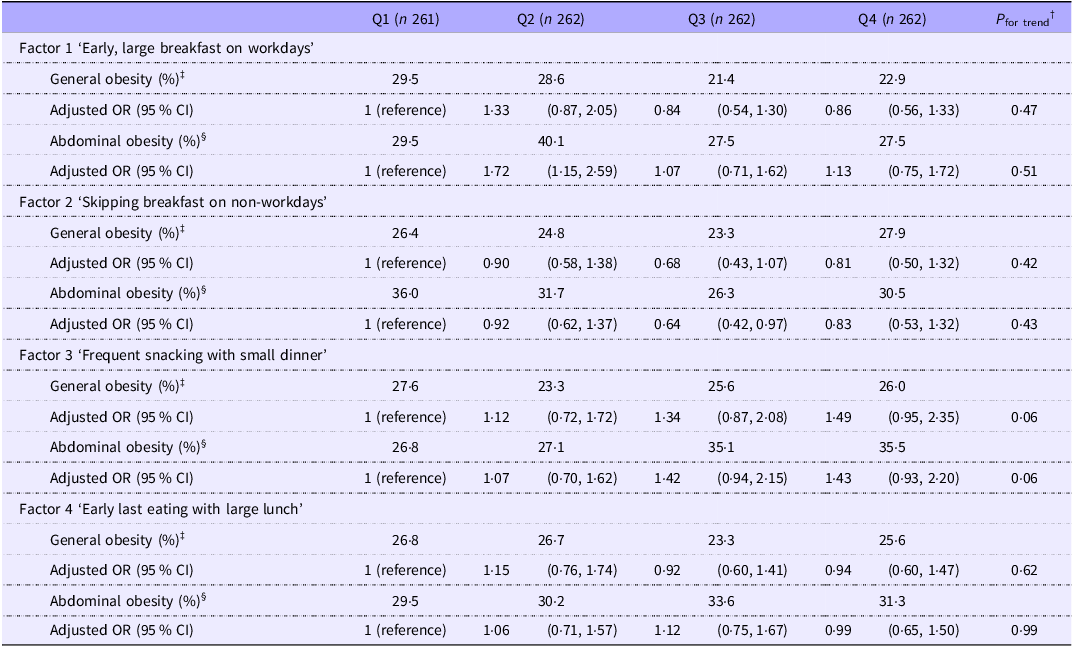
Table 6 shows associations between chrono-nutrition behaviour patterns and general and abdominal obesity. After adjustment for potential confounders, no pattern was significantly associated with general or abdominal obesity (all P > 0·05). The ‘frequent snacking with small dinner’ pattern showed a non-significant trend towards higher odds of general obesity (OR 1·18, 95 % CI 0·98, 1·42, P = 0·06) and abdominal obesity (OR 1·21, 95 % CI 0·99, 1·47, P = 0·06).
Associations between chrono-nutrition behaviour patterns and general and abdominal obesity (n 1047) *

Q, quartile.
* Adjustment was made for sex (male or female), age (years, continuous), education level (junior high school or high school, junior college or technical school and university or higher), employment status (none, student, part-time paid job and full-time paid job), annual household income (< 5 million yen, ≥ 5 to < 8 million yen, ≥ 8 million yen and unknown/do not want to answer), living alone (no or yes), smoking status (never, past and current), physical activity (low, middle and high), experience of shiftwork during the preceding 3 months (no or yes), reporting status of energy intake (underreporting, acceptable reporting or overreporting), chronotype (clock time; decimal, continuous), sleep duration (h/d; decimal, continuous) and Healthy Eating Index-2020 total score (continuous).
† Multiple logistic regression models were used by assigning each participant the median value for the category of chrono-nutrition behaviour patterns and modelling this value as a continuous variable.
‡ General obesity was defined as BMI ≥ 25 kg/m2 for both sexes.
§ Abdominal obesity was defined as waist circumference ≥ 90 cm for male individuals and ≥ 80 cm for female individuals.
Discussion
To our knowledge, this is the first study to identify chrono-nutrition behaviour patterns using a comprehensive set of these behaviours, highlighting the complex and inter-related nature. The observed variation in patterns by sociodemographic characteristics – though not by diet quality or obesity – further illustrates the multifaceted nature of eating behaviours and supports the value of exploratory, data-driven approaches to characterising chrono-nutrition behaviours holistically.
Using PCA, we identified four chrono-nutrition behaviour patterns: ‘early, large breakfast on workdays’, ‘skipping breakfast on non-workdays’, ‘frequent snacking with small dinner’ and ‘early last eating with large lunch’ patterns. Only a limited number of studies have identified chrono-nutrition behaviour patterns using data-driven (a posteriori) approach. While different analytical methods (e.g. k-means cluster analysis, latent class analysis and PCA) and different input variables are used, it appears that common chrono-nutrition behaviour patterns (or clusters) can be identified. These include patterns characterised by frequent snacking (e.g. grazing pattern)(Reference Leech, Worsley and Timperio34,Reference Aqeel, Guo and Lin35,Reference Leech, Timperio and Livingstone44–Reference Eicher-Miller, Khanna and Boushey48) , late first eating occasion (accompanied by breakfast skipping and restricted eating window)(Reference Pons-Muzzo, de Cid and Obon-Santacana30,Reference Kim, Conlon and Farsijani32,Reference Chau, Pan and Chen46,Reference Santonja, Bogl and Degenfellner49) , early first eating occasion (with extended eating window)(Reference Pons-Muzzo, de Cid and Obon-Santacana30,Reference Kim, Conlon and Farsijani32,Reference Palla and Almoosawi45,Reference Jayedi, Shafiei Neyestanak and Djafarian50) , delayed lunch(Reference Leech, Worsley and Timperio34,Reference Leech, Timperio and Livingstone44,Reference Chau, Pan and Chen46,Reference Jayedi, Shafiei Neyestanak and Djafarian50) and early last eating occasion(Reference Pons-Muzzo, de Cid and Obon-Santacana30,Reference Kim, Conlon and Farsijani32,Reference Palla and Almoosawi45) , in addition to traditional meal patterns (with three meals consumed at conventional time)(Reference Kim, Conlon and Farsijani32,Reference Leech, Worsley and Timperio34,Reference Leech, Timperio and Livingstone44,Reference Chau, Pan and Chen46,Reference Santonja, Bogl and Degenfellner49,Reference Jayedi, Shafiei Neyestanak and Djafarian50) . Generally consistent with cited studies, we also identified patterns characterised mainly by frequent snacking (‘frequent snacking with small dinner’ pattern), by late first eating occasion (‘skipping breakfast on non-workdays’ pattern), by early first eating occasion (‘early, large breakfast on workdays’ pattern) and by early last eating occasion (‘early last eating with large lunch’ pattern).
It is widely accepted that dietary patterns vary across countries and regions(Reference Almoosawi, Vingeliene and Karagounis12,Reference Leech, Worsley and Timperio34) . This finding may be explained by sociodemographic and sociocultural differences that influence eating habits, such as socio-economic factors, family structure, cultures that emphasise certain diets and work patterns(Reference Almoosawi, Vingeliene and Karagounis12,Reference Leech, Worsley and Timperio34,Reference Kant and Graubard81–Reference De Castro83) . In this study, female sex was associated with higher scores of the ‘frequent snacking with small dinner’ and ‘early last eating with large lunch’ patterns, while male sex was associated with a higher score of the ‘skipping breakfast on non-workdays’ pattern. Having a full-time paid job was associated with higher scores of the ‘early, large breakfast on workdays’ and ‘skipping breakfast on non-workdays’ patterns but lower scores of the ‘frequent snacking with small dinner’ and ‘early last eating with large lunch’ patterns. Younger age was associated with higher scores of the ‘skipping breakfast on non-workdays’ and ‘early last eating with large lunch’ patterns. Later chronotypes and shorter sleep durations were associated with higher scores of all patterns (except for no association between chronotype and the ‘early, large breakfast on workdays’ pattern). Previous studies also found the associations between chrono-nutrition behaviour patterns and a range of variables, such as sex(Reference Leech, Worsley and Timperio34,Reference Aqeel, Guo and Lin35,Reference Chau, Pan and Chen46) , age(Reference Pons-Muzzo, de Cid and Obon-Santacana30,Reference Kim, Conlon and Farsijani32,Reference Leech, Worsley and Timperio34,Reference Aqeel, Guo and Lin35,Reference Chau, Pan and Chen46,Reference Eicher-Miller, Khanna and Boushey48) , race/ethnicity(Reference Kim, Conlon and Farsijani32,Reference Eicher-Miller, Khanna and Boushey48) , education(Reference Pons-Muzzo, de Cid and Obon-Santacana30,Reference Kim, Conlon and Farsijani32,Reference Leech, Worsley and Timperio34,Reference Chau, Pan and Chen46) , household income(Reference Kim, Conlon and Farsijani32,Reference Eicher-Miller, Khanna and Boushey48) , working condition(Reference Pons-Muzzo, de Cid and Obon-Santacana30,Reference Kim, Conlon and Farsijani32,Reference Leech, Worsley and Timperio34,Reference Chau, Pan and Chen46,Reference Santonja, Bogl and Degenfellner49) , household composition(Reference Leech, Worsley and Timperio34,Reference Santonja, Bogl and Degenfellner49) , chronotype(Reference Pons-Muzzo, de Cid and Obon-Santacana30,Reference Santonja, Bogl and Degenfellner49) and sleep variables(Reference Pons-Muzzo, de Cid and Obon-Santacana30), although the directions and strengths of the associations vary. These findings suggest that the sociodemographic and sociocultural profiles of chrono-nutrition behaviour patterns are complex and may partly contribute to the heterogeneity observed across studies. However, differences in the definition and measurement of chrono-nutrition behaviours, sociodemographic factors and lifestyle characteristics, as well as variations in analytic methods, may also explain the inconsistent findings. Therefore, these factors should be carefully considered when interpreting results and conducting cross-country comparisons.
Even fewer studies have investigated the associations between chrono-nutrition behaviour patterns and diet quality or adiposity. By using latent class analysis, Leech et al. observed three patterns in a representative sample of Australian adults on the basis of the distribution of eating occasions across the day(Reference Leech, Timperio and Livingstone44). The authors found that participants with a ‘grazing’ pattern had poorer diet quality, as well as higher adiposity (only women), compared with those with a ‘conventional’ or ‘later lunch’ pattern(Reference Leech, Timperio and Livingstone44). Also, in a representative sample of US adults, four patterns were identified by cluster analysis on the basis of the timing and frequency of eating occasion and EI(Reference Aqeel, Guo and Lin35,Reference Eicher-Miller, Khanna and Boushey48) . The authors found that a pattern characterised by less definitive but frequently peaked intakes of energy (i.e. ‘grazing’ pattern) was associated with lower diet quality and higher adiposity measures, compared with other patterns characterised by evenly spaced, energy balanced eating occasions(Reference Aqeel, Guo and Lin35,Reference Eicher-Miller, Khanna and Boushey48) . The results of the present study are broadly consistent with these observations in that the ‘frequent snacking with small dinner’ pattern showed a non-significant trend towards a lower diet quality and higher odds of general and abdominal obesity. In this study, there were no associations of other three patterns (‘early, large breakfast on workdays’, ‘skipping breakfast on non-workdays’ and ‘early last eating with large lunch’ patterns) with diet quality or obesity. This differs from the findings from an Iranian study, in which participants in the ‘earlier breakfast’ pattern had a lower likelihood of obesity compared with the ‘conventional’ pattern (the association with diet quality was not investigated)(Reference Jayedi, Shafiei Neyestanak and Djafarian50). Differences in study design, population characteristics and pattern derivation methods may explain the discrepancy. Given the limited number of studies published so far, further research is warranted to reach a firm conclusion on the associations between chrono-nutrition behaviour patterns and diet quality and obesity.
The particular strengths of the present study include the use of ecological momentary assessment food diaries with a large number of recording days, which provided PCA with a wide range of timing and frequency variables with clear definitions for workdays and non-workdays separately, as well as the quantitative information on distribution of EI across the day. Additionally, this study was conducted in a large nationwide sample with almost the equal proportions of sex and age categories, with adjustment for a range of potential confounding factors.
However, there are also several limitations. First, the cross-sectional nature of the study does not permit the assessment of causality owing to the uncertain temporality of the association. Further studies using a prospective design would provide better understanding of the associations between chrono-nutrition behaviour patterns and diet quality and obesity. Second, although conducted in diverse regions (26 of 47 prefectures), the participants consisted of volunteers, not a nationally representative sample of the Japanese population. The participants may have been biased towards greater health consciousness, higher socio-economic status or both. For example, the education level and annual household income of the participants were higher than those of a nationally representative sample(Reference Murakami, Shinozaki and Livingstone31,Reference Murakami, Shinozaki and McCaffrey52,Reference Murakami, Shinozaki and Livingstone57) . Meanwhile, the prevalence of current smokers and mean BMI in the present participants were similar to those of the nationally representative sample(Reference Murakami, Shinozaki and Livingstone31,Reference Murakami, Shinozaki and McCaffrey52,Reference Murakami, Shinozaki and Livingstone57) . Third, because anthropometric measurements were not exclusively conducted by trained research dietitians, any resulting measurement error would likely be non-differential with respect to the exposure variables and thus tend to attenuate associations, potentially reducing the ability to detect true associations. Fourth, although we adjusted for a variety of potential confounding variables, residual confounding could not be ruled out. Fifth, because the associations between the prespecified exposure variables and outcomes (diet quality and obesity) were examined based on a priori hypotheses, formal adjustment for multiple comparisons was not applied. Although none of the associations reached statistical significance, the findings should be interpreted with consideration of the number of statistical tests performed.
Finally, PCA itself is subject to a number of limitations, and the results might be data-specific. As with other studies, this study was also hampered by analytic decisions which at several points were subjective or arbitrary. These include the number and definitions of input variables, the number of extracted factors and the rotation method used, as well as the interpretation and naming of factors. Our process may have produced a degree of inconsistency, and both the results and the process used to derive chrono-nutrition behaviour patterns require careful interpretation. Nevertheless, because chrono-nutrition behaviours are highly inter-related(Reference Pons-Muzzo, de Cid and Obon-Santacana30,Reference Murakami, Shinozaki and Livingstone31) , creating a synergy that impacts dietary intake and health(Reference Kim, Conlon and Farsijani32), such a patterning approach would be useful in chrono-nutrition research. Thus, further research in this regard is warranted. For example, a direct comparison of patterns derived from different statistical methods (e.g. PCA v. latent class analysis) using the same dietary data would provide important insight into the reproducibility, optimal solution and optimal set of input variables of patterning chrono-nutrition behaviours. Also, establishing the relative validity of chrono-nutrition behaviour patterns derived from questionnaire methods against those derived from a more accurate method (e.g. food diaries) would be desirable to accelerate large-scale investigations on the associations with health outcomes. Through these methodological studies, the emerging research field of chrono-nutrition would move forward to higher levels.
In conclusion, on the basis of a comprehensive set of chrono-nutrition behaviour variables, this study identified four PCA-derived chrono-nutrition behaviour patterns (‘early, large breakfast on workdays’, ‘skipping breakfast on non-workdays’, ‘frequent snacking with small dinner’ and ‘early last eating with large lunch’ patterns) that were differentially associated with sociodemographic characteristics, but not with diet quality or obesity. These findings support the utility of a pattern-based approach for capturing the multidimensional nature of chrono-nutrition behaviours. Further research is warranted to determine whether the identified patterns and their associations are reproducible across different populations and settings and when using alternative assessment tools and statistical methods.
Supplementary material
For supplementary material/s referred to in this article, please visit https://doi.org/10.1017/S0007114526107090
Acknowledgements
The authors would like to thank the research dietitians who conducted data collection: Masako Shimooka, Erika Iwasaki, Kanon Takaishi, Serina Uji, Fuki Kudo, Mizuho Hasumi, Kazue Fukushi, Kotomi Hirano and Yumemi Arakawa (Hokkaido); Michiyo Oowada, Yutaka Shojiguchi, Emi Kikuchi, Kumiko Yamazaki and Megumi Onodera (Iwate); Akiko Sato, Chiemi Ito, Yuka Endo, Ai Oono, Hiromi Kawaguchi, Marino Takeda, Yuka Jinbo, Shizuku Numazawa, Chihiro Takahashi, Shiori Niizeki, Mio Ootaki, Satoshi Numazawa, Yumi Miura, and Haruka Tsutou (Yamagata); Yumiko Oda, Eriko Kuriki, Miyoko Matsumoto, Setsuko Kikuchi, Haruna Takanezawa, Emiko Kanazawa, Katsuko Aoyama, Yukari Kitajima, Mayumi Sato, Misaki Ito, Midori Soeta, Masayo Numata and Natsumi Hoshi (Fukushima); Hanayo Kadoi, Toshie Nakayama, Noriko Suzuki, Kayoko Kikuchi, Akiko Seki, Sayaka Ebata, Masako Yamaguchi, Chiaki Sato, Kazuyo Shibano, Yuka Ota, Tomoko Oga, Yuko Takano, Mariko Usui, Yoko Nakazaki, Satomi Fujii, Miki Terakado, Sayuri Fujii, Tomoko Saito, Junko Hanzawa, Yurie Shibata, Hisako Watahiki and Kimi Miura (Ibaraki); Kaoru Goto, Yuka Arai, Manami Honda, Miki Hori, Fumiyo Endo, Akiko Kato, Emiko Kajiwara, Keiko Sekine, Etsuko Kusakari, Mami Ono, Akiko Utsumi, Asako Hamada, Kozue Yanase, Yuka Inaba, Satoko Maruyama and Yuko Kobayashi (Saitama); Hitomi Okahashi, Yoshiko Katayama, Yurina Arai, Shinobu Matsui, Shoko Kakimura, Yoko Kouno and Yoshiko Kowa (Tokyo); Suzuyo Takeda, Kumiko Ono, Yayoi Hayashi, Shinobu Katayama, Megumi Koike, Keiko Yamada, Yuko Okamoto, Kaori Otomo, Etsuko Abe, Ikuko Endo, Kazumi Takagi, Yuko Rokuda, Hisae Takahashi, Tomomi Masuda, Masami Iwata and Mayuko Kimura (Kanagawa); Masako Koike, Reiko Kunimatsu, Yurika Seida, Eriko Kiryu, Keiko Hirayama, Miki Hayashi, Youko Hasegawa, Ryoko Ito, Tomoko Funayama and Yu Kawakami (Niigata); Yasuko Ishii, Megumi Ariizumi, Kotomi Kishikawa, Aoi Mochizuki, Yukie Shiogami, Kaori Sudo, Naoko Naito, Naoya Mochizuki and Sakiko Watanabe (Yamanashi); Noriko Sumi, Keiko Wakayama, Eri Suzuki, Noriko Takahashi, Michiyo Ishihara, Yurimi Kitamura, Manami Tauchi, Kei Hayashi, Kouichi Asai, Tomomi Fujita, Akiko Kawasaki and Kazuyo Sumi (Gifu); Masako Tanaka, Yumi Nishi, Hideko Uchibayashi, Miyuki Otono, Emi Kajiura, Ryoko Mizuno, Yuri Torii, Rie Tsutaki, Haruna Kitajima, Runa Tsutsumi, Hideshi Taniguchi and Ayako Saeki (Aichi); Mariko Teraya, Mayumi Kanai, Miyo Yasuda, Sawa Mizukawa, Tomohiro Higuchi, Eriko Taniguchi, Noriyoshi Kuwada, Yuri Mitsushima, Megumi Ito, Kazuko Ogawa, Shizuka Kurokawa, Yukina Kawahara and Junko Mitani (Kyoto); Yumiko Noutomi, Mayumi Fujiwara, Hitomi Yamamoto, Hiromi Tashiro, Shinobu Fujiwara, Tami Irei, Keiko Takata, Itsuki Shirobayashi, Junko Ikukawa, Eriko Nakatani, Yasuka Tabuchi, Tomoko Takegawa and Atsuko Toyokawa (Osaka); Yoko Hokotachi, Yuriko Takeura, Yukie Wada, Atsuko Konishi and Saki Sakurai (Hyogo); Yurika Adachi, Keiko Uzuki, Atsuko Umeda, Hisako Watanabe, Yuko Oka, Kyoko Yamada and Rumiko Nishitani (Tottori); Sachiko Terao, Takahiro Takidani, Rieko Manabe, Mai Yashiro, Noriyuki Kubota, Tomoko Miyake, Mari Matsuda, Mieko Imanaka, Chiyo Takatsuka and Manaka Uemura (Okayama); Yoko Fujii, Yukari Mizokami, Izumi Hase, Itsuko Yamashita, Chika Yoneda, Aki Funada, Yukako Ito and Yoshimi Watanabe (Hiroshima); Miyuki Fujii, Sayoko Naya, Masae Sugiyama, Yuki Nishioka, Tomoko Ishida, Nobuko Morishita and Hitomi Nakata (Yamaguchi); Eri Ikeuchi, Toyoko Kitadai, Natsuko Shimotani, Sakiko Nobuta, Kayo Hashimoto, Tomomi Fujita, Tasuku Maeda and Yuriko Doihara (Tokushima), Reiko Motoie, Machiko Ueda, Nobumi Muguruma, Yoko Moriki and Mai Nagasawa (Ehime); Akiko Fujimoto, Miki Hamachi, Kiyoko Katayama, Tomoyo Oshikawa and Mayu Fujimoto (Fukuoka); Naomi Nagafuchi, Kyoko Murata, Narumi Takubo, Miki Yanai, Chigusa Kamachi, Makoto Hirotaki, Hiromi Satake, Chiemi Shida and Mayumi Sakata (Saga); Junko Kiyota, Tomomi Nagamori, Takako Fukushima, Hiromi Ide, Satsuki Miyama, Akiko Taira, Yumi Kokata, Kimiko Suminaga and Megumi Ooga (Kumamoto); Yuko Soga, Kayoko Iwamoto, Mika Moribe, Miki Hamada, Toshiko Eto, Kanae Toda, Saori Furukawa, Taeko Nagami and Mutsuko Shutou (Oita); and Kaori Kaimoto, Saki Oga, Kana Sakaida, Daisuke Iwamoto, Chiharu Nakanoue, Kae Hamada and Kenta Nagamoto (Kagoshima). The authors also thank the research team staff at the survey center (Department of Social and Preventive Epidemiology, School of Public Health, University of Tokyo): Riho Adachi, Yuko Ishii, Fumi Oono, Hiroko Onodera, Maya Kamei, Nana Kimoto, Akiko Saito, Yukiko Saito, Fusako Takahashi, Mamiko Takahashi, Tomoko Doi, Akiko Hara, Keika Mine and Sachie Mori.
This work was supported by the Japan Society for the Promotion of Science (grant number: 23K01960). The funder had no role in the design, analysis or writing of this article.
K.M. contributed to the concept and design of the survey and data collection and management, formulated the research question, analysed and interpreted the data, prepared the first draft of the manuscript and had primary responsibility for the final content; N. S. contributed to the concept and design of the survey and data collection and management, interpreted the data and provided critical input into the final draft of the manuscript; M. B. E. L. provided critical input into the final draft of the manuscript; and S. M. and S. S. contributed to the design of the survey and managed the study-field establishment, recruitment and fieldwork. All authors read and approved the final manuscript.
The authors have no conflicts of interest to declare.
The authors declare no use of generative AI in this study.
Data described in the manuscript, code book and analytic code will be made available upon request and upon approval by the Ethics Committee of the University of Tokyo Faculty of Medicine.


 Open access