


Introduction
The Cretaceous/Paleogene (K/Pg) boundary ~66 Ma is characterized by one of the largest mass extinction events in Earth's history, which eradicated more than 75% of marine species on Earth (e.g., Jablonski Reference Jablonski1991, Reference Jablonski1994; Schulte et al. Reference Schulte, Alegret, Arenillas, Arz, Barton, Bown and Bralower2010). As well as causing the complete elimination of the nonavian dinosaurs, mosasaurs, and ammonites (e.g., Ward Reference Ward1983; Bardet Reference Bardet1994; Brusatte et al. Reference Brusatte, Lloyd, Wang and Norell2014), the K/Pg impact also led to the selective extinction of >90% of calcifying plankton (Bown et al. Reference Bown, Lees, Young, Thierstein and Young2004; Fraass et al. Reference Fraass, Kelly and Peters2015; Lowery et al. Reference Lowery, Bown, Fraass and Hull2020). An increasing body of evidence indicates that long-term ecological reorganization following the impact was caused by the collapse and subsequent restoration of marine biological pump efficiency: the proportion of organic carbon that is upwelled, taken up via photosynthesis, and eventually exported from the surface ocean to the deep sea, which likely had a profound effect on nutrient availability in the photic zone (e.g., D'Hondt et al. Reference D'Hondt, Donaghay, Zachos, Luttenberg and Lindinger1998; Coxall et al. Reference Coxall, D'Hondt and Zachos2006; Hull et al. Reference Hull, Norris, Bralower and Schueth2011; Birch et al. Reference Birch, Coxall, Pearson, Kroon and Schmidt2016; Jones et al. Reference Jones, Lowery and Bralower2019). It is also possible that surface ocean acidification, caused by the impact-induced vaporization of sulfur-rich target rock, played a role in extinction selectivity (Henehan et al. Reference Henehan, Ridgwell, Thomas, Zhang, Alegret, Schmidt and Rae2019). However, the short-term nature of this ocean acidification is unlikely to have had a major role in driving the long-term restructuring of planktic communities that took place over a ~2–3 Myr interval (e.g., Coxall et al. Reference Coxall, D'Hondt and Zachos2006; Birch et al. Reference Birch, Coxall, Pearson, Kroon and Schmidt2016; Alvarez et al. Reference Alvarez, Gibbs, Bown, Kim, Sheward and Ridgwell2019; Jones et al. Reference Jones, Lowery and Bralower2019).
Calcareous nannoplankton, a group of unicellular, golden-brown algae that includes the coccolithophores, have been the most dominant calcifying phytoplankton in the surface oceans since the late Triassic (Bown et al. Reference Bown, Lees, Young, Thierstein and Young2004). As one of the major primary producers during the latest Cretaceous, their almost complete extinction at the K/Pg boundary (93% of species; Bown Reference Bown2005a) was likely one of the key drivers of the large-scale ecological reorganization that occurred in the postimpact environment. Nannoplankton never again reached the diversity they achieved before the impact, and the K/Pg extinction event led to the evolution of modern marine phytoplankton communities, with diatoms gradually becoming the dominant group (Knoll and Follows Reference Knoll and Follows2016).
The selective survival of nannoplankton taxa that were adapted to high nutrient environments (i.e., eutrophic taxa) and their proliferation during the earliest Danian is further evidence that nutrient availability, driven by changes in biological pump efficiency, was the dominant control on the relatively slow recovery of calcareous nannoplankton following the impact (Bown Reference Bown2005a; Jiang et al. Reference Jiang, Bralower, Patzkowsky, Kump and Schueth2010). This is largely because nannoplankton are generally better adapted to lower nutrient (oligotrophic) environments and are thus outcompeted by other phytoplankton groups in high-nutrient settings (Wyatt Reference Wyatt2014). In addition, the evolution of new, often short-lived, nannoplankton lineages following the K/Pg boundary, was likely also a result of a decline in nutrient availability, with globally heterogeneous postimpact nannoplankton assemblages caused by local differences in the nature and rate of biological pump recovery (Alvarez et al. Reference Alvarez, Gibbs, Bown, Kim, Sheward and Ridgwell2019; Jones et al. Reference Jones, Lowery and Bralower2019).
Braarudosphaera was one of only a handful of nannoplankton genera to survive the K/Pg impact, and even thrived in some ocean basins during the earliest Paleocene. Unlike typical calcareous nannoplankton (i.e., coccolithophores) that form minute calcite plates (coccoliths) inside their single cells, Braarudosphaera produces its pentagonal calcite plates (pentaliths) extracellularly (Hagino et al. Reference Hagino, Tomioka, Young, Takano, Onuma and Horiguchi2016). These pentaliths have five distinct elements (Fig. 1) and stack on top of one another to form layers or laminae (e.g., Wise and Kelts Reference Wise and Kelts1972; Mai et al. Reference Mai, Willems and von Salis Perch-Nielsen1997; Kelly et al. Reference Kelly, Norris and Zachos2003). Due to similarities in morphology and paleoecological preferences, Braarudosphaera is thought to have evolved from, and temporarily replaced, the genus Micrantholithus during the Aptian ~119 Ma (Street and Bown Reference Street and Bown2000; Bown Reference Bown2005b; Bartol et al. Reference Bartol, Pavšič, Dobnikar and Bernasconi2008). It is also likely that Braarudosphaera is closely related to the nannoconnids, an extinct nannolith group that was dominant during the latest Jurassic and Early Cretaceous (Roth and Bowdler Reference Roth and Bowdler1981; Roth and Krumbach Reference Roth and Krumbach1986; Bralower et al. Reference Bralower, Monechi and Thierstein1989; Street and Bown Reference Street and Bown2000), as indicated by the presence of specimens in Tithonian–Berriasian sediments with morphologies that are transitional between Braarudosphaera pentaliths and small nannoconids (Young et al. Reference Young, Bown and Lees2020).
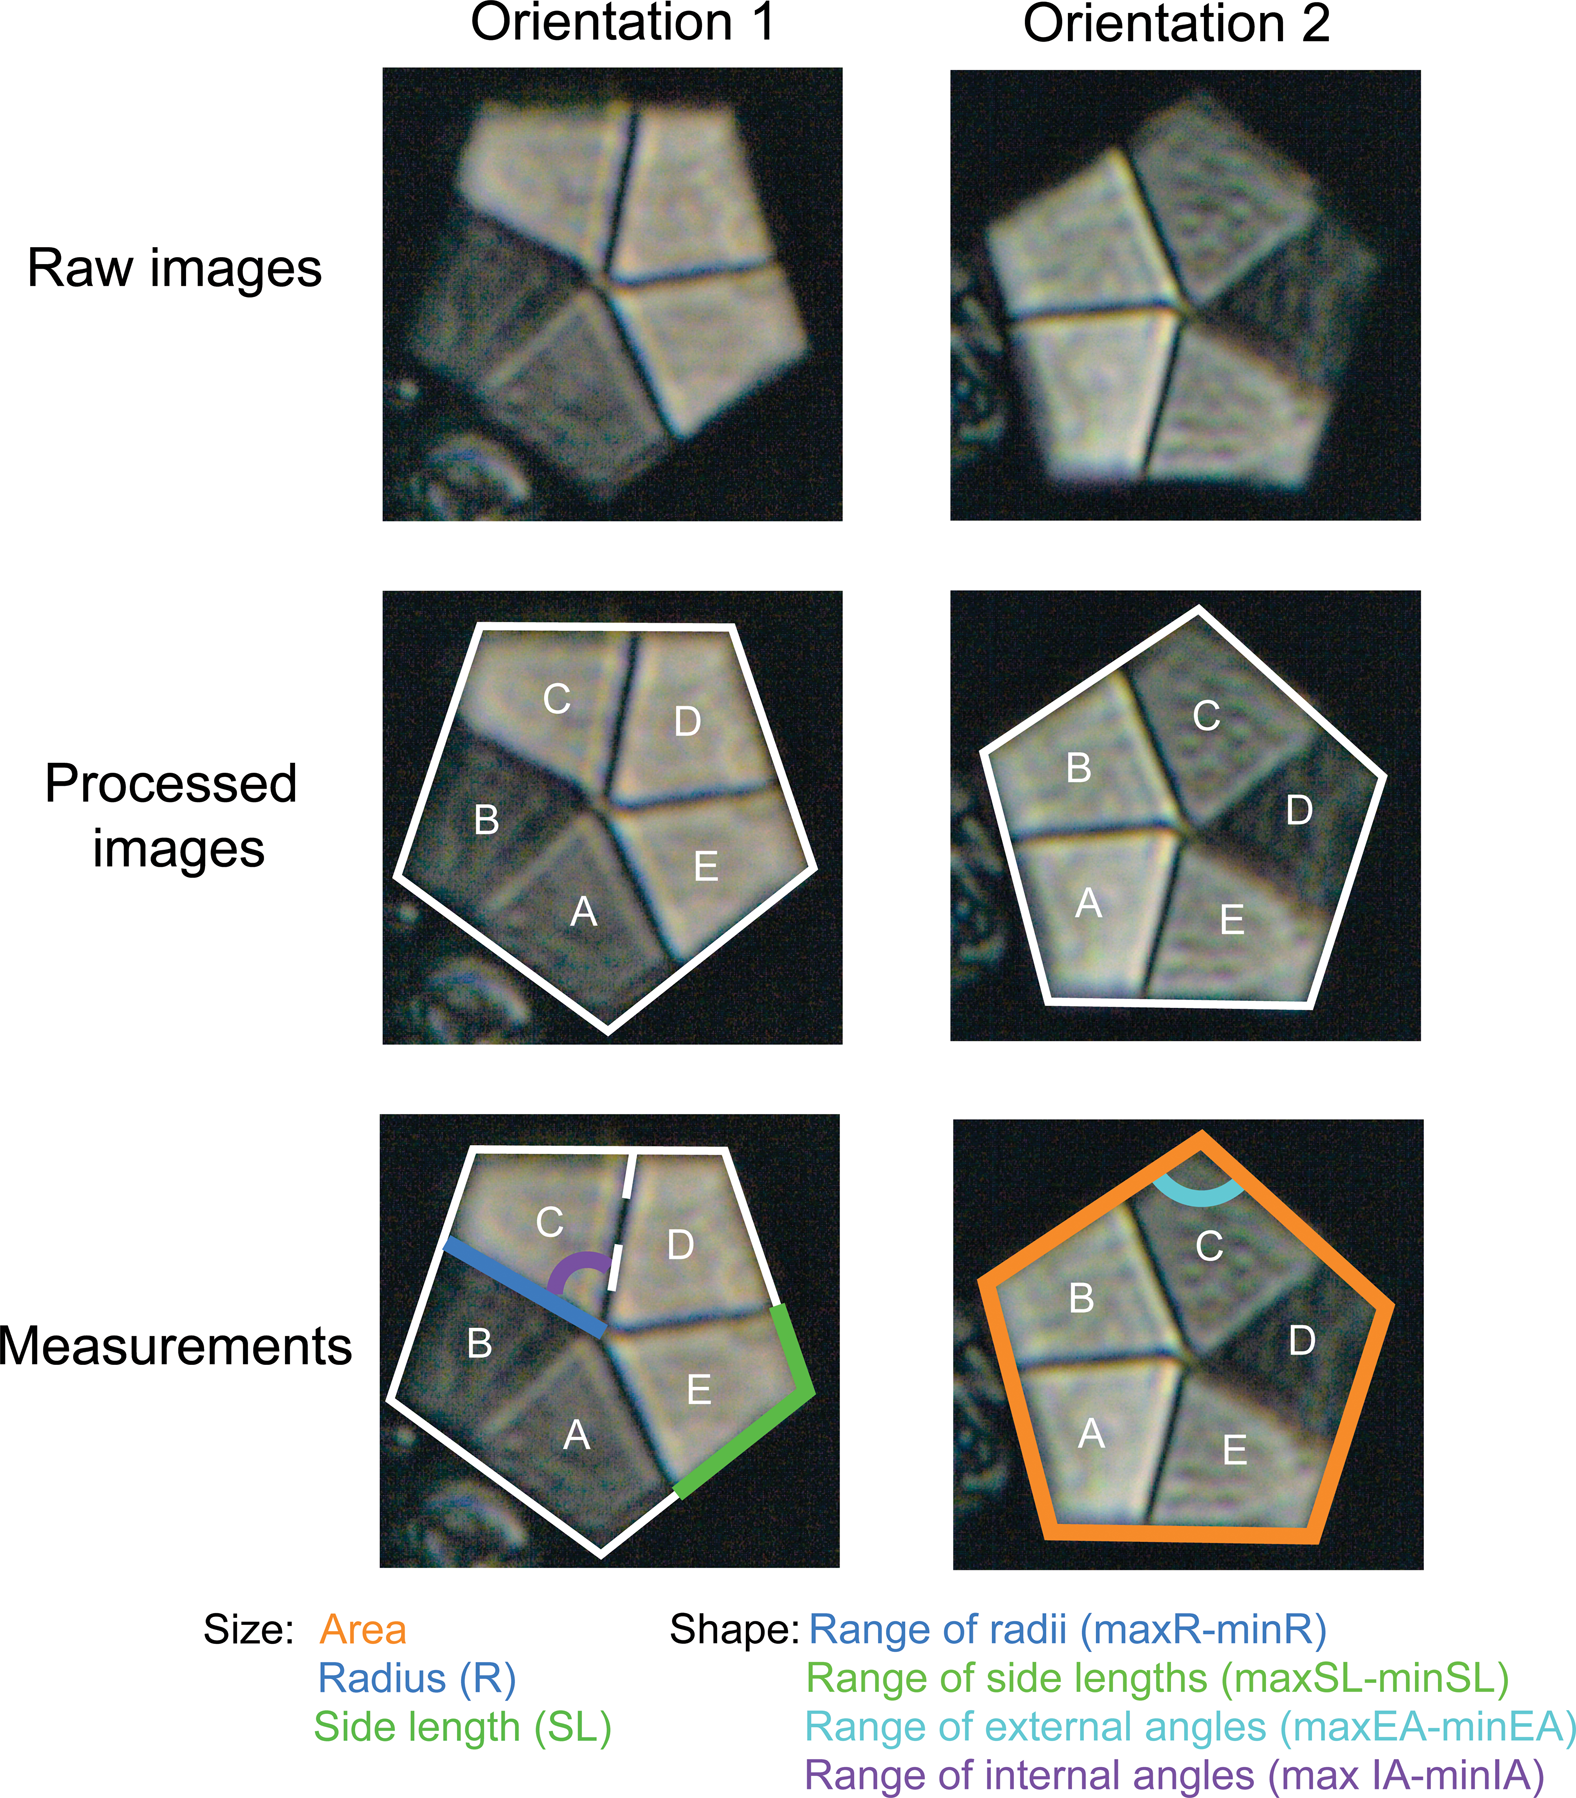
Light microscopy images showing the methods used to measure each Braarudosphaera pentalith. EA, external angles; IA, internal angles. See text for details.
Although Braarudosphaera is alive (albeit rare) in the modern ocean, its (paleo)ecological affinities are uncertain. Due to its occurrence in modern coastal regions and absence in open-ocean (pelagic) systems, it is generally interpreted as being well adapted to cold, low-salinity, and high-nutrient surface waters (e.g., Gran and Braarud Reference Gran and Braarud1935; Bukry Reference Bukry1974; Perch-Nielsen Reference Perch-Nielsen, Bolli, Sanders and Perch-Nielsen1985). However, living Braarudosphaera specimens have also been observed in the warm, high-salinity surface waters that characterize the Persian Gulf (Martini Reference Martini1967). Furthermore, throughout Earth's history, Braarudosphaera has periodically formed temporally and spatially restricted “blooms” in hemipelagic/pelagic environments that were not characterized by cold, low-salinity conditions, most notably at the K/Pg boundary in the Gulf of Mexico and Tethys Ocean (e.g., Lamolda et al. Reference Lamolda, Melinte and Kaiho2005, Reference Lamolda, Melinte-Dobrinescu and Kaiho2016; Fornaciari et al. Reference Fornaciari, Giusberti, Luciani, Tateo, Agnini, Backman, Oddone and Rio2007; Jones et al. Reference Jones, Lowery and Bralower2019), in the early/middle Oligocene of the South Atlantic (e.g., Kelly et al. Reference Kelly, Norris and Zachos2003; Liebrand et al. Reference Liebrand, Raffi, Fraguas, Laxenaire, Bosmans, Hilgen and Wilson2018), and the Plio-Pleistocene transition in the Mediterranean (e.g., Müller Reference Müller1973, Reference Müller, Montadert and Roberts1979; Stradner Reference Stradner1973). This indicates that Braarudosphaera is either tolerant of a wide range of temperature and salinity profiles, and/or that its distribution and abundance is predominantly controlled by a different environmental factor, such as stratification of the water column (Liebrand et al. Reference Liebrand, Raffi, Fraguas, Laxenaire, Bosmans, Hilgen and Wilson2018) or nutrient availability. In addition to its uncertain ecological preferences, there is still some debate as to whether Braarudosphaera is motile (Hagino et al. Reference Hagino, Tomioka, Young, Takano, Onuma and Horiguchi2016) or instead represents the nonmotile or cyst stage of an otherwise motile, non-calcifying haptophyte (Billard and Inouye Reference Billard, Inouye, Thierstein and Young2004; Hagino et al. Reference Hagino, Onuma, Kawachi and Horiguchi2013; Thompson et al. Reference Thompson, Carter, Turk-Kubo, Malfatti, Azam and Zehr2014; Liebrand et al. Reference Liebrand, Raffi, Fraguas, Laxenaire, Bosmans, Hilgen and Wilson2018). In the latter case, Braarudosphaera “oozes” could be indicative of detrimental environmental conditions that often drives encystment in cyst-forming organisms (e.g., dinoflagellates; Bravo and Figueroa Reference Bravo and Figueroa2014).
Previous work on the cell architecture of modern and fossil coccolithophores shows that morphometry is often related to physiology, as in some species, larger cells with more coccoliths become dominant under suboptimal environmental conditions due to slowed growth rates (Gibbs et al. Reference Gibbs, Poulton, Bown, Daniels, Hopkins, Young, Jones, Thiemann, O'Dea and Newsam2013, Reference Gibbs, Sheward, Bown, Poulton and Alvarez2018; Sheward et al. Reference Sheward, Poulton, Gibbs, Daniels and Bown2017). However, it is uncertain whether or not Braarudosphaera responds in the same way as other coccolithophores, because it calcifies extracellularly and does not produce coccoliths. One previous study that examined turnover in calcareous nannoplankton assemblage composition during the Paleocene–Eocene thermal maximum (PETM; ~56 Ma), found that Braarudosphaera became rarer, or even temporarily disappeared, at the onset of this transient warming (hyperthermal) event (Gibbs et al. Reference Gibbs, Bown, Ridgwell, Young, Poulton and O'Dea2016). These results suggest that Braarudosphaera is either not physiologically tolerant of higher temperatures or not ecologically competitive in such environments.
In addition, differences in the size and shape of coccoliths are traditionally used in nannoplankton taxonomy as a means of differentiating between morphotypes, species, or subspecies (e.g., Perch-Nielsen Reference Perch-Nielsen, Bolli, Sanders and Perch-Nielsen1985; Bown Reference Bown1998; Young et al. Reference Young, Geisen, Cros, Kleijne, Sprengel, Probert and Østergaard2003). Studies of modern Braarudosphaera suggest that cells with different pentalith sizes correspond to distinct morphotypes, or potentially even represent several cryptic species. The geographic distribution of these morphotypes appears to be unrelated to different environmental conditions (Takano et al. Reference Takano, Hagino, Tanaka, Horiguchi and Okada2006; Hagino et al. Reference Hagino, Takano and Horiguchi2009). Considerably less work has been done on changes in Braarudosphaera size in the fossil record, although one recent study indicates that a larger morphotype increased in abundance during the late Danian warming event (Criscione et al. Reference Criscione, Bord, Godfrey and Aubry2017). Thus, the rapid evolution of different Braarudosphaera morphotypes and/or species might explain their ability to survive, adapt, and proliferate during periods of environmental and ecological perturbation, which led to the continued success of their lineage compared with most “typical” nannoplankton genera.
To test this hypothesis, we present new Braarudosphaera morphometric data from three K/Pg sites: two in the Gulf of Mexico (the Chicxulub impact crater and Brazos River, Texas) and one in the Tethys Ocean (Agost, Spain), all of which are areas characterized by extensive Braarudosphaera blooms following the K/Pg impact. Our goal is to use these data to elucidate how the morphometry of a successful K/Pg survivor evolved during a prolonged interval of environmental and ecological change.
Materials and Methods
Study Sites
Sediment samples from the Chicxulub impact crater (Site M0077) were recovered during the joint International Ocean Discovery Program and International Continental Scientific Drilling Program (IODP-ICDP) Expedition 364, which provided almost 9 m of early Paleocene (Danian) sediments for morphometric analyses. A previous study of Site M0077 (Jones et al. Reference Jones, Lowery and Bralower2019) showed that Braarudosphaera had a continuous occurrence for at least 3 Myr following the K/Pg impact at Chicxulub and formed at least one high-dominance acme. An age model based on planktic foraminiferal biostratigraphy (Jones et al. Reference Jones, Lowery and Bralower2019) indicates that although the Danian record at Chicxulub is condensed, it is also stratigraphically complete, providing a unique opportunity to examine both short- and long-term morphometric variation within a single nannoplankton genus following the mass extinction event.
To determine whether changes in Braarudosphaera size or shape occurred on a regional scale, we also conducted morphometric analyses on samples from the Cottonmouth Creek and Frost Bluff outcrops near Brazos River, Texas. Nannoplankton absolute abundance counts (Schueth Reference Schueth2009) showed that Braarudosphaera was present throughout the measured section (0.10–3.55 m above the K/Pg boundary at Cottonmouth Creek and 3.7–10.1 m above at Frost Bluff) and is particularly abundant during the earliest Danian (from ~0.1 to 0.9 m above the K/Pg boundary). The Brazos River sediments were deposited in a more neritic setting (~50–100 m paleo–water depth; Vellekoop et al. Reference Vellekoop, Sluijs, Smit, Schouten, Weijers, Damsté and Brinkhuis2014) than those in the Chicxulub impact crater (~600 m paleo–water depth), which allows us to compare morphometric data from two different marine environments (i.e., neritic vs. hemipelagic) within the same ocean basin.
In addition to its dominance in the Gulf of Mexico, Braarudosphaera is also observed in high abundances at various sites in the Tethys Ocean. One such site is the classic K/Pg section in Agost, Spain; an outer-shelf/inner-slope site with a 200–300 m paleo–water depth (Molina et al. Reference Molina, Alegret, Arenillas and Arz2005; Lamolda et al. Reference Lamolda, Melinte-Dobrinescu and Kaiho2016). The samples used for morphometric analyses span a stratigraphic interval from ~0.5 m below to 4.9 m above the K/Pg boundary.
Age Models
Chicxulub
The age model for Site M0077 is based on high-resolution planktic foraminiferal biostratigraphy (Jones et al. Reference Jones, Lowery and Bralower2019) using the biozones of Berggren and Pearson (Reference Berggren and Pearson2005), which were calibrated to the Geological Time Scale 2012 (Gradstein et al. Reference Gradstein, Ogg, Schmitz and Ogg2012) by Wade et al. (Reference Wade, Pearson, Berggren and Pälike2011). Ages were then estimated for each sample assuming constant sedimentation rates within each biozone. Age estimates were not calculated for the top seven samples (609.74– 607.61 m below seafloor [mbsf]) due to uncertainty in the placement of the P3 biozone and the presence of a series of stacked unconformities at the top of the Paleocene (Gulick et al. Reference Gulick, Morgan, Mellett and Green2017).
Agost
For consistent stratigraphic correlation between sites, the planktic foraminiferal biozones of Berggren and Pearson (Reference Berggren and Pearson2005) as modified by Wade et al. (Reference Wade, Pearson, Berggren and Pälike2011) were also used to create the Agost age model. Although these biozone boundaries were not recorded in Molina et al. (Reference Molina, Alegret, Arenillas and Arz2005), the samples containing the first and last occurrences of the required marker taxa were noted and used to determine the base of each biozone. Due to less intensive sampling of the Agost outcrop compared with the Chicxulub cores, the age model is of a lower resolution and therefore not as well constrained. However, the Agost section encompasses most of the same time interval (between <63.9 and 66.00 Ma) as Site M0077 (<62.3 to 65.84 Ma), allowing reasonable temporal comparison of morphometric data between the different regions.
Cottonmouth Creek and Frost Bluff Outcrops, Brazos River
The age model for the Cottonmouth Creek outcrop is more difficult to interpret due to differing placements of the K/Pg boundary and the use of different planktic foraminiferal biozonation schemes within the literature (e.g., Keller Reference Keller1989; Prauss Reference Prauss2009; Vellekoop et al. Reference Vellekoop, Sluijs, Smit, Schouten, Weijers, Damsté and Brinkhuis2014). To combat this, Schueth (Reference Schueth2009) added microfossil datums to a composite section, created using the orbital stratigraphy for Shatsky Rise (central Pacific), and Walvis Ridge (South Atlantic) (Westerhold et al. Reference Westerhold, Röhl, Raffi, Fornaciari, Monechi, Reale, Bowles and Evans2008). Using this, the placement of the biozone bases (using the planktic foraminiferal datums of Berggren and Pearson Reference Berggren and Pearson2005) are: 0.34 m above the K/Pg boundary (Pα), 1.25 m above the K/Pg boundary (P1a), and 2.2 m above the K/Pg boundary (P1b). The base of the nearby Frost Bluff outcrop overlaps stratigraphically with the top of the Cottonmouth Creek section (Schueth Reference Schueth2009) and lies completely within the P1c biozone (63.9 to 62.6 Ma; D'Agostino and Yancey Reference D'Agostino and Yancey1996). This makes the Cottonmouth Creek section less expanded than the Agost section, which is puzzling, considering Brazos River represents a more neritic setting with presumably higher sedimentation rates.
A previous study has reported that a transgressive surface exists near the top of the P1a biozone at the Cottonmouth Creek outcrop (Prauss Reference Prauss2009), which may suggest the presence of a hiatus ~2.2 m above the boundary; a feature that is also observed in local drill cores (Schulte et al. Reference Schulte, Speijer, Mai and Kontny2006). In addition, MacLeod and Keller (Reference MacLeod and Keller1991) indicated that there may be a further stratigraphic hiatus lasting from between 80 and 150 kyr within the upper part of Pα at Cottonmouth Creek (Hansen et al. Reference Hansen, Farrell and Upshaw1993). The potential presence of at least two erosional surfaces within this outcrop indicates that the early Danian of the Cottonmouth Creek section is stratigraphically complex and possibly incomplete, leading to the creation of a poorly constrained and unreliable age model. For this reason, any inter-site comparisons made using the Brazos River data will be done with caution.
Data Collection
Smear slides for each site were made using the standard techniques outlined in Bown (Reference Bown1998) and examined under a Zeiss cross-polarized light microscope at 1600× magnification. Slides were examined, and morphometric data of Braarudosphaera pentaliths were collected, at a ~50 cm sampling interval (616.34–607.61 mbsf) for Chicxulub and at a ~25 cm interval for Brazos River, with increased sampling intensity during the earliest Danian Braarudosphaera acme (616.34–614.13 mbsf, Chicxulub; 0–1.15 m above the K/Pg boundary, Brazos River). All available samples from Agost (0.45 m below to 4.9 m above the boundary) were examined at a sampling resolution of ~20 cm up to a stratigraphic height of 2.46 m above the boundary. Above this the sampling resolution dropped to every ~100–150 cm due to decreased sample availability.
Every specimen of Braarudosphaera encountered along a transect was imaged until a total of at least 40 specimens for each sample was reached. If 40 Braarudosphaera specimens were not encountered along one transect, a second transect was started two fields of view above or below the original transect to avoid repeat imaging of the same specimens. At least two, and as many as nine images were taken of each specimen to help improve the reliability of the measurements and to take into account differences in polarized light extinction angles and the error associated with the measurement of pentaliths not lying flat on the slide. The image files were then loaded into ImageJ, where the perimeter of each pentalith was outlined, and each trapezoidal element was designated an arbitrary letter from A to E (Fig. 1). The purpose of this labeling scheme was simply to ensure the consistency of measurements between different images of the same specimen and does not have any other ecological or paleobiological significance.
After images were labeled, a variety of morphometric parameters were measured using the ObjectJ macro in ImageJ (Fig. 1). Previous studies on Braarudosphaera morphometry have used the best-preserved element side length and/or the best-preserved element radius as size parameters (e.g., Takano et al. Reference Takano, Hagino, Tanaka, Horiguchi and Okada2006; Hagino et al. Reference Hagino, Takano and Horiguchi2009; Criscione et al. Reference Criscione, Bord, Godfrey and Aubry2017). We follow the same approach in this study, but also include the total pentalith area as an additional size metric. As well as size, it is probable that pentalith shape also varies between different Braarudosphaera morphotypes and/or species; however, this has never been investigated. For this reason, we also devised some new “shape” metrics that document changes in pentalith regularity (i.e., deviation from a regular pentagon). To calculate these metrics, we measured the radius, side length, external angle, and internal angle for every element of each pentalith. Because all angles and side lengths are equal within a regular pentagon, we then found the range for each shape variable (i.e., the difference between the maximum and minimum value for each parameter), with lower values closer to 0 representing a more regular pentagon. Because the range of radii and range of side lengths are also a function of size, larger pentaliths are likely to record higher range values. As we wanted these variables to be independent of size, we divided the range of radii and range of side-length values by the best radius length and best side length, respectively, for each specimen. The same normalization was not applied to the range of external and internal angles, as these parameters should theoretically be unaffected by pentalith size. This detailed approach led to the measurement of 3166 Braarudosphaera pentaliths from 71 samples across the three sites.
Statistical Analyses
To improve the reliability of our measurements, we found the mean and standard deviation of the pentalith area, radius, side length, range of radii, range of side lengths, range of external angles, and range of internal angles for every specimen using data from multiple images. Because choosing the best-preserved radius and side length is subjective, we then used the radius and associated side length (A through E) with the lowest standard deviation in our statistical analyses.
To determine whether any of the size or shape parameters changed through time, we found the mean, minimum, and maximum values for each parameter in all samples. In addition, we analyzed the amount of morphometric variability within a sample by bootstrapping the morphometric averages based on 1000 replicates, which were then used to estimate the 95% confidence intervals. The mean, bootstrapped confidence intervals for the mean and the maximum and minimum values for each parameter were then plotted against depth (Chicxulub) or height above the K/Pg boundary (Brazos River and Agost).
In addition to line graphs, we conducted a principal components analysis (PCA) and two-way cluster analysis to compare the different sites to one other. Both of these multivariate approaches are useful in helping visualize which morphometric parameters are most important in driving the variation between samples, especially in extensive datasets such as these. We did not normalize any of our variables before conducting the PCA, as the prcomp function in the statistical program R has an argument that allows the user to scale and center the input matrix. This sets all morphometric variables to have a mean of 0 and a standard deviation of 1, with the resulting distance matrix being the correlation matrix that allows measurements with different units and scales to be compared. For the two-way cluster analysis, we used the average morphometric values for each sample rather than for each specimen so that the results could be more easily interpreted. The data matrix was then standardized by dividing each value by the column maximum, which allowed morphometric variables with different scales and units to be directly compared. Finally, samples were grouped into clusters using Euclidean distances and agglomerative hierarchal clustering (complete-linkage method).
Results
During data collection we measured 3166 Braarudosphaera pentaliths, which included 1438 specimens from the Chicxulub impact crater, 944 specimens from Brazos River, and 784 specimens from Agost. Our results reveal a wide range of pentalith sizes (e.g., side-length values of 2.45–13.80 μm) and shapes (e.g., range of external angles [REA] between 0.96° and 41.00°) during the early Danian. In general, Braarudosphaera pentaliths from Agost are relatively small and irregular in shape (average side-length value of 5.31 μm; average REA of 14.19°), pentaliths from Brazos River are relatively small and regular in shape (average side-length value of 5.28 μm; average REA of 9.62°), and pentaliths from Chicxulub are relatively large and irregular in shape (average side-length value of 6.29 μm; average REA of 14.16°).
The PCA conducted on specimens from all the sites (Fig. 2), reveals that size, equally represented by all parameters (pentalith area, element radius, and side length; Fig. 1), has the biggest control on morphometric variability in Braarudosphaera pentaliths (PC 1 accounts for 49% of the explained variance). Shape parameters (range of radii, range of side lengths, range of external angles, and range of internal angles; Fig. 1) have a secondary control, with the range of external angles and the range of internal angles showing the strongest correlations along PC 2 (accounts for 28% of the explained variance). The range of radii and range of side lengths, although predominantly correlated with PC 2, have a greater influence on PC 1 than the other shape variables due to the dependence of these metrics on size (despite normalization). Overall, the size and shape parameters measured account for >75% of the explained variance between pentaliths.
Principal components analysis (PCA) for all Braarudosphaera pentaliths measured, with each specimen assigned a symbol and color according to the site at which it was observed. The percentage of variance explained by each axis is also noted. The superimposed vectors indicate the axis along which each of our size and shape parameters are best correlated, with the length of the vector representing the strength of the relationship. R, radius; SL, side length; A, area; RR, range of radii; RSL, range of side lengths; REA, range of external angles; and RIA, range of internal angles. (Color online.)

The PCA scores indicate that Braarudosphaera specimens from Agost, Brazos River, and Chicxulub overlap in morphospace (Fig. 2). This suggests that the same morphotypes, or closely related ones, are present at all three sites. Despite this, a few inter-site differences can be recognized. First, specimens from Brazos River occupy a comparatively restricted area of morphospace along both PC 1 and PC 2 compared with specimens from Agost and Chicxulub, as they are uniformly smaller in size and more regular in shape. In contrast, specimens from Agost show more variation along PC 2 (i.e., are uniformly smaller, but range in shape from more to less regular), and those from Chicxulub are more spread out along both PC 1 and PC 2, indicating a larger range of pentalith sizes and shapes (Fig. 2).
These trends are supported by the two-way cluster analysis, run using the average standardized size and shape values for each sample (Fig. 3). This analysis resulted in the formation of four major clusters that contained higher abundances of: (1) large, irregular specimens (predominantly Chicxulub samples); (2) relatively small, irregular pentaliths (predominantly Agost samples); (3) small, more regularly shaped pentaliths (all from Brazos River); and (4) relatively small, comparatively regular pentaliths (predominantly composed of the earliest Danian samples from Chicxulub).
Results of the two-way cluster analysis run on the average morphometric values for the 71 samples. Each of the different morphometric parameters was first divided by the maximum value for that parameter, meaning that the darker purple shades represent values that are closer to the maximum value observed across all sites. Therefore, for size, larger pentaliths are represented by darker purple colors, and for shape, darker shades represent pentaliths, which are more irregular. Each of the samples on the left-hand dendogram is colored by site.

Because each of the size parameters is equally well correlated with PC 1 (Fig. 2) and shows an almost identical trend through time (Supplementary Fig. 1), we chose to examine only one of the traits (pentalith area) in more detail. All the shape parameters also show similar trends through time (Supplementary Fig. 2). As the range of external angles is completely independent of pentalith size and showed the strongest, most significant correlation along PC 2 (Fig. 2), we chose this parameter as the representative metric for pentalith shape. Therefore, for simplicity, all future references to pentalith size and shape will correspond to the “pentalith area” and “range of external angles” metrics, respectively. For our shape metric, we interpret increased “regularity” as lower numbers closer to 0, which represents a regular pentagon with interior angles of approximately 108°. In addition, we define “morphometric variability” as the 95% confidence intervals for the bootstrapped means, with smaller confidence intervals corresponding to less morphometric variability.
Chicxulub
The first sample from Site M0077 that has a sufficient number of Braarudosphaera pentaliths for morphometric analyses is at 616.34 mbsf, ~150 kyr after the K/Pg impact (65.85 Ma; Fig. 4; also see updated age model in Jones et al. [2019] and C. Lowery, C., H. Jones, T. J. Bralower, L. P. Cruz, C. Gebhardt, M. Whalen, E. Chenot, J. Smit, M. M. Purkey, K. Choumiline, I. Arenillas, J. A. Arz, F. Garcia, M. Ferrand, S. P. S. Gulick, and J. V. Morgan unpublished data [hereafter Lowery et al. unpublished data]). Pentaliths within this sample have an average area of 65 μm2, a maximum area of 120 μm2, and are highly irregular in shape (Fig. 4A–D). From 616.34 to 615.70 mbsf (~65.85 to 65.5 Ma), the average and maximum sizes of pentaliths remain fairly constant (Fig. 4A, B). External angles fluctuate greatly around an average of 14° within the same depth interval (Fig. 4D). Overall, the 95% confidence intervals for the bootstrapped size and shape means do not deviate much from the observed average (Fig. 4B, D), indicating that most pentaliths have a similar morphometry.
Line graphs showing changes in pentalith area (A, B) and the range of external angles (C, D) with depth at Chicxulub (IODP Site M0077). The planktic foraminiferal biozones are displayed to the left, with the estimated ages for the biozone bases noted. In each panel, the mean values are represented by the black lines, the bootstrapped 95% confidence intervals for the mean are in blue, and the minimum and the maximum values are in purple. The red band shows a “dwarfing” event based on our morphometric data. (Color online.)

Between 615.7 and 615.48 mbsf (~65.5 to 65.35 Ma), the maximum pentalith size increases sharply from ~130 to 250 μm2, driving an elevation in the mean value (Fig. 4A). During the same interval, shape regularity also increases (Fig. 4C), although the range of external angles within a pentalith reaches its minimum value (10°) ~350 kyr after they reach their maximum size (average value of ~85 μm2; Fig. 4A). The confidence intervals for the bootstrapped means remain close to the observed size and shape averages, suggesting that there was still very little morphometric variation.
The observed increase in size is transient, with pentalith area gradually decreasing to the site minimum (average value of ~45 μm2) between 615.26 and 614.3 mbsf (~65.26 to 64.80 Ma; Fig. 4A). In addition, the maximum pentalith area decreases from 250 to 120 μm2 between 615.26 and 615.15 mbsf and remains low until 614.13 mbsf. Interestingly, the smallest pentaliths are also associated with a peak in irregularity (Fig. 4C, D).
Between 614.30 and 612.02 mbsf (~64.80 to 63.70 Ma), both the maximum and average area of pentaliths more than double, accompanied by an increase in irregularity and morphometric variability. From 612.02 mbsf to the top of the record (~63.70 to <62.30 Ma) pentalith size, shape, and morphometric variability remain high, with semi-regular fluctuations occurring every ~500 kyr.
Brazos River
The average and maximum sizes of Braarudosphaera pentaliths at Brazos River (~40–50 μm2 and 200 μm2, respectively) are much smaller than those at Chicxulub (Fig. 5A, B), despite coming from the same ocean basin. In addition, the shape of the pentaliths is more regular, as displayed by the range of external angle measurements, and there is less morphometric variability (Fig. 5B). Pentalith shape is most irregular at the base of the analyzed section and decreases steadily up to ~1.9 m above the K/Pg boundary (ages not specified due to uncertainty). Pentaliths then remain consistently regular until the top of the section.
Line graphs showing changes in pentalith area (A, B) and the range of external angles (C, D) with height above the Cretaceous/Paleogene (K/Pg) boundary at Brazos River, Texas. The planktic foraminiferal biozones are displayed to the left, with the estimated ages for the biozone bases noted. In each panel, the mean values are represented by the black lines, the bootstrapped 95% confidence intervals for the mean are in blue, and the minimum and the maximum values are in purple.

The minimum, maximum, and average sizes also remain almost constant through time. The only exception is a sharp, transient increase in the average and maximum sizes (similar to that observed at Chicxulub) from ~1.8 to 2.8 m above the K/Pg boundary, before decreasing back down to lower values from 2.8 to 3.5 m above the boundary. Unlike at Chicxulub, where increased size is accompanied by enhanced regularity, the transient increase in pentalith area at Brazos River is associated with enhanced irregularity. Furthermore, the subsequent size decrease at Chicxulub leads to a pentalith size minimum, whereas at Brazos, pentaliths do not become any smaller than they were before the size increase.
Agost
Pentaliths from Agost in the Tethys Ocean are a similar size to those observed at Brazos River but are generally more irregular in shape (Fig. 6). Braarudosphaera is present at very low abundances before the mass extinction, and one sample from below the K/Pg boundary contained a sufficient number of pentaliths for morphometric analyses. Comparison of the pentaliths from this sample and the earliest Paleocene sample do not reveal any significant changes in size across the extinction event, although shape irregularity was higher and morphometric variability lower in the early Paleocene compared with the latest Cretaceous.
Line graphs showing changes in pentalith area (A, B) and the range of external angles (C, D) with height above the Cretaceous/Paleogene (K/Pg) boundary at Agost, Spain. The planktic foraminiferal biozones are displayed to the left, with the estimated ages for the biozone bases noted. In each panel, the mean values are represented by the black lines, the bootstrapped 95% confidence intervals for the mean are in blue, and the minimum and the maximum values are in purple. The red bands show the positions of two Braarudosphaera “dwarfing” events based on our morphometric data. (Color online.)

The record at Agost reveals two large, transient increases in pentalith size. The first of these occurs at ~18–20 cm above the boundary within the P0/Pα planktic foraminiferal biozone (66.0 to 65.72 Ma) and is characterized by a doubling in the maximum pentalith size, a large increase in the average size, and a significant increase in regularity (Fig. 6). Size subsequently decreases rather rapidly to original values. These trends are reminiscent of those observed at Chicxulub (Fig. 4A, B); however, they are not stratigraphically equivalent. The second enlargement event occurs ~1.8 m above the K/Pg boundary near the top of the P1a planktic foraminiferal biozone (65.72 to 65.25 Ma). Here, the increase in pentalith area is not as large as during the earlier morphometric transition but also leads to a subsequent size decrease back down to initial values (1.8 to 2.1 m above the K/Pg boundary). Unlike the earlier event, the pentalith shape becomes less, rather than more regular. Immediately following this decrease in size, the maximum pentalith area begins to increase gradually to the top of the analyzed section, as does the size variability based on the bootstrapped confidence intervals. The slight increase is size is also accompanied by a relatively minor increase (or stabilization) in regularity.
Discussion
Our results reveal several transient changes in the size and shape of Braarudosphaera pentaliths during the early Danian at Agost and Chicxulub, but relatively minor morphometric variation at Brazos River. Here we explore the potential roles of environmental and ecological change, postdepositional processes, and evolution in driving these distinct trends.
The Effect of Postdepositional and Taphonomic Processes on Our Morphometric Record
As with most studies, the extent to which diagenetic processes such as cementation, dissolution, and recrystallization have affected our morphometric measurements is difficult to quantitively assess. The preservation state of Braarudosphaera pentaliths varies greatly by site, with Brazos River generally having moderately to well-preserved specimens (first-order white and gray birefringence colors), while Agost and Chicxulub have larger proportions of specimens that exhibit second-order birefringence colors. The higher-order birefringence colors at Agost and Chicxulub could be a result of either larger stacks of pentalith laminae or calcite overgrowth formed during diagenesis, both of which would increase the volume of calcite within each pentalith. However, the relative control of these variables on birefringence cannot be determined using our 2D images.
Pentalith preservation is poorest in the Chicxulub cores, which have been affected by cementation and pressure solution. The combination of these processes means that most specimens exhibit calcite overgrowth, and some others exhibit etching, deformation, or potential compaction. This could affect our measurements in two ways. First, calcite overgrowth would cause an increase in pentalith size and smooth corners to possibly make pentalith shapes appear more regular. Second, etching and compaction would likely increase pentalith irregularity. Because the preservation of all nannoplankton taxa (including the small, delicate boom–bust species) are uniformly poor throughout the studied Chicxulub cores, and calcite overgrowth qualitatively appears to affect both the smaller and larger Braarudosphaera pentaliths equally, we argue that the relative trends in our morphometric data are a primary, ecological signal, but that the absolute size, and especially shape, values may be affected by postdepositional processes.
Furthermore, it would be expected that diagenetically altered pentaliths would be harder to measure, and thus that the size and shape measurements would be inconsistent between different images of the same specimen. To test this, we found the standard deviation of the area for each specimen within a randomly chosen Chicxulub sample. We then produced cross plots of these standard deviation values against each of the shape metrics (range of radii, range of side lengths, range of external angles, and range of internal angles; Supplementary Fig. 3), as well as the average pentalith area as a metric for size. These cross plots show that there is no correlation between higher standard deviation values and increased pentalith irregularity in any of our shape metrics and that increased standard deviation values (normalized to the average area) are also not a function of pentalith size. We use this as further evidence that the observed morphometric trends primarily reflect original paleoecological responses, while diagenetic processes exert a secondary control that cannot be dismissed in interpretation.
Identifying the Cause of Morphometric Variation
Morphometric characters and traits are traditionally used in paleontology to differentiate between species and reconstruct phylogenetic relationships. For extant organisms, these morphometric analyses are combined with genetic studies to construct more robust phylogenetic trees (e.g., Takano et al. Reference Takano, Hagino, Tanaka, Horiguchi and Okada2006). To determine whether our size and shape measurements can be used to distinguish between different species or cryptic species of Braarudosphaera, we measured all light microscopy images of Braarudosphaera that were available on Mikrotax, as well as those in Hagino et al. (Reference Hagino, Takano and Horiguchi2009) and Criscione et al. (Reference Criscione, Bord, Godfrey and Aubry2017), for a total of 70 images. We then standardized the data by the column maximum and performed a two-way cluster analysis in R (gplots package), using a Euclidean distance measure and the total-linkage clustering method. The branches of the resulting dendrogram were then colored based on the documented species-level taxonomic classification.
Our results (Supplementary Fig. 4) show that different species cannot be easily differentiated using the morphometric characters (pentalith area, radius, side length, range of radii, range of side lengths, range of external angles, and range of internal angles) used in this study. As the images used in this analysis were limited and collated from various different sources, this difficulty can likely be partly attributed to sampling bias, as well as the differing taxonomic classifications used by different nannofossil workers. The latter is particularly likely, as a robust classification scheme that distinguishes between different Braarudosphaera species in the fossil record does not currently exist. In addition, it is probable that our cluster analysis was not able to resolve species-level relationships, as it only includes a limited number of continuous measurements and not the discrete measurements that are often particularly useful in differentiating between species. Regardless of the exact reason, this cluster analysis shows that we cannot confidently interpret changes in the size and shape of Braarudosphaera following the K/Pg boundary as representing changes in the abundance of morphologically distinct species or cryptic species.
Two other possible explanations for the morphometric variation observed in our Braarudosphaera data are the presence of different morphotypes and phenotypic plasticity. A morphotype is a subset of a species or a population that is morphologically distinct but cannot be robustly recognized as a separate taxonomic subspecies, group, or form (e.g., Huxley Reference Huxley1955). Although it is often unknown why different morphotypes exist, they are generally defined as being members of the same species that are uniquely adapted to a certain habitat or microhabitat. Such morphotypes could evolve through biological processes such as disruptive selection (e.g., Thoday and Boam Reference Thoday and Boam1959; Schluter Reference Schluter2000; Hendry et al. Reference Hendry, Huber, De Leon, Herrel and Podos2009), in which extreme morphometric values are favored over intermediate ones, or character displacement (e.g., Brown and Wilson Reference Brown and Wilson1956; Schluter Reference Schluter1988; Losos Reference Losos2000), in which two different morphotypes are able to exploit different niche space within the same habitat. Phenotypic plasticity refers to the ability of an organism to either temporarily or permanently adapt to environmental change (e.g., Schlichting Reference Schlichting1986; Price et al. Reference Price, Qvarnström and Irwin2003; West-Eberhard Reference West-Eberhard2008; Xue and Leibler Reference Xue and Leibler2018). Because the life span of a nannoplankton cell is on the order of days to weeks, and our time-averaged samples represent thousands to tens of thousands of years, it is not possible to assess the role of phenotypic plasticity in our fossil data. However, if Braarudosphaera was able to change its phenotype in response to the incredibly volatile environment following the K/Pg impact, phenotypic plasticity may explain how this genus survived the mass extinction event and thrived throughout the earliest Danian.
Changes in the size and cell architecture of calcareous nannoplankton have also been connected to physiological processes. Previous studies using both culturing experiments and the fossil record (e.g., Gibbs et al. Reference Gibbs, Poulton, Bown, Daniels, Hopkins, Young, Jones, Thiemann, O'Dea and Newsam2013, Reference Gibbs, Sheward, Bown, Poulton and Alvarez2018; Sheward et al. Reference Sheward, Poulton, Gibbs, Daniels and Bown2017) have revealed that the cell size of coccolithophore species decreases when experiencing optimal growth conditions, as the cells enter an exponential growth phase when they divide very rapidly. Because Braarudosphaera is an extracellular calcifier, not an intracellular calcifier like “typical” coccolithophores species, it is uncertain whether this genus responds in the same way to ecophysiological stress. However, the distinct decrease in Braarudosphaera abundance at the onset of the PETM (Gibbs et al. Reference Gibbs, Bown, Ridgwell, Young, Poulton and O'Dea2016) suggests that this taxon is not competitive at higher temperatures, which may affect its physiology and thus its cell size and architecture.
Because it is not possible to differentiate between Braarudosphaera species using our morphometric variables, and as evidence of phenotypic plasticity is difficult to detect in the fossil record, we conclude that trends in our size and shape data are most likely to reflect either: (1) changes in the dominant morphotype through time or (2) the physiological response of one morphotype to changes in environmental conditions. To differentiate between these two possible scenarios, we conducted further analyses to determine whether there were likely to be multiple distinct morphotypes represented in our dataset.
Identifying the Presence of Distinct Braarudosphaera Morphotypes Following the K/Pg Boundary
Morphotypes Based on Pentalith Side-length Measurements (Size)
To estimate how many distinct components (i.e., Braarudosphaera morphotypes) were likely to be present in our dataset, we used Gaussian mixture modeling following Criscione et al. (Reference Criscione, Bord, Godfrey and Aubry2017). To directly compare our data to those of Hagino et al. (Reference Hagino, Takano and Horiguchi2009) and Criscione et al. (Reference Criscione, Bord, Godfrey and Aubry2017), we ran our mixture models using only the pentalith side length, therefore only considering size and not shape. All of our mixture models were run using the mclust package in R, which uses an expectation maximization algorithm to return the most likely number of clusters present in a dataset, with more positive Bayesian information criterion (BIC) values corresponding to higher-likelihood solutions (Fraley and Raftery Reference Fraley and Raftery2002, Reference Fraley and Raftery2007; Fraley et al. Reference Fraley, Raftery, Murphy and Scrucca2012).
Our modeling results indicate that there were likely three different Braarudosphaera morphotypes present during the early Danian (BIC = −11,324.69; Fig. 7). These morphotype groupings have side-length values of ≤5.57 μm (Form 1), 5.57–8.90 μm (Form 2), and ≥8.90 μm (Form 3). All of the morphotypes are present to some extent at Agost, Brazos River, and Chicxulub; however, there are noticeable inter-site differences in the relative abundance of these distinct forms. Although Form 1 is the most dominant morphotype at both Agost and Brazos River, specimens at the lower end of the size distribution are more abundant at Agost than at Brazos River (Fig. 7). A four-component mixture model indicates that Form 1 might in fact consist of a smaller and larger variant (Form 1a and Form 1b, respectively; Supplementary Fig. 5), with Form 1a being more dominant at Agost and Form 1b being more dominant at Brazos River and Chicxulub. However, the four-component model solution (BIC = −11,343.86) has a lower likelihood value than the three-component one (BIC = −11,324.69), indicating that there are probably only three morphotypes present in our dataset. Nonetheless, the higher frequency of relatively large Form 1 specimens at Brazos River and Chicxulub compared with Agost, suggests that slightly larger morphotypes may have been better adapted to the prevailing paleoenvironmental and paleoceanographic conditions in the Gulf of Mexico. As pentalith preservation state is very different at each of our K/Pg sites (moderately to well preserved at Brazos River, moderately to poorly preserved at Agost, and poor to very poorly preserved at Chicxulub), we infer that the higher dominance of the larger morphotype at the Gulf of Mexico sites is primarily a real signal and not a product of diagenetic overgrowth.
Size-distribution histograms based on side length for each of our sites. Histograms are colored based on the morphotype groupings obtained using a three-component univariate Gaussian mixture model (Bayesian information criterion [BIC] = −11,324.69) in the mclust package in R. The images show representative examples of each morphotype (note differences in pentalith preservation between sites). All images were taken under cross-polarized light at 1600× magnification. The boxes above our size-distribution histograms show the modern Braarudosphaera morphotype designations of Hagino et al. (Reference Hagino, Takano and Horiguchi2009) (top) and the late Danian morphotype groupings of Criscione et al. (Reference Criscione, Bord, Godfrey and Aubry2017) (bottom). (Color online.)

In contrast with Agost and Brazos River, the most dominant morphotype at Chicxulub is Form 2, which makes up more than 50% of the total measured pentaliths. The largest morphotype, Form 3, is also only observed in significant frequencies at Chicxulub. Because the pentaliths from Chicxulub are generally more poorly preserved than those at either Agost or Brazos River, it is possible that diagenetic processes have caused these size differences. Alternatively, because we measured more pentaliths at Chicxulub and examined morphometric change over a longer time interval, it is possible that larger Braarudosphaera specimens did not evolve until later in the Danian during a period that was not captured in the Agost and Brazos River records.
Overall, the size distribution of Braarudosphaera pentaliths at the three K/Pg sites is very similar to that in the modern (Takano et al. Reference Takano, Hagino, Tanaka, Horiguchi and Okada2006; Hagino et al. Reference Hagino, Takano and Horiguchi2009), with some important exceptions. First, we do not observe any of the “Small” modern forms (<2.4 μm in side length) in our K/Pg record and record a higher frequency of larger pentalith sizes, including those that are larger than any form documented in the modern (Takano et al. Reference Takano, Hagino, Tanaka, Horiguchi and Okada2006; Hagino et al. Reference Hagino, Takano and Horiguchi2009; Aubry Reference Aubry2013). The increased size of fossil versus modern pentaliths has been previously recognized (e.g., Deflandre Reference Deflandre1950; Takano et al. Reference Takano, Hagino, Tanaka, Horiguchi and Okada2006; Criscione et al. Reference Criscione, Bord, Godfrey and Aubry2017) and suggests that larger Braarudosphaera morphotypes were more common in the fossil record, perhaps partly due to postdepositional processes. Second, at all three sites studied, we observed relatively high frequencies of Braarudosphaera pentaliths with sizes intermediate between the “Small” and “Intermediate A” forms of Hagino et al. (Reference Hagino, Takano and Horiguchi2009). This size range has since been observed in the modern (Fernando et al. Reference Fernando, Fernandez and Wiesner2013) but appears to be uncommon. Finally, although our morphotype designations are fairly similar to those of Hagino et al. (Reference Hagino, Takano and Horiguchi2009), there are some differences, especially at the lower end of the size distribution, as previously discussed. This may be a result of our study being relatively specimen rich (3166 pentaliths measured) compared with the modern study (181 pentaliths measured). Additionally, it is not necessarily assumed that 63- to 66-Myr-old morphotypes would be exactly equivalent to those observed in the modern, especially considering the extremely rapid evolutionary divergence rates of calcareous nannoplankton during the early Paleocene (e.g., Bown et al. Reference Bown, Lees, Young, Thierstein and Young2004). Therefore, it is actually quite remarkable that our fossil morphotype designations so closely resemble those of their modern descendants.
Despite measuring a comparable number of pentaliths to our study, the Criscione et al. (Reference Criscione, Bord, Godfrey and Aubry2017) study reports size distributions for Braarudosphaera morphotypes during the late Danian at Zumaia, Spain, that do not correspond well to our K/Pg morphotype designations (Fig. 7). These authors recognized two morphotypes (Forms X and Y), with the side-length value that separates them (~6.4 μm) falling within the size distribution of our Form 2 and not aligning with any of our morphotype “cutoffs.” The discrepancy between morphotype groupings in the early versus late Danian records is interesting, especially because the Criscione et al. (Reference Criscione, Bord, Godfrey and Aubry2017) study was conducted on late Danian samples from Zumaia (Spain), which is more temporally and geographically equivalent to the earliest Danian Agost section than the modern dataset. However, when the Agost and Zumaia size-distribution charts are directly compared, the frequency maximum occurs at a side-length value of ~4 μm in both records. Therefore, the differences in our morphotype designations are likely a result of the fact that >75% of the specimens we measured were from the Gulf of Mexico, and these specimens have relatively large pentalith sizes compared with those at Agost.
Morphotypes Based on All Measured Variables (Size and Shape)
Using only the side-length measurements in our mixture models may restrict the differentiation of morphotypes that have similar sizes but distinct shapes. For this reason, we ran a separate mixture model using all seven of our measured variables (pentalith area, radius, side length, range of radii, range of side lengths, range of external angles, and range of internal angles). The most likely solution returned eight potential morphotypes with a BIC value of −45,728. It is difficult to characterize different morphotype groupings in our multimodal mixture model using size and/or shape ranges, because each morphotype often has a large range of values in one or more of the measured variables, causing overlap between morphotypes with similar centroids. However, the scatter-plot matrix for our morphometric data (Supplementary Fig. 6) indicates that size and shape were both important in differentiating between potential morphotypes.
To explore the characteristics of each of these eight morphotypes further, we calculated the average side length and average range of external angles for each potential morphotype grouping, as these two variables showed more clearly differentiated centroids in the matrix scatter plots (Supplementary Fig. 6). The average side-length values revealed the presence of two relatively small morphotypes with average side lengths of 4.25 and 4.82 μm (Form A1 and Form A2, respectively; Fig. 8), two morphotypes that were intermediate in size (Form B1 and Form B2; average side lengths of 5.36 and 5.44 μm, respectively), two large morphotypes (Form C and Form D; average side lengths of 5.80 and 6.33 μm, respectively), and two very large morphotypes (Form E and Form F; average side lengths of 7.10 and 9.73 μm, respectively) (Fig. 8). The small and intermediate size groupings each contain a form that more closely resembles a regular pentagon (Form A1 and Form B1; average external angle ranges of 6.60° and 10.30°, respectively), and one that is more irregular in shape (Form A2 and Form B2; average external angle ranges of 16.84° and 20.87°, respectively). Form A2 and Form B2 are very rare at Brazos River, where pentalith preservation is significantly better than at either Chicxulub or Agost. Therefore, we suggest that the irregular morphotypes (Form A2 and Form B2) likely represent diagenetically altered versions of the similarly sized, relatively regular pentaliths (Form A1 and Form B1), which are the dominant morphotypes at Brazos River. In contrast, the two large morphotypes (Form C and Form D) have very similar shapes (average range of external angles of 10.74° and 12.72°, respectively) and are found in similar abundances at all three sites. For this reason, we do not consider either of the large forms to be diagenetic morphotypes. Instead, separation of these two morphotype groupings appears to have been primarily driven by slight differences in size. The very large morphotypes (Form E and Form F) also have similar shape values (average range of external angles of 14.05° and 14.84°, respectively), thus supporting that size is the best way of distinguishing between morphotypes, especially for larger pentaliths.
Diagram showing the relative sizes and shapes of the eight Braarudosphaera morphotypes, characterized using a multivariate Gaussian mixture model using the mclust package in R. Images show representative specimens of each morphotype at all three sites (left to right for each form: Agost, Brazos River, Chicxulub). Note inter-site differences in pentalith preservation. All images are to scale and were taken under cross-polarized light at 1600× magnification.

Overall, the dominant Braarudosphaera morphotype is small and irregular at Agost (Form A2), intermediate in size and regular in shape at Brazos River (Form B1), and large/very large and irregular at Chicxulub (Form D/Form E). As stated earlier, it is likely that the relatively high abundances of irregularly shaped pentaliths at Agost and Chicxulub are indicative of the poorer preservation at these sites and thus represent a taphonomic signal. However, pentalith size is not expected to be as affected by diagenetic processes as pentalith shape. Therefore, as the morphotypes at each site can be distinguished from one another using size measurements alone, inter-site differences in the dominant morphotypes are likely not solely a diagenetic signal. Instead, these differences suggest that each Braarudosphaera morphotype was well adapted to a unique suite of paleoceanographic conditions (temperature, salinity, nutrient availability, etc.). The globally heterogeneous recovery of planktic ecosystems and marine biological pump efficiency following the K/Pg impact likely caused surface ocean environments to be very different at sites proximal (Chicxulub and Brazos River) and distal (Agost) from the K/Pg impact crater. These geographic controls, coupled with the unique paleoceanographic and paleoenvironmental conditions that characterize hemipelagic (Chicxulub) and continental shelf/slope settings (Agost and Brazos River), likely led to the dominance of the observed morphotypes at each of the sites. Thus, the survival of Braarudosphaera at the K/Pg boundary and its continued success can at least be partially attributed to the presence of different morphotypes that had distinct ecological preferences. The presence of these morphotypes suggests that Braarudosphaera was well adapted to a wide range of surface ocean environments, allowing it to thrive where other calcareous nannoplankton taxa could not.
The morphotypes that we recognized using all of our measured size and shape variables were primarily separated by pentalith size, supporting earlier findings that this is the most important attribute in distinguishing between distinct Braarudosphaera morphotypes (e.g., Hagino et al. Reference Hagino, Takano and Horiguchi2009; Criscione et al. Reference Criscione, Bord, Godfrey and Aubry2017). However, shape was important in identifying potential “diagenetic morphotypes” and can be used to assess whether variation in the dominant Braarudosphaera forms is more likely a primary signal or related to changes in diagenesis. Because it is unclear whether the morphotypes within our study represent different species, the usefulness of Braarudosphaera shape measurements in identifying morphotypes should be more fully explored using modern specimens, which have not been subject to postdepositional processes, are able to be independently identified to species level using genetics, and can be directly related to environmental variables (e.g., temperature, salinity, and nutrient availability).
The Relationship between Morphometric Variation and Environmental Change Following the K/Pg Impact
Although the results of the eight-component size/shape mixture model may be helpful in recognizing intervals of increased diagenesis, it is clear that pentalith size is the best way of distinguishing between potential Braarudosphaera morphotypes. As such, we only used the results of our initial three-component side-length mixture model to track stratigraphic changes in the abundance of specific morphotypes following the K/Pg mass extinction event (Fig. 9, Supplementary Figs. 6, 7). Here, we mainly focus on the Chicxulub record, which has the highest-resolution age model and is the only site to have any additional supporting paleoenvironmental data (Fig. 9).
Line graphs showing stratigraphic changes in the relative abundance of Braarudosphaera morphotypes (A) during the early Danian in the peak ring of the Chicxulub impact crater. The morphotype abundance data use the size designations of the three-component mixture model based on pentalith side length as shown in Fig. 7. Contemporaneous changes in the relative abundance of planktic foraminifera indicative of a poorly stratified water column (mixed layer) or well-stratified water column (thermocline and sub-thermocline) are also shown in B (modified from Lowery et al. unpublished data). The black dashed lines indicate the Braarudosphaera dwarfing interval, during which smaller morphotypes increase in abundance and the relative abundance of sub–thermocline dwelling planktic foraminifera reach their maximum values. (Color online.)

The lower part of the Chicxulub record is characterized by the continued dominance of a larger Braarudosphaera morphotype (Form 2), which drives the consistently high, relatively invariable pentalith size throughout planktic foraminiferal biozone P1a (Fig. 4). A significant but transient increase in the size of Braarudosphaera pentaliths occurs near the top of planktic foraminiferal biozone P1a (615.7 to 615.48 mbsf; 65.5 to 65.35 Ma; Fig. 4), due to an increase in the abundance of larger morphotypes (in particular Form 3) relative to the smaller morphotype (Form 1; Fig. 9). The increased size of Braarudosphaera pentaliths is contemporaneous with a peak in the percentage of mixed-layer planktic foraminifera, which is indicative of a poorly stratified water column (Lowery et al. unpublished data; Fig. 9). This would have allowed the turbulent mixing of nutrient-rich deeper water into the surface ocean, leading to increased nutrient availability. Thus, larger Braarudosphaera morphotypes appear to have been better adapted to eutrophic (high-nutrient) environments than smaller forms following the K/Pg mass extinction.
The peak in Braarudosphaera size is followed by a decrease to lower than previous values between 615.26 and 614.3 mbsf (~65.26 to 64.80 Ma; Fig. 4), which was driven by the increased abundance of the smaller morphotype (Form 1) relative to Form 2 (Fig. 9). This decline is also coeval with a decrease in the abundance of eutrophic-adapted planktic foraminifera, suggesting an increase in biological pump efficiency and enhanced stratification of the water column, as evidenced by the drastically increased dominance of thermocline-dwelling planktic foraminiferal (Jones et al. Reference Jones, Lowery and Bralower2019; Lowery et al. unpublished data; Fig. 9). Interestingly, pentalith regularity also increases at this time, suggesting the decreased influence of diagenetic processes during this interval (Fig. 4, Supplementary Fig. 7).
A similar increase and subsequent decrease in Braarudosphaera size occurs during approximately the same time interval at Agost (Fig. 6, Supplementary Fig. 6), suggesting that the transition from a poorly stratified to a well-stratified water column may have been a global phenomenon. A second transient, but more extreme, “dwarfing” event also occurred earlier in the record at Agost within the P0/Pα biozone (approximately ~0.5 m above the K/Pg boundary), which may indicate another period of enhanced water column stratification that led to a decrease in Braarudosphaera size. Similar to the later dwarfing event, decreased pentalith size during this interval was driven by the increased relative abundance of a smaller morphotype compared with larger ones (Supplementary Fig. 8). However, pentalith irregularity also dominates during this interval, suggesting the increased influence of diagenetic processes, perhaps partly driven by a short-lived episode of postimpact surface ocean acidification and subsequent carbonate “overshoot” (Henehan et al. Reference Henehan, Ridgwell, Thomas, Zhang, Alegret, Schmidt and Rae2019).
Our data from Brazos River show no significant decrease in Braarudosphaera size or changes in the dominant morphotypes from 0 to ~1.5 m above the boundary (66.0 to ~65.72 Ma; Fig. 5, Supplementary Fig. 9). We suggest that Braarudosphaera did not decrease in size like it did at Agost, as the water column was already well stratified due to the increased influence of riverine influx in the inner-shelf environment. This is supported by the consistently small size of Braarudosphaera during this interval, which is comparable to the average size attained during the first “dwarfing” event at Agost. The later “dwarfing” event observed at both Chicxulub and Agost is not observed at Brazos River, likely due to the potential transgressive surface at the top of the P1a biozone when this occurs. However, the large increase in the maximum and average size of Braarudosphaera between 614.3 and ~612 mbsf at Chicxulub (64.8 to ~63.9 Ma), which was driven by the increased dominance of larger morphotypes (Figs. 4, 9), is also observed at Brazos River (~1.5 to 2.8 m above the K/Pg boundary; Fig. 5, Supplementary Fig. 9). As the age model for Brazos River is unreliable, and the section is likely stratigraphically discontinuous, it is possible that the interval characterized by increased pentalith size represents a time-averaged combination of the enlargement event observed near the top of biozone P1a at Chicxulub and the permanent, increased dominance of larger morphotypes above a depth of ~614 mbsf. However, the size increase at Brazos River is not sustained as it was at Agost or Chicxulub, suggesting that it only represents the transient pentalith enlargement that occurred before the dwarfing event. Although the absence of this dwarfing event in our Brazos River record may be due to missing stratigraphic time, it might also indicate that a strongly stratified upper water column did not develop at Brazos River or that the upper water column was equally well stratified before and after the transient size increase, which would lead to a decrease back to (but not below) initial pentalith sizes. The latter hypothesis is supported by our Chicxulub record, where sub–thermocline dwelling planktic foraminiferal reach their maximum relative abundance during the Braarudosphaera dwarfing interval.
The sustained dominance of larger pentalith sizes above ~612 mbsf (~63.9 Ma) at Chicxulub suggests that the establishment of a permanently stratified upper water column beginning at ~614 mbsf led to the gradually increasing dominance of a previously uncommon Braarudosphaera morphotype (Form 3) that was better adapted to lower nutrient conditions. Below the stratigraphic depth where pentalith size begins to decrease (~614 mbsf), the water column is generally weakly stratified and unstable, favoring the smaller, eutrophic-adapted forms (e.g., Forms 1 and 2). Proliferation of this new, larger morphotype is likely an example of adaptative radiation, whereby the smaller, eutrophic-adapted Braarudosphaera survivors of the K/Pg mass extinction were forced to rapidly diversify to exploit the decreased nutrient availability caused by increased biological pump efficiency. The small fluctuations in Braarudosphaera size above 612 mbsf may then represent brief intervals when the water column became slightly less stratified, leading to a decrease in the abundance of the more oligotrophic-adapted morphotype(s). The maximum and average pentalith size at Agost also shows a gradual and sustained increase starting at ~2.2 m above the boundary. This permanent size increase occurs earlier (~65.25 Ma) than it does at Chicxulub, potentially reflecting the relatively rapid restoration of water column stratification and biological pump efficiency at Agost compared with Chicxulub. This ability to rapidly adapt and take advantage of new niche space in response to environmental change is likely why Braarudosphaera has maintained such a long and successful evolutionary history.
In summary, it is hypothesized that in the early Danian, larger Braarudosphaera morphotypes generally increased in abundance when the water column was poorly stratified and decreased in abundance when the water column was relatively well stratified. Changes in upper water column stratification may have been driven by fluctuations in riverine influx and/or enhanced warming during early Danian hyperthermal events (e.g., the Dan-C2 or the Cn29; e.g., Coccioni et al. Reference Coccioni, Frontalini, Bancalà, Fornaciari, Jovane and Sprovieri2010; Barnet et al. Reference Barnet, Littler, Westerhold, Kroon, Leng, Bailey, Röhl and Zachos2019; Sinnesael et al. Reference Sinnesael, Montanari, Frontalini, Coccioni, Gattacceca, Snoeck, Wegner, Koeberl and Bice2019). Unfortunately, as all of the sites lack an isotopic record, this hypothesis cannot be substantiated. The potential adaptive radiation of a larger, oligotrophic-adapted morphotype (Form 3) higher up in the Danian record indicates that Braarudosphaera size did not always decrease in response to increased stratification. Nonetheless, it seems that the turnover in dominant Braarudosphaera morphotypes tends to occur during intervals when there are changes in nutrient availability.
As Braarudosphaera is usually interpreted as being a eutrophic-adapted taxon, it might be expected that, like typical coccolithophores, it would grow smaller under optimal growth conditions. Instead, we hypothesize that the exact opposite is true: Braarudosphaera pentaliths become larger under eutrophic conditions. The simplest explanation for this is that Braarudosphaera is not a typical coccolithophore, as it calcifies extracellularly (as opposed to intracellularly like most coccolithophores) and is morphologically similar in design and texture to the resting cysts produced by other phytoplankton groups such as the dinoflagellates, a hypothesis that has been proposed previously in the literature (e.g., Siesser Reference Siesser and Lipps1993; Billard and Inouye Reference Billard, Inouye, Thierstein and Young2004). If Braarudosphaera is indeed the nonmotile, cyst form of a normally motile, non-calcifying haptophyte, its increased size under elevated nutrient availability makes more sense. The resting cysts of dinoflagellates have been shown to increase in size when the water column is weakly stratified and nutrient availability is high (e.g., Finkel et al. Reference Finkel, Sebbo, Feist-Burkhardt, Irwin, Katz, Schofield, Young and Falkowski2007; Mousing et al. Reference Mousing, Richardson, Bendtsen, Cetinić and Perry2016): conditions that describe the intervals where Braarudosphaera temporarily increases in size in this study. In addition, at Chicxulub, the abundance of foraminiferal-sized (i.e., larger) calcareous dinoflagellate cysts increases at the same time that Braarudosphaera pentaliths peak in size (~615.26 mbsf; 65.26 Ma) (Lowery et al. unpublished data), lending support to the hypothesis that Braarudosphaera represents a cyst life stage.
Conclusions
Our large, morphometric dataset is the first to document changes in the size and shape of pentaliths precipitated by Braarudosphaera, one of the only calcareous nannoplankton genera to survive the K/Pg mass extinction. It is also the first study of the fossil record to directly compare pentalith morphometry from different sites during the same stratigraphic interval, allowing us to recognize regional and global trends. Our data reveal that Braarudosphaera has likely sustained such a long fossil record in comparison to other nannoplankton taxa due to its ability to quickly diversify and adapt to changing environmental conditions. In our record, this is particularly apparent during intervals where water column stratification weakens or strengthens, which causes a change in nutrient availability and thus a shift in the dominant morphotype. Therefore, future work should focus on examining whether Braarudosphaera morphometry changes similarly during other geologic periods when the stratification of the upper water column fluctuated. Additionally, as Braarudosphaera is an atypical nannoplankton genus, we are unable to use it to model how other taxa might have responded to environmental change during the earliest Paleocene. For this reason, it is essential that we conduct similar morphometric studies on the more “typical” early Paleocene coccolithophorid lineages (e.g., Neobiscutum, Praeprinsius, Prinsius, Cruciplacolithus, and Coccolithus) to fully explore the relationship between paleoenvironmental change and calcareous nannoplankton cryptic speciation following the K/Pg impact.
Finally, our data show that although pentalith size is useful in differentiating morphotypes, shape parameters may be critical in the identification of separate morphotypes that are the same or of a similar, size. However, our shape data were more heavily affected by postdepositional processes than pentalith size, meaning that future work should focus on critically assessing the utility of Braarudosphaera shape as a phylogenetic trait in modern specimens that have not undergone diagenesis. Once this has been established, our coupled size–shape morphometric methods could be applied to better understand paleoceanographic conditions (especially changes in upper water column stratification) during other geologic time periods when Braarudosphaera forms spatially and temporally restricted paleo-blooms.
Acknowledgments
This research forms a chapter of H.L.J.'s Ph.D. dissertation, for which funding was partially provided by the Department of Geosciences at Penn State University and National Science Foundation grant NSF-OCE 1736951. We would like to thank L. Alegret for providing us with the Agost samples and C. Lowery for allowing us to use his Chicxulub planktic foraminiferal data. We also thank M. Patzkowsky, T. LaJeunesse, L. Kump, D. K. Watkins, and two anonymous reviewers for helpful comments that greatly improved the quality of this article.
Data Availability Statement
Data available from the Dryad Digital Repository: https://doi.org/10.5061/dryad.280gb5mph.


 Open access