


1. Introduction
When exposed to ultrasound excitation, small bubbles in soft materials (e.g. viscoelastic gels, tissues and fibrous clots) have been observed to translate, leaving tunnels in their path (Williams & Miller Reference Williams and Miller2003; Caskey et al. Reference Caskey, Qin, Dayton and Ferrara2009a ; Maxwell et al. Reference Maxwell, Wang, Yuan, Duryea, Xu and Cain2010) (see example in figure 1). Driven bubble oscillations are thought to degrade material near the bubble, allowing it to travel through the material at nearly uniform speed (Caskey et al. Reference Caskey, Qin, Dayton and Ferrara2009a ; Acconcia et al. Reference Acconcia, Leung, Manjunath and Goertz2015). This travel leaves tunnel-like features (Williams & Miller Reference Williams and Miller2003; Caskey et al. Reference Caskey, Qin, Dayton and Ferrara2009a ) of a width comparable to that expected for expanded bubbles (Caskey et al. Reference Caskey, Qin, Dayton and Ferrara2009a ). The mechanisms of this tunnelling are investigated here with simulations of model material.
Microtunnels in soft agarose gel (Williams & Miller Reference Williams and Miller2003). The scale bar indicates 500 $\unicode{x03BC}$
m.
$\unicode{x03BC}$
m.

Such tunnelling is potentially important in the mechanical disruption of tissue in histotripsy procedures (Maxwell et al. Reference Maxwell, Wang, Yuan, Duryea, Xu and Cain2010; Kim et al. Reference Kim, Wang, Xu and Cain2011; Lundt et al. Reference Lundt, Allen, Shi, Hall, Cain and Xu2017; Stride & Coussios Reference Stride and Coussios2019). In particular, Maxwell et al. (Reference Maxwell, Wang, Yuan, Duryea, Xu and Cain2010) observed bubble-scale tunnels in both high-intensity focused ultrasound (HIFU) treatment of an ex vivo kidney and in tissue-mimicking phantoms. They showed that tunnels formed by individual bubbles can overlap and create wide lesions. Similar tunnels were also seen in pre- and post-focus regions of HIFU treatment (Maxwell et al. Reference Maxwell, Wang, Yuan, Duryea, Xu and Cain2010; Kim et al. Reference Kim, Wang, Xu and Cain2011; Lundt et al. Reference Lundt, Allen, Shi, Hall, Cain and Xu2017). Kim et al. (Reference Kim, Wang, Xu and Cain2011) suggested that this collateral damage is caused by the activity of bubbles outside of the main targeted treatment zone. Lundt et al. (Reference Lundt, Allen, Shi, Hall, Cain and Xu2017) also found tunnel-like features outside the HIFU treatment region, mostly in the post-focal tissue adjacent to the distal margin of the target.
Tunnelling has also been observed during ultrasound-accelerated thrombolysis by Acconcia et al. (Reference Acconcia, Leung, Manjunath and Goertz2014), who saw individual ultrasound-excited microbubbles penetrate and transit clots, leaving a tunnel in their path. Acconcia et al. (Reference Acconcia, Leung, Manjunath and Goertz2014) found that the penetration distance depends on the bubble size and the acoustic pressure. They hypothesised that both bubble oscillation and acoustic radiation forces on the bubbles might induce sufficient local strain to disrupt. Insonated microbubbles are also thought to enhance extravascular drug delivery by penetrating otherwise impermeable tissues and membranes, such as blood vessel walls or the blood–brain barrier, with tunnel-like features (Caskey et al. Reference Caskey, Qin and Ferrara2009b ; Arvanitis et al. Reference Arvanitis, Bazan-Peregrino, Rifai, Seymour and Coussios2011; Stride & Coussios Reference Stride and Coussios2019).
Although it is clear that the driven bubbles somehow cause tunnelling, the details are hard to assess because it occurs internal to the material and is small scale ( ${\sim}100$ $\unicode{x03BC}$
m) and high frequency (
$\unicode{x03BC}$
m) and high frequency ( ${\sim}\mathrm{MHz}$
). Williams & Miller (Reference Williams and Miller2003) first observed the formation of tunnels in a transparent agarose gel block immersed in water upon exposure to 4 MPa ultrasound delivered at 0.78 MHz (figure 1). They found tunnels in the gel sample that were open to the water bath, as well as fully within the gel. The number of tunnels increased with driving pressure amplitude, the duration of exposure to the ultrasound, and the dissolved gas content and cavitation nuclei. They postulated that bubbles burrowed through the gel, leaving a lower-viscosity fluid in their wake, with the tunnel diameters corresponding to the expected oscillation maximum of the excited bubbles. Williams & Miller (Reference Williams and Miller2003) found that the tunnels that initiated at the surface of the gel sample contained fluid with a lower viscosity compared with the tunnels that initiated within the gel. This degraded material behaved like a liquid more viscous than water. More recently, using high-speed microscopy, Caskey and collaborators (Caskey et al. Reference Caskey, Qin, Dayton and Ferrara2009a
,
Reference Caskey, Qin and Ferrarab
) showed cavitation activity within a tissue-mimicking gel. High-speed microscopy images show asymmetric bubble oscillations near the growing end of the tunnel. Caskey et al. (Reference Caskey, Qin, Dayton and Ferrara2009a
) found that bubble size in the expansion phase indeed approximately matched the tunnel diameter. The well-known jetting collapse of acoustically forced bubbles (Plesset & Chapman Reference Plesset and Chapman1971; Popinet & Zaleski Reference Popinet and Zaleski2002; Johnsen & Colonius Reference Johnsen and Colonius2009; Ohl, Klaseboer & Khoo Reference Ohl, Klaseboer and Khoo2015; Krishnan, Hopfinger & Puthenveettil Reference Krishnan, Hopfinger and Puthenveettil2017; Zeng, An & Ohl Reference Zeng, An and Ohl2022) was observed by Caskey et al. (Reference Caskey, Qin, Dayton and Ferrara2009a
,
Reference Caskey, Qin and Ferrarab
) during these asymmetric oscillations. However, these jets were not always oriented along the tunnel axis. Hence, their role in growing the tunnel in a particular direction is unclear. Still, a simple analysis based on an assumed jet velocity suggested that pressure on the gel at the jet impact might lead to strains that degrade the material.
${\sim}\mathrm{MHz}$
). Williams & Miller (Reference Williams and Miller2003) first observed the formation of tunnels in a transparent agarose gel block immersed in water upon exposure to 4 MPa ultrasound delivered at 0.78 MHz (figure 1). They found tunnels in the gel sample that were open to the water bath, as well as fully within the gel. The number of tunnels increased with driving pressure amplitude, the duration of exposure to the ultrasound, and the dissolved gas content and cavitation nuclei. They postulated that bubbles burrowed through the gel, leaving a lower-viscosity fluid in their wake, with the tunnel diameters corresponding to the expected oscillation maximum of the excited bubbles. Williams & Miller (Reference Williams and Miller2003) found that the tunnels that initiated at the surface of the gel sample contained fluid with a lower viscosity compared with the tunnels that initiated within the gel. This degraded material behaved like a liquid more viscous than water. More recently, using high-speed microscopy, Caskey and collaborators (Caskey et al. Reference Caskey, Qin, Dayton and Ferrara2009a
,
Reference Caskey, Qin and Ferrarab
) showed cavitation activity within a tissue-mimicking gel. High-speed microscopy images show asymmetric bubble oscillations near the growing end of the tunnel. Caskey et al. (Reference Caskey, Qin, Dayton and Ferrara2009a
) found that bubble size in the expansion phase indeed approximately matched the tunnel diameter. The well-known jetting collapse of acoustically forced bubbles (Plesset & Chapman Reference Plesset and Chapman1971; Popinet & Zaleski Reference Popinet and Zaleski2002; Johnsen & Colonius Reference Johnsen and Colonius2009; Ohl, Klaseboer & Khoo Reference Ohl, Klaseboer and Khoo2015; Krishnan, Hopfinger & Puthenveettil Reference Krishnan, Hopfinger and Puthenveettil2017; Zeng, An & Ohl Reference Zeng, An and Ohl2022) was observed by Caskey et al. (Reference Caskey, Qin, Dayton and Ferrara2009a
,
Reference Caskey, Qin and Ferrarab
) during these asymmetric oscillations. However, these jets were not always oriented along the tunnel axis. Hence, their role in growing the tunnel in a particular direction is unclear. Still, a simple analysis based on an assumed jet velocity suggested that pressure on the gel at the jet impact might lead to strains that degrade the material.
It has also been recognised that material near the growing end is stretched during the expansion, which might also lead to degradation. This is the more consequential mechanism for the systems we consider, as will be seen in § 3. Caskey et al. (Reference Caskey, Qin, Dayton and Ferrara2009a ) hypothesised that the tunnels form due to the combined effect of the bubble expansion and microjetting during collapse. However, diagnostic challenges and material complexity hinder direct assessment. In summary, the primary candidate mechanisms are collapse-induced bubble jetting, causing local high strains near the point of jet impact, or strain caused by large expansion of the bubble. The ultrasound wavelengths are much larger than the bubble size, so the pressure gradient across it is small, though it still exerts a net force on the bubble. This acoustic radiation force has been suggested as the mechanism that moves the bubble (or bubbles) along the tunnel, facilitating its growth (Caskey et al. Reference Caskey, Qin, Dayton and Ferrara2009a , Reference Caskey, Qin and Ferrarab ; Acconcia et al. Reference Acconcia, Leung, Manjunath and Goertz2014; Stride & Coussios Reference Stride and Coussios2019). The present model (§ 2) does not include this force, but still produces tunnelling.
The goal of this study is to analyse, in greater detail than can be inferred from experiments, how a tunnel can grow in a model material, including how growth depends on the model parameters. Specifically, we introduce what is potentially the simplest possible scenario: a single acoustically excited insoluble gas bubble initialised near the end of a proto-tunnel within a viscous fluid material with viscosity that irreversibly drops with a fast time scale upon reaching a strain threshold. That this simple model reproduces observations is of importance itself, showing that the complexity of real material, elastic effects and acoustic radiation forces are not essential for tunnelling. This nominally axisymmetric configuration allows for simulations over hundreds of driving cycles to achieve seemingly asymptotic steady tunnelling. That it does reproduce tunnelling, as observed and at a reasonable tunnelling rate, provides sufficient validation for studying mechanisms even though no point-to-point comparison can be expected.
These simulations build, of course, on a history of simulation models: the symmetric bubble dynamics in an homogeneous medium (Plesset & Prosperetti Reference Plesset and Prosperetti1977; Prosperetti & Lezzi Reference Prosperetti and Lezzi1986; Murakami et al. Reference Murakami, Yamakawa, Zhao, Johnsen and Ando2021) and the asymmetric jetting collapse of the bubbles near rigid walls (Popinet & Zaleski Reference Popinet and Zaleski2002; Huang & Zhang Reference Huang and Zhang2007; Johnsen & Colonius Reference Johnsen and Colonius2009; Rodriguez et al. Reference Rodriguez, Beig, Barbier and Johnsen2022; Zeng et al. Reference Zeng, An and Ohl2022; Li et al. Reference Li, Zhang, Cui, Li and Liu2023; Lang, Adami & Adams Reference Lang, Adami and Adams2024). Studies of driven bubble dynamics near fluid–fluid interfaces do not consider steady tunnelling (Klaseboer & Khoo Reference Klaseboer and Khoo2004; Freund, Shukla & Evan Reference Freund, Shukla and Evan2009; Orthaber et al. Reference Orthaber2020; Yamamoto & Komarov Reference Yamamoto and Komarov2020; Han et al. Reference Han, Zhang, Tan and Li2022).
Section 2 describes the configuration and the computational model. The simulation results are analysed in the sections that follow: the primary tunnelling mechanisms for this configuration are identified in § 3, followed by an assessment of the influence of the material properties in § 4, and acoustic excitation amplitude and frequency in § 5. The unexpected availability of multiple steady tunnelling conditions, for the same physical parameters arrived at from different initial conditions, is discussed in § 6. Finally, conclusions are summarised in § 7.
2. Simulation model
2.1. Physical system
The gas within the bubble is taken to be homogenous, inviscid and insoluble (Barajas & Johnsen Reference Barajas and Johnsen2017; Hasan et al. Reference Hasan, Al Mahmud, Khan, Patil, Dennis and Adnan2021). It is also assumed to be adiabatic due to the high frequencies ( ${\gtrsim}1$
MHz) of the driving ultrasound. Tissues and gels are nearly incompressible, which is enforced outside of the bubble. These same assumptions underly the Rayleigh–Plesset equation (Rayleigh Reference Rayleigh1917; Plesset Reference Plesset1949).
${\gtrsim}1$
MHz) of the driving ultrasound. Tissues and gels are nearly incompressible, which is enforced outside of the bubble. These same assumptions underly the Rayleigh–Plesset equation (Rayleigh Reference Rayleigh1917; Plesset Reference Plesset1949).
The material outside the bubble is a Newtonian fluid. Although this neglects the weak elasticity of gels and tissues, numerical studies have shown that the viscosity of similar materials has a stronger effect on the amplitude of fast microbubble oscillation than their elasticity (Yang & Church Reference Yang and Church2005; Freund Reference Freund2008; Movahed et al. Reference Movahed, Kreider, Maxwell, Hutchens and Freund2016; Murakami et al. Reference Murakami, Yamakawa, Zhao, Johnsen and Ando2021). This is further shown through a scaling analysis in § 2.2 for the baseline model parameters.
Tunnelling requires the degradation of the material. For this, we invoke the simplest tensorially consistent model based on a threshold for the maximum principal tensile strain. The effect of the degradation is to reduce the material’s viscous resistance, the model for which is introduced in § 2.3.
2.2. Configuration
Some tunnels have been observed to bend and even fork (Williams & Miller Reference Williams and Miller2003; Caskey et al. Reference Caskey, Qin, Dayton and Ferrara2009a
; Kim et al. Reference Kim, Wang, Xu and Cain2011), but our focus is basic linear tunnelling, for which an axisymmetric model is sufficient. The initial configuration is shown in figure 2. The initial bubble with diameter $D_i=1\,\unicode{x03BC} \mathrm{m}$
starts centred at
$D_i=1\,\unicode{x03BC} \mathrm{m}$
starts centred at $(x,r) = (0,0)$
. The tunnel is initiated with the bubble at the end of a capsule-shaped low-viscosity (fully degraded) inclusion. This tunnel geometry is constructed for convenience, but simulations will run for sufficient numbers of cycles and tunnel lengths to become independent of this choice. The bubble is placed near the end of the tunnel based on the observations in the microscopy images (Caskey et al. Reference Caskey, Qin, Dayton and Ferrara2009a
). The initial distance of the bubble centre from the tunnel
$(x,r) = (0,0)$
. The tunnel is initiated with the bubble at the end of a capsule-shaped low-viscosity (fully degraded) inclusion. This tunnel geometry is constructed for convenience, but simulations will run for sufficient numbers of cycles and tunnel lengths to become independent of this choice. The bubble is placed near the end of the tunnel based on the observations in the microscopy images (Caskey et al. Reference Caskey, Qin, Dayton and Ferrara2009a
). The initial distance of the bubble centre from the tunnel $\delta x_{b0}$
is varied to study the effect of initial configuration on tunnelling rate. However,
$\delta x_{b0}$
is varied to study the effect of initial configuration on tunnelling rate. However, $\delta x_{b0}=D_i/2$
, unless otherwise noted, and nearly all of the results concern a behaviour that has become independent of the placement. The density
$\delta x_{b0}=D_i/2$
, unless otherwise noted, and nearly all of the results concern a behaviour that has become independent of the placement. The density $\rho$
outside the bubble is uniformly
$\rho$
outside the bubble is uniformly $1000\,\mathrm{kg\,m^{- 3}}$
as appropriate for tissues or hydrogels (Maxwell et al. Reference Maxwell, Wang, Yuan, Duryea, Xu and Cain2010). The viscosity of the degraded material is taken to be water-like, with
$1000\,\mathrm{kg\,m^{- 3}}$
as appropriate for tissues or hydrogels (Maxwell et al. Reference Maxwell, Wang, Yuan, Duryea, Xu and Cain2010). The viscosity of the degraded material is taken to be water-like, with $\mu _1 = 0.001$
Pa s. The viscosity and damage threshold of the material are motivated by the characteristics of common tissue-mimicking gels. The viscosity of the undegraded material is varied from
$\mu _1 = 0.001$
Pa s. The viscosity and damage threshold of the material are motivated by the characteristics of common tissue-mimicking gels. The viscosity of the undegraded material is varied from $\mu _2=0.002$
Pa s to
$\mu _2=0.002$
Pa s to $0.025$
Pa s (Hamaguchi & Ando Reference Hamaguchi and Ando2015; Murakami et al. Reference Murakami, Yamakawa, Zhao, Johnsen and Ando2021), which corresponds to the ratio
$0.025$
Pa s (Hamaguchi & Ando Reference Hamaguchi and Ando2015; Murakami et al. Reference Murakami, Yamakawa, Zhao, Johnsen and Ando2021), which corresponds to the ratio $\mu ^*=\mu _2/\mu _1=2{-}25$
.
$\mu ^*=\mu _2/\mu _1=2{-}25$
.
Proto-tunnel initial condition.

The tensile stretch limit (see § 2.3) is $\lambda _f = 1.5$
, which is similar to tissue-mimicking hydrogels (Gent & Wang Reference Gent and Wang1991; Barrangou, Daubert & Foegeding Reference Barrangou, Daubert and Foegeding2006). The surface tension on the bubble surface is
$\lambda _f = 1.5$
, which is similar to tissue-mimicking hydrogels (Gent & Wang Reference Gent and Wang1991; Barrangou, Daubert & Foegeding Reference Barrangou, Daubert and Foegeding2006). The surface tension on the bubble surface is $\sigma = 0.073\,\mathrm{N\,m^{- 2}}$
. The frequency of the driving acoustic excitation ranges from
$\sigma = 0.073\,\mathrm{N\,m^{- 2}}$
. The frequency of the driving acoustic excitation ranges from $f=1$
to
$f=1$
to $4$
MHz, which is within the range of therapeutic HIFU (Vlaisavljevich et al. Reference Vlaisavljevich2015). Corresponding ultrasound wavelengths
$4$
MHz, which is within the range of therapeutic HIFU (Vlaisavljevich et al. Reference Vlaisavljevich2015). Corresponding ultrasound wavelengths $0.185$
–
$0.185$
– $1.48$
mm are large with respect to the bubble diameter and so are represented as a uniform far-field pressure that cycles as (Plesset & Prosperetti Reference Plesset and Prosperetti1977; Gaudron, Warnez & Johnsen Reference Gaudron, Warnez and Johnsen2015)
$1.48$
mm are large with respect to the bubble diameter and so are represented as a uniform far-field pressure that cycles as (Plesset & Prosperetti Reference Plesset and Prosperetti1977; Gaudron, Warnez & Johnsen Reference Gaudron, Warnez and Johnsen2015)
 \begin{equation} p_{\infty } = p_0 - p_a\sin \left ( 2\pi f t \right)\!, \end{equation}
where $p_0=10^5\,\textrm {Pa}$
is the ambient mean pressure. This treatment of the acoustic pressure is consistent with common practice (Prosperetti & Lezzi Reference Prosperetti and Lezzi1986; Calvisi et al. Reference Calvisi, Lindau, Blake and Szeri2007; Wang & Blake Reference Wang and Blake2011), including bubble dynamics driven by travelling acoustic waves (Calvisi et al. Reference Calvisi, Lindau, Blake and Szeri2007). Because
$p_0=10^5\,\textrm {Pa}$
is the ambient mean pressure. This treatment of the acoustic pressure is consistent with common practice (Prosperetti & Lezzi Reference Prosperetti and Lezzi1986; Calvisi et al. Reference Calvisi, Lindau, Blake and Szeri2007; Wang & Blake Reference Wang and Blake2011), including bubble dynamics driven by travelling acoustic waves (Calvisi et al. Reference Calvisi, Lindau, Blake and Szeri2007). Because $p_\infty$
is uniform, the bubble does not experience an acoustic radiation force (King Reference King1934). The initial bubble pressure is
$p_\infty$
is uniform, the bubble does not experience an acoustic radiation force (King Reference King1934). The initial bubble pressure is $p_{b0}=20p_0$
, which corresponds to an equilibrium bubble diameter
$p_{b0}=20p_0$
, which corresponds to an equilibrium bubble diameter $ (D_{0})$
of
$ (D_{0})$
of $1.6\,\unicode{x03BC} \mathrm{m}$
. An elevated initial pressure was selected to show that the model can represent bubble-collapse jetting and its accelerated damage, which
$1.6\,\unicode{x03BC} \mathrm{m}$
. An elevated initial pressure was selected to show that the model can represent bubble-collapse jetting and its accelerated damage, which $p_{b0}=20p_0$
produces, but results will show that this jetting gives way to a non-jetting steady tunnelling. Long-time tunnelling rates are confirmed to be independent of this initial pressure, and tunnelling does not occur without subsequent acoustic excitation. The amplitude of the acoustic excitation
$p_{b0}=20p_0$
produces, but results will show that this jetting gives way to a non-jetting steady tunnelling. Long-time tunnelling rates are confirmed to be independent of this initial pressure, and tunnelling does not occur without subsequent acoustic excitation. The amplitude of the acoustic excitation $p_a$
varies from 0.15 to 0.35 MPa, which loosely emulates the expected conditions where tunnelling is seen in tissue outside the focus region in HIFU therapeutic procedures (Maxwell et al. Reference Maxwell, Wang, Yuan, Duryea, Xu and Cain2010). The equilibrium bubble diameter
$p_a$
varies from 0.15 to 0.35 MPa, which loosely emulates the expected conditions where tunnelling is seen in tissue outside the focus region in HIFU therapeutic procedures (Maxwell et al. Reference Maxwell, Wang, Yuan, Duryea, Xu and Cain2010). The equilibrium bubble diameter $D_0$
and the ambient pressure
$D_0$
and the ambient pressure $p_0$
yield an inviscid linear spherical resonance frequency
$p_0$
yield an inviscid linear spherical resonance frequency
 \begin{equation} f_n =\frac {1}{\pi D_0}\sqrt {\frac {3p_{0}\gamma }{\rho }} \approx 4\,\mathrm{MHz}. \end{equation}
A reference velocity scale is associated with the velocity of the bubble interface during Rayleigh collapse (Rayleigh Reference Rayleigh1917; Curtiss et al. Reference Curtiss, Leppinen, Wang and Blake2013; Han et al. Reference Han, Köhler, Jungnickel, Mettin, Lauterborn and Vogel2015; Ohl et al. Reference Ohl, Klaseboer and Khoo2015):
 \begin{equation} u_0\equiv \sqrt {\frac {\Delta p}{\rho }} \approx 10\,\mathrm{m\,s^{- 1}}, \end{equation}
where $\Delta p\sim 10^5\,\mathrm{Pa}$
represents the difference in the pressure within the expanded bubble
$\Delta p\sim 10^5\,\mathrm{Pa}$
represents the difference in the pressure within the expanded bubble $ (p_b\approx 0.2\times 10^5\,\text{Pa})$
and mean ambient pressure
$ (p_b\approx 0.2\times 10^5\,\text{Pa})$
and mean ambient pressure $ (p_0\approx 10^5\,\text{Pa})$
. The reference parameters
$ (p_0\approx 10^5\,\text{Pa})$
. The reference parameters $D_0$
,
$D_0$
, $p_0$
,
$p_0$
, $u_0$
and
$u_0$
and $f_n$
are used for subsequent non-dimensionalisation. The Weber number is
$f_n$
are used for subsequent non-dimensionalisation. The Weber number is
 \begin{equation} {\textit{We}}_{D} = \frac {\rho u_0^2 D_0}{\sigma }, \end{equation}
and a Reynolds number to characterise the flow in the high-viscosity undegraded material is
 \begin{equation} {{\textit{Re}}}_{D} = \frac {\rho \dot {R}_mD_m}{\mu _2}, \end{equation}
where $D_m$
is the diameter of the bubble when the rate of change of its radius
$D_m$
is the diameter of the bubble when the rate of change of its radius $\dot {R} = \dot {R}_m$
is maximum. For a deformed bubble,
$\dot {R} = \dot {R}_m$
is maximum. For a deformed bubble, $D_m$
and
$D_m$
and $\dot {R}_m$
are based on a sphere of equal volume.
$\dot {R}_m$
are based on a sphere of equal volume.
The elastic versus viscous stresses can be estimated for a Kelvin–Voigt material. Shear modulus $G=1$
kPa and shear viscosity
$G=1$
kPa and shear viscosity $\mu =0.01$
Pa s is considered (Murakami et al. Reference Murakami, Yamakawa, Zhao, Johnsen and Ando2021). The nominal diameter of the bubble is taken as
$\mu =0.01$
Pa s is considered (Murakami et al. Reference Murakami, Yamakawa, Zhao, Johnsen and Ando2021). The nominal diameter of the bubble is taken as $D=1\,\unicode{x03BC}$
m. The bubble is excited by a sinusoidal far-field acoustic excitation at
$D=1\,\unicode{x03BC}$
m. The bubble is excited by a sinusoidal far-field acoustic excitation at $f = 1$
MHz and amplitude
$f = 1$
MHz and amplitude $p_a= 10^5$
Pa. A scale for strain
$p_a= 10^5$
Pa. A scale for strain $ (\varepsilon)$
and strain rate
$ (\varepsilon)$
and strain rate $ (\dot {\varepsilon })$
in the material surrounding the oscillating bubble is given by
$ (\dot {\varepsilon })$
in the material surrounding the oscillating bubble is given by
 \begin{equation} \varepsilon \equiv \frac {u_0}{Df}\approx 10 \end{equation}
and
 \begin{equation} \dot {\varepsilon }\equiv \frac {u_0}{D}\approx 10^7\,\mathrm{s}^{-1}, \end{equation}
respectively. Therefore, an elastic stress scale is
 \begin{equation} \tau _e\equiv G\varepsilon \equiv \frac {Gu_0}{Df}\approx 10^4\,\mathrm{Pa}, \end{equation}
and the corresponding viscous stress scale is
 \begin{equation} \tau _v\equiv \mu \dot {\varepsilon }\equiv \frac {\mu u_0}{D}\approx 10^5\,\mathrm{Pa}. \end{equation}
Therefore, the Wissenberg number of the flow is ${Wi}=\tau _e/\tau _v=0.1$
, so viscous effects are anticipated to dominate elastic effects. A more sophisticated model might better characterise the potentially multiple continuum and molecular time scales of the material degradation and elastic resistance, but this loose estimate is sufficient for justifying a viscous-only model for the present purposes. An approximate factor of ten is significant, on top of which it should be recognised that large strains do not yield large elastic stresses because of the material degradation. A more specific analysis of a Rayleigh–Plesset equation modified for a degrading Kelvin–Voigt material suggests that viscous effects will exceed elastic effects by a factor of 500 with these same viscous, elastic and degradation parameters. It was shown in a previous study (Murakami et al. Reference Murakami, Yamakawa, Zhao, Johnsen and Ando2021) that the amplitude of oscillation of small bubbles with an equilibrium radius of approximately
${Wi}=\tau _e/\tau _v=0.1$
, so viscous effects are anticipated to dominate elastic effects. A more sophisticated model might better characterise the potentially multiple continuum and molecular time scales of the material degradation and elastic resistance, but this loose estimate is sufficient for justifying a viscous-only model for the present purposes. An approximate factor of ten is significant, on top of which it should be recognised that large strains do not yield large elastic stresses because of the material degradation. A more specific analysis of a Rayleigh–Plesset equation modified for a degrading Kelvin–Voigt material suggests that viscous effects will exceed elastic effects by a factor of 500 with these same viscous, elastic and degradation parameters. It was shown in a previous study (Murakami et al. Reference Murakami, Yamakawa, Zhao, Johnsen and Ando2021) that the amplitude of oscillation of small bubbles with an equilibrium radius of approximately $10\,\unicode{x03BC} \text{m}$
is similar in a Kelvin–Voigt viscoelastic material and Newtonian viscous fluid with the same viscosity.
$10\,\unicode{x03BC} \text{m}$
is similar in a Kelvin–Voigt viscoelastic material and Newtonian viscous fluid with the same viscosity.
2.3. Governing equations
The incompressible fluid outside the bubble flows according to
 \begin{align} \rho \left [\frac {\partial \boldsymbol{u}}{\partial t} + \boldsymbol{u}\boldsymbol{\cdot }\boldsymbol{\boldsymbol{\nabla }} \boldsymbol{u} \right] &= -\boldsymbol{\boldsymbol{\nabla }}p + \boldsymbol{\boldsymbol{\nabla }}\boldsymbol{\cdot }{\boldsymbol{\tau }}, \end{align}
 \begin{align} \boldsymbol{\boldsymbol{\nabla }}\boldsymbol{\cdot }\boldsymbol{u}&=0, \end{align}
where $\rho$
is the density,
$\rho$
is the density, $\boldsymbol{u}$
is the velocity,
$\boldsymbol{u}$
is the velocity, $p$
is the pressure and
$p$
is the pressure and $\boldsymbol{\tau }$
is the deviatoric stress tensor. The fluid is a mixture of the degraded and the undegraded Newtonian components, so
$\boldsymbol{\tau }$
is the deviatoric stress tensor. The fluid is a mixture of the degraded and the undegraded Newtonian components, so
 \begin{equation} \boldsymbol{\tau }=\bar {\mu }\left (\boldsymbol{\boldsymbol{\nabla }}\boldsymbol{u}+\boldsymbol{\boldsymbol{\nabla }}\boldsymbol{u}^T\right)\ \end{equation}
with mixture viscosity
 \begin{equation} \bar {\mu }=\frac {\left (1-\phi \right)}{2}\mu _1+\frac {\left (1+\phi \right)}{2}\mu _2, \end{equation}
where $\phi =-1$
indicates fully degraded material and
$\phi =-1$
indicates fully degraded material and $\phi =1$
undegraded material. Material is tracked by an advection equation:
$\phi =1$
undegraded material. Material is tracked by an advection equation:
 \begin{equation} \frac {\partial \phi }{\partial t}+\boldsymbol{\boldsymbol{\nabla }}\boldsymbol{\cdot }\left (\boldsymbol{u}\phi \right)= b\left [ {\nabla} ^2\phi + \frac {\phi \left (1 - \phi ^2\right)}{W^2} - \lvert \boldsymbol{\nabla }\phi \rvert \boldsymbol{\nabla }\boldsymbol{\cdot }\left ( \frac {\boldsymbol{\nabla }\phi }{\lvert \boldsymbol{\nabla }\phi \rvert } \right) \right] - R_d I_d(1+\phi). \end{equation}
Experiments show a sharp boundary between the degraded and the undegraded material (Caskey et al. Reference Caskey, Qin, Dayton and Ferrara2009a
; Maxwell et al. Reference Maxwell, Wang, Yuan, Duryea, Xu and Cain2010; Lundt et al. Reference Lundt, Allen, Shi, Hall, Cain and Xu2017), which is maintained in the simulations. The first term on the right-hand side is a common model to ensure that a sharp hyperbolic-tangent-like $\phi$
profile is preserved along the normal to the boundary (Folch et al. Reference Folch, Casademunt, Hernández-Machado and Ramírez-Piscina1999; Sun & Beckermann Reference Sun and Beckermann2007). Earlier, this method was found to preserve the sharpness of the interface with excellent mass conservation (Sun & Beckermann Reference Sun and Beckermann2007). We shall see in § 4.2 that any mass error, which in this case would cause artificial degradation (or repair) of the material, is insufficient to show any sign of tunnelling. The model parameters
$\phi$
profile is preserved along the normal to the boundary (Folch et al. Reference Folch, Casademunt, Hernández-Machado and Ramírez-Piscina1999; Sun & Beckermann Reference Sun and Beckermann2007). Earlier, this method was found to preserve the sharpness of the interface with excellent mass conservation (Sun & Beckermann Reference Sun and Beckermann2007). We shall see in § 4.2 that any mass error, which in this case would cause artificial degradation (or repair) of the material, is insufficient to show any sign of tunnelling. The model parameters $W$
and
$W$
and $b$
mediate the target thickness of this interface and the strength of the sharpening. Except when noted,
$b$
mediate the target thickness of this interface and the strength of the sharpening. Except when noted, $W$
is twice of the minimum mesh spacing
$W$
is twice of the minimum mesh spacing $\Delta x$
, and the sharpening parameter is (Sun & Beckermann Reference Sun and Beckermann2007)
$\Delta x$
, and the sharpening parameter is (Sun & Beckermann Reference Sun and Beckermann2007)
 \begin{equation} b = \alpha _b \frac {\Delta x^2}{\Delta t}, \end{equation}
where $\alpha _b = 6.0\times 10^{-5}$
. The bubble dynamics and tunnelling are insensitive to
$\alpha _b = 6.0\times 10^{-5}$
. The bubble dynamics and tunnelling are insensitive to $W$
and
$W$
and $\alpha _b$
in the range of
$\alpha _b$
in the range of $\pm 50\,\%$
of these standard values.
$\pm 50\,\%$
of these standard values.
The second term on the right-hand side of (2.14) models degradation. This degradation model is a low-elasticity limit of the established model of Shanthraj et al. (Reference Shanthraj, Sharma, Svendsen, Roters and Raabe2016). The rate coefficient is $R_d = 20 f_n$
, where
$R_d = 20 f_n$
, where $f_n$
is the natural frequency of the bubble, and the indicator,
$f_n$
is the natural frequency of the bubble, and the indicator,
 \begin{equation} I_d=\begin{cases} 0 & \text{if }\lambda _m\lt \lambda _f\\ 1 & \text{if }\lambda _m\geqslant \lambda _f \end{cases}, \end{equation}
is activated where the maximum of the principal stretches $\lambda _m = {\textit{max}} (\lambda _1,\, \lambda _2,\, \lambda _3)$
exceeds the stretch threshold
$\lambda _m = {\textit{max}} (\lambda _1,\, \lambda _2,\, \lambda _3)$
exceeds the stretch threshold $\lambda _f$
. As this linear maximum-stretch model obviously neglects many factors that would mediate degradation of a real material (Movahed et al. Reference Movahed, Kreider, Maxwell, Hutchens and Freund2016; Milner & Hutchens Reference Milner and Hutchens2021), it might be quantitatively incorrect for complex materials. Nevertheless, it is expected to afford the correct phenomenology, as will be seen. Closer quantitative comparisons with rates might require refinements to the material damage model.
$\lambda _f$
. As this linear maximum-stretch model obviously neglects many factors that would mediate degradation of a real material (Movahed et al. Reference Movahed, Kreider, Maxwell, Hutchens and Freund2016; Milner & Hutchens Reference Milner and Hutchens2021), it might be quantitatively incorrect for complex materials. Nevertheless, it is expected to afford the correct phenomenology, as will be seen. Closer quantitative comparisons with rates might require refinements to the material damage model.
The principal stretches depend on the deformation from the $\boldsymbol{Z}= (X,R,\varTheta)$
initial material coordinates to the
$\boldsymbol{Z}= (X,R,\varTheta)$
initial material coordinates to the $\boldsymbol{z}= (x,r,\theta)$
current coordinate as mapped by the deformation gradient tensor:
$\boldsymbol{z}= (x,r,\theta)$
current coordinate as mapped by the deformation gradient tensor:
 \begin{equation} \boldsymbol{F} = \frac {\partial \boldsymbol{z}}{\partial \boldsymbol{Z}}. \end{equation}
The material derivative of $\boldsymbol{F}$
is
$\boldsymbol{F}$
is
 \begin{equation} \dot {\boldsymbol{F}}=\frac {\partial \boldsymbol{F}}{\partial t} + \boldsymbol{u} \boldsymbol{\cdot }\boldsymbol{\nabla }\boldsymbol{F}=\boldsymbol{\nabla }\boldsymbol{u}\boldsymbol{\cdot }\boldsymbol{F}, \end{equation}
which evolved in time along with (2.10), (2.11) and (2.14) to track deformation (Liu & Walkington Reference Liu and Walkington2001; Kamrin, Rycroft & Nave Reference Kamrin, Rycroft and Nave2012). The principal stretches $ (\lambda _1,\, \lambda _2,\, \lambda _3)$
are the square-root of eigenvalues of the right Cauchy–Green tensor:
$ (\lambda _1,\, \lambda _2,\, \lambda _3)$
are the square-root of eigenvalues of the right Cauchy–Green tensor: $\boldsymbol{C} ={\boldsymbol{F}}^T \boldsymbol{\cdot }\boldsymbol{F}$
. The maximum principal strain, which will be analysed, is
$\boldsymbol{C} ={\boldsymbol{F}}^T \boldsymbol{\cdot }\boldsymbol{F}$
. The maximum principal strain, which will be analysed, is
 \begin{equation} \varepsilon _{{\textit{max}}} = \max \left ( \frac {\lambda _1^2 - 1 }{2}, \frac {\lambda _2^2 - 1 }{2}, \frac {\lambda _3^2 - 1 }{2}\right)\!. \end{equation}
Therefore, the material degradation model described in (2.14) through (2.16) limits $\varepsilon _{{\textit{max}}}$
to a maximum of
$\varepsilon _{{\textit{max}}}$
to a maximum of $(\lambda _f^2 - 1)/2$
in the undegraded material.
$(\lambda _f^2 - 1)/2$
in the undegraded material.
2.4. Bubble representation
For an homogeneous inviscid adiabatic gas, the pressure $p_b$
and volume
$p_b$
and volume $V_b$
of the bubble follows
$V_b$
of the bubble follows
 \begin{equation} p_bV_b^{\gamma } = p_{b0} V_{b0}^{\gamma }, \end{equation}
where $V_{b0}$
is the initial volume of the bubble and we take
$V_{b0}$
is the initial volume of the bubble and we take $\gamma =1.4$
. The bubble pressure contributes to the boundary condition for the liquid on the bubble surface.
$\gamma =1.4$
. The bubble pressure contributes to the boundary condition for the liquid on the bubble surface.
The bubble interface is treated differently than the material $\phi$
boundary. It is represented by the
$\phi$
boundary. It is represented by the $\psi =0$
level set of advected field variable
$\psi =0$
level set of advected field variable $\psi$
,
$\psi$
,
 \begin{equation} \frac {\partial \psi }{\partial t} + \boldsymbol{u}\boldsymbol{\cdot }\boldsymbol{\nabla }\psi = 0, \end{equation}
with a constrained fourth-order least-squares method, consistent with the discretisation, that enforces kinematic and dynamic conditions. The continuity of the velocity,
 \begin{equation} \left [ \boldsymbol{u} \right] = 0, \end{equation}
and the deformation gradient tensor,
 \begin{equation} \left [ \boldsymbol{F} \right] = 0, \end{equation}
are the kinematic conditions at the bubble interface, with the liquid–gas ( $l$
–
$l$
– $g$
) jump condition for any variable
$g$
) jump condition for any variable $\chi$
defined as
$\chi$
defined as
 \begin{equation} \left [\chi \right] = \chi _l - \chi _g. \end{equation}
The two dynamic interface conditions needed for axisymmetric flow without swirl are
 \begin{equation} p_l = p_g + 2\mu _l\frac {\partial u_n}{\partial n} + \sigma \left ( \kappa _1 + \kappa _2\right) \end{equation}
and
 \begin{equation} \mu _l\left ( \frac {\partial u_s}{\partial n} + \frac {\partial u_n}{\partial s}\right) = 0, \end{equation}
where $n$
is the local normal coordinate and
$n$
is the local normal coordinate and $s$
is the relevant local tangent coordinate. The two principle curvatures of the bubble interface,
$s$
is the relevant local tangent coordinate. The two principle curvatures of the bubble interface, $\kappa _1$
and
$\kappa _1$
and $\kappa _2$
, are
$\kappa _2$
, are
 \begin{equation} \kappa _1 = \boldsymbol{\nabla }\boldsymbol{\cdot }\left ( \frac {\boldsymbol{\nabla }\psi }{\lvert \boldsymbol{\nabla }\psi \rvert }\right) \qquad \mathrm{and} \qquad \kappa _2 = \frac {1}{r} \frac {\psi _r}{\lvert \boldsymbol{\nabla }\psi \rvert }. \end{equation}
Bubble contact with the undegraded material is minimal, so the choice of
 \begin{equation} \frac {\partial \phi }{\partial n} = 0 \end{equation}
on the bubble surface is inconsequential.
2.5. Discretisation
The flow equations (2.11) and (2.10) are discretised on a staggered mesh using a standard second-order fractional-step method (Chorin Reference Chorin1967) with second-order Runge–Kutta time integration of (2.10), (2.14), (2.18) and (2.21). The time step size is computed adaptively such that the following stability criteria is satisfied (Kang, Fedkiw & Liu Reference Kang, Fedkiw and Liu2000):
 \begin{equation} \Delta t \frac {C_c+C_v+\sqrt {\left (C_c + C_v\right)^2 + 4C_{\textit{sft}}^2}}{2} \leqslant 0.5, \end{equation}
where
 \begin{equation} C_c=\frac {u_{\textit{max}}+v_{\textit{max}}}{\Delta x},\quad C_v=\left (\frac {\overline {\mu }}{\rho }\right)\left (\frac {4.0}{\Delta x^2}\right)\!,\quad C_{\textit{sft}}=\sqrt {\frac {\sigma \lvert \kappa _1+\kappa _2\rvert }{\Delta x^2}}, \end{equation}
and $u_{\textit{max}}$
and
$u_{\textit{max}}$
and $v_{\textit{max}}$
are the maximum magnitudes of the velocity components in the computation domain. The advection terms in (2.14), (2.18) and (2.21) are discretised using a fifth-order WENO scheme (Jiang & Shu Reference Jiang and Shu1996). The use of the fifth-order WENO method for discretisation of the advection term
$v_{\textit{max}}$
are the maximum magnitudes of the velocity components in the computation domain. The advection terms in (2.14), (2.18) and (2.21) are discretised using a fifth-order WENO scheme (Jiang & Shu Reference Jiang and Shu1996). The use of the fifth-order WENO method for discretisation of the advection term $\boldsymbol{u}\boldsymbol{\cdot }\boldsymbol{\nabla }\boldsymbol{F}$
in (2.18) sufficiently preserved the incompressibility constraint
$\boldsymbol{u}\boldsymbol{\cdot }\boldsymbol{\nabla }\boldsymbol{F}$
in (2.18) sufficiently preserved the incompressibility constraint $ (\boldsymbol{\nabla }\boldsymbol{\cdot }\boldsymbol{F} = \boldsymbol{0})$
. We also note that the degradation makes the accuracy of
$ (\boldsymbol{\nabla }\boldsymbol{\cdot }\boldsymbol{F} = \boldsymbol{0})$
. We also note that the degradation makes the accuracy of $\boldsymbol{F}$
immaterial before widespread and strong gradients can arise.
$\boldsymbol{F}$
immaterial before widespread and strong gradients can arise.
The interfacial conditions at the bubble surface (2.22)–(2.28) are enforced by extending the $\boldsymbol{u}$
,
$\boldsymbol{u}$
, $p$
,
$p$
, $\boldsymbol{F}$
and
$\boldsymbol{F}$
and $\phi$
fields from the liquid phase near the interface to the grid points in the gas phase across the interface (Caiden, Fedkiw & Anderson Reference Caiden, Fedkiw and Anderson2001; Popinet & Zaleski Reference Popinet and Zaleski2002) using a fourth-order least-square reconstruction that is constrained to be divergence-free on the boundary, with (2.25) and (2.26) imposed as linear constraints in the least-squares fit. The pressure in the liquid and the gas are coupled at the bubble interface through (2.25). The
$\phi$
fields from the liquid phase near the interface to the grid points in the gas phase across the interface (Caiden, Fedkiw & Anderson Reference Caiden, Fedkiw and Anderson2001; Popinet & Zaleski Reference Popinet and Zaleski2002) using a fourth-order least-square reconstruction that is constrained to be divergence-free on the boundary, with (2.25) and (2.26) imposed as linear constraints in the least-squares fit. The pressure in the liquid and the gas are coupled at the bubble interface through (2.25). The $\boldsymbol{F}$
and
$\boldsymbol{F}$
and $\phi$
fields are extrapolated with appropriate constraints into the bubble with a second-order least-squares reconstruction, though these are not particularly important on the bubble. This scheme is implemented in the AMReX adaptive mesh refinement engine (Zhang et al. Reference Zhang2019).
$\phi$
fields are extrapolated with appropriate constraints into the bubble with a second-order least-squares reconstruction, though these are not particularly important on the bubble. This scheme is implemented in the AMReX adaptive mesh refinement engine (Zhang et al. Reference Zhang2019).
The discretised domain spans $\pm 240D_0$
in
$\pm 240D_0$
in $x$
and extends radially to
$x$
and extends radially to $r = 240D_0$
, which provides results that are independent of the domain size. The symmetry axis is
$r = 240D_0$
, which provides results that are independent of the domain size. The symmetry axis is $r=0$
. The pressure on the other three boundaries is
$r=0$
. The pressure on the other three boundaries is $p_{\infty }$
from (2.1) with
$p_{\infty }$
from (2.1) with $\boldsymbol{\nabla }\boldsymbol{u}\boldsymbol{\cdot }\boldsymbol{n}=\boldsymbol{0}$ $ (\mathrm{where}\,\boldsymbol{n}\,\mathrm{is\,unit\,vector\,normal\,to\,the\,boundary})$
to allow fluid flow through the domain boundary. Adaptive mesh refinement provides resolution near the bubble (
$ (\mathrm{where}\,\boldsymbol{n}\,\mathrm{is\,unit\,vector\,normal\,to\,the\,boundary})$
to allow fluid flow through the domain boundary. Adaptive mesh refinement provides resolution near the bubble ( $\psi = 0$
) and the damage boundary
$\psi = 0$
) and the damage boundary $(\phi =0)$
. The coarsest mesh has
$(\phi =0)$
. The coarsest mesh has $D_0 = 0.13 \Delta x$
with resolution doubled at every level of refinement.
$D_0 = 0.13 \Delta x$
with resolution doubled at every level of refinement.
2.6. Demonstration: spherical bubble oscillations
The accuracy of the method, domain size and discretisation, particularly bubble-volume conservation, is assessed for the same computational domain against an accurate numerical solution of the infinite-domain Rayleigh–Plesset equation,
 \begin{equation} R\ddot {R} + \frac {3}{2} \dot {R}^2 = \frac {1}{\rho }\left [p_{b0}\left ( \frac {R_0}{R}\right)^{3 \gamma } - p_{\infty } - \frac {4 \mu \dot {R}}{R} - \frac {2\sigma }{R}\right]\!, \end{equation}
where $R(t)$
is the bubble radius. The initial bubble radius
$R(t)$
is the bubble radius. The initial bubble radius $R(0) = 5\,\unicode{x03BC} \mathrm{m}$
and its initial pressure is
$R(0) = 5\,\unicode{x03BC} \mathrm{m}$
and its initial pressure is $p_{b0} = 10 p_{\infty }$
with
$p_{b0} = 10 p_{\infty }$
with $\mu =0.002$
Pa s and
$\mu =0.002$
Pa s and $\sigma =0.072$
N m−1. The equilibrium bubble diameter
$\sigma =0.072$
N m−1. The equilibrium bubble diameter $D_0$
in this case is
$D_0$
in this case is $16.7\,\unicode{x03BC} \mathrm{m}$
. The diameter
$16.7\,\unicode{x03BC} \mathrm{m}$
. The diameter $D(t)$
shows only a slow accumulation of error over many cycles in figure 3. The decay of amplitude due to viscous dissipation is also well reproduced. Errors do, of course, accumulate with time, though even the coarsest resolution might be considered to provide sufficient accuracy for our objectives.
$D(t)$
shows only a slow accumulation of error over many cycles in figure 3. The decay of amplitude due to viscous dissipation is also well reproduced. Errors do, of course, accumulate with time, though even the coarsest resolution might be considered to provide sufficient accuracy for our objectives.
Comparison of the axisymmetric adaptive-mesh solver with an accurate (spherical) free-space Rayleigh–Plesset (2.31) solution for the evolution of the bubble diameter $D(t)$
. The initial condition is
$D(t)$
. The initial condition is $R(0) = 5.0\,\unicode{x03BC}$
m with
$R(0) = 5.0\,\unicode{x03BC}$
m with $\mu = 0.002$
Pa s and
$\mu = 0.002$
Pa s and $p_{b0}= 10 p_{0}$
.
$p_{b0}= 10 p_{0}$
.

The $L_2$
error in calculation of the bubble diameter over the duration of the calculation is
$L_2$
error in calculation of the bubble diameter over the duration of the calculation is
 \begin{equation} \epsilon _{L_2} = \frac {\int _{0}^{30D_0\sqrt {\frac {\rho _l}{p_{\infty }}}}\left (D\left (t\right)-D_{rp}\left (t\right)\right)^2 \,{\rm d}t}{\int _{0}^{30D_0\sqrt {\frac {\rho _l}{p_{\infty }}}}D_{rp}\left (t\right)^2\, {\rm d}t}. \end{equation}
This $L_2$
error decreases from 0.0271 to 0.0022 for resolution increase from
$L_2$
error decreases from 0.0271 to 0.0022 for resolution increase from $D_0/\Delta x = 34$
to
$D_0/\Delta x = 34$
to $200$
, with a well-fitted
$200$
, with a well-fitted $\epsilon _{L_2} \propto \Delta x^{1.4}$
behaviour. Even though most components of the algorithm are at least second order, full second-order convergence for this quantity is not expected because it entails so many coupled components. However, convergence is sufficient for our goals, as is the 1.2 % error for
$\epsilon _{L_2} \propto \Delta x^{1.4}$
behaviour. Even though most components of the algorithm are at least second order, full second-order convergence for this quantity is not expected because it entails so many coupled components. However, convergence is sufficient for our goals, as is the 1.2 % error for $D_0/\Delta x = 68$
, which is the main resolution we use. This case also was used to confirm that a computation domain extending to
$D_0/\Delta x = 68$
, which is the main resolution we use. This case also was used to confirm that a computation domain extending to $r = 60 D_0$
from the bubble centre was sufficient to show domain size independence over 14 bubble cycles. With the adaptive meshing, extending to
$r = 60 D_0$
from the bubble centre was sufficient to show domain size independence over 14 bubble cycles. With the adaptive meshing, extending to $r = 240D_0$
provided additional confidence of this at a modest cost. To confirm implementation and selected resolution, the evolution of a pressurised bubble near a wall was also simulated with these same parameters and confirmed to match closely the Popinet & Zaleski (Reference Popinet and Zaleski2002) simulations that also reproduce the Lauterborn & Ohl (Reference Lauterborn and Ohl1997) experiment.
$r = 240D_0$
provided additional confidence of this at a modest cost. To confirm implementation and selected resolution, the evolution of a pressurised bubble near a wall was also simulated with these same parameters and confirmed to match closely the Popinet & Zaleski (Reference Popinet and Zaleski2002) simulations that also reproduce the Lauterborn & Ohl (Reference Lauterborn and Ohl1997) experiment.
3. Bubble tunnelling
Taking $p_a = 2.5p_0$
,
$p_a = 2.5p_0$
, $f = f_n$
and
$f = f_n$
and $\unicode{x03BC} ^* = 10$
yields tunnelling, the mechanisms of which are analysed in this section. Parametric dependencies are considered in the following sections. Figure 4 visualises early development as the bubble travels approximately
$\unicode{x03BC} ^* = 10$
yields tunnelling, the mechanisms of which are analysed in this section. Parametric dependencies are considered in the following sections. Figure 4 visualises early development as the bubble travels approximately $2.5D_0$
over 42 cycles, extending the initial proto-tunnel. The centre-of-mass location of the bubble
$2.5D_0$
over 42 cycles, extending the initial proto-tunnel. The centre-of-mass location of the bubble $x_c$
, degradation front location
$x_c$
, degradation front location $x_d$
and the distance of the centre of mass of the bubble from the degradation front
$x_d$
and the distance of the centre of mass of the bubble from the degradation front $\delta x_b = x_c - x_d$
are defined in figure 4(c). The evolution of
$\delta x_b = x_c - x_d$
are defined in figure 4(c). The evolution of $x_c$
,
$x_c$
, $x_d$
and bubble volume
$x_d$
and bubble volume $V_b$
are shown in figure 5. The bubble volume
$V_b$
are shown in figure 5. The bubble volume $V_b$
tracks a nearly periodic expand-and-collapse cycle after approximately four cycles, and there is steady tunnelling after approximately 10 cycles. The rate of growth of the tunnel to the left
$V_b$
tracks a nearly periodic expand-and-collapse cycle after approximately four cycles, and there is steady tunnelling after approximately 10 cycles. The rate of growth of the tunnel to the left $u_D = 0.034u_0$
is computed from the slope of a least-squares linear fit to
$u_D = 0.034u_0$
is computed from the slope of a least-squares linear fit to $x_d(t)$
between
$x_d(t)$
between $\textit{tf} = 40$
and
$\textit{tf} = 40$
and $100$
(figure 5). Figure 6(a) confirms that
$100$
(figure 5). Figure 6(a) confirms that $u_D$
converges with increasing mesh resolution and that the
$u_D$
converges with increasing mesh resolution and that the $D_0 = 68 \Delta x$
case is close to (7.9 % less) the highest mesh density (
$D_0 = 68 \Delta x$
case is close to (7.9 % less) the highest mesh density ( $D_0= 136 \Delta x$
) case. Similarly,
$D_0= 136 \Delta x$
) case. Similarly, $V_b(t)$
in figure 6(b) shows mesh independence for
$V_b(t)$
in figure 6(b) shows mesh independence for $D_0 \gtrsim 68 \Delta x$
. The results obtained using the mesh resolution corresponding to
$D_0 \gtrsim 68 \Delta x$
. The results obtained using the mesh resolution corresponding to $D_0 = 68 \Delta x$
are used for the analysis of the tunnelling phenomenon.
$D_0 = 68 \Delta x$
are used for the analysis of the tunnelling phenomenon.
Establishment of a tunnel through the undegraded high viscosity fluid (black) for $p_{a}=2.5 p_{0}$
,
$p_{a}=2.5 p_{0}$
, $p_{b0}=20 p_{0}$
,
$p_{b0}=20 p_{0}$
, $f = f_n$
,
$f = f_n$
, $\mu ^* = \mu _2/\mu _1 = 10$
and
$\mu ^* = \mu _2/\mu _1 = 10$
and $\lambda _f = 1.5$
at (a)
$\lambda _f = 1.5$
at (a) $tf = 0$
, (b)
$tf = 0$
, (b) $tf = 20$
and (c)
$tf = 20$
and (c) $tf = 42$
. The bubble interface
$tf = 42$
. The bubble interface $\psi = 0$
is the black contour, which is dash-dotted to indicate its initial position in panel (c).
$\psi = 0$
is the black contour, which is dash-dotted to indicate its initial position in panel (c).

Evolution of the degradation front $x_d$
(defined in figure 4
c), the centre of mass of the bubble
$x_d$
(defined in figure 4
c), the centre of mass of the bubble $x_c$
and the volume of the bubble
$x_c$
and the volume of the bubble $V_b$
during tunnelling are shown. The acoustic excitation and the material parameters in this calculation are
$V_b$
during tunnelling are shown. The acoustic excitation and the material parameters in this calculation are $p_{a} =2.5p_{0}$
,
$p_{a} =2.5p_{0}$
, $p_{b0} =20 p_{0}$
,
$p_{b0} =20 p_{0}$
, $f = f_n$
,
$f = f_n$
, $\mu ^* = 10$
and
$\mu ^* = 10$
and $\lambda _f = 1.5$
.
$\lambda _f = 1.5$
.

(a) Rate of tunnel growth $u_D$
and (b) bubble volume
$u_D$
and (b) bubble volume $V_b$
for increasing grid resolution for
$V_b$
for increasing grid resolution for $p_{a}=2.5 p_{0}$
,
$p_{a}=2.5 p_{0}$
, $f = f_n$
and
$f = f_n$
and $\mu ^* = 10$
.
$\mu ^* = 10$
.

The initial and the steady tunnelling differ qualitatively. Tunnel growth during the first cycle $ (tf=0.03{-}1.05)$
and for steady tunnelling
$ (tf=0.03{-}1.05)$
and for steady tunnelling $ (tf=38.5{-}39.5)$
are shown in figures 7 and 8.
$ (tf=38.5{-}39.5)$
are shown in figures 7 and 8.
Bubble dynamics for $p_{a}=2.5 p_{0}$
,
$p_{a}=2.5 p_{0}$
, $f = f_n$
and
$f = f_n$
and $\mu ^* = 10$
during the first excitation cycle for the times as labelled. The boundary of the undamaged material is red and the boundary of the bubble is black. The velocity field at the top of each frame is shown with vectors and increasing dark levels for larger
$\mu ^* = 10$
during the first excitation cycle for the times as labelled. The boundary of the undamaged material is red and the boundary of the bubble is black. The velocity field at the top of each frame is shown with vectors and increasing dark levels for larger $|\boldsymbol{u}|$
. The bottom of each frame shows the local maximum principal strain field
$|\boldsymbol{u}|$
. The bottom of each frame shows the local maximum principal strain field $\varepsilon _{{\textit{max}}}$
.
$\varepsilon _{{\textit{max}}}$
.

Evolution of the bubble and the tunnel over an excitation cycle for $p_{a}=2.5 p_0$
,
$p_{a}=2.5 p_0$
, $f = f_n$
and
$f = f_n$
and $\mu ^* = 10$
during steady tunnelling, approximately 35 cycles after the times visualised in figure 7. The upper portions show velocity vectors and
$\mu ^* = 10$
during steady tunnelling, approximately 35 cycles after the times visualised in figure 7. The upper portions show velocity vectors and $|\boldsymbol{u}|$
, and the lower portions show peak principle strain
$|\boldsymbol{u}|$
, and the lower portions show peak principle strain $\varepsilon _{{\textit{max}}}$
.
$\varepsilon _{{\textit{max}}}$
.

3.1. Initial tunnelling: material degradation due to jetting collapse of the the bubble
The initial high pressure in the bubble leads to its expansion followed by a jetting collapse. Figure 7(a) shows the initial expansion of the bubble with minimum $p_b =0.24 p_0$
before reversing at
$p_b =0.24 p_0$
before reversing at $tf \approx 0.5$
. Figure 7(b) shows the corresponding strain in the surrounding material. The subsequent collapse is asymmetric. Figure 7(c) shows that the velocity of the bubble surface is smaller adjacent to the undegraded viscous material, which leads to the formation of a jet towards the undegraded material (figure 7
d). This jet eventually crosses the bubble, transiently forming a toroidal bubble (figure 7
e). Figures 7(e) and 7(f) show that the undegraded material adjacent to the bubble is strained as the jet impinges on it. As the toroidal bubble expands, the liquid bridge at the centre of the bubble breaks, as seen in figure 7(g). Finally, figure 7(h) shows the rebound to a nearly spherical expanded shape. During this expansion, the undegraded material around the bubble is also stretched, causing further degradation. Although jetting is important in this initial phase for this initial condition, it does not persist into the steady tunnelling phase.
$tf \approx 0.5$
. Figure 7(b) shows the corresponding strain in the surrounding material. The subsequent collapse is asymmetric. Figure 7(c) shows that the velocity of the bubble surface is smaller adjacent to the undegraded viscous material, which leads to the formation of a jet towards the undegraded material (figure 7
d). This jet eventually crosses the bubble, transiently forming a toroidal bubble (figure 7
e). Figures 7(e) and 7(f) show that the undegraded material adjacent to the bubble is strained as the jet impinges on it. As the toroidal bubble expands, the liquid bridge at the centre of the bubble breaks, as seen in figure 7(g). Finally, figure 7(h) shows the rebound to a nearly spherical expanded shape. During this expansion, the undegraded material around the bubble is also stretched, causing further degradation. Although jetting is important in this initial phase for this initial condition, it does not persist into the steady tunnelling phase.
3.2. Steady tunnelling: the move-expand-stretch(-repeat) mechanism
The bubble dynamics during the steady growth of the tunnel are visualised in figure 8. Figure 8(a) shows the peak bubble volume when velocity is small and high strain extends ahead of the bubble, degrading the material. The low bubble pressure initiates the subsequent collapse (figure 8 b), during which the acceleration of the bubble interface towards the bubble centre is non-uniformly impeded by the viscosity of the material, and the surface furthest from the undegraded material achieves the highest speed inward. The resulting asymmetry of the bubble shape is measured by its sphericity
 \begin{equation} \varPsi \left (t\right) =\frac { \pi ^{\frac {1}{3}} [6V_b(t)]^{\frac {2}{3}} }{ A_b\left (t\right) }, \end{equation}
where $A_b$
is its surface area. It is nearly spherical (
$A_b$
is its surface area. It is nearly spherical ( $\varPsi \approx 1$
) at
$\varPsi \approx 1$
) at $tf = 38.5$
near maximum volume (figure 8
a). However, as the bubble starts to collapse,
$tf = 38.5$
near maximum volume (figure 8
a). However, as the bubble starts to collapse, $\varPsi$
decreases, but the minimum is only
$\varPsi$
decreases, but the minimum is only $\varPsi _{{\textit{min}}}\approx 0.95$
at
$\varPsi _{{\textit{min}}}\approx 0.95$
at $tf = 38.8$
. The corresponding shape of the bubble is shown in figure 8(c). Formation of a high speed re-entrant jet during steady tunnelling is not observed in this calculation. Figure 8(c) shows thats the bubble is further from the leading edge of the tunnel, which reduces the asymmetry in the viscous resistance it experiences. The cycle-averaged distance of the bubble centre from the tunnel end increases to
$tf = 38.8$
. The corresponding shape of the bubble is shown in figure 8(c). Formation of a high speed re-entrant jet during steady tunnelling is not observed in this calculation. Figure 8(c) shows thats the bubble is further from the leading edge of the tunnel, which reduces the asymmetry in the viscous resistance it experiences. The cycle-averaged distance of the bubble centre from the tunnel end increases to $\overline {\delta x}_b = \overline {x_c - x_d} \approx 0.84 D_0$
. At this distance, the asymmetry in the viscous resistance continues to cause the bubble to deform, though insufficiently for jetting collapse. The velocity vectors in figure 8(c), at the minimum bubble volume, indicate a net flow of the degraded material towards the leading end of the tunnel. Its momentum to the left is quantified by
$\overline {\delta x}_b = \overline {x_c - x_d} \approx 0.84 D_0$
. At this distance, the asymmetry in the viscous resistance continues to cause the bubble to deform, though insufficiently for jetting collapse. The velocity vectors in figure 8(c), at the minimum bubble volume, indicate a net flow of the degraded material towards the leading end of the tunnel. Its momentum to the left is quantified by
 \begin{equation} M_{-x} = -\int _{V_c} \frac {1 - \phi }{2}\rho u\,{\rm d}V, \end{equation}
where $V_c$
is the computational domain. Figure 9(a) shows that
$V_c$
is the computational domain. Figure 9(a) shows that $M_{-x}$
peaks during the collapse, pulling the bubble along the tunnel and keeping it near the growing tunnel front. The small net displacement of the bubble during its collapse is shown in figure 9(b). The time series plot of
$M_{-x}$
peaks during the collapse, pulling the bubble along the tunnel and keeping it near the growing tunnel front. The small net displacement of the bubble during its collapse is shown in figure 9(b). The time series plot of $x_c$
in figure 9(c) also shows the asymmetric fast movement of the bubble centre during the collapse.
$x_c$
in figure 9(c) also shows the asymmetric fast movement of the bubble centre during the collapse.
Steady tunnelling behaviour: (a) the time evolution of normalised net momentum $M_{-x}$
from (3.2) of the degraded material along and the bubble volume
$M_{-x}$
from (3.2) of the degraded material along and the bubble volume $V_b$
; (b) the displacement of the bubble interface (black line) and the interface between the undegraded and the degraded material (red line) during one complete cycle of oscillation between
$V_b$
; (b) the displacement of the bubble interface (black line) and the interface between the undegraded and the degraded material (red line) during one complete cycle of oscillation between $tf = 38.5$
and
$tf = 38.5$
and $39.5$
of the bubble; and (c) the time evolution of
$39.5$
of the bubble; and (c) the time evolution of $x_c$
,
$x_c$
, $x_d$
and
$x_d$
and $V_b$
.
$V_b$
.

The subsequent rebound of the bubble from its collapsed state strains the undegraded material surrounding the tunnel end. The $\varepsilon _{{\textit{max}}}$
visualised in figure 8 shows increase in
$\varepsilon _{{\textit{max}}}$
visualised in figure 8 shows increase in $\varepsilon _{{\textit{max}}}$
at the tunnel end as the bubble expands. It is only during the expansion phase, seen in figures 8(a), 8(e) and 8(f), that the undegraded material around the bubble is strained beyond its threshold
$\varepsilon _{{\textit{max}}}$
at the tunnel end as the bubble expands. It is only during the expansion phase, seen in figures 8(a), 8(e) and 8(f), that the undegraded material around the bubble is strained beyond its threshold $\lambda _f$
. The growth of the tunnel over one oscillation is also visualised in figure 9(b). The history of
$\lambda _f$
. The growth of the tunnel over one oscillation is also visualised in figure 9(b). The history of $x_d$
and
$x_d$
and $x_c$
in figure 9(c) shows that the bubble travels left during the collapse phase of the bubble. In sum, it is a move-expand-stretch(-repeat) mechanism that grows the tunnel.
$x_c$
in figure 9(c) shows that the bubble travels left during the collapse phase of the bubble. In sum, it is a move-expand-stretch(-repeat) mechanism that grows the tunnel.
4. Dependence on material properties
Changing the undegraded material viscosity $\mu _2$
, damage threshold
$\mu _2$
, damage threshold $\lambda _f$
, bubble surface-tension
$\lambda _f$
, bubble surface-tension $\sigma$
and the acoustic forcing changes the tunnelling rate with some interesting threshold behaviours. However, the basic mechanisms of tunnelling do not change qualitatively.
$\sigma$
and the acoustic forcing changes the tunnelling rate with some interesting threshold behaviours. However, the basic mechanisms of tunnelling do not change qualitatively.
4.1.
Effect of material viscosity $\mu ^*$

Varying $\mu ^* = \mu _2/\mu _1$
from
$\mu ^* = \mu _2/\mu _1$
from $2$
to
$2$
to $25$
, keeping
$25$
, keeping $\mu _1 = 0.001$
Pa s, shows a jump in the tunnelling rate (figure 10
a):
$\mu _1 = 0.001$
Pa s, shows a jump in the tunnelling rate (figure 10
a): $u_D$
increases approximately linearly from
$u_D$
increases approximately linearly from $\mu ^* = 2$
to
$\mu ^* = 2$
to $6.45$
, which is unexpected since greater viscosity might be anticipated to resist strain. It then surprisingly drops by half at an apparent
$6.45$
, which is unexpected since greater viscosity might be anticipated to resist strain. It then surprisingly drops by half at an apparent $\mu ^*$
threshold between 6.45 and 6.7. For larger
$\mu ^*$
threshold between 6.45 and 6.7. For larger $\mu ^*$
, it changes only modestly, suggesting an apparently constant value for
$\mu ^*$
, it changes only modestly, suggesting an apparently constant value for $\mu ^* \gtrsim 20$
. The details of the move-expand-stretch mechanism explain this behaviour. The tunnel growth rate is determined by two factors: (1) the bubble translation rate towards the growing tunnel end during its collapse phase and (2) the extent of strain-induced degradation during its subsequent expansion. Increasing the viscosity of the undegraded material influences both of these, which in turn leads to the non-monotonic tunnelling speed. The drop in tunnelling rate corresponds to a significant drop in maximum bubble volume
$\mu ^* \gtrsim 20$
. The details of the move-expand-stretch mechanism explain this behaviour. The tunnel growth rate is determined by two factors: (1) the bubble translation rate towards the growing tunnel end during its collapse phase and (2) the extent of strain-induced degradation during its subsequent expansion. Increasing the viscosity of the undegraded material influences both of these, which in turn leads to the non-monotonic tunnelling speed. The drop in tunnelling rate corresponds to a significant drop in maximum bubble volume $V_{b,{\textit{max}}}$
due to a switch from inertia to viscosity-dominated dynamics. Figure 10(b) shows that the
$V_{b,{\textit{max}}}$
due to a switch from inertia to viscosity-dominated dynamics. Figure 10(b) shows that the $V_{b,{\textit{max}}}$
abruptly decreases by a factor of 5, as seen from spherical models, for which the viscous resistance suddenly overwhelms inertial expansion (Freund Reference Freund2008; Movahed et al. Reference Movahed, Kreider, Maxwell, Hutchens and Freund2016). This is reflected in
$V_{b,{\textit{max}}}$
abruptly decreases by a factor of 5, as seen from spherical models, for which the viscous resistance suddenly overwhelms inertial expansion (Freund Reference Freund2008; Movahed et al. Reference Movahed, Kreider, Maxwell, Hutchens and Freund2016). This is reflected in ${\textit{Re}}_D \approx 1$
for
${\textit{Re}}_D \approx 1$
for $\mu ^*\gtrsim 6.5$
in figure 10(c). Increasing
$\mu ^*\gtrsim 6.5$
in figure 10(c). Increasing $\mu ^*$
also increases environment asymmetry, inducing asphericity in bubble shape during its inertial collapse (figure 10
d). This has a corresponding increase in the net flow of the degraded material towards the growing end of the tunnel, reflected in the maximum value of
$\mu ^*$
also increases environment asymmetry, inducing asphericity in bubble shape during its inertial collapse (figure 10
d). This has a corresponding increase in the net flow of the degraded material towards the growing end of the tunnel, reflected in the maximum value of $M_{-x}\, (M_{-x,{\textit{max}}})$
in figure 10(e), increasing the translation of the bubble during the collapse phase.
$M_{-x}\, (M_{-x,{\textit{max}}})$
in figure 10(e), increasing the translation of the bubble during the collapse phase.
Effect of $\mu ^*$
on tunnelling: (a) tunnelling speed
$\mu ^*$
on tunnelling: (a) tunnelling speed $u_D$
; (b) maximum bubble volume
$u_D$
; (b) maximum bubble volume $V_{b,{\textit{max}}}$
; (c)
$V_{b,{\textit{max}}}$
; (c) ${{ Re}}_D$
; (d) minimum sphericity
${{ Re}}_D$
; (d) minimum sphericity $\varPsi$
during the stable oscillation; (e) peak momentum
$\varPsi$
during the stable oscillation; (e) peak momentum $M_{-x,{\textit{max}}}$
of the degraded material towards the tunnel end during bubble collapse; and (f) average distance
$M_{-x,{\textit{max}}}$
of the degraded material towards the tunnel end during bubble collapse; and (f) average distance $\overline {\delta x}_b$
of the bubble centre from the tunnel end.
$\overline {\delta x}_b$
of the bubble centre from the tunnel end.

The maximum expansion of the bubble is suppressed for $\mu ^*\gtrsim 6.5$
, so the tunnel extension due to the expansion of the bubble and the bubble movement in the subsequent collapse phase are both suppressed due to the high viscosity of the undegraded material. However, even with the suppressed expansion, it still stretches the undegraded material beyond
$\mu ^*\gtrsim 6.5$
, so the tunnel extension due to the expansion of the bubble and the bubble movement in the subsequent collapse phase are both suppressed due to the high viscosity of the undegraded material. However, even with the suppressed expansion, it still stretches the undegraded material beyond $\lambda _f$
because the bubble in this case sits closer to the tunnel end. Specifically, figure 10(f) shows that
$\lambda _f$
because the bubble in this case sits closer to the tunnel end. Specifically, figure 10(f) shows that $\overline {\delta x}_b$
also has a step decrease near
$\overline {\delta x}_b$
also has a step decrease near $\mu ^* = 6.5$
. The visualisations in figure 11 show the lengths and shapes of the tunnel at
$\mu ^* = 6.5$
. The visualisations in figure 11 show the lengths and shapes of the tunnel at $tf \approx 42.8$
for selected
$tf \approx 42.8$
for selected $\mu ^*$
. The tunnels are wider for
$\mu ^*$
. The tunnels are wider for $\mu ^* \lesssim 6.5$
due to the greater expansion.
$\mu ^* \lesssim 6.5$
due to the greater expansion.
Shapes of the tunnels and the bubble at $tf = 42.8$
for
$tf = 42.8$
for $\mu ^*=2,\,6.45,\,10\,\mathrm{and}\,25$
are shown with
$\mu ^*=2,\,6.45,\,10\,\mathrm{and}\,25$
are shown with $\phi = 0$
(solid) and
$\phi = 0$
(solid) and $\psi = 0$
(dashed) contours.
$\psi = 0$
(dashed) contours.

4.2.
Effect of stretch threshold
$\lambda _f$

Stretch thresholds $\lambda _f = 1.50$
,
$\lambda _f = 1.50$
, $2.24$
and
$2.24$
and $\infty$
(no degradation) in figure 12 show, as expected, that bubble moves less for higher
$\infty$
(no degradation) in figure 12 show, as expected, that bubble moves less for higher $\lambda _f$
. The expansion is more suppressed due to the viscous resistance when
$\lambda _f$
. The expansion is more suppressed due to the viscous resistance when $\lambda _f$
is increased, with the maximum volume of the bubble decreasing for larger
$\lambda _f$
is increased, with the maximum volume of the bubble decreasing for larger $\lambda _f$
(see table 1). However, the mean distance of the bubble centre from the tunnel end
$\lambda _f$
(see table 1). However, the mean distance of the bubble centre from the tunnel end $\overline {\delta x}_b$
decreases at higher
$\overline {\delta x}_b$
decreases at higher $\lambda _f$
, so the tunnel still grows with bubble expansion in each cycle. The long time to reach the equilibrium growth rate in figure 12 for
$\lambda _f$
, so the tunnel still grows with bubble expansion in each cycle. The long time to reach the equilibrium growth rate in figure 12 for $\lambda _f = 2.4$
is due to the relatively long time it takes for the bubble to reach its equilibrium
$\lambda _f = 2.4$
is due to the relatively long time it takes for the bubble to reach its equilibrium $\overline {\delta x}_b$
. The
$\overline {\delta x}_b$
. The $\lambda _f \to \infty$
case is not realistic, but it is informative about the overall model. In this case, there is no degradation, but the bubble translates slowly into the high viscosity region. It stops when its environment is effectively symmetric once it travels a few diameters from the proto-tunnel initial condition.
$\lambda _f \to \infty$
case is not realistic, but it is informative about the overall model. In this case, there is no degradation, but the bubble translates slowly into the high viscosity region. It stops when its environment is effectively symmetric once it travels a few diameters from the proto-tunnel initial condition.
Dependence on damage threshold $\lambda _f$
.
$\lambda _f$
.

Tunnelling for different stretch degradation threshold $\lambda _f$
. The dashed lines are linear fits.
$\lambda _f$
. The dashed lines are linear fits.

4.3.
Effect of surface-tension
$\sigma$

The water–gel system that motivated our parameter selection would give ${\textit{We}}_D = 2.31$
. Figure 13 shows that higher surface tension (smaller
${\textit{We}}_D = 2.31$
. Figure 13 shows that higher surface tension (smaller ${\textit{We}}_D$
) suppresses tunnelling. This is because it suppresses expansion of the bubble and also its migration along the tunnel because the bubble remains more spherical. The behaviour for larger
${\textit{We}}_D$
) suppresses tunnelling. This is because it suppresses expansion of the bubble and also its migration along the tunnel because the bubble remains more spherical. The behaviour for larger ${\textit{We}}_D$
shows the same sudden change of behaviour associated with discontinuous dependence on
${\textit{We}}_D$
shows the same sudden change of behaviour associated with discontinuous dependence on $\mu ^*$
, but likely involves additional factors. The bubble becomes unstable for very low surface tensions, which makes the axisymmetric model less relevant, so this is not explored in detail.
$\mu ^*$
, but likely involves additional factors. The bubble becomes unstable for very low surface tensions, which makes the axisymmetric model less relevant, so this is not explored in detail.
Effect of the bubble surface tension on the tunnelling rate for $p_{a}=2.5 p_{0}$
,
$p_{a}=2.5 p_{0}$
, $p_{b0}=20 p_{0}$
,
$p_{b0}=20 p_{0}$
, $f = f_{n}$
,
$f = f_{n}$
, $\mu ^* = 10$
and
$\mu ^* = 10$
and $\lambda _f = 1.5$
.
$\lambda _f = 1.5$
.

5. Dependence on the acoustic excitation parameters
Larger $p_a$
increases bubble expansion and thereby tunnelling rate
$p_a$
increases bubble expansion and thereby tunnelling rate $u_d$
(figure 14
a), and leads to the formation of wider tunnels because more material is strained by the larger bubbles (figure 14
c), which loosely matches observations of wider tunnels for strong excitation (Caskey et al. Reference Caskey, Qin and Ferrara2009b
). Figure 14(a) shows a sudden increase in
$u_d$
(figure 14
a), and leads to the formation of wider tunnels because more material is strained by the larger bubbles (figure 14
c), which loosely matches observations of wider tunnels for strong excitation (Caskey et al. Reference Caskey, Qin and Ferrara2009b
). Figure 14(a) shows a sudden increase in $u_d$
and
$u_d$
and $V_{b,{\textit{max}}}$
when
$V_{b,{\textit{max}}}$
when $p_a$
exceeds approximately
$p_a$
exceeds approximately $2.75p_0$
. This marks the transition from viscous to inertial behaviour, as reflected in the increase of
$2.75p_0$
. This marks the transition from viscous to inertial behaviour, as reflected in the increase of ${\textit{Re}}_D$
for
${\textit{Re}}_D$
for $p_a\leqslant 2.75p_0$
in figure 14(b). The sudden increase from
$p_a\leqslant 2.75p_0$
in figure 14(b). The sudden increase from ${\textit{Re}}_D \approx 1$
to
${\textit{Re}}_D \approx 1$
to ${\textit{Re}}_D \approx 10$
is similar to the threshold noted in other configurations (Freund Reference Freund2008). This enables greater asymmetry during collapse as seen in figure 14(c). Both the increased expansion and asymmetry contribute to faster tunelling for
${\textit{Re}}_D \approx 10$
is similar to the threshold noted in other configurations (Freund Reference Freund2008). This enables greater asymmetry during collapse as seen in figure 14(c). Both the increased expansion and asymmetry contribute to faster tunelling for $p_a\gtrsim 2.75p_0$
.
$p_a\gtrsim 2.75p_0$
.
Dependence on driving pressure amplitude: (a) tunnel growth rate $u_D$
and maximum bubble volume
$u_D$
and maximum bubble volume $V_{b,{\textit{max}}}$
; (b)
$V_{b,{\textit{max}}}$
; (b) ${\textit{Re}}_D$
and
${\textit{Re}}_D$
and $\varPsi _{{\textit{min}}}$
; and (c) the shape of the tunnel and the bubble are shown with the
$\varPsi _{{\textit{min}}}$
; and (c) the shape of the tunnel and the bubble are shown with the $\phi = 0$
(solid) and
$\phi = 0$
(solid) and $\psi = 0$
(dashed) contours at
$\psi = 0$
(dashed) contours at $tu_0/D_0 = 108.4$
.
$tu_0/D_0 = 108.4$
.

Figure 15 shows that the primary effect of $f$
is also via its impact on the bubble size. Frequencies lower than the natural bubble frequency
$f$
is also via its impact on the bubble size. Frequencies lower than the natural bubble frequency $f_n$
allow larger expansions, which here also cause more strain and damage, and faster and wider tunnelling (figure 15
c). This also aligns with observations (Caskey et al. Reference Caskey, Qin, Dayton and Ferrara2009a
). The odd-looking non-monotonicity in the volumetric expansion
$f_n$
allow larger expansions, which here also cause more strain and damage, and faster and wider tunnelling (figure 15
c). This also aligns with observations (Caskey et al. Reference Caskey, Qin, Dayton and Ferrara2009a
). The odd-looking non-monotonicity in the volumetric expansion $V_{b,{\textit{max}}}$
is a consequence of being near resonance
$V_{b,{\textit{max}}}$
is a consequence of being near resonance $f=f_n$
. However, this is not sufficient to be consequential for the tunnelling: the dissipation in the system is sufficient that the tunnelling rate is essentially unaffected.
$f=f_n$
. However, this is not sufficient to be consequential for the tunnelling: the dissipation in the system is sufficient that the tunnelling rate is essentially unaffected.
Dependence on excitation frequency $f$
: (a) the tunnelling speed
$f$
: (a) the tunnelling speed $u_D$
and maximum volume
$u_D$
and maximum volume $V_{b,{\textit{max}}}$
and (b) the shape of the tunnel and the bubble are shown with the
$V_{b,{\textit{max}}}$
and (b) the shape of the tunnel and the bubble are shown with the $\phi = 0$
(solid) and
$\phi = 0$
(solid) and $\psi = 0$
(dashed) contours at
$\psi = 0$
(dashed) contours at ${tu_0}/{D_0} \approx 105.4$
.
${tu_0}/{D_0} \approx 105.4$
.

6. Effect of initial bubble location
Surprisingly, for many parameters considered, two different steady tunnelling solutions were found, depending on where the bubble was initialised. Results for different initial distances $\delta x_{b0}$
of the bubble from the left end of the initial proto-tunnel in figure 2 are compared in figure 16(a). The calculations with the bubble further from the proto-tunnel end
$\delta x_{b0}$
of the bubble from the left end of the initial proto-tunnel in figure 2 are compared in figure 16(a). The calculations with the bubble further from the proto-tunnel end $ (\delta x_{b0}\geqslant 0.625)$
do not show jetting. After tunnelling is steady, the bubble initiated closer to the tunnel end
$ (\delta x_{b0}\geqslant 0.625)$
do not show jetting. After tunnelling is steady, the bubble initiated closer to the tunnel end $ ({\lesssim}0.9D_0)$
is one-third the speed of the bubbles initiated further from the tunnel end
$ ({\lesssim}0.9D_0)$
is one-third the speed of the bubbles initiated further from the tunnel end $ ({\gtrsim}1.2D_0)$
:
$ ({\gtrsim}1.2D_0)$
: $ u_D= 0.03u_0$
versus
$ u_D= 0.03u_0$
versus $u_D = 0.09u_0$
, as shown in figure 16(b). This increase in the steady tunnelling rate correlates with the
$u_D = 0.09u_0$
, as shown in figure 16(b). This increase in the steady tunnelling rate correlates with the $V_{b,{\textit{max}}}$
of the bubbles: figure 16(b) shows that
$V_{b,{\textit{max}}}$
of the bubbles: figure 16(b) shows that $V_{b,{\textit{max}}}= 14V_{b0}$
, for the cases where the bubble is initiated closer to the tunnel end, versus
$V_{b,{\textit{max}}}= 14V_{b0}$
, for the cases where the bubble is initiated closer to the tunnel end, versus $V_{b,{\textit{max}}}= 72V_{b0}$
, when the bubble is initiated further away. Bubbles nearer the growing end of the tunnel are both more damaging and more asymmetric, which is necessary for translation, but they are also more confined. The bubbles further from the end can grow larger (and do), which promotes both damage and translation. Given this combination of factors, it is not surprising that two (or potentially more) steady tunnelling conditions exist. However, no simple explanation for these two has been found given the complexity of the flow details.
$V_{b,{\textit{max}}}= 72V_{b0}$
, when the bubble is initiated further away. Bubbles nearer the growing end of the tunnel are both more damaging and more asymmetric, which is necessary for translation, but they are also more confined. The bubbles further from the end can grow larger (and do), which promotes both damage and translation. Given this combination of factors, it is not surprising that two (or potentially more) steady tunnelling conditions exist. However, no simple explanation for these two has been found given the complexity of the flow details.
Effect of initial bubble distance from the tunnel end $\delta x_{b0}$
on (a) tunnelling progress, and (b) speed and maximum bubble volume.
$\delta x_{b0}$
on (a) tunnelling progress, and (b) speed and maximum bubble volume.

7. Conclusions
The model introduced, which considers only viscous material and neglects elasticity due to the high frequencies, produces a microbubble tunnelling phenomenon similar to experiments. The tunnels in this model grow through a two-step process: strain causes damage in the expansion phase and the bubble moves towards the end of the tunnel during the collapse phase. Jetting collapse of the bubble is observed for some initial conditions only during the first few cycles of oscillation of the bubble, during which the jet rapidly damages the material at the tunnel end. However, the jetting ceases after a few cycles. The move-expand-stretch(-repeat) mechanism (§ 3) produces the steady tunnelling. Neither jetting nor acoustic radiation force (also neglected) is required.
The viscosity of the fluid, surface tension and degradation threshold influence tunnelling primarily via how they mediate the bubble expansion. There is a threshold material viscosity above which the tunnelling rate drops significantly. In this case, viscosity suppresses the large inertial expansion of the bubble, and the width and the growth rate both decrease. The bubble dynamics also depend on the excitation. Bubble expansion is greater for larger pressures and lower frequencies, both of which speed growth. The larger bubbles also leave wider tunnels. Ideally, many more simulations could be completed at still greater ranges of parameters to more completely map out parameters and examine scaling laws that might appear. Although these simulations are only two-dimensional, they require long time series, and thus do not yet provide conclusive scaling results across a wide range of parameters. We mostly focused on regimes where a mix of physical mechanisms (particularly viscosity and inertia) are both significant. Still more viscous simulations are more difficult due to time step stability limitations, and similarly higher inertia simulations require greater resolution and are more likely to precipitate three-dimensional effects.
It is important that such a simple model can produce tunnels, suggesting a potentially simple mechanism. However, the list of neglected components that might also play a role in experiments is long. Although the elasticity is not necessary for tunnelling, it will likely alter it, especially for stiffer materials. There is naturally no expectation of precisely matching the rates inferred from experiments, but they are not far from observations. For example, Acconcia et al. (Reference Acconcia, Leung, Manjunath and Goertz2014) observed a microbubble translation rate of 0.5–6.8 cm s−1 in fibrin clots for ultrasound frequency 1 MHz and pressure 0.2–0.39 MPa. For water-like viscosity of the damaged material left in the tunnel, the simulated rates are somewhat faster, in the range of 6.8–69.6 $\mathrm{cm}\,\mathrm{s}^{- 1}$
, for similar acoustic excitation. However, this rate reduces by almost 85 % with a 10-fold increase in the viscosity of the degraded material. Viscosity well above that of water is expected due repolymerisation (Williams & Miller Reference Williams and Miller2003) or just because degraded material will have significantly more molecularly complex components. Hence, the tunnelling rates here are not out of line with observations and expectations, providing additional validation, at least for the present purposes.
$\mathrm{cm}\,\mathrm{s}^{- 1}$
, for similar acoustic excitation. However, this rate reduces by almost 85 % with a 10-fold increase in the viscosity of the degraded material. Viscosity well above that of water is expected due repolymerisation (Williams & Miller Reference Williams and Miller2003) or just because degraded material will have significantly more molecularly complex components. Hence, the tunnelling rates here are not out of line with observations and expectations, providing additional validation, at least for the present purposes.
The axisymmetric model also does not support many instabilities that might lead to new bubbles and branching tunnels, which have been observed in certain cases (Williams & Miller Reference Williams and Miller2003). It is possible that the axisymmetric constraint here plays the role of acoustic radiation in experiments in setting and maintaining the tunnelling direction. While our current model precludes azimuthal perturbation, these modes may affect dynamics. That stated, experiments (Prentice et al. Reference Prentice, Cuschieri, Dholakia, Prausnitz and Campbell2005; Cattaneo et al. Reference Cattaneo, Presse, Shakya, Renggli, Lukić, Prasanna, Meyer, Rack and Supponen2024) show that the bubbles are nearly axisymmetric when excited by lower pressure amplitudes. Further analysis will be required to assess if the azimuthal shape modes will affect the tunnelling behaviour for the parameters considered, which is beyond the scope of our current work. It is interesting to speculate that non-axisymmetric instabilities cause bubble break-ups to the point where inertia balances viscosity such as in the regime considered here, which might produce tunnels as observed. We also consider only a case with a fixed gas volume, whereas in most applications, the bubble will include vapour formed by cavitation along with the non-condensible gases, which might introduce another time scale before achieving a steady behaviour. The thermodynamics of the gas and phase change might also alter the details of the response. Nevertheless, this simple model should guide efforts seeking either to increase material degradation (HIFU) or suppress it (BWL), improving therapies.
Acknowledgements
We are grateful for conversations with Adam D. Maxwell.
Funding
We acknowledge financial support from NIH P01-DK056788. P.D. is grateful for the financial support through the Seed Grant for New Faculty (MI02932G_SG) and the computational resources provided by IIT Delhi HPC facility.
Declaration of interest
The authors report no conflict of interest.


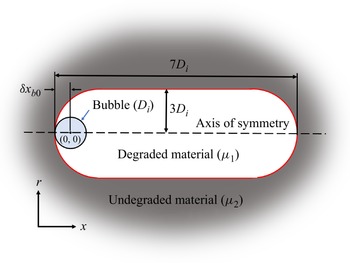
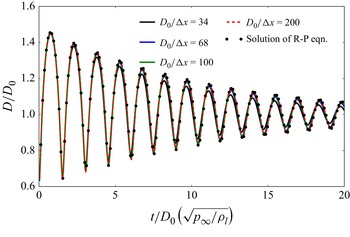


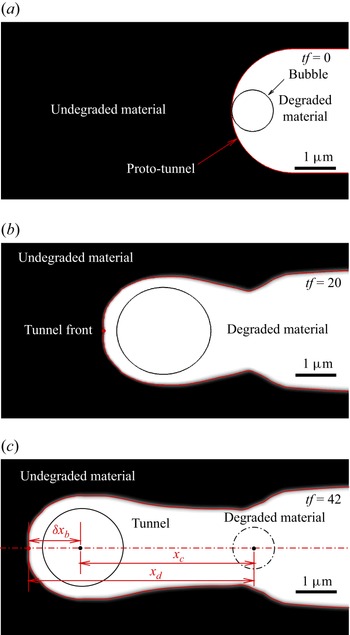


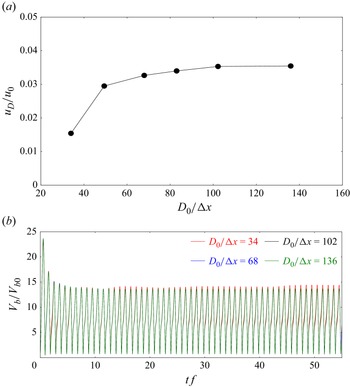


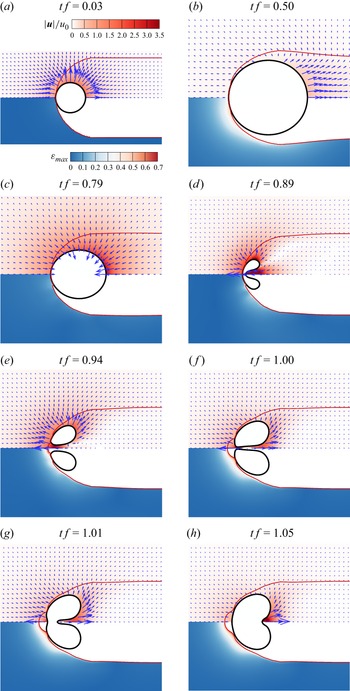


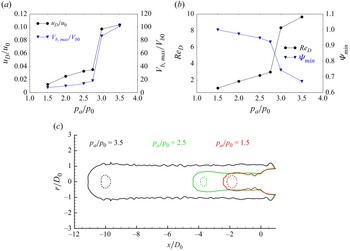


 Open access