


Introduction
Cotton and soybean cultivars with resistance to the synthetic auxin dicamba have been commercially launched and are now widely available for purchasing and planting by growers. This new biotech trait allows spraying of dicamba onto these crops, an activity that will probably range from April through August in some areas of the United States (USDA-NASS 2010). Dicamba provides excellent control of some key broadleaf weed species, including glyphosate-resistant horseweed [Conyza canadensis (L.) Cronq.] and giant ragweed (Ambrosia trifida L.) (Kruger et al. Reference Kruger, Davis, Weller and Johnson2010; Vink et al. Reference Vink, Soltani, Robinson, Tardif, Lawton and Sikkema2012). Although in-crop applications of dicamba in dicamba-resistant (DR) soybean and cotton do not provide a spectrum as broad as does glyphosate, dicamba will provide an alternative site of action to be used in these crops for weed control and guard against herbicide resistance if integrated resistance management practices are followed.
Dicamba is a member of the benzoic acid family of herbicides but more widely grouped as a synthetic auxin because it mimics indole acetic acid (Mithila et al. Reference Mithila, Hall, Johnson, Kelley and Riechers2011). For over 50 yr, dicamba has been used for broadleaf weed control in corn (Zea mays L.), small grains, and pastures. As with other pesticides, dicamba may move off-target by primary drift at the time of application. Dicamba can also continue to move off-target for an extended period of time following the application (secondary movement) and cause injury to soybean (Behrens and Lueschen Reference Behrens and Lueschen1979; Egan and Mortensen Reference Egan and Mortensen2012; Mueller et al Reference Mueller, Wright and Remund2013). Off-target movement of dicamba can occur as physical particle drift, tank contamination, movement with dust, movement with water, or volatility. Early research documented the volatile component of dimethylamine (DMA) dicamba to be free dicamba acid (Behrens and Lueschen Reference Behrens and Lueschen1979).
Incorporation of dicamba into a POST DR soybean or cotton weed control program will permit the expansion of use during summer months, when temperatures reach yearly maximums. As with other herbicides, volatility of dicamba increases with increasing temperature and decreases with increasing humidity (Behrens and Lueschen Reference Behrens and Lueschen1979; Grover Reference Grover1975). Hot and/or dry conditions are a concern for applicators, as there is more opportunity for dicamba acid to convert to a gaseous state.
Early research reported that after application of the DMA salt of dicamba, volatilization occurred up to 3 d after application (DAA; Behrens and Lueschen Reference Behrens and Lueschen1979). Dicamba was applied at 280 g ae ha–1 (half the current rate of 560 g ae ha–1 for DR crops) in those studies. Soybean injury was greatest for potted plants placed in the field the day of the application and decreased the following 2 d as different sets of plants were exposed. Symptoms decreased when plants were placed farther from the application area, although soybean placed as far away as 60 m still showed some injury. Furthermore, it is possible that soybean injury from volatile loss of dicamba could be increased in both intensity and distance from the application if dicamba is applied to a larger area (greater proportion subject to volatility), as only a 30- by 30-m area was sprayed in this research.
Previous researchers have shown DGA dicamba to be less volatile than DMA dicamba under field conditions (Egan and Mortensen Reference Egan and Mortensen2012; Mueller et al. Reference Mueller, Wright and Remund2013), albeit recent research found that DGA dicamba can also volatilize for at least 3 DAA (Anonymous 2017). Air samplers documented a 50% decrease in detection of dicamba over plots that received DGA dicamba as opposed to the DMA formulation (Mueller et al. Reference Mueller, Wright and Remund2013). When using bioassay soybean plants to estimate the amount of dicamba leaving the application area via secondary drift, off-target movement was reduced by 94% when the DGA salt of dicamba was applied over the DMA salt (Egan and Mortensen Reference Egan and Mortensen2012). Although injury to soybean from secondary drift of DGA dicamba was less than that of DMA dicamba, malformation was still noticed out to 20 m in multiple experiments when treating only 335 m2 (0.033 ha) (Egan and Mortensen Reference Egan and Mortensen2012). Therefore, use of dicamba in DR crops may have to be accompanied by buffers on all sides of the application area to mitigate off-target movement, because secondary movement can cause symptomology on multiple sides of a field if winds shift direction within 3 d of application.
The most recently labeled dicamba formulations for use in DR soybean and cotton have been reported to have reduced volatile losses; however, little published research has been compiled on these newly formulated products. As of November 9, 2016, a DGA dicamba with an additive (XtendiMax with VaporGrip; Monsanto Co., St. Louis, MO) was approved for use in DR cotton and soybean in the United States via a supplemental label (Anonymous 2016a). This formulation is a combination of the previously available DGA salt of dicamba and acetic acid as an additive that is said to reduce volatile loss by inhibiting formation of free dicamba acid (MacInnes Reference MacInnes2017). Additionally, the BAPMA salt of dicamba (Engenia; BASF Corp., Research Triangle Park, NC) was granted supplemental registration at a later date (Anonymous 2016b). This salt of dicamba is also purported to have reduced volatility over previous forms (Westberg and Adams Reference Westberg and Adams2017).
Although BAPMA dicamba is purported to have decreased secondary loss via volatilization over previous forms, published field research documenting the lower risk of this formulation does not exist. Previous research aimed at comparing volatile losses from herbicides either used potted bioassay plants that were not experiencing field soil conditions, or sought to quantify by analytical methods only the amount of herbicide leaving the application area (Bauerle et al. Reference Bauerle, Griffin, Alford, Curry and Kenty2015; Egan and Mortensen Reference Egan and Mortensen2012; Sciumbato et al. Reference Sciumbato, Chandler, Senseman, Bovey and Smith2004; Strachan et al. Reference Strachan, Ferry and Cooper2013). In addition, the previous research did not incorporate commercial application equipment. Using commercial equipment would allow application to a larger area in a much shorter time period than when using hand booms to keep environmental factor variability at minimum. If the size of the application area directly correlates with the amount of volatile loss, then commercial applications to larger fields may result in a greater amount of secondary injury to soybean than previously realized. Therefore, a field experiment was designed to examine possible differences between DGA and BAPMA dicamba after application using commercial application techniques.
Materials and Methods
Drift Experiments
Field experiments were conducted in 2015 and 2016 at the Northeast Research and Extension Center in Keiser, AR. Glufosinate-resistant soybean (Bayer Credenz 4950LL) was planted in two adjacent 8-ha fields on June 15, 2015, and June 13, 2016. Rows were bedded on 97-cm centers. Furrow irrigation was used to supplement natural rainfall. Weed control was provided with PRE applications of flumioxazin at 71 g ai ha–1 plus paraquat at 701 g ai ha–1 and two POST applications of glufosinate at 595 g ai ha–1 plus clethodim at 76 g ai ha–1.
A 38- by 38-m area (0.144 ha) in the center of each field simultaneously received either DGA (Clarity; BASF Corp., Research Triangle Park, NC) or BAPMA (Engenia; BASF Corp., Research Triangle Park, NC) dicamba applied at 560 g ae ha–1 with one of two Bowman Mudmaster (Bowman Manufacturing, Newport, AR) high-clearance sprayers. Nonionic surfactant was added to each mixture at 0.25% v/v (Induce; Helena Chemical Co., Collierville, TN). Applications were made at soybean growth stage V6/V7 in 2015 and V4/V5 in 2016. Each sprayer was equipped with a broadcast boom having a 7.6-m swath tipped with TTI11003 nozzles (TeeJet Technologies, Springfield, IL) calibrated to deliver 94 L ha–1 at 275 kPa while traveling at 15 km h–1. Five passes were made, with each sprayer (one for each formulation) simultaneously applying the herbicide to reduce variation in wind, humidity, and temperature. Wind speeds were recorded at 1-s intervals during the application. Relative humidity and temperature were recorded at the beginning and end of the application. Daily weather data (wind speed, wind direction, temperature, humidity) on a 15-s interval were recorded from 1 wk before application to 3 wk after application using a weather station (Spectrum Technologies, 3600 Thayer Court, Aurora, IL) placed between the two adjacent fields. Wind speed was recorded at a 1.67-m height from the weather station and in the field at boom height every 1 s during the application using a hand-held anemometer.
Prior to application, transects were laid out in each of the eight cardinal directions extending to the edge of the field. Plots were established every 3 m from 3 to 12 m from the sprayed area, every 6 m from 12 to 36 m, every 9 m from 36 to 72 m, and every 12 m beyond 72 m until the edge of the field was reached. Two subplots consisting of four to five soybean plants per subplot were marked at each distance. The subplots consisted of soybean plants that were exposed to (a) primary plus secondary drift or (b) secondary drift only (any exposure > 30 min after application). Immediately before application, 19-L buckets were placed over the soybean plants in subplots that were exposed only to secondary drift. Buckets were removed from these plants 30 min after completing the spray application (secondary drift only). Several soybean plants directly adjacent to the secondary-drift subplots were hand removed before application so that uncovered plants would not contact covered plants when buckets were removed. Workers collected buckets from the outside in and walked back out down rows where plots were not established to avoid any contamination. Workers were also careful not to contact any plants in the process. The primary-plus-secondary drift subplots were never covered.
Additionally, metal rebar stands were erected with a 20- by 20-cm plywood platform affixed to the rebar at the height of the soybean canopy just before spraying. These stands were placed within the treated area and at each plot in 2015. In 2016, stands were again placed in the treated area but only in plots up to 30 m from the application. Four Petri dishes (63 cm2 area) were placed on separate stands within the treated area to catch a full rate of dicamba. Mylar cards were placed on the stands outside of the treated area to catch primary drift. In 2015, 100-cm2 Mylar cards (10 by 10 cm) were placed on stands at 3, 6, 9, and 12 m from the application. Mylar cards 400 cm2 in size were used at plots starting at 18 m to the field border. In 2016, 400-cm2 (20 by 20 cm) Mylar cards were used from 3 to 30 m. To quantify primary drift that occurred during and up to 30 min after application, rhodamine dye (Sigma-Aldrich Co., St. Louis, MO) was placed in each spray tank at 1 g L–1. Mylar cards have been previously used as a means of catching herbicide drift (Salyani and Cromwell Reference Salyani and Cromwell1992; Yates et al. Reference Yates, Akesson and Bayer1978). Petri dishes and Mylar cards were removed from the field 30 min after application and placed in plastic bags indicating their location and then in a dark cooler to prevent photodegradation of the dye. Petri dishes and Mylar cards were taken to the University of Nebraska Pesticide Application Laboratory in North Platte, NE, to quantify the amount of dye present on each surface using fluorimetry. A Turner Designs Trilogy 7200-000 (San Jose, CA) with green module and RTW/PE filter was used to analyze the samples. Samples were prepared by adding either 40 ml (Petri dishes and 100-cm2 Mylar cards) or 60 ml (400-cm2 Mylar cards) of distilled water and agitating to dissolve the rhodamine dye before extracting with a pipette and placing into 10- by 10-mm plastic cuvettes, which were placed in the fluorimeter for reading. Readings were given in relative fluorescence units and later converted to ppm of rhodamine dye with use of a calibration curve. From ppm of rhodamine dye, concentrations could then be converted to amount of solution reaching each card, allowing calculation of the dicamba dose reaching each distance via primary movement.
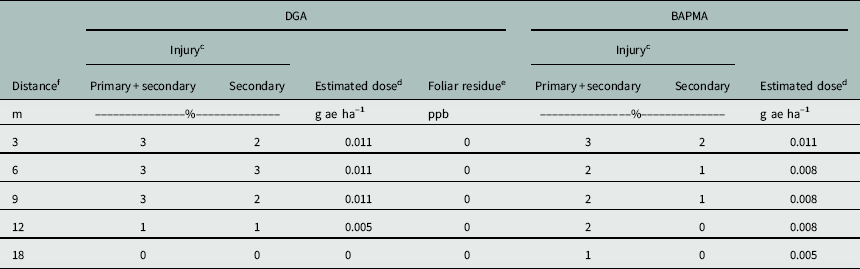
Injury to soybean within each subplot (primary plus secondary, secondary) was rated at 7, 14, and 21 DAA. Injury was rated on a 0 to 100% scale, with 100% being plant death. There was no attempt to solely quantify primary drift, because this would have required that plants be covered for several days with buckets as DGA dicamba has been reported to volatilize throughout this period (Anonymous 2017). Injury to soybean outside of the treated area was primarily in the form of leaf cupping but also included leaf crinkling, epinasty, and terminal death (Andersen et al. Reference Andersen, Clay, Wrage and Matthees2004; Sciumbato et al. Reference Sciumbato, Chandler, Senseman, Bovey and Smith2004). Two soybean plants exposed to primary plus secondary drift were harvested from the DGA experiment only at 7 DAA in 2015, and four plants in 2016 directly adjacent to all distances that were rated for injury. Samples were transported on dry ice to the Arkansas State Plant Board in Little Rock, AR, and analyzed for dicamba remaining in the tissue. The method of dicamba extraction and quantification was GC/MS, similar to that reported previously (Andersen et al. Reference Andersen, Clay, Wrage and Matthees2004). The limit of detection was 1 ppb.
Analysis of Droplet Spectrum.
BAPMA and DGA dicamba spray solutions similar to those used in the field study were analyzed with a Sympatec Helos Vario KR particle size analyzer (Sympatec GmbH, Pulverhaus, Germany) with R7 lens installed in a low-speed wind tunnel at 24 km h–1. Droplets were detectable from 18 to 3,500 µm. This equipment uses laser diffraction to determine particle size distribution, and the width of the spray pattern was analyzed by moving the nozzle across the laser with a linear actuator. A single TeeJet TTI11003 nozzle was used with a pressure of 275 kPa.
Dose Response Experiment
Bayer’s glufosinate-resistant soybean, Credenz 4950, was planted on the same day as the large field experiment in a smaller field located approximately 1 km away for a DGA and BAPMA dicamba rate response experiment. The distance between the large drift and rate titration experiments was believed to be adequate for eliminating contamination between experiments, as no dicamba symptomology was observed in surrounding areas. Applications were made on the same day as the large field experiment. Row spacing, irrigation, and weed control measures were also the same as in the large field experiment. Ten dicamba doses (56, 17.5, 5.6, 1.75, 0.56, 0.175, 0.056, 0.0175, 0.0056, and 0.00175 g ae ha–1) for each formulation were applied to the center two rows of each four-row plot using a CO2-pressurized backpack sprayer with a 1.5-m spray boom equipped with four AIXR110015 nozzles (TeeJet Technologies, Springfield, IL) with an output of 140 L ha–1 at 275 kPa. Nonionic surfactant (Induce; Helena Chemical Co, Collierville, TN) was added at 0.25% v/v to the full-rate mixture of dicamba that was used to mix low rates. Treatments were arranged in a randomized complete block design and included four replications.
Injury ratings were taken 7, 14, and 21 DAA. Data were subjected to a two-way ANOVA to test for effects of rate, formulation, and the interaction between rate and formulation as related to injury at 21 DAA. A repeated-measures ANOVA was not used, because the authors were interested only in the difference in maximum injury, which occurred at the 21-DAA timing. Injury data were also subjected to regression analysis using SigmaPlot (Systat Software Inc., San Jose, CA) to determine goodness of fit based on r2, AIC (Akaike information criterion), and BIC (Bayesian information criterion) values and significance of the regression (α <0.05). For each year, a model describing ln dose (g ae ha–1) as a function of injury (%) at 21 DAA was produced. Models could then be applied to their respective years within the large drift experiment, where observed injury could be paired with an estimated rate of dicamba in g ae ha–1 at that particular location within the field similar to that done previously (Egan and Mortensen Reference Egan and Mortensen2012).
Much as with the large drift trial, whole-plant tissue samples were collected 7 DAA (DGA only) and analyzed for the presence of dicamba. Plant heights were also collected 21 DAA and subjected to nonlinear regression analysis in Sigma Plot (Systat Software Inc., San Jose, CA). Various exponential models were tested, and goodness of fit was decided based on r2, AIC, and BIC values. Measures of AIC and BIC were used to compare across models, with the lowest values indicating the best fit. Regression figures for the effect of dicamba dose on soybean height were produced using JMP Pro 12 (SAS Institute, Cary, NC).
Results and Discussion
Large Drift Experiment
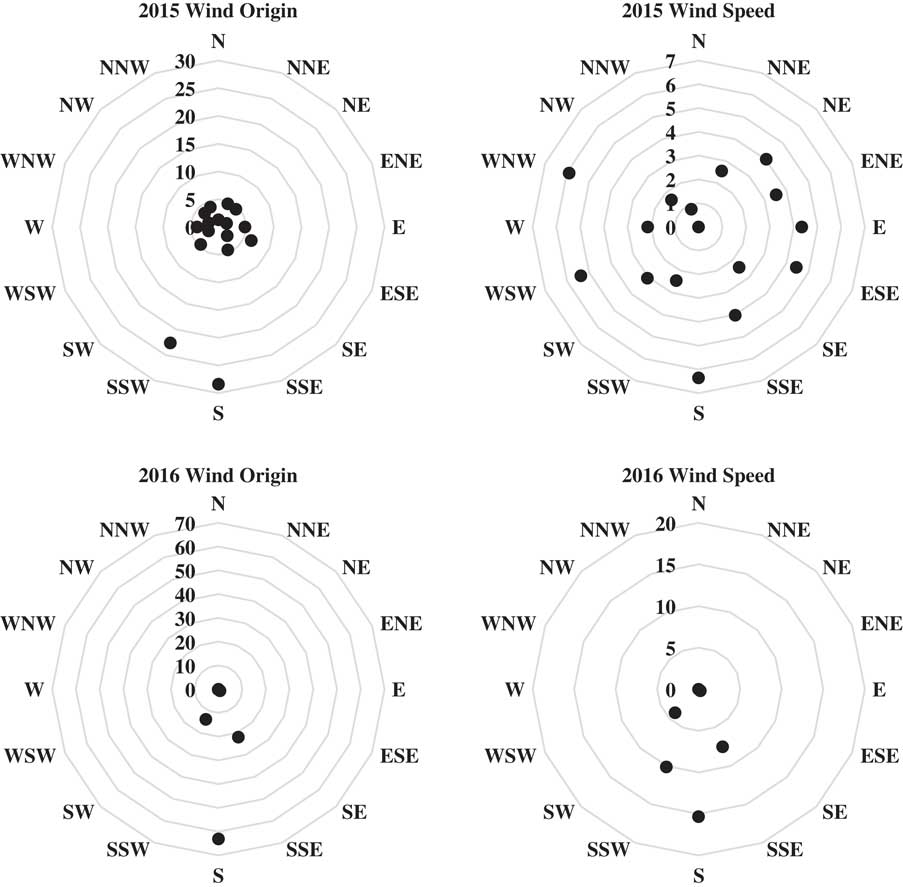
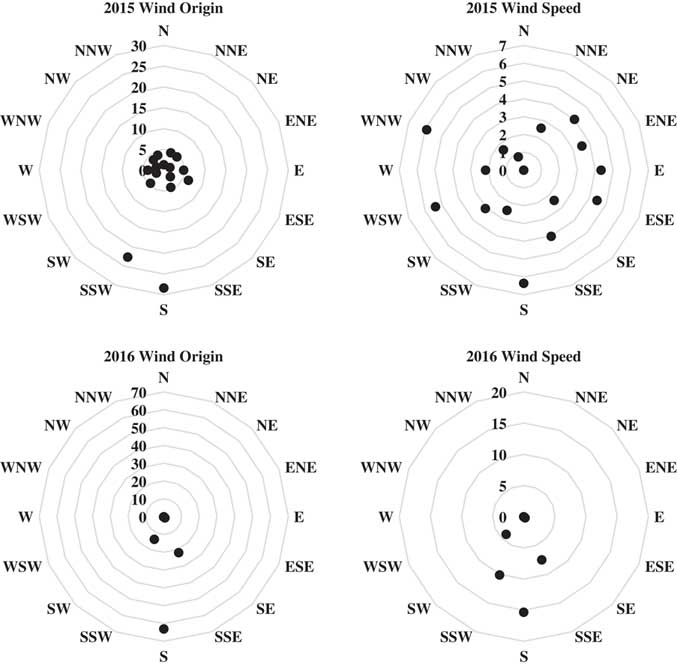
Ambient air temperature was 38 C in 2015 and 31 C in 2016 at the time of application, whereas relative humidity was 44% in 2015 and 77% in 2016 (Table 1). Environmental conditions during application were a good representation of those likely for a POST herbicide applied to late-planted or double-crop soybean in this region. Wind speed ranged from 4 to 12 km h–1 in 2015 and 10 to 16 km h–1 in 2016, conditions suitable for spraying based on the label for the BAPMA salt of dicamba in 2017 (Anonymous 2016b). Winds were primarily in a north/northeastern direction during and for 48 h after application in both years (Figure 1); therefore, soybean injury was mainly confined to the north, northeast, and east transects (Tables 2 to 14); only transects having injury are presented in the tables.
Weather conditions during and after application of DGA and BAPMA dicamba in 2015 and 2016 at Keiser, AR. a , b

a Abbreviations: DAA, d after application; DGA, diglycolamine salt of dicamba; BAPMA, N,N-Bis(aminopropyl)methylamine salt of dicamba; min, minimum; max, maximum.
b Average/maximum wind speed during application was 8/12 km h–1 in 2015 and 12/16 km h–1 in 2016. During application, wind was in the N direction in 2015 and in the NNE direction in 2016. See Figure 1 for average wind speed and direction following application.
Web diagrams displaying wind speed and origin for 2 d after application in 2015 and 2016 at the Northeast Research and Extension Center in Keiser, AR. Wind origin is presented as a percentage of all hourly measurements. Wind speed is presented as average wind speed (km h-1) for each reported direction. Arrow originating from the center of each diagram indicates wind direction during application.
Injury to soybean, estimated dose of DGA and BAPMA dicamba, and DGA dicamba detected in soybean along the north transect in 2015 at Keiser, AR. a , b

a Abbreviations: DGA, diglycolamine form of dicamba; BAPMA, N,N-Bis(aminopropyl)methylamine form of dicamba
b Wind direction during application ranged between NNE and NNW, with an average speed of 8 and maximum of 12 km h–1.
c Plant injury rated on a 0 to 100% scale, with 100% being plant death.
d Dose estimated using equations generated from rate titration trial injury levels.
e The limit for detecting dicamba was 1 ppb.
f Distances where no injury was observed are not shown.
Injury to soybean, estimated dose of DGA and BAPMA dicamba, and DGA dicamba detected in soybean along the northeast transect in 2015 at Keiser, AR. a , b

a Abbreviations: DGA, diglycolamine form of dicamba; BAPMA, N,N-Bis(aminopropyl)methylamine form of dicamba.
b Wind direction during application ranged between NNE and NNW, with an average speed of 8 and maximum of 12 km h–1.
c Plant injury rated on a 0 to 100% scale, with 100% being plant death.
d Dose estimated using equations generated from rate titration trial injury levels.
e The limit for detecting dicamba was 1 ppb.
f Distances where no injury was observed are not shown.
Injury to soybean, estimated dose of DGA and BAPMA dicamba, and DGA dicamba detected in soybean along the east transect in 2015 at Keiser, AR. a , b

a Abbreviations: DGA, diglycolamine form of dicamba; BAPMA, N,N-Bis(aminopropyl)methylamine form of dicamba.
b Wind direction during application ranged between NNE and NNW, with an average speed of 8 and maximum of 12 km h–1.
c Plant injury rated on a 0 to 100% scale, with 100% being plant death.
d Dose estimated using equations generated from rate titration trial injury levels.
e The limit for detecting dicamba was 1 ppb.
f Distances where no injury was observed are not shown.
Injury to soybean, estimated dose of DGA and BAPMA dicamba, and DGA dicamba detected in soybean along the southeast transect in 2015 at Keiser, AR. a , b

a Abbreviations: DGA, diglycolamine form of dicamba; BAPMA, N,N-Bis(aminopropyl)methylamine form of dicamba.
b Wind direction during application ranged between NNE and NNW, with an average speed of 8 and maximum of 12 km h–1.
c Plant injury rated on a 0 to 100% scale, with 100% being plant death.
d Dose estimated using equations generated from rate titration trial injury levels.
e The limit for detecting dicamba was 1 ppb.
f Distances where no injury was observed are not shown.
Injury to soybean, estimated dose of DGA and BAPMA dicamba, and DGA dicamba detected in soybean along the south transect in 2015 at Keiser, AR. a , b

a Abbreviations: DGA, diglycolamine form of dicamba; BAPMA, N,N-Bis(aminopropyl)methylamine form of dicamba
b Wind direction during application ranged between NNE and NNW, with an average speed of 8 and maximum of 12 km h–1.
c Plant injury rated on a 0 to 100% scale, with 100% being plant death.
d Dose estimated using equations generated from rate titration trial injury levels.
e The limit for detecting dicamba was 1 ppb.
f Distances where no injury was observed are not shown.
Injury to soybean, estimated dose of DGA and BAPMA dicamba, and DGA dicamba detected in soybean along the north transect in 2016 at Keiser, AR. a , b

a Abbreviations: DGA, diglycolamine form of dicamba; BAPMA, N,N-Bis(aminopropyl)methylamine form of dicamba.
b Wind direction during application ranged between NNE and NNW, with an average speed of 8 and maximum of 12 km h–1.
c Plant injury rated on a 0 to 100% scale, with 100% being plant death.
d Dose estimated using equations generated from rate titration trial injury levels.
e The limit for detecting dicamba was 1 ppb.
f Distances where no injury was observed are not shown.
Injury to soybean, estimated dose of DGA and BAPMA dicamba, and DGA dicamba detected in soybean along the northeast transect in 2016 at Keiser, AR. a , b

a Abbreviations: DGA, diglycolamine form of dicamba; BAPMA, N,N-Bis(aminopropyl)methylamine form of dicamba.
b Wind direction during application ranged between NNE and NNW, with an average speed of 8 and maximum of 12 km h–1.
c Plant injury rated on a 0 to 100% scale with 100% being plant death.
d Dose estimated using equations generated from rate titration trial injury levels.
e The limit for detecting dicamba was 1 ppb.
f Distances where no injury was observed are not shown.
Injury to soybean, estimated dose of DGA and BAPMA dicamba, and DGA dicamba detected in soybean along the east transect in 2016 at Keiser, AR. a , b

a Abbreviations: DGA, diglycolamine form of dicamba; BAPMA, N,N-Bis(aminopropyl)methylamine form of dicamba.
b Wind direction during application ranged between NNE and NNW, with an average speed of 8 and maximum of 12 km h–1.
c Plant injury rated on a 0 to 100% scale, with 100% being plant death.
d Dose estimated using equations generated from rate titration trial injury levels.
e The limit for detecting dicamba was 1 ppb.
f Distances where no injury was observed are not shown.
Injury to soybean, estimated dose of DGA and BAPMA dicamba, and DGA dicamba detected in soybean along the southeast transect in 2016 at Keiser, AR. a , b

a Abbreviations: DGA, diglycolamine form of dicamba; BAPMA, N,N-Bis(aminopropyl)methylamine form of dicamba.
b Wind direction during application ranged between NNE and NNW with an average speed of 8 and maximum of 12 km h–1.
c Plant injury rated on a 0 to 100% scale with 100% being plant death.
d Dose estimated using equations generated from rate titration trial injury levels.
e The limit for detecting dicamba was 1 ppb.
f Distances where no injury was observed are not shown.
Injury to soybean, estimated dose of DGA and BAPMA dicamba, and DGA dicamba detected in soybean along the south transect in 2016 at Keiser, AR. a , b

a Abbreviations: DGA, diglycolamine form of dicamba; BAPMA, N,N-Bis(aminopropyl)methylamine form of dicamba.
b Wind direction during application ranged between NNE and NNW, with an average speed of 8 and maximum of 12 km h–1.
c Plant injury rated on a 0 to 100% scale, with 100% being plant death.
d Dose estimated using equations generated from rate titration trial injury levels.
e The limit for detecting dicamba was 1 ppb.
f Distances where no injury was observed are not shown.
Injury to soybean, estimated dose of DGA and BAPMA dicamba, and DGA dicamba detected in soybean along the southwest transect in 2016 at Keiser, AR. a , b
a Abbreviations: DGA, diglycolamine form of dicamba; BAPMA, N,N-Bis(aminopropyl)methylamine form of dicamba.
b Wind direction during application ranged between NNE and NNW, with an average speed of 8 and maximum of 12 km h–1.
c Plant injury rated on a 0 to 100% scale, with 100% being plant death.
d Dose estimated using equations generated from rate titration trial injury levels.
e The limit for detecting dicamba was 1 ppb.
f Distances where no injury was observed are not shown.
Injury to soybean, estimated dose of DGA and BAPMA dicamba, and DGA dicamba detected in soybean along the west transect in 2016 at Keiser, AR. a , b

a Abbreviations: DGA, diglycolamine form of dicamba; BAPMA, N,N-Bis(aminopropyl)methylamine form of dicamba.
b Wind direction during application ranged between NNE and NNW, with an average speed of 8 and maximum of 12 km h–1.
c Plant injury rated on a 0 to 100% scale, with 100% being plant death.
d Dose estimated using equations generated from rate titration trial injury levels.
e The limit for detecting dicamba was 1 ppb.
f Distances where no injury was observed are not shown.
Injury to soybean, estimated dose of DGA and BAPMA dicamba, and DGA dicamba detected in soybean along the northwest transect in 2016 at Keiser, AR. a , b

a Abbreviations: DGA, diglycolamine form of dicamba; BAPMA, N,N-Bis(aminopropyl)methylamine form of dicamba.
b Wind direction during application ranged between NNE and NNW, with an average speed of 8 and maximum of 12 km h–1.
c Plant injury rated on a 0 to 100% scale, with 100% being plant death.
d Dose estimated using equations generated from rate titration trial injury levels.
e The limit for detecting dicamba was 1 ppb.
f Distances where no injury was observed are not shown.
Injury resulting from primary plus secondary drift generally occurred along transects at greater distances following application of the DGA than the BAPMA salt of dicamba in 2015 (Tables 2 to 6). In the 2015 experiment, the maximum distance to soybean injury via primary plus secondary drift was 45 m for DGA and 30 m for BAPMA, as indicated by an average 1% soybean injury in the DGA experiment at 21 DAA. Yet, this slight malformation may not be noticeable to the average grower. The distance to 5% injury was 30 m for DGA and 24 m for BAPMA.
Primary plus secondary drift of dicamba was detected at much greater distances in 2016, probably because the wind speed was greater, as wind velocity is reported to have a linear relationship with drift of herbicide spray (Maybank et al. Reference Maybank, Yoshida and Grover1978) (Tables 7 to 14). Additionally, the precipitation following applications in 2015 probably contributed to reduced dicamba movement from the target area. Soybean injury via primary plus secondary drift occurred up to the field edge (over 180 m) with the DGA salt and extended to 108 m with the BAPMA salt. The maximum distance to 5% soybean injury of the DGA salt (120 m) was over twice as far as the BAPMA salt (54 m).
The droplet spectrum of a given nozzle may depend upon the mixture being applied (Meyer et al. Reference Meyer, Norsworthy, Druger and Barber2015). Meyer et al. (Reference Meyer, Norsworthy, Druger and Barber2015) reported the Dv50 (the point at which 50% of the spray volume is below the given size) for a 1× rate of glufosinate (594 g ai ha–1) to be 617 µm when applied through TTI11004 nozzles at a pressure of 275 kPa. Eighty percent of the volume was between 291 µm and 938 µm. When using the same nozzle and pressure, Dv50 for a 1× rate of BAPMA dicamba (560 g ae ha–1) was 756 µm, with 80% of the volume being between 374 µm and 1,193 µm. However, our results document the difference in Dv50 to be just 13 µm between DGA (757 µm) and BAPMA dicamba (744 µm). In addition, the percentage of fines (droplets <210 µm) was equivalent for the two formulations (1.57% of total spray volume). Therefore, similar distance for primary drift would be expected.
An attempt to measure primary drift using Mylar cards resulted in only two positive readings in 2015 and nine positive readings in 2016 (data not shown). Use of Mylar cards in combination with fluorimetry lacked a detection limit low enough to quantify the extremely low rates of primary dicamba drift capable of causing injury to soybean, at least at the concentration of rhodamine dye used in this experiment. Conversely, dicamba drift research in a wind tunnel using a 1,3,6,8-pyrenetetrasulfonic acid tetra-sodium salt fluorescent tracer in conjunction with 1.2- by 0.5-m polyethylene strings to absorb droplets has provided better results (Alves et al. Reference Alves, Kruger, da Cunha, de Santana, LAT, Guimaraes and Zaric2017a, Reference Alves, Kruger, da Cunha, Vieira, Henry, Obradovic and Grujic2017b). The confined system in combination with a larger surface area to collect droplets may explain why the wind tunnel evaluations were more successful than field estimates of drift. Additionally, it may be possible that rhodamine dye was lost during the 30-min period following application. As shown in other research, rhodamine dye is sensitive to photodegradation (Wu et al. Reference Wu, Liu and Zhao1998).
Weather conditions can drastically affect secondary off-target movement of dicamba, as volatility is positively correlated with air temperature and negatively correlated with humidity (Behrens and Lueschen Reference Behrens and Lueschen1979; Mueller et al. Reference Mueller, Wright and Remund2013). Higher temperature accompanied with low humidity in 2015 would probably lead to greater off-target movement than the lower temperature and higher humidity levels that occurred at application in 2016. However, secondary movement was less in 2015 when compared to 2016. A 7-mm rain event 8 h following application in 2015 probably caused a reduction in dicamba movement off the treated area. Furthermore, any dicamba suspended in air would be brought to the surface and incorporated into soil by rainfall. As a result, secondary injury was observed only out to 24 m with the DGA salt and 12 m with the BAPMA salt in 2015, whereas the 2016 experiment led to secondary injury out to 180 m with the DGA salt and 108 m with the BAPMA salt where no precipitation occurred for 3 d following the 2016 experiment. It should be noted that there were no efforts taken to determine the ratio of particles to vapors for this study and that the primary plus secondary and the secondary movement is meant to serve as a reflection of relative risk of off-target movement at two distinctly different periods of time following the application of dicamba. Additionally, no research exists documenting that particle and vapor exposure (at a given rate) results in comparable soybean injury. Therefore, if secondary injury is subtracted from primary plus secondary injury, the result may not be equal to primary injury to soybean.
Rate Response Experiment
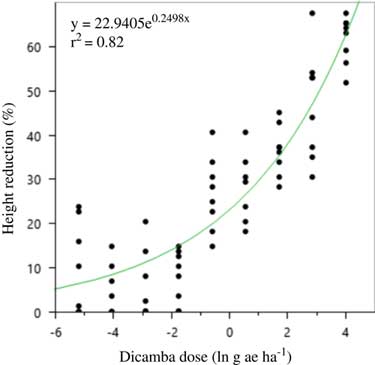
A two-parameter exponential model was fit to the soybean height data both years (Figures 2 and 3; Table 15). The curve for 2016 was much steeper than 2015, and the highest dicamba rates produced nearly twice the height reduction in 2016.
Two-parameter exponential growth model of the effect of dicamba dose on height reduction at 21 d after application to vegetative soybean in 2015 at Keiser, AR. Regression parameters are available in Table 15.
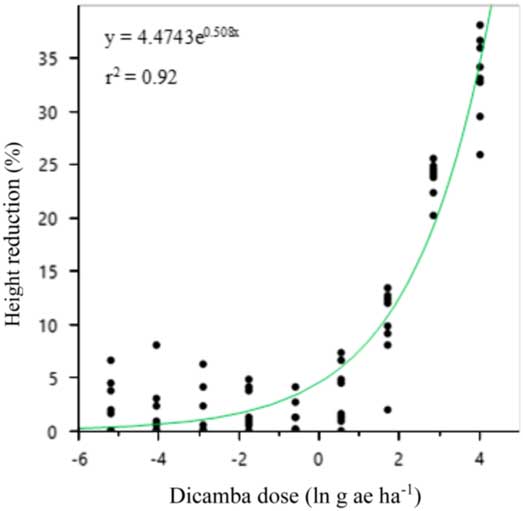
Two-parameter exponential growth model of the effect of dicamba dose (g ae ha–1) on height reduction at 21 d after application to vegetative soybean in 2016 at Keiser, AR. Regression parameters are available in Table 15.

Nonlinear regression parameter estimates, standard error, and confidence intervals for the 2015 and 2016 relationship between soybean height at 21 d after application and dicamba dose. a

a A two-parameter exponential model was used.
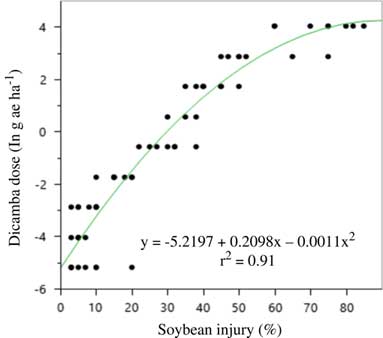
Soybean injury in the rate response experiment mirrored that of the large drift experiments in that malformation was much greater in 2016 than 2015 (Figures 4 and 5). A three-parameter exponential model was fit to soybean injury data at 21 DAA by dicamba dose both years (Table 16). Again, it is thought that either environmental conditions around the time of application or the unexpected rainfall after application caused such differences. Soybean injury reached a maximum at 21 DAA; therefore, this measure was used in all evaluations.
Quadratic model for predicting dicamba dose (g ae ha–1) in the large drift experiments using soybean injury at 21 d after application in 2015 at Keiser, AR. Regression parameters are available in Table 16.
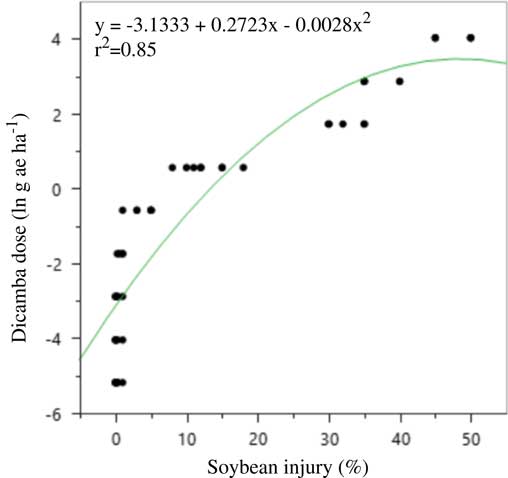
Quadratic model for predicting dicamba dose (g ae ha–1) in the large drift experiments using soybean injury at 21 d after application in 2016 at Keiser, AR. Regression parameters are available in Table 16.
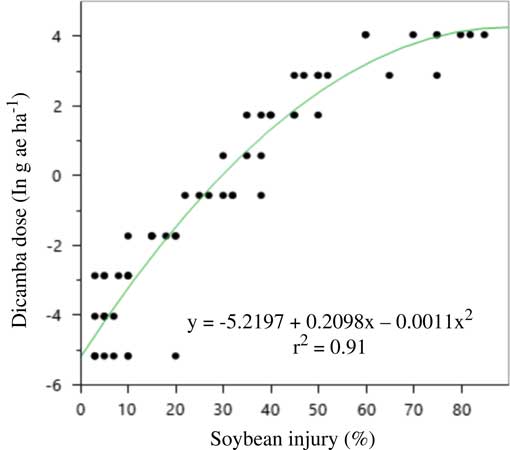
Nonlinear regression parameter estimates, standard error, and confidence intervals for the 2015 and 2016 relationship between soybean injury at 21 d after application and dicamba dose a .

a A three-parameter exponential model was used.
There was no difference between formulations and no interaction between formulation and rate in either year; therefore, data were pooled over formulations each year. Previous research has established similar findings regarding DMA and DGA salts of dicamba (Egan and Mortensen Reference Egan and Mortensen2012). In both years, a quadratic model described the relationship between soybean injury and rate applied. Models for each respective year were used to estimate an approximate dose of dicamba received in plots of the large drift experiment. The results are presented in Tables 2 to 14.
The amount of dicamba estimated to reach subplots as calculated by injury from the rate response experiment was greater for DGA than for BAPMA both years. This difference may be due to the volatile component being less for BAPMA dicamba or the heavier weight resulting in a greater settling velocity, assuming the BAPMA salt has not dissociated. In 2016, estimations of injury were also greater, and damage extended farther from the area applied for both herbicides.
Analytical Detection of Dicamba
Overall, results from analytical detection of dicamba in soybean tissue were variable in the rate titration experiment each year (Table 17). Dicamba was recovered in greater quantities in 2016 than 2015. In 2015, only seven plots from the rate titration experiment tested positive for dicamba, and no plants treated with dicamba lower than 5.6 g ha–1 tested positive for dicamba. In 2016, dicamba was detected at rates as low as 1.75 g ha–1. It could be that the 7-mm rainfall event approximately 6 h after application in 2015 affected dicamba adsorption. Information in the literature is limited on absorption of dicamba in soybean to a single study, where only 38% absorption occurred in the absence of a surfactant (Petersen et al. Reference Petersen, Haerlie, Hoefer and McCallister1985). Other research exists in weed species. One such article documented that 14C uptake of dicamba only reached 47% and 33% of that applied at 7 DAA to resistant and susceptible kochia (Kochia scoparia L. Schrad.), respectively (Cranston et al. Reference Cranston, Kern, Hackett, Miller, Maxwell and Dyer2001). At 1 DAA, both were reported to absorb <15% of the 14C dicamba applied. In leafy spurge (Euphorbia esula L.), absorption of radiolabeled dicamba was 60% at 72 h after treatment (Lym and Deibert Reference Lym and Deibert2005). In the absence of all dicamba being taken up by soybean or weeds, that remaining on the leaf surface could possibly be rehydrated and converted to the dicamba acid with dew each evening. One potential explanation for differences between 2015 and 2016 is that some dicamba was washed from leaf surfaces and moved to the soil, resulting in less total dicamba plant adsorption and volatilization in 2015. However, it is also possible that the rainfall event scrubbed a significant portion of the dicamba from the air surrounding the treated area, reducing the total fraction of applied dicamba that moved off-target.
Mean, standard deviation, standard error, and 95% confidence intervals for dicamba recovered in soybean tissue at each respective rate applied in 2015 and 2016 at Keiser, AR a .

a The limit for detecting dicamba was 1 ppb.
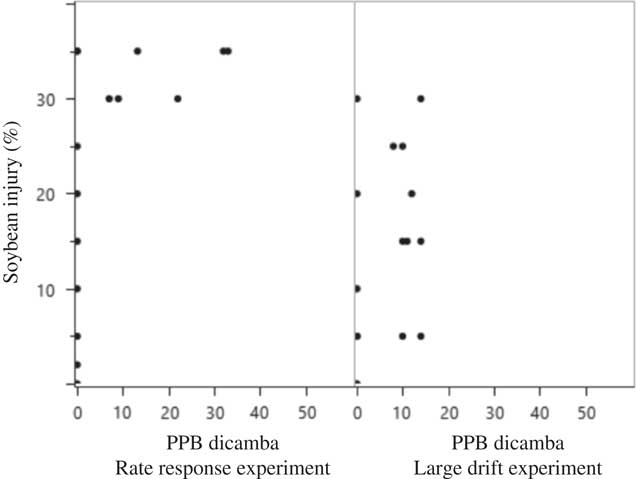
Similar injury ratings were documented between the large drift and rate response experiments. However, dicamba was recovered at greater concentrations in the rate titration experiment (Figures 6 and 7). More uniform coverage and a higher spray volume in the rate response experiment could have led to greater uptake of dicamba. More volatilization may have occurred in the large drift experiments than in rate titration experiments, because the amount of dicamba applied was greater. Additionally, it is possible that dicamba uptake from primary deposition is not equal to that of gaseous entry of the herbicide. However, an assumption made in other research was that injury to soybean from low-rate direct applications is comparable to injury from volatilization (Egan and Mortensen Reference Egan and Mortensen2012). No literature is available comparing the two forms of uptake at present. Gas exchange allowing uptake of volatile dicamba may be occurring at a higher or lower rate than absorption of dicamba salt through cuticular waxes and membranes; these variables could further complicate research pertaining to off-target movement of dicamba. Additionally, it is possible that injury ratings are not reliable for determining low-dose exposure of dicamba due to the wide range of rates that cause very similar symptomology on soybean plants.
Scatterplot matrix of soybean injury and ppb (parts per billion) diglycolamine dicamba recovered in soybean tissue harvested at 7 d after application in 2015 at Keiser, AR, in the rate response and large drift experiments. The dicamba detection limit was 1 ppb.
Scatterplot matrix of soybean injury and ppb (parts per billion) diglycolamine dicamba recovered in soybean tissue harvested at 7 d after application in 2016 at Keiser, AR, in the rate response and large drift experiments. The dicamba detection limit was 1 ppb.
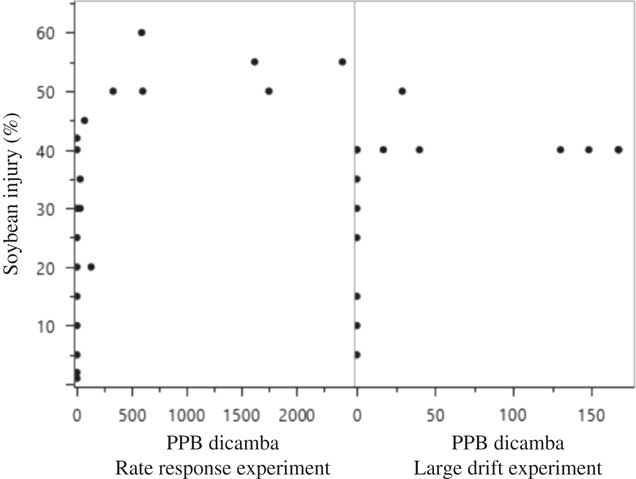
Even in plots having 25% to 40% injury, the presence of dicamba could not always be detected in the soybean tissue, meaning that individuals collecting tissue following observed injury caused by dicamba may obtain a false negative (plants showing symptoms with no dicamba analytically detected) from an analytical report (Figures 6 and 7). The variability in data along with false negatives seem to indicate that visible-injury ratings may detect dicamba more efficiently than the analytical methods employed in this experiment. Previous research by Andersen et al. (Reference Andersen, Clay, Wrage and Matthees2004) also attempted to recover dicamba residue from soybean foliage. Their research proposes that dicamba is either translocated to roots or metabolized by aboveground meristematic tissue, as the ability to recover dicamba from foliage diminished rapidly over time. Petersen et al. (Reference Petersen, Haerlie, Hoefer and McCallister1985) found that 66% of absorbed dicamba was exuded from roots, which would likewise reduce detection in the plant. Other research documented 10% and 64.5% of 5-OH dicamba (dicamba metabolite) was found in the treated leaf of susceptible and resistant kochia, respectively, at 7 DAA of [14C]dicamba (Cranston et al. Reference Cranston, Kern, Hackett, Miller, Maxwell and Dyer2001).
Practical Implications
Results from the rate response study indicate that soybean is equally sensitive to dicamba formulations containing the DGA or BAPMA salts when exposed to low rates at vegetative stages. In other research, no difference in soybean sensitivity between dicamba formulations of DGA and DMA salts was found (Egan and Mortensen Reference Egan and Mortensen2012). However, the distance to soybean having 5% secondary injury was reduced by half in the BAPMA large drift experiment in 2016. It should be noted that in 2016 BAPMA dicamba moved 108 m (1% injury) via secondary drift and was documented to cause 5% injury at 63 m from only a 1,444-m2 (0.14-ha) application area. With use of BAPMA dicamba in DR crops, application areas will increase. Although primary movement should remain constant, it is likely that secondary movement (particularly the volatility component) of dicamba will increase, causing injury to nearby non-DR soybean. Our research could also be a best-case scenario for POST application, in that previous research has shown an increase in volatile loss of dicamba after it contacts soybean foliage, as opposed to when it is deposited on a silt loam soil (Behrens and Lueschen Reference Behrens and Lueschen1979). Hence, if a dicamba application is delayed to a late vegetative stage when more foliage exists, subsequent secondary drift could be magnified.
Further confounding the results is the timing of POST herbicide application in these trials. In 2015, POST applications of glufosinate were made 1 wk after initiation of the drift event. However, in 2016 a POST glufosinate application was made 3 d prior to the drift event. Previous research has documented that some herbicides may increase soybean injury incurred from dicamba when applied simultaneously (Kelley et al. Reference Kelley, Wax, Hager and Riechers2005).
Based on the dicamba residue results, it does not appear likely that the analytical methods employed are sufficient for detecting dicamba in soybean, even when tissue samples are collected as early as 7 d after a drift event. The fact that dicamba cannot be easily detected using analytical techniques may be extremely important when trying to determine the actual auxin herbicide responsible for injury to soybean, especially when multiple auxin herbicides are used for preplant and in-crop applications in an array of crops.
Primary movement may be adequately mitigated by use of downwind buffers and application practices, but secondary movement (i.e., pesticide movement > 30 min following application) is not easily resolved. With primary movement, wind direction during application provides insight into risk for injury to susceptible crops in the downwind direction; however, injury from secondary movement resulting from changes in wind direction following application poses a risk that is difficult to account for during the application. Ultimately, a single-direction buffer may be adequate for primary movement; however, multidirectional buffers are necessary to protect non-DR soybean and other sensitive vegetation from secondary movement.
Acknowledgments
This research was funded by the Arkansas Soybean Promotion Board. No conflicts of interest have been declared.


 Open access