



DISCUSSION POINTS
-
• The electricityFootnote * market, which is unnecessarily complex, is fundamentally only suited for a small club of fuel-conversion electricity providers, not the large number of providers, the public engagement, or the renewable electricity generation required in the 21st century.
-
• Subsidies build infrastructure and a choice has to be made to steer subsidies toward the renewable energy future to give clear signals to investors and to avoid paralysis. Photovoltaic (PV) still requires subsidies, not because it is not competitive, but because the infrastructure needs to be changed from a fossil fuel-based to a renewable energy-based one.
-
• Renewables are part of the solution to improving the grid and making it more resilient.
Introduction
When all 196 of the world's countries signed the Paris Agreement in December 2015, they fixed the first universal intention to hold global warming well below 2 °C, and to pursue efforts to keep it within 1.5 °C, a diplomatic achievement. The plans to limit climate change, the ‘Intended Nationally Determined Contributions’ (INDCs), submitted by each country to date, however, fall short of this goal. While the INDCs would improve on current policies (which will lead to a warming in the range of 3.3–3.9 °C), they will limit the warming to only 2.4–2.7 °C, significantly warmer than the 1.5–2 °C limit Footnote † . 1 The Paris Agreement now has set the stage for action on climate change, and the process of working out specific plans to meet these targets still lies ahead. Fossil fuel combustion is responsible for 85% of global anthropogenic CO2 emissions. 2 Estimates of these greenhouse gas (GHG) emissions by sector assign about 72% to the energy sector (of which 44% is in electricity & heat, 19% in manufacturing & construction, 18% in transport, 12% in other fuel combustion, and 7% in fugitive emissions). Therefore, a focus on renewable energy is a key element in plans that address climate change. 2
What is the status quo and how much investment in renewables is required to satisfy the Paris intention to keep the global warming well below 2 °C? The status quo is a situation of increasing renewable energy investments and installations. Despite unusually low oil prices in 2015 (only ∼ $50 per barrel after a price level of > $100 between 2011 and 2015), the investments in renewable energy in 2015 amounted to a record $329 billion, with 64 GW of wind and 57 GW of solar having been installed globally last year. Reference MacDonald3 While this sounds impressive, the current rate of renewable investments are still not enough to keep global warming well below 2 °C. An analysis by the International Renewable Energy Agency (IRENA) reveals that achieving this goal requires annual investments of $500 billion until 2020, growing to $900 billion between 2020 and 2030. 2
Over the past forty years, the electrical energy supply has expanded by a factor of ∼4 (from ∼6000 TWh in 1973 to ∼23000 TWh in 2013). Still predominant, fossil fuels were used to generate 77% of the electricity mix in 2014, essentially the same share (78%) they contributed in 1973, four decades earlier. In 2014, renewables accounted for 23% of the electricity supply, of which hydro contributed 17% and all other renewable sources together contributed about 6%. Fig. 1 shows a comparison between 2013 and 1973. The relative amount of coal generation has actually increased. 5 The fastest-growing fossil fuel in 2013 was low priced coal, and coal-fired generation increased in all regions of the globe. 6 Nuclear power reached its peak contribution of 17.6% in 1996, and has been on the decline since then. Reference Schneider and Froggatt7
World electricity generation by technology, 1973 and 2013. 5

To limit the global warming to below 2 °C, the energy supply, not only electrical energy but also heat and transport, needs to be substantially decarbonized. According to IRENA's analysis, the renewable share of the total final energy consumption needs to double from a 2010 baseline of 18% to 36% in 2030. This corresponds to renewable energy technologies generating a third of all energy: 44% in power, 38% in buildings, 26% in industry, and 17% in transport. 2,8
Because renewable electricity generation by PVs is an important element in decarbonizing the electricity supply, the discussion of the economics and the social costs and benefits associated with PVs can be expected to intensify. There have been conflicting views as to the policy support new PV installations should receive. The sudden changes in support policies in Europe, for example, have caused markets there to stall. (In this article, the installed capacity in Watt-peak (Wp) will be used to characterize the size of a PV system.) The growth in European Union (EU) installations dropped from ∼20 GWp added in 2011 to only about 7 GWp in 2014. 9 With increasing manufacturing volumes, PV manufacturers have been able to reduce the cost of production, allowing the price of PV panels to be reduced by a factor of 4 (from ∼2 €/Wp to ∼0.5 €/Wp) between 2010 and 2015. Reference Mayer10 Nevertheless, many PV manufacturers are struggling, and PV manufacturing in Europe has almost been eradicated. The aim of this article is to delve into economic and social issues that frame the competitiveness of PV as compared with fossil fuel/nuclear generated electricity.
The cost of a kWh generated by a PV system is often compared to the price of electricity from the grid, when in actuality these two quantities are like apples and oranges. Policy support and subsidies, as discussed in the preceding Viewpoint article, also complicate a comparison between fossil fuel and PV electricity. Furthermore, the valuation that the energy market ascribes to a kWh of electricity is also geared to the cost structure of fossil fuel power plants, in contrast to the cost structure of renewables. Electricity prices, the energy market and subsidies are discussed in the first section. Another way of comparing the cost of a PV-generated kWh to a kWh generated by other technologies is to calculate the levelized cost of electricity (LCOE). This is an estimate of all the costs that a system is likely to incur over its lifetime, divided by all the kWh it is expected to generate, and is discussed in section “The levelized cost of electricity”. Another life-cycle based metric, the energy return on (energy) investment (EROI), which estimates the energy delivered divided by the energy needed to deliver it, and claims to signal the social worth of an energy technology, is critically discussed in section “The energy return on investment”. The costs associated with environmental damage and health care, climate change and water depletion, among others, which follow as a consequence of electricity generation are also real costs paid by society through taxes and insurance. Even though these are not part of the electricity price, they are part of the ‘true cost’ of an electricity generating technology. Section “Figuring in the environmental and social impacts into the ‘true cost’ of electric energy” presents a life-cycle assessment of the environmental and health impacts of conventional electricity as compared to PV electricity. Increasing the amount of renewables on the grid requires some adjustments. Section “Grid investments” looks at some of the issues associated with investments to the transmission and distribution electricity grid, which are required anyway in both the US and Europe, due to an aging infrastructure and discusses the need for electrical energy storage, to accompany PV-generated electricity. The social and economic consequences of increasing PV installations, in terms of creating jobs, stimulating regional value in an economy, and motivating citizens to actively engage with their energy consumption patterns is discussed in section “Economic and social consequences and opportunities”.
Electricity prices, the energy market and subsidies
To make a level comparison between PV and fossil fuel electricity, it is necessary to look at the interplay between costs, prices, the market, and subsidies. Most often the first point of comparison is the retail price of residential grid electricity, so it is instructive to understand what this price does and does not include.
In Europe, the US, and many other countries, the price of grid electricity includes components that reflect charges for electricity generation and distribution, energy taxes, and value-added tax (VAT) (Fig. 2). The component for electricity generation (referred to as energy in Fig. 2) is composed of the wholesale electricity price, which is determined on the energy market, as well as a margin on behalf of the retailer. Reference Linden, Kalantzis, Maincent and Pienkowski11 In contrast, distribution tariffs, energy taxes and VAT are determined through national fiscal and regulatory processes. Reference Dromacque, Bogacka, Ebnet and Szabó12 It is a complicated compromise between the desire to create a market for electricity services, while still trying to cover the ‘public service obligation’ to ensure that all segments of the society have access to electricity.
Residential electricity prices in selected European cities and EU average electricity price, from February 2015, showing break-down of component charges. Reference Dromacque, Bogacka, Ebnet and Szabó12

The wholesale electricity price covers only the ‘marginal costs’ of generating electricity. These are the short-run variable operating costs, i.e., primarily the fuel costs. Capital costs and other fixed costs (e.g., costs for building the power stations) are not covered in the marginal cost. Renewable energy technologies such as wind and solar have no fuel costs and are considered to have zero marginal costs.
The electricity market protocol is to fill demand giving priority to the generation with the least marginal costs up to the most expensive, i.e., according to the so called ‘merit order’. A particular electricity plant, however, will not be able to cover its fixed generating costs when it sells electricity and sets the market price. It must passively wait until a more expensive electricity plant is setting the price, which it will also receive for its electricity, allowing it to cover its fixed costs. The competition over the marginal costs can be seen as an artificial competition if it covers only a minor fraction of the total costs. Conventional electric power generators (‘generators’) have adapted this system so that plants with the lowest fuel costs and the highest capital costs (nuclear) are the first to be brought on-line, and those with the highest fuel costs and lowest capital costs (gas) are the last to be brought on-line. It is the composition of the club of electrical power generators, ordered by their specific marginal costs, that determines the ability of an electric plant to passively recover its capital costs.
Designed around the 20th century plant technology and utility monopoly structure, this system of electricity allocation makes sense if the public has already subsidized the electric plants, and the variable fuel costs outweigh the fixed costs. Reference Keay13 It works when demand is growing at a predictable rate ensuring that all the generators in the club will surely sell electricity, and the chance that new electric power generators will come on line is practically zero. The flip side is, however, that the addition of new members, especially those with marginal costs ranging across the lower end of the spectrum, will jeopardize the ability of market players to recoup their fixed costs and their addition is therefore opposed. This is why priority connection of renewables was required by law to enable their participation in the market.
Since a competitive system is defined as one in which any independent provider is free to participate and sell at a fair price offer, the electricity market system is not competitive. In addition, the trading price is not a ‘fair price’ as it is only a partial recompense: the fixed costs are passively obtained through the make-up of the club.
The addition of plants with low or no marginal costs, like wind and solar, causes the wholesale price to be low. However, the consumer, who pays ever rising retail electricity prices, does not experience any relief from the lower wholesale price. It's worth noting that one of the promises when the electricity market was created was that it would benefit consumers. Reference Spence14 EU-28 retail prices have steadily risen by more than 30% since 2007, during which time the tax components have increased by more than 8% per year on average for households and industry. Reference Linden, Kalantzis, Maincent and Pienkowski11,15
While the energy portion of the retail price of electricity is determined on the market, regulators determine the larger share of the price which covers taxes and network charges. These latter charges are intended to cover mainly the distribution and transmission system operators' (SOs') capital expenditure, which reflects the particular design of their portion of the network, but also includes operational and maintenance costs, and costs related to electricity losses in the system.
Current electricity pricing mechanisms are not working well, as evidenced by the recent spate of electricity tariff deficits in European countries. The number of countries facing an electricity tariff deficit increased from four in 2007 (relating to 26% of electricity consumed in the EU-28) to eleven in 2012 (61% of the EU-28 electricity). A recently published study by the European Commission (EC) explains that debts have accumulated in the electricity sector, most often in the regulated segments, but also in the competitive segments. Reference Linden, Kalantzis, Maincent and Pienkowski11 The debts are due to inadequate pricing, lower demand, the increase of generators with low marginal costs, and the price of crude oil. Reference Linden, Kalantzis, Maincent and Pienkowski11
In Spain, for example, an electricity tariff deficit, estimated at some EUR 30 billion (3% of Gross Domestic Product (GDP)) arose between 2000 and 2013. Reference Linden, Kalantzis, Maincent and Pienkowski11 Policy support for all renewable energy technologies was responsible for about a quarter of the entire amount, but it took the blame for the entire mismanagement of the energy system. Among the contracts the Spanish underwrote for renewable energy were those for PV projects signed in the years 2004–2008 when PV system costs were significantly higher (i.e., in the range of €0.23–0.44/kWh). It's worth noting that had the ‘early’ systems not been subsidized, the less expensive systems could never have been developed. Already by the end of 2011, prices for PV electricity had dropped to €0.124/kWh, below the residential retail price of €0.142/kWh for grid electricity. While investment in renewable generation has positive consequences (see section “Economic and social consequences and opportunities”), the mismanagement and/or failings of the current energy system has created deficits that continue to persist.
The lion's share of Spain's deficit originated through regulation that kept retail electricity prices, including for industrial customers, artificially low for over a decade. Other contributors to the debt were transmission and distribution costs, “extra-peninsular costs”—compensation for higher electricity costs in (Baleares, Canary Islands etc.), annuities to cover the tariff deficit in the previous years and other costs. The aim was to contain inflation, protect consumers, and maintain the competitiveness of the Spanish industry. Unfortunately, it caused Spanish utilities to accumulate significant debt, which the government subsequently socialized and took on as a sovereign debt. Faced with declining demand for electricity (due to economic conditions), and an excess in generating capacity along with a mounting sovereign debt, Spain decided to halt new investments in renewable generation. The incorrect notion, however, that the debt is entirely due to investments in early ‘expensive’ renewable energy systems led to renewable energy, and PVs in particular, to becoming in effect a scapegoat for the failings of the energy system in Spain. Reference Couture16
The failures of the energy market appeared when the club of generators grew and the incumbent generators could no longer recover their capital costs. A solution often proposed by the incumbents is in the form of a ‘capacity market’. Not a real market, but rather an administrative device to work out the extra costs electricity customers should pay to subsidize the ‘stranded’ (unrecoverable) capital costs so that fossil fuel plants remain on-line. Varieties of these aid mechanisms are used in Finland, Greece, Ireland, Italy, Poland, Spain, and Sweden. 17 The EC is concerned that capacity mechanisms contradict the aim of phasing out fossil fuel subsidies, and has launched an inquiry into the distorting effect they have on competition or trade. 18 For end consumers, capacity mechanisms mean an additional rise in the price of electricity. Reference Meulemeester19
Benefits to the retail customer from the current electricity market are not clear. The retail customer does not realize any benefit from low energy market prices and has minimal engagement with the market. In contrast to 20 years ago, the consumer now has the possibility to switch between energy retailers, saving on average about €100 per year. However, with switching rates of only around 10%, the majority are not engaged. 20 The EC recognizes that the redesign of the energy market must focus on the integration not only of renewable energy to meet climate goals, but also on consumers, if demand is to become more flexible. 21 The EC states that self-consumption of electricity (generated by consumers for their own use) should be allowed, even though Spain's recent punitive tax on PV systems discourages exactly this. In addition to taxing self-consumption, the ‘sun tax’ also forbids that PV systems below 100 kW should receive any monetary compensation for electricity injected on the grid. Reference Roselund22 The abrupt changes in the Spanish support for PV systems has meant that many Spanish PV investments in installations and/or manufacturing made about a decade ago have since been lost. Reference Nielsen23
In the US, community-owned electric utilities (covering 14% of the US electricity supply) have reported that electricity markets are not providing competitive prices for the consumer. The rules in these regional markets are heavily skewed toward the interests of large transmission and generation asset owners. Reference Anderson24 The report finds that charges are not cost-based, and competition is hindered by the incumbents' use of market power to fight the entry of new generators into the market. Reference Caplan and Brobeck25 Monitoring the market is difficult due to complexity in the pricing resulting from using capacity, ancillary and energy markets, as well as financial products, and is compounded by the participation of financial entities that do not buy or sell power, but trade only in virtual products. Indeed, gaming and systematic manipulation is a concern. Reference Anderson24,Reference Evans26 Following up on the US General Accounting Office's recommendation that the electricity regulators take this issue on, these public power utilities are sounding the alarm that excessive profiteering in the regional markets has led to unfair electricity prices, harming customers. Reference Caplan and Brobeck25 They estimate that consumers may have paid an excess $12 billion in 2011 to generating companies that do not face genuine market competition. Reference Caplan and Brobeck25
In the EU, instances of abuse in the electricity market have also been cataloged in which firms use their market power to prevent competitors from accessing the market, or to extract benefits from competitors, customers, or consumers beyond a competitive level. Reference Klotz27 The EU created a pan European agency, ACER, to supervise energy markets in 2011, but it has had limited success in enforcing the rules due to a lack of funding and adequate support from national regulators. Reference MacDonald28 The issues with abuse highlight that the complexity and intransparency of the electricity markets do not serve the public at large.
One question that is frequently asked is why, if the cost (LCOE, see section “The levelized cost of electricity”) of PV systems is so competitive, are subsidies and/or policy support needed for renewable electricity installations? The long answer is that the current infrastructure was subsidized over many years and tailored to the incumbent technologies. 29 Infrastructure here not only refers to the physical infrastructure, but also to the regulatory, political and economic framework that serves institutions, such as the energy market, the utility regulatory system, and the power, grid, and other massive projects built with government funds. The short answer is that the electricity market does not work.
As explained above, close inspection of the electricity price reveals that regulation and energy market design really determine the price, not the market fundamentals of supply and demand. Due to the noncompetitive foundation of the electricity market, incumbent generators see their profitability threatened by, and therefore oppose, the addition of more electricity providers. Therefore, there has had to be some sort of policy action to introduce renewable energy generation into the grid. Germany pioneered the application of the feed-in-tariff (FIT), the most successful policy support mechanism to date.
As of the beginning of 2015, Germany had the largest installed capacity of PVs (∼38 GWp) of any country. The successful policy responsible for this is the Energie Einspeise Gesetz (EEG) law that was implemented as early as 2000. It set up a FIT to allow investors a reasonable return on investment, even on relatively young technologies. Reference Wirth30 The EEG law mandated that renewables should have priority connection to the grid, and that a FIT will be paid by the electricity transmission system operator to the PV owner for the renewable electricity injected onto the grid. A levy for the EEG is added on to the price of electricity, which is paid by all electricity users, except large industrial users operating in trade-sensitive industries, who are exempt from paying.
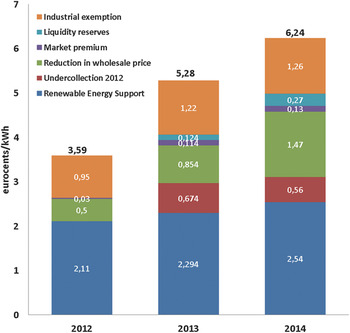
The EEG levy increased from 2012 to 2014, with the dominating components: the ‘renewable energy support’, the ‘reduction in the wholesale price’, and the ‘industrial exemption’ (Fig. 3). Figure 4 shows a schematic which illustrates how the EEG works. The EEG levy is the amount of support for renewables divided over all electricity customers. The ordinary customer pays their fair share (‘Renewable Energy Support’ in Fig. 3; arrow 1 in Fig. 4). The energy intensive industrial customers who are operating in trade-sensitive industries are considered privileged and are exempt from paying any support for renewable energy. So the ordinary customer also covers their share (‘Industrial exemption’ in Fig. 3; arrow 2 in Fig. 4). The transmission and distribution SOs receive these payments and use it to pay renewable energy installations a tariff in return for renewable electricity feed-in (arrow 3 in Fig. 4). This compensates them for the money they have invested in their renewable energy system. All the renewable energy that is not immediately consumed must be sold on the energy market. But because the energy market operates according to marginal costs, the presence of renewables (at zero marginal cost) systematically lowers the wholesale price of electricity as discussed above. Because the SOs cannot recoup the money paid to the renewable installations from the energy market, the ordinary customer is also requested to cover the difference (‘Reduction in wholesale price’ in Fig. 3; arrow 6 in Fig. 4).
German renewable levy (nominal amounts). Reference Weiss31
The EEG surcharge to cover the support of renewable energy systems is divided over all electricity users. The ordinary customer pays their fair share, as shown by arrow 1. Privileged electricity customers are exempt, and so their share is also paid by the ordinary electricity customer, arrow 2. The Transmission & Distribution SOs pay (arrow 3) renewable installations for the renewable electricity injected onto the grid, according to ‘FIT’ prescribed by the EEG law. This renewable electricity is then sold (arrow 4) on the energy market, which systematically lowers the wholesale electricity price. Because the wholesale electricity price reflects only the ‘marginal’ cost of electricity, the SO does not recoup the amount paid out in FIT payments, and requires additional compensation. This is also charged to the ordinary electricity customer (arrow 6).

Since many privileged industrial electricity customers can often buy direct from the wholesale market, they can enjoy the effects of the reduction of the wholesale electricity price provided by renewables, without having to pay any contribution. The renewable policy certainly has not made German industry less competitive. Reference Weiss31
The levy is now about 6 eurocents/kWh, and represents about 20% of the total electricity rate for residential customers, which is above 30 eurocents/kWh. It is worth noting that while the EEG levy has contributed to the increase in the retail electricity price over the period from 2000 to 2013, the rise in fossil fuel prices over this period contributed even more. 32 If the market functioned to actually cover the cost of producing energy, and if the privileged customers would pay their share of the costs, the burden on the ordinary customer could be about half the current amount.
One can wonder how the renewable electricity, even if it is priced at zero marginal cost, could have such a significant effect as to halve the wholesale electricity price, when the total renewable generation provides a relatively modest contribution to the total demand (∼20%). An empirical analysis of the German Austrian day-ahead EPEX electricity market shows how the effect of renewables is amplified on the market. German policy mandates that renewable electricity supported by a FIT must be traded on the electricity market. It is also such that roughly 60% of all electricity is allocated through bilateral contracts, not on the market. Consequently, a bit less than half the electricity traded on EPEX is renewable energy. Although all renewable generated electricity contributed about a fifth of the combined German–Austrian total demand, it constituted about 40% of the traded electricity volume in the corresponding EPEX market. If all electricity were traded on the market the decline in wholesale price would be less for 20% renewable generation. Reference Hildmann, Ulbig and Andersson33 Eventhough greater penetrations of renewables inevitably depress the wholesale price in the current market design, the amplification has exacerbated the increase in the EEG levy component that addresses the ‘reduction in wholesale price’ (Fig. 3).
The EEG, which has been so successful in stimulating the development of PV technology also stimulated cost-effective manufacturing. Even from the beginning, a gradual decrease in the tariff was foreseen with the increasing penetration of renewables. This ‘tariff degression’ was built in to stimulate and coincide with the lowering of PV module costs as greater volumes are produced by the industry (i.e., the industry's ‘learning curve’). Hermann Scheer, one of the architects of the EEG, wrote before he died in 2010 that there was a need to change the focus of the EEG from introducing renewable energy into the power market, to adapting the power market to the needs of renewable energy. Reference Scheer34 However, this approach has not been taken, to date, and abrupt, draconian measures have been implemented since 2012 to curb the renewable installations because conventional power plants are suffering from the low energy market prices. The attack on renewable subsidies (i.e., the EEG) has resulted in a stagnation of the market, if not a complete destruction of the business case for adding renewable generation to the system in Germany. Reference Wirth30,Reference Grossi35
Because the EEG law in Germany opened up the market for renewables and financed the demand for the early technology to grow, it is generally tallied as a subsidy. The point is sometimes made that technically this policy support is not a subsidy, primarily because it is not financed with public money, but rather through a surcharge to electricity users. This may be splitting hairs because the fraction of the public that does not use electricity must be very small indeed. One important difference of the surcharge to most subsidies, however, is that it is transparent and shows up on the electricity bill, in contrast to the many opaque ways (e.g., through tax breaks) that fossil fuel companies receive subsidies (as detailed in the preceding Viewpoint article). The second important difference is that while most energy subsidies persist for decades, the EEG surcharge was designed to gradually decrease until the price of renewable electricity converged to the price of conventional electricity when it would be phased out. Gradual changes are important to allow investors to operate with some certainty.
The abrupt changes in the policy support for renewables, in many European countries, have created overcapacities, tripping up many manufacturers, adding pressure for them to quit manufacturing in Europe. The many policy revisions created uncertainty for investors, especially consumers, resulting in a sharp decline in European installations. As highlighted by the EC, integrating the consumer into the energy transition is key to its success. 36 Unfortunately, both opting for ‘green’ electricity tariffs and/or installing a PV system may frustrate the participation of consumers. The European Consumer Organization (BEUC) has analyzed the current situation for small-scale renewable PV self-generation in EU Member States, identifying barriers and recommending solutions. Reference Mühlenhoff37 As 80% of EU households are in regions where generation of a kWh of electricity with an unsubsidized solar PV rooftop system is cheaper (as evidenced by LCOE calculations, as explained below) than buying a kWh at the national retail electricity price, consumers should not be discouraged from participating in the energy transition through self-generation. Reference Huld, Jäger Waldau, Ossenbrink, Szabo and Dun38
The barriers for self-generation in Europe identified by BEUC include discouragement of consumers to invest through short-term, unstable, even retroactive policies and through administrative barriers, meant for regulating big utilities, that disproportionately increase costs of private self-generation projects. Consumers are hampered by a lack of structured information on their options. Finally, consumers face high financial risks related to difficulty of access to capital and long amortization, complicated by a lack of adequate remuneration schemes for their excess renewable electricity fed onto the grid. To put consumers on a fairer footing, long-term policies need to be put in place that guarantee priority grid access. Consumers' investments in self-generation should not be restricted by limitations on network capacities nor blocked with prohibitive measures to limit grid access and use. They should be able to rely on fair remuneration for the electricity they generate and feed into the grid. Reference Mühlenhoff37 They should not be expected, as is the case with Spain's ‘sun-tax’, to receive little or no compensation for the electricity they feed onto the grid, while paying for electricity generated by incumbents. Furthermore, they should not have to bear taxes or fees meant to help maintain the incumbents' business models and market positions. The club of generators needs to change if the energy transition will indeed happen. Interestingly, the measures that need to be taken to ensure fairness to consumers are the main ideas present in the EEG.
The inadequacy of the current system to cope with lower demand, more renewable electricity generation and increased customer engagement is revealing that the fundamental design of the energy market is incompatible with 21st century requirements. Reference Keay13
In the US, the federal solar Investment Tax Credit (ITC) has been critically important for increasing residential and commercial PV installations. It was extended at the end of 2015 for an additional 5 years. 39 The US Solar Energy Industry Association engaged Bloomberg New Energy Finance to analyze the effect of the solar ITC on installed PV capacity. The extension is expected to lead to an increase of 25 GW over the next five years. 39 State and local incentives, separate from the federal subsidy for PVs, are listed in the Database of State Incentives for Renewables & Efficiency (DSIRE). 40
Policy intervention with subsidies has been justified either to nurture the development of new promising technologies, or to support activities considered to provide more value to the public than the private sector is willing to pay. Reference Pfund and Healey41 A historical perspective gives a good idea of the energy infrastructure paid for with government funding and the duration of a subsidy is an important signal to investors. Taking a snapshot of the subsidies per year divided by the kWh of energy produced does not communicate the extent of the subsidized infrastructure, nor does it align the history of the technologies under comparison in terms of technology maturation. Figure 5 shows comparisons of historical and recent subsidies for fossil fuel and renewable energy technologies. The annualized US fossil fuel and nuclear subsidies, received over nine or six decades respectively, continue to dwarf the annualized subsidies for more recent renewable technologies (Fig. 5(a)). Reference Pfund and Healey41 The 2013 global consumer subsidies for fossil fuels are estimated to be about half a trillion US dollars, while those for all renewable technologies are only about a fifth of that amount, as depicted in Fig. 5(b). Reference Bárány and Grigonytė42 Figure 5(c) gives a breakdown of the consumer subsidies by fuel. The consequences of using the fuel, especially the environmental impacts, also have a pricetag and are generally paid for with public funds. The International Monetary Fund (IMF) figures these externalities (added to their consumer subsidies) as ‘post-tax’ subsidies which they estimate was a staggering $4.9 trillion (6.5% of global GDP) in 2013, and is projected to be $5.3 trillion (6.5% of global GDP) in 2015, as shown in Fig. 5(d). Reference Coady, Parry, Sears and Shang43 Producer subsidies, yet another category of subsidies, which are looked at in the preceding Viewpoint article, are not included in these estimates. Whether one looks at the amount of subsidies provided in a given year, or the more relevant historical annual subsidies, fossil fuels received, and continue to receive, much more substantial subsidies than all renewable technologies taken together. Reference Bárány and Grigonytė42
(a): Annual average US subsidies over historical subsidy periods; (b): Renewable and fossil fuel consumer subsidies for 2013; (c): ‘Pretax’ (Consumer) fossil fuel energy subsidies 2011–2015; (d): ‘Post-tax’ (Consumer + taxes & externalities) fossil fuel subsidies. Reference Pfund and Healey41,Reference Bárány and Grigonytė42,Reference Coady, Parry, Sears and Shang43

The total subsidy amount for fossil fuels in 2013, found by adding producer subsidies to post-tax subsidies, is in the range of $US 5.5–$US 6 trillion dollars. It is worth repeating that the global renewable consumer subsidies were only 22% of the consumer subsidies for fossil fuels, and the total renewable subsidies (US$ 120 billion) were only about 2% of the total fossil fuel subsidies in 2013. 44 The subsidies for fossil fuel electricity generation are currently unjustified, as it is neither a new promising technology, nor has more value than the private sector is willing to pay. On the contrary, the environmental damages quantified by the IMF signify that they cause more damage than can be sustained.
The political decisions that bring new generators on line with subsidies are not always in the consumers' interest. A notable example is the Hinkley nuclear plant in the UK. Since 1998, the British government has cultivated plans for a new nuclear reactor, stating at the outset that nuclear power would be funded by the private sector, and would compete with other generation on equal terms. Reference Schneider and Froggatt7,Reference Pickard45 The original idea was that nuclear could be built for less than US$1000/kW, a price expected to make nuclear competitive with natural gas generation, but by 2006 it was already clear that that was unrealistic. Reference Schneider and Froggatt7
Nevertheless, the UK took the optimistic view that a few “enabling” measures such as making suitable sites available, overseeing an assessment of the technical design through the Generic Design Appraisal (GDA) process, and putting a cap on the cost of radioactive waste disposal would bring the technology in line. The site issue was solved by considering sites previously used in nuclear generation. Electricite de France (EDF) purchased British Energy, including 8 nuclear plant sites in 2008.
Originally, various consortia involving EDF, Centrica (a British energy company), two leading German electric utilities (RWE and E.ON), the Spanish electric utility, Iberdrola, the French GDF Suez, and Scottish and Southern energy (SSE) were participating. The exiting of SSE in 2011, RWE and E.ON Footnote ‡ in 2012, Centrica in 2013 and Iberdrola and GDF Suez in 2014 left a cool air of hesitation to commit any more resources before Hinkley was demonstrably underway. Toshiba Westinghouse bought in, but put its participation on hold. Areva and the Chinese companies, Chinese National Nuclear Corporation (CNNC) and China General Nuclear (CGN), were persuaded in the meantime by EDF to join its project, but by 2015 Areva's participation looked insecure. Reference Schneider and Froggatt7 Areva, with operations from uranium mining to treating nuclear waste, needs a cash injection of about US$7 billion. The wisdom of EDF's offer to support Areva's reactors unit has been questioned due to France's stretched public finances and the long-terms risks associated with Areva's unfinished, terminally delayed, and over-budgeted reactor projects in Finland and France. Reference Ecorcheville46 Even EDF's fleet of aging nuclear plants are struggling to compete against the lower wholesale prices due to renewables, cheap coal and weak demand. Reference Patel47
In 2013, despite promises that nuclear power would not receive subsidies, and that the development would result from competition of developers and technologies, the UK government signed a contract with the only consortium still standing, EDF, CNNC, CGN, and Areva. Although prices competitive with other forms of generation were 5.3–7.5 US¢/kWh (£31–44/MWh) at that time, the contract guarantees a wholesale price of 16 US¢/kWh (£92.50/MWh), for 35 years, the most expensive power on system, and more than double the 2013 wholesale electricity price. The contract was indexed to inflation and included government loan guarantees covering about 70% of the expected construction cost. Reference Schneider and Froggatt7 These large subsidies prompted a state-aid inquiry by the EC. At the end of 2013, the Energy Act was passed in the UK, writing into law billions of pounds of subsidies for low carbon energy, including nuclear power. The state-aid inquiry was concluded almost a year later, with the UK having achieved EC legal approval for support for Hinkley Point. Reference Pickard45 Austria and Luxembourg are currently appealing the decision countering that the £17.6bn in subsidies for Hinkley Point are not compatible with EU state aid rules. Reference Buckworth, Borovas and Webber48,Reference Neslen49
The design chosen for Hinkley is the European Pressure Reactor (EPR) design, identical to the one used in EDF's flagship Flamanville project in Normandy which has been plagued by delays and escalating costs. In April, 2015, a potentially catastrophic mistake in a crucial part of the nuclear reactor in Flamanville was discovered, which may seriously affect the future of the reactors planned for Hinkley Point. Found to have critically defective steel, the Flamanville ‘pressure vessel’ is identical to the one already manufactured for Hinkley Point. Mounting costs and additional delays of several years can result. Reference Lichfield50 In June, 2015, a leaked report from France's nuclear safety watchdog highlighting faults in Flamanville's cooling system, added to the insecurity over the adequacy of the EPR design at Hinkley. Reference Pickard45
The Hinkley delays have led to 400 workers being laid off in April 2015. Reference Pickard51,Reference Chu52 In January 2016, EDF announced it would be laying off 4000 workers over the next two years. 53 More recently, the leaders of the workers' union at EDF have warned that the Hinkley project threatens the company's future, and called for French investment into the plant to be delayed for at least two years. They cite the sudden resignation of EDF finance director Thomas Piquemal as evidence that misgivings about the project are reverberating throughout the company. Reference Willsher and Farrell54 The riskiness of the Hinkley project for EDF has been confirmed by an analyst with the investment bank, Royal Bank of Canada’s (RBC) Capital Markets, as well as by the Cour des Comptes—the French equivalent of the UK's National Audit Office. 55
Hinkley is the test case, blazing the trail of a new mini-‘nuclear renaissance’ in the UK after two decades of no nuclear construction, and it is being watched as a test case for the viability for new nuclear in Europe. The proof of the pudding is revealing that nuclear is no longer economic, nor is the technology appropriate—it is too complex and too dangerous for boiling water in a steam cycle. Reference Davies, Willsher and Farrell56
The levelized cost of electricity
Section “Electricity prices, the energy market and subsidies” shows that the retail price of grid electricity is not a good indicator of the cost of electricity generation and is therefore not an adequate benchmark for assessing the cost competitiveness of different technologies. A metric which is often used is the LCOE.
The LCOE (often expressed in $/MWh or ¢/kWh) represents the present value of the total cost of building and operating a generating plant per unit electricity produced, over an assumed financial life and duty cycle. While this metric seeks to spread or ‘levelize’ the costs of operating an electricity generating plant over the different phases of its life (i.e., construction, operation, dismantling), it is calculated differently for different technologies. Two interrelated differentiating factors are: differences in subsidies and in cost structures.
An illustration that different subsidies apply to different technologies, can be found in the case of nuclear LCOEs. Nuclear plants regularly rely on public subsidies for accident insurance and waste disposal. Because these costs are likely to be catastrophically high (as e.g., at Fukushima), nuclear is generally subsidized by government assurances, including public money to cover accidents and dealing with the radioactive waste. PV plants do not need such catastrophic insurance.
The very different cost structures of fossil fuel plants as compared to renewable plants also play a role, especially in terms of financing timetable and requirements. The latter require up-front capital expenditure to purchase the conversion equipment, short installation times (weeks to months), no fuel costs, and very little operating and maintenance costs. Fossil fuel and nuclear plants require capital over significant construction times (years), volatile fuel costs, and significant operating, maintenance, and decommissioning costs. Reference Schneider and Froggatt7
The convention of using ‘overnight costs’ in the LCOE's of nuclear and other fossil fuel plants means that the financing costs for plant construction is not included in their LCOE calculations. The use of overnight costs for fossil fuel plants, with financing costs of construction which takes years or decades, is significant ($12 billion in the US as of 2008), unlike for PV plants with their shorter installation times. Reference Shrader-Frechette57 In addition, the nuclear industry has consistently overstated the amount of electricity generated, claiming very high capacity factors (90%), despite an actual track record showing an average of 79%. If these and other real costs are included, the cost of nuclear power is roughly 6 times more expensive than indicated by conventional LCOEs. Reference Shrader-Frechette57 These cost trimmings enable a systematic under-valuation of the generation costs of these technologies, improving their competitiveness.
Within a given technology, LCOE's can also vary due to implicit assumptions about the energy produced by a system or the costs over its lifetime. In an analysis of a PV system situated in different locations, it was found that the LCOE was influenced more by financing parameters (i.e., the discount rate) than by the amount of insolation. Reference Darling, You, Veselka and Velosa58 A substantial amount of literature has arisen to discuss the methodologies and explain the sensitivities of the PV LCOE calculation, most notably to financing parameters. Reference Branker, Pathak and Pearce59 Some LCOE analyses, such as those by the investment banking firm, Lazard, are increasingly explicit about the assumptions used. 166
Lazard recently published an assessment of the levelized cost of energy for electricity generation in the US, explicitly indicating values with and without subsidies (Fig. 6). 166 The cost of providing electricity using wind or solar electricity has decreased so significantly over the past 5 years, that it is now competitive with coal and/or natural gas in some markets. The cost, after applying federal tax subsidies, of utility-scale PV falls in the range of 4.7–5.7 ¢/kWh, and for roof-top PV for an average American residential consumer in the range of 13.9–22.7 ¢/kWh. Without subsidies, utility PV costs range between 5.8 and 7.0 ¢/kWh (Fig. 6), with residential PV between 18.4 and 30 ¢/kWh. Commercial rooftop installations fall between utility and residential, at 8.6–15.3 ¢/kWh with a subsidy, and 10.9–19.3 ¢/kWh without. Subsidized wind ranges between 1.4 and 6.3 ¢/kWh, and unsubsidized wind between 3.2 and 7.7 ¢/kWh. For comparison, Lazard calculates the LCOE of natural gas (combined cycle) electric energy in the range between 5.2 and 7.8 ¢/kWh, and coal electricity between 6.5 and 15.0 ¢/kWh. 166
The LCOE of utility scale PV power plants have declined by 82% in 6 years. In 2015, the lower end of the LCOE range, without subsidies, was $58/MWh (5.8 cents/kWh). 166

The levelized cost of roof-top PV electricity systems (<25 kWp) in Europe, assuming fair compensation for electricity fed into the grid (‘net-metering’), but not assuming any subsidies or FIT, is equal to or less than residential electricity prices for 79.5% of Europe's population. Furthermore, a typical 20-year amortization period allows for extremely competitive electricity of about ∼4 ¢/kW h (0.04 EUR/kWh) for the rest of the systems lifetime. Reference Huld, Jäger Waldau, Ossenbrink, Szabo and Dun38
Consistent with the calculations by Lazard, utilities in US states such as Texas and California are signing deals to purchase electricity from solar farms over the next 20 years at rates as low as less than 5 ¢/kWh. More than 22 GW were installed in 2015 worldwide, up from the 14 GWp installed in 2014, which roughly doubled the utility installations in 2013. Utilities installed 23% of the total 16.3 GWp (reported here for utility scale PV plants with installed peak capacities greater than 4 MWAC) installed nationwide in the US up to 2014, and have grown rapidly worldwide (Fig. 7). Reference Cardwell60,62–64 Interestingly, utility scale installations in Europe increased for the first time in 2014 since 2011, primarily due to installations in the UK. Reference Bennett61
Annual installed capacity worldwide, in GWp, of utility scale PV plants >4MWAC. 64

While the LCOE of renewables is sensitive to the financing of the system, because most of the cost is in the initial capital investment, there is also a positive aspect to this. The LCOE of a PV system will change very little over its lifetime, while that of a fossil fueled system is likely to change unpredictably because of the volatility of fossil fuel costs. Indeed, as mentioned above, the price of crude oil was one of the factors in the electricity tariff deficits in Europe.
Coping with the risk of volatility in fuel prices is the new normal for all petroleum-based generation, including natural gas, but not, of course, for renewables. Reference Villar and Joutz65 Natural gas electric power generation can, during a period of low gas prices, appear to be very cost-competitive, but can be greatly affected by a spike in fuel price. The market value of crude oil is 5% of world GDP and its price can change by 50% within a matter of months, leaving few short-term options to reduce consumption. Because of widespread knock-on effects on other segments of the economy, energy price volatility is a major concern. It hurts the economy, delaying business investment, requiring costly reallocation of resources, reducing consumer expenditure, and slowing job growth. Reference Klevnäs, Stern and Frejova66 Therefore, not only would a spike in natural gas price affect the electricity price, it is likely that it will be accompanied by ripple effects slowing the economy. In contrast, once a PV system is purchased and installed, the cost price of the electricity it delivers over its lifetime of 25–30 years has been determined. It is a stable and secure economic investment. Reference Klevnäs, Stern and Frejova66
The energy return on investment
The EROI is a metric that is frequently encountered in comparisons of energy technologies, but there is at present a lack of consensus as to its usefulness. Net energy metrics, such as the EROI, claim to put the relevant information about the viability of energy technologies into a nutshell. It is interesting to open up this nut and see what is inside.
 $${\rm{EROI}} = {{{E_{{\rm{delivered}}}}} \over {\left( {{E_{{\rm{infrastructure}}}} + {E_{{\rm{process}}}}} \right)}}$$
EROI quantifies the amount of energy delivered, E delivered, in relation to the energy required to deliver it, E req, (where E req is the sum of the energy for infrastructure and for processing the fuel) (Eq. (1)). The EROI does not explicitly reflect energy conversion losses (Fig. 8). The energy required by the process and infrastructure is often calculated using a life cycle assessment (LCA).
A schematic showing the extraction and processing of a fuel. E fuel is the energy of the primary feedstock fuel. The energies required for the infrastructure (E Inf1) and processing (E proc1) to convert it to an energy carrier, E fuel2, are no longer available for use in the next stage, fuel conversion. The conversion of the fuel to an energy carrier such as electricity involves energy for infrastructure and processing (E Inf2, E proc2), as well as conversion losses, E conv.

A primary energy source, which is energy in its natural state, is converted to secondary energy carriers through one or more process steps until it is ready for end use. While energy is never destroyed, there is always some fraction of energy, the entropy, that gets swallowed up in irreversible pathways, such as friction or waste heat. Therefore, the amount of useful energy, the exergy, becomes smaller after each process step. The exergy is an indication of energy quality. Footnote § Energy carriers of different quality need to be converted to their primary energy equivalents to be properly summed. This ‘quality challenge’ has been at the heart of many criticisms of net energy analysis [Ref. Reference Bakshi, Gutowski and Sekulić67, p. 101]. While an energy calculation appears to have a certainty as crisp and sure as gravity, the conversion of secondary energies to their primary energy equivalents can be quite ambiguous.
Primary energies for renewables and nuclear are calculated in different ways by different energy statistics sources (Internation Energy Association (IEA), Energy Information Administration (EIA), United Nations (UN), British Petroleum (BP), World Energy Council (WEC))Footnote **. The methods employ different multipliers, or ‘primary energy factors’ (equal to 1, 2.6, or 2.9), to calculate the amount of the electrical energy from the primary energy amount, and may lead to significant discrepancies in energy use data. Reference Macknick68 Caloric assumptions for the primary energies of fossil fuels may also vary between sources. Reference Macknick68 Furthermore, the simple use of the caloric content as the primary energy of a fossil fuel may easily overlook the energy required to extract, refine and transport it.
A recent study by Ecofys demonstrated that the various primary energy factors for renewable energy sources have opened up a technocratic space in which the same physical system, consisting of a mix of renewable and nonrenewable energy sources, can be characterized in significantly different ways depending on the definition of primary energy used. Specifically, they analyzed the effects of different primary energy accounting methods on the implementation of three European policy directives Footnote †† . A conclusion of this study was that an inconsistent use of primary energy factors can disguise the actual energy use such that it may even have adverse effects on reaching climate targets. Reference Surmeli-Anac, Hermelink, de Jager and Groenenberg69 In addition, they note frequent issues with primary energy factors for electricity are: scientific ambiguity, lack of consistency, and lack of transparency. Reference Surmeli-Anac, Hermelink, de Jager and Groenenberg69
Adding to the ambiguity, current EROIs are most often calculated using economic data that requires that monetary amounts be converted to a primary energy equivalent. This requires using energy intensities of economic sectors which is not very precise, as well as currency conversions which are changeable. The standard EROI (EROIst) is applied to fossil fuel extraction and covers the production phase, but not the exploration and development phases (Fig. 9) [Ref. Reference Hall, Lambert and Balogh70, p. 142]. As these latter phases are currently becoming more expensive, they are playing a decisive role in the business case for development of reserves. That these upstream supply chain links are not included weakens the ability of the EROI to reflect the viability of a fossil fuel, eventhough it may be difficult to model the exploration and development stages because they are less standardized. The EROI calculation has also been stretched over more downstream links in the supply chain, and even over a society as a whole.
Boundaries of the standard (EROIst), and the point of use (EROIpou) EROI analysis based on Ref. Reference Hall, Lambert and Balogh70.

Charles Hall is credited with having originated the EROI when he studied migrating fish. He compared the energy fish gained by migrating to new feeding areas to the energy expended in the migration process. Reference Murphy71,Reference Hall and Klitgaard72 These biological origins of the metric are often cited to bolster claims that the EROI is almost a rule of nature. Reference Mulder and Hagens73
Figure 10 illustrates the concept: an energy source providing 10,000 units of gross energy is accessed by the expenditure of the energy required, E req, to make it available for use. Reference Murphy71 The delivered energy, E delivered, is then used to maintain and grow the system, which is considered to be the economy. The idea is that more energy delivered is clearly better. A declining trend in the EROI of oil & gas, which slid from about 30 in 1995 to 18 in 2006, has prompted a discussion of what minimum EROI is required by society. The conspicuous threshold of 1 is often characterized as inadequate for a modern economy, which is generally perceived as requiring a glut of surplus energy. Reference Hall74
An explanation of the EROI concept, based on Ref. Reference Murphy71. The energy source provides a gross energy of 10,000 units in all cases. The table illustrates the calculation of EROI for different amounts of E req. The point is that if this system requires a minimum of 5000 units to maintain itself, then the minimum EROI this system can sustain is 1.

Selected EROI results for fuels and electricity from the literature are listed in Table 1. Note that it is not valid to compare an EROI for a fuel with that of an electricity generating technology because the system boundaries of the calculations embrace different supply chain links. Reference Hall, Lambert and Balogh70,Reference Brandt, Englander and Bharadwaj75,Reference Raugei, Fullana-i-Palmer and Fthenakis76
Ranges of EROI values for fossil fuels (left) and for various electricity technologies (right), from diverse geographic locations and from the timeframe after 2000. Reference Hall, Lambert and Balogh70,Reference Brandt, Englander and Bharadwaj75,Reference Raugei, Fullana-i-Palmer and Fthenakis76

The spread of values from relatively few references is quite large. For example, the global average (2006) for oil and gas fuel is reported to have an EROI of 18, with a standard deviation of 14, from the data shown in Ref. Reference Hall, Lambert and Balogh70. There are clearly differences due to the geographic location of the extraction site but the reasons and the effects on the calculations are not elaborated. The authors concede that the statistical basis for these numbers is not (yet) solid. Reference Hall, Lambert and Balogh70,Reference Murphy71,Reference Mulder and Hagens73 The EROI result for PV electricity ranks between those for oil and coal electricity. Coal and hydro have EROIs at the top of the electricity scale. Oil sands fuel is ranked with the lowest value on the fuel list, begging the question of whether the secondary energy after processing of the oil sands would have an EROI below one.
The interpretations of the EROI values are sometimes conflicting. For example, in the case of oil sands, the low EROI was considered not to inhibit the development of oil sands. Reference Brandt, Englander and Bharadwaj75 In contrast, renewable energy is presented as an uneasy bet, questionable only because most renewable energy conversion devices are manufactured using fossil fuel electricity. Reference Hall, Lambert and Balogh70 While this is undoubtably true, the more renewable energy in society, the smaller the fraction of nonrenewable ‘support’ needed for renewable energy systems. Therefore, this point is self-defeating, and not a real criticism of renewable energy. If anything, it signals that the transition to renewables should move more quickly.
The EROI is claimed to be a ratio of the benefit (energy generated) to the cost (energy consumed) of an energy extraction or conversion process. As the EROI approaches unity, the thermodynamic and economic favorability of the process decrease. Reference Zhang and Colosi77 The proponents of the EROI, however, take the claims much further. The EROI ratio is declared to signal the environmental, as well as the energetic and economic, implications of a technology [Ref. Reference Murphy, Hall, Dale and Cleveland78, p. 1889]. EROI is claimed to be a pre-eminent indicator of the biophysical economy. Reference Murphy71,Reference Mulder and Hagens73 They allege that because every living thing must generate a great deal of surplus energy to survive, there is a law of nature which they would call the law of the minimum EROI [Ref. Reference Hall and Klitgaard72, p. 244]. And finally, they assert that the EROI is an indicator of civilization, that a higher EROI correlates with a higher standard of living and human development index (HDI). Reference Lambert, Hall, Balogh, Gupta and Arnold79
The problem with the EROI metric as a meaningful biological indicator is that it does not capture the complexity of energy use in a biological system or in a modern society. In both biology and society, energy use leads to ‘metabolic’ by-products which can be toxic. Because build-up of these by-products influence the system, biological systems typically have feed-back loops to regulate the way the system works, to avoid an over-production of energy or a build-up of by-products. An example is the human body, in which excess blood sugar can be dangerous. After increased sugar absorption in the intestine due to a big meal, insulin is secreted to activate processes to remove it from the bloodstream, and bring the system back to a balanced level. 80 Feed-back loops are hallmarks of biological systems because they are so successful in allowing organisms to function in a wide range of conditions. The EROI does not include any idea that growth must be balanced or regulated in any way. In biological systems, unregulated growth as is implied in the EROI concept, is typified by cancer.
In contrast to the pursuit of as much surplus energy as possible, nature typically keeps energy flows balanced and energy stores measured. An example is photosynthesis, the process in which plants convert sunlight into chemical energy stored as carbohydrates. The efficiency of photosynthesis as a sugar machine is not very high. The fraction of light energy converted by plants during photosynthesis into chemical energy is in the range of 0.3–4.5%. 81
Viewed from the perspective of its EROI, this inefficient sugar machine might be dismissed as inefficient. But before throwing it out, it might be wiser to change the filter through which it is being viewed. Evolved through hundreds of millions of years, plant systems interact with their environment in a multitude of ways, including the provision of habitats and food for a huge number of other life-forms and the regulation of atmospheric, water, and soil processes. When plants die, their matter decays and is recycled into a balanced and circular ‘economy’ of matter and energy. A biological model for energy in society would need to take into consideration the whole balance of the amounts of economic stimulation (e.g., employment, debt) biological impacts (e.g., health advantages, pollution) and social effects (e.g., effect on inequality, poverty, stability) that is part and parcel of the energy source. The EROI model has no way of accounting for the economic, environmental, and social consequences of the relentless pursuit of fossil fuels. Nevertheless, its proponents allege conventional fossil fuels are the most appropriate for society. Reference Pickard45,Reference Hall and Klitgaard72,Reference Hall74 Despite the claims for a biological relevance of the EROI, the logic behind it is not consistent with biological models for energy use.
Even if the EROI metric is not a biological model, it may still have the potential to indicate whether the net energy availability is a societal indicator. After all, prosperity is linked to the production of energy. Reference Hall, Lambert and Balogh70,Reference Murphy71 To calculate a societal EROI, (EROIsoc), Lambert and Hall divide the GDP (US$) by the price of energy units (US$/unit) to translate the GDP into energy units. Then, the amount of energy consumed by a country is divided by the energy content (MJ/energy unit). By dividing the nation's GDP (now in energy units) by the nation's consumption (also now in energy units), they produce a dimensionless ratio of economic activity per energy consumed. Reference Lambert, Hall, Balogh, Gupta and Arnold79 They show an overall (low resolution) trend of both EROIsoc and energy per capita that predictably correlates with various socio-economic development indicators, such as the gender inequality index and the HDI Footnote ‡‡ , for some countries. 82 A general correlation is no surprise because countries with higher GDPs are able to provide more health and educational services to their citizens than the nations with lower GDPs. This very superficial analysis, however, cannot provide more clarity on the threshold minimum EROI that is required by a modern society. Reference Lambert, Hall, Balogh, Gupta and Arnold79
The EROIsoc for Saudi Arabia (having the 14th largest GDP 83 ) is an interesting case, although not calculated by Lambert et al. Fuel prices are highly subsidized (by about 70%) in Saudi Arabia. Reference Long84 The low prices would deliver an inflated EROIsoc compared to countries that subsidize their fuels to a lesser extent. (The price of gasoline in Saudi Arabia is 10 times less than that in Germany!) 85 Unlike the predictions of Lambert et al., the inflated EROIsoc result does not correlate with a more equal society. Saudi Arabia's laws forbidding women to drive, vote, or have parental authority have contributed to Saudi Arabia's ranking in the 130th place out of 142 countries in the Gender Gap ranking of the World Economic Forum. 86 It's hard to see why the price of gasoline would be an indicative factor in deeply held, culturally perpetuated gender roles. Moreover, the price of oil is so volatile and subject not only to a range of economic but also political forces, that it is hard to imagine it in constant relationship with a host of societal factors. 87
Perhaps the real application of an EROI metric is to indicate whether an investment is a good bet. An EROI could be a first calculation before working up a more detailed business plan. If the result is less than one, a return on your investment is excluded. What about if the EROI is much greater than one? Does the EROI signal any risks the investor needs to be aware of? Because burning fossil fuels is so damaging, fossil fuel investments have a high risk of becoming stranded assets. Although coal has the highest EROI rank, its heavy contribution to climate change has made it the first fossil fuel to be targeted as an unsafe investment. The fossil fuel divestment movement along with the current market conditions for new coal plants, are sinking coal investments. A metric that directly reflects investment into the extraction of fossil fuels is the capital expenditure (capex) for development of fossil reserves. 88 Fossil reserves that require high capex for recovery are at highest risk for becoming stranded assets. Because the EROI cannot capture investment risk information, it is not really a viable investment metric.
While the EROI calculations over time have picked up a general trend that fossil fuel resources are becoming harder to extract, the information they can convey is limited. As climate change has announced itself as a more pressing planetary limit than depletion of fossil fuel resources, insight into an energy source's viability in terms of its environmental, social, and economic externalities is required. Because the EROI does not deliver this information and because it does not reflect the feedback loops and balancing mechanisms characteristic of natural systems, it does not live up to what it claims. On the contrary, it is a concept that promotes high consumption, while ignoring the consequential effects of the consumption.
Figuring in the environmental and social impacts into the ‘true cost’ of electric energy
The ‘true cost of electricity’, includes the ‘external costs’ of the electricity use, especially the environmental and health consequences of its use. The environmental impact of 1 kWh from a PV system may be compared to 1 kWh of electricity from the grid. While the PV system emits nothing during operation, energy is used in its construction: embodied energy is intrinsic in the component materials, and energy is used in the manufacture, transport, installation, and recycling over the lifetime of the PV module. Using an LCA methodology, the Simapro software (v 7.3) and the ecoinvent database (v. 2.2), the environmental impact of 1 kWh of electricity from a 14.4% efficient mid-size commercial system (12.4 kWp) was compared to 1 kWh of electricity from the European grid (Union for the Co-ordination of Transmission of Electricity (UCTE)) in 2008 (i.e., 56% coal and gas, 28% nuclear, 10% hydro and 7% renewable energy sources), 1 kWh of 100% natural gas electricity, and 1 kWh of 100% hard coal electricity. Because a major contribution to the environmental impact of PV is the electricity used to manufacture it, the 1 kWh of PV electricity was calculated to reflect a module made with 100% coal grid electricity, the UCTE mix, or just hydro and gas generated grid electricity. Reference Olson89
Emissions to the air are quantified in terms of carbon dioxide equivalents (CO2 eq) which communicates the amount of CO2 that would have the same global warming potential as the emissions under study. The emissions associated with 1 kWh from multicrystalline silicon PV modules is 19, 38, or 39 g CO2 eq, depending whether it was manufactured with hydro and gas electricity, electricity generated with the UCTE mix, or electricity generated with 100% coal. In comparison, electricity derived from burning gas (620 g CO2 eq), coal (1020 g CO2 eq), and the UCTE mix (506 g CO2 eq) are 1–2 orders of magnitude higher. A comparison of air pollutant emissions from these electricity sources is shown, normalized to 100% coal electricity, in Fig. 11. It is interesting to note that the emissions from PV modules manufactured with 100% coal electricity are double those from PV modules manufactured with hydro power and natural gas electricity, but are still 96% less than the emissions of electricity generated by coal. Therefore, modules, even if they have been manufactured using ‘dirty’ electricity, are still much more environmentally benign than coal electricity.
Comparison of air pollutant emissions of electricity produced by PV, natural gas, and the UCTE mix, at power plant, relevant to climate change (kg CO2 eq), human toxicity (kg 1.4 dichlorobenzene), reactive organic pollutants (kg NMVOCs), and atmospheric particulate matter loading (kg of particulate matter smaller than ∼10 μm (PM10)), normalized to the impacts of hard coal electricity. Reference Olson89

Air pollutants also contribute to human toxicity, photochemical oxidant formation, particulate matter formation, and terrestrial acidification. The human toxicity of PV electricity is dwarfed by the impacts of electricity generated with coal, or the UCTE electricity mix. The electricity from natural gas was calculated based on the natural gas supply for the European consumer in the ecoinvent database, and did not include shale gas sources. Reference Schori and Frischknecht90 The mercury emissions from coal that may be inhaled or ingested by humans causes neurological damage and are responsible for the high human toxicity impact. The reason for the high toxicity of the UCTE mix is its high content (∼30%) of nuclear generation. Nonmethane volatile organic compounds (NMVOCs) are organic compounds (e.g., benzene), often resulting from fuel combustion, that typically have compounding long-term health effects. Many are carcinogens. Particulate matter is suspended in air as an aerosol, and is associated with lung cancer and respiratory disease. Reference Hamra, Guha, Cohen, Laden, Raaschou-Nielsen, Samet, Vineis, Forastiere, Saldiva, Yorifuji and Loomis91 Emissions of sulfur oxides lead to acid rain, which affects the biology of soil and vegetation and accelerates degradation of buildings and structures.
The results for the formation of photochemical oxidants and particulates and for terrestrial acidification all follow the same pattern: the PV module made using hydro and natural gas electricity produces electricity with only ∼2–3% of the impact per kWh of coal. The PV modules made with UCTE electricity (∼50% fossil fuel) and with 100% coal electricity have twice the impact of the cleaner PV module (∼6–7.5% of coal electricity). Electricity generated with natural gas provides 60% of the GHG emissions of coal, 36% of the volatile organic compounds (VOCs), 15% of the particulates, and 14% of the acidification. UCTE electricity presents the same level of human toxicity as coal electricity, but only 50% of the GHG emissions, 42% of the VOCs, 50% of the particulates and 47% of the acidification.
An increasingly critical issue, water depletion can be characterized by the amount of the water withdrawn for use, which describes the amount removed from a water source. The act of removal may damage ecosystems, even if the water is returned or discharged after use. Water consumption is water that is not returned. In power systems, consumed water is often water that has evaporated or otherwise escaped from the controlled flow. Discharged water, after having been used in a cooling cycle, for example, is returned to the water source, but may present water quality issues. The range of the water withdrawn per megawatt-hour (MWh) generated by an electric power plant can range from almost zero for a solar PV, wind, or dry-cooled natural gas plant, to hundreds of gallons for an efficient plant using recirculating cooling, to tens of thousands of gallons for a nuclear or coal plant using once-through cooling. Reference Averyt, Fisher, Huber-Lee, Lewis, Macknick, Madden, Rogers and Tellinghuisen92 Water consumption per MWh generated can similarly range from almost zero for solar, wind, or gas plants using dry cooling, to ∼1000 gallons for coal, oil, or concentrating solar power with recirculating cooling. A separate study similarly placed the water consumption by coal, gas, and oil plants in the range from 100 to 2000 gallons/MWh. Reference Mekonnen, Gerbens-Leenes and Arjen93
In the US, for example, electricity generation accounted for more than 40% of total freshwater withdrawals in 2005, and is one of the largest consumers, losing freshwater through evaporation in the cooling process. Reference Rogers, Averyt, Clemmer, Davis, Flores-Lopez, Frumhoff, Kenney, Macknick, Madden, Meldrum, Overpeck, Sattler, Spanger-Siegfried and Yates94 Electricity generation is increasingly competing for water use in many areas in the world that have become warmer and drier due to climate change. Reference Rogers, Averyt, Clemmer, Davis, Flores-Lopez, Frumhoff, Kenney, Macknick, Madden, Meldrum, Overpeck, Sattler, Spanger-Siegfried and Yates94,Reference van Vliet95 During especially warm summers over the past decade in both the US and Europe, electric plants (fossil fuel and nuclear), that use heat as an intermediate energy carrier and therefore require cooling, were forced to reduce production because of a lack of cooling water, revealing their vulnerability for limited production in warmer conditions. By 2030, under an average economic growth scenario and if no efficiency gains are assumed, global water requirements would grow to a full 40% above the current accessible, reliable supply. 96
Even in rainy Britain, there were areas in 2012 that were suffering from drought. A recent study examines the water requirements of electricity generation in the UK, according to various generation mix scenarios. The authors find that scenarios that depend on ‘clean coal’ strategies, which employ carbon dioxide capture and storage (CCS) technology to limit CO2 emissions from thermal fossil fuel generating plants, increase water requirements by an additional 70% over those that do not. Furthermore, scenarios relying on nuclear generation may require up to 4 times more water than currently used. These additional demands will further stress scarce water resources leading to issues associated with security of supply. Reference Byers, Hall and Amezaga97 Consistent among the spate of studies is the recommendation to address the growing water scarcity issues by installing more wind and PVs, i.e., nonthermal renewable energy. Reference Mekonnen, Gerbens-Leenes and Arjen93,Reference Byers, Hall and Amezaga97,Reference Sovacool and Faeth98
The transformation of natural land, as well as the occupation of urban and agricultural land, is large for hard coal because of the mining and infrastructure. Electricity from natural gas requires about three times (282%) as much transformation of natural land as coal or UCTE electricity (110%) as a result of the requirements for gas pipelines Footnote §§ . PV requires only 15% of the natural land transformation as compared to coal Footnote §§ , 14% as compared to the UCTE electricity mix, and only 5% of the land transformation as compared to natural gas. Reference Olson89
Compared with coal electricity (per kWh), PV uses 86–89% less water, occupies or transforms over 80% less land, and presents ∼95% lower toxicity to humans; it also contributes 92–97% less to terrestrial acidification, 97–98% less to marine eutrophication, and 96–98% less to climate change. Reference Olson89
In 2011, it was estimated that the life cycle effects of coal are costing the U.S. public between a third to over one-half of a trillion dollars annually, or between 18 and 27¢/kWh (2008US$). Reference Epstein, Buonocore, Eckerle, Hendryx, Stout, Heinberg, Clapp, May, Reinhart, Ahern, Doshi and Glustrom99 Because electricity in the manufacturing of PV is a major factor in its environmental impact, the assumption of 100% coal electricity in the manufacturing can be considered a ‘worst case’. Applying the same methodology as was used in the costing of coal impacts, leads to an upper limit cost of ∼1–1.5 ¢/kWh (2008$) for PV. Using cleaner energy in the manufacturing of the PV modules translates into a negligible additional cost for the life-cycle environmental and health impact of PV.
Renewables mitigate GHGs. In 2012, the 22% of the world's electricity produced with renewable energy (Fig. 1) avoided 3.1 Gt of CO2 eq, or about 10% of global anthropogenic emissions. 100 The average emissions intensity in 2012 was 575 g CO2 eq/kWh, roughly the same as twenty years ago when it was 586 g CO2 eq/kWh in 1990. To limit the global temperature rise, renewables must supply ∼44% of the world's electric power, which would bring the average emissions intensity down to ∼362 g CO2 eq/kWh. 100 Figure 12 shows the avoided CO2 emissions in Germany in 2014 in the fuels, heat and electricity sectors. 101 The total of the avoided emissions in 2014 amounts to 148 million tons, or 16% of the total German emissions (902 Mt) in 2014 (up from 77 Mt, or ∼8.5% of the total in 2009). 102 The bar diagram also shows the contribution of individual technologies to this emission reduction. PV contributed about 16% (∼24 Mt) of the avoided emissions.
CO2 emissions avoided by using renewable energy in Germany, 2014. 101

Unlike renewables, using ‘clean coal’ or nuclear solutions are not real solutions for mitigating GHG emissions. There has been publicity that CCS can clean emissions at the power plant smokestack by capturing CO2 emissions. [CCS is also referred to as carbon capture and storage or sequestration. A point of confusion often arises in calculating amounts of carbon and carbon dioxide: 1 ton of carbon (atomic weight of 12) is in 3.67 tons of CO2 (atomic weight 44). So 27 $/ton of carbon is 7.2 $/ton of carbon dioxide]. The central idea is to capture emitted carbon dioxide in the smokestack, transport it, usually through pipelines, to subsurface geological formations, with all the hazards of leakage. 32 Less publicized is its requirement for more fuel than otherwise, which means an intensification of all the impacts of the coal supply chain. Indeed, a fossil fuel plant requires roughly 10–40% more fuel with the CCS equipment than without it to generate an equivalent amount of electric power. 103 Despite high funding for R&D projects, it has not succeeded in demonstrating the efficacy or the economics that would make it actually feasible for implementation in power plants. The World Energy Council is a club which includes ministers, chief executives, and leading experts. Its 2015 annual publication, based on responses to a survey of 1045 energy leaders from 79 countries, reports that CCS is no longer considered a viable option. 104
The events that occurred in Fukushima, Japan are evidence that there is no such thing as nontoxic nuclear. The prospects for the nuclear industry have been severely affected by the meltdown of 3 reactor cores in Fukushima, Japan. On March 11, 2011, a long and strong earthquake followed by a series of once-in-1000-year-grade tsunami waves devastated the east coast of Tohoku, the northeastern region of Honshu, Japan's main island. The earthquake and tsunami affected 14 reactors in 4 nuclear power stations on the Pacific coast, including Fukushima Daiichi, with 6 Boiling Water Reactors (BWRs), operated by Tokyo Electric Power Co. (TEPCO). Units 1–4 of the six Fukushima Daiichi units were devastated, resulting in massive release of radioactivity into the environment, and a triple meltdown. Reference Schneider and Froggatt7 The situation, five years on, is still not stable. So far, attempts to view inside the reactor's interior with remote-controlled robots have not yet been successful due to the high radiation. Damaged reactor cores still require cooling, but the cooling systems are not functional. Water is sent in to the damaged reactors, and leaks out through unidentified ruptures in the containment structures to accumulate in the reactor buildings' basements. The accumulating water is being collected in thousands of tanks, which are leaking and causing fears of a possible hydrogen explosion. Reference Demetriou105 Groundwater is also intermingling with the cooling water, and carrying the radiation contamination to the Pacific ocean. Reference Schneider and Froggatt7 Radioactive emissions into the atmosphere from the four reactors continue. Reference Schneider and Froggatt7
TEPCO disclosed a document that provides evidence that the utility knew, two years before the incident, that the power plant was not well defended from a tsunami. The evidence invalidates the earlier insistence that TEPCO had taken all possible safety precautions. The utility disclosed the document during a lawsuit brought by more than 40 TEPCO shareholders who are demanding damages totalling 5.5 trillion yen from company executives. Reference McCurry106 The disaster forced the evacuation of ∼150,000 people, most of whom are yet to return to their homes.
How to dispose of nuclear waste is still an unsolved problem. Even without accidents, nuclear waste accumulated to date is still a dangerous and costly issue. Nuclear waste stored at the UK's Sellafield nuclear reprocessing site since the dawn of the nuclear age is the focus of an £80-billion-programme (costing the government £1.9 billion a year) to clean it up by 2030. The decaying ponds and silos which contain hundreds of tonnes of highly radioactive material, accumulated over 60 years, are cracking, leaking waste into the soil, and are at risk of explosions from gases created by corrosion. Reference Pearce107 Across Britain, there are about 4.5 million cubic meters of accumulated radioactive waste, kept at a cost of £3 billion a year, of which £2 billion comes from taxpayers. According to the Organization for Economic Cooperation and Development’s (OECD) Nuclear Energy Agency, it is impossible to estimate the cost of nuclear waste storage because there are to date no real solutions. Reference Eckert108,109,Reference Jowitt110 Indicative of the support nuclear waste receives from UK communities, a law was enacted in April 2015, authorizing the UK Secretary of Energy to appropriate storage sites from communities, without the consent of local authorities. Reference Jowitt110
Another example is the 111,000 cubic yards of radioactive debris left behind after 12 years of US nuclear tests in the Marshall islands. It was dumped in an unlined crater on Runit Island, and covered with 358 concrete panels, which are now cracked and deteriorating. According to a 2013 report by the US Department of Energy, the leaching of radioactive waste has caused the soil around the dome to become more contaminated than its contents. Now locals, scientists, and environmental activists fear that a storm surge, typhoon, or other extreme weather event could tear the deteriorating structure open, releasing its contents into the Pacific Ocean. Reference Jose, Wall and Hinzel111
When they describe nuclear as a low-carbon technology, nuclear energy proponents invite decision-makers to ignore the intractable problem of the chronically accumulating toxic waste, which is already a costly danger to society. Also swept into the shadows is the tragedy of nuclear accidents. Nuclear technology can only be seen as a solution with a tunnel-vision focus on CO2 emissions, and a willful neglect of the grave hazards, including generationally enduring waste and the risk of exorbitant social costs. It is also not well suited to functioning in a future with more extreme weather events.
Grid investments
The electricity grid was developed to carry electricity generated by centralized electricity generating plants long distances at high voltage over transmission lines, to step the voltage down at various intervals, and to finally distribute the low voltage electricity to commercial and residential customers. The flow of electricity was primarily in one direction from central generators through the high voltage transmission system to the low voltage distribution system, as shown schematically in the left side of Fig. 13. Arguments against the viability of PV raise the issue that intermittent renewables require massive investments in the grid. The truth is that investments are required both in the US and in Europe, for a variety of reasons, not least because of aging infrastructure. 112
Two schematics showing salient aspects about the current fossil powered grid with historic one-way electricity flow (left), and a more sustainable grid, optimized for two-way electricity flow between distributed load, storage and renewable generators, configured in microgrids for resiliency (right).

The current status of the US power grid has been deemed to be just above failing (a grade of D+) by the American Society of Civil Engineers. 113 They describe the US electric grid as an “aging and complex patchwork system” of thousands of power generating plants, hundreds of thousands of power lines, and interconnected transmission and distribution facilities, some of which date back to the 1880s. The aging equipment is vulnerable to increasing power disruptions as well as to cyber attacks. Furthermore, the continual patchwork addition of components onto the one-way historic grid configuration is gradually making these giant machines unstable. Power outages rose from 76 in 2007 to 307 in 2011, with weather-related events the main cause in this period. 113 The US Department of Energy estimates blackouts cost at least $150 billion per year. 114 The U.S. grid needs about $2 trillion in upgrades by 2030. Reference Weber and Chediak115
Large black-outs occur more frequently than would be expected by looking at the grid solely as an aggregation of components. A systems perspective, which considers the size and complexity of the grid, is useful to understand why large blackouts are inevitable and more frequent than expected. A complex system can be compared to a pile of sand. As more sand is dribbled on top, the mound will grow taller and more unstable. At some moment, the system will come to a critical point: adding just one more grain of sand will cause an avalanche which redistributes the pile. The power grid also operates near it's critical point: the addition of more components to keep up with demand keeps increasing the complexity, while the infrastructure is operated near full capacity to maximize profits.
A constellation of small, normally nondisruptive events, is then enough to cause failure cascading through the system. In 2003, a trigger for the blackout in over four US states, costing in the neighborhood of US$ 6 billion and causing 11 deaths, occurred when a power line touched an overgrown tree branch. A power outage over regions of Switzerland and all of Italy in 2003 were also caused by a flashover from a sagging transmission line to a tree. In Sweden, storm damage caused thousands of households to lose electricity in 2005, some remaining in the dark for more than a month.
Configurations of the grid may be identified to reduce the risk of the increasingly common incidents of cascading failure. Reference Newman116,Reference Carreras, Newman and Dobson117 An engineering analysis has discovered that mid-sized grids (∼500–700 nodes, or regional-sized) are more robust than either small or large grids: enough resources to suppress many small and medium-sized outages, but not so complex as to be vulnerable to the cascading failure-chains that cause massive blackouts. Reference Newman116 From an engineering perspective, these results favor the idea of creating modular subnetworks (even small grids) that can flexibly and controllably interconnect with neighbors.
Widespread blackouts from superstorms are providing evidence that wind and solar electricity generators are more resilient than conventional fossil-fueled plants, especially when configured in a microgrid. When Hurricane Sandy hit New York and New Jersey in October 2012, the large majority of rooftop PV systems were undamaged. If connected to the grid, the PV panels stop working when the grid blacks out. If configured in a microgrid, they could continue to deliver power. Reference Levitan118
Microgrids are distributed generation systems that can range from small, serving an institution or campus, to mid-sized, serving a community or region. Very often, they are configured with on-site renewable energy sources such as wind turbines and solar panels, as well as electrical energy storage systems, but are necessarily engineered to take advantage of the resources available at a particular site. They are characterized by a high degree of reliability and resilience, and can equally operate when connected to or disconnected from the larger utility grid. 119 Navigant Research predicts that the microgrid market will reach $20 billion by 2020 (Fig. 14). 120 Opportunities are seen for civil society to engage in microgrid ownership, activating entrepreneurs and advancing innovation. States such as California, Massachusetts, and New York are currently promoting microgrid development on the community level, and offering substantial incentives to boost the industry. Reference Wood121,Reference Munson122 New York, for example, launched in 2015 its plan, Reforming the Energy Vision (REV), to completely restructure the state's electric utility market, including the aim to review the rules for ownership of new distributed energy resources. Reference Gahl123
Total microgrid capacity forecast: North America leads global growth. 120 Source: Navigant Research.

One prevalent criticism of PV electricity is that its intermittency requires too much back-up capacity, and will only be viable when low-cost energy storage is available. Intermittency occurs on timescales from seconds to seasons, but can be handled in a variety of ways. Aggregating the power output from as few as 20 locations can significantly smooth out the variation in the output. Reference Fares124 In addition, in areas such as Northern Europe, the complementarity of solar with wind can be built upon to reduce some of the seasonal variation, as shown in Fig. 15. Reference Wirth30 The grid operator needs to balance the total amount of renewable generation with the rest of the grid. This means that the smoothing of power output from geographically dispersed locations and the complementarity with wind generation (Fig. 15) can cause the amount of reserve capacity needed to be a lot less than one would expect. A study conducted by General Electric for the Electric Reliability Council of Texas (ERCOT) calculated that an additional 15,000 MW of installed wind energy only requires an additional 18 MW of flexible reserve capacity to maintain the stability of the grid. Reference Fares124,125 Unlike the myth that used to say that for every MW of installed renewable capacity, another MW (100%) needs to be available as reserve, in this example only 0.1% has to be held in reserve.
German monthly production of PV-generated (yellow) and wind-generated electrical power (green) for the year 2012. Reference Wirth30

Integrating of solar PV requires changes on both the PV system side as well as on the system operation side. There are several low cost measures that facilitate the integration of PV into the grid including: the provision of reactive power and ancillary services (grid support from a PV inverter), on the one hand, and regional sharing of reserves, improved weather forecasting, and improved grid monitoring and control on the other. 126 A PV inverter is now designed to actively respond to fluctuations in the grid so as to balance the grid voltage and stabilize the system, in ways that would otherwise incur additional costs. Regional sharing of reserves, such as importing or exporting electricity to compensate for fluctuations in renewable production, is a key strategy used by Denmark in managing its 42% wind electricity share in 2015. Reference Neslen127 On July 9, 2015, for example, its wind turbines produced as much as 140% of its national electricity needs, which allowed for exports to its neighbors, Germany, Norway, and Sweden. Reference Neslen128
Instances of high penetrations of renewables are increasingly occurring in Europe. Redes Energéticas Nacionais, Portugal's grid operator, reported that 70% of the country's electricity was generated by renewable energy sources in the first quarter of 2013. Germany operates with 27.4% renewable electricity generation, with excursions to higher renewable contributions. 129 For example, on May 11, 2014, the share of renewable energy generation provided 74% of demand. Reference Kroh130
In the US, the ERCOT and Xcel Energy Colorado (a.k.a. Public Service Company of Colorado, or PSCo), have managed to successfully integrate increasing amounts of variable renewable energy resources (10% to >50%) at costs that have generally been small to modest. ERCOT has integrated 10 GW of renewable energy at a cost of about $0.50 per MWh of wind generation, a cost significantly lower than the frequently estimated $2–$5/MWh. Reference Weiss and Tsuchida131 The cost of integrating renewables depends on the abilities of the system operator to operate flexibly, with short-interval dispatch, and to share reserve generation across a broader region.
Model based calculations suggest that widespread storage capacity will not be needed in Germany until intermittent renewable energy reaches 60% of gross electricity consumption. 132,Reference Leggett133 (Renewable energy in Germany is targeted to contribute 50% in 2030.) 134 The study that made this conclusion cited other more affordable options to increase flexibility including the observation that industrial consumers are able to shift demand on the order of GWs for short periods, as demonstrated in German pilot projects. Incorporating more flexibility in combined heat and power plants with the addition of water towers is also an inexpensive solution. The study also points to the current addition of 2650 kilometers of new high-voltage grid which will enhance the sharing of regional reserves. These solutions as well as the low cost measures mentioned above (ancillary service provision by renewable systems, and improved forecasting and grid monitoring and control) can postpone the requirement for extensive storage solutions, depending on the configuration of the particular grid under consideration. This is not to say that storage will not be needed, but it should not be viewed as an obstacle to the energy transition. The recent decline in battery prices, along with the significant market segment of residential customers who desire independence, suggests that affordable energy storage for residential systems may become an option sooner than expected. 135,Reference Deutsch and Graichen136 Most importantly, the current cost of energy storage does not appear to limit the level of renewable energy generation that is needed to reach the 40% reduction of GHG emissions by 2030. 32
The costs of integrating ∼70% of renewable energy into the electricity supply without storage have been analyzed. A recent report by engineering firm, DNV-GL, contracted by the EC, analyses the costs for Europe to integrate renewables into the electricity sector in the timeframe to 2030, as proposed in the EC Energy Roadmap 2050. Because computer models which are necessarily based on incremental change to existing systems are notoriously poor at predicting technological or social step changes, the absolute number that results from the calculation should be viewed with caution. Reference Mai, Logan, Blair, Sullivan and Bazilian137 Embedded in this modeling of generation and transmission requirements are the assumptions of SOs' (ENTSO-E) 10-year development plan which incorporates a vision of an single European electricity market and the associated infrastructure. The market model is deterministic, assuming perfect competition and information. While the absolute cost number depends on the many layered assumptions, the absence of a difference between the scenarios with lower and higher penetrations of renewables is noteworthy. The key finding is that the total system cost in 2030 of a high share of renewables in the power sector (∼70%) is similar to that of the reference scenario (∼50%), i.e., in the range of 200–250 billion euros. Exchanging the operational costs (fuel costs) of conventional plants for the capital costs of renewables, in combination with a continued decrease in investment costs for renewables, appears to be an even trade-off. Infrastructure will need to be built but geographically siting distributed renewable generation in proximity to load can reduce the need for grid expansion. Another observation is that the market price will remain (to 2030) too low to remunerate investments in renewable technologies and subsidies will be required to support the scale of renewable energy penetration assumed in the study. 126
DNV-GL conducted a survey of 1600 people in the energy industry across 71 countries. About half of the respondents believe that the electricity system could transition to 70% renewable generation with the next 15 years. 80% believe it will be achieved before 2050. The overall perception was expressed that achieving 70% renewables is not mainly a technical or an economic question, but rather a political one, meaning that government support is crucial. 138 Changing to a primarily renewable electricity system is changing the fundamentals of the business. Among the required changes are fundamental changes in the electricity market, power sector regulations as well as the need to shift to a systems approach in maximizing synergies between renewable technologies. Political leadership can also help all industry players to pull together to achieve an orderly transition of the electricity system. The survey noted that the polarization of views between those developing new systems and those who operate the system is alarming and must be addressed. 138
In the tension between the growing share of PV installations and the utilities' obsolescing business models, the issue of paying for distribution services has come to the foreground. Some US utilities, such as Tucson Electric Power in Arizona, have filed an application with the state regulators seeking to impose charges on their customers who have PV systems: an increased interconnection fee, a lowered (almost halved) net-metering credit, as well as a fixed demand charge. (A demand charge is a charge based on the highest demand of a customer in any measurement interval.) Reference Colthorpe139 PV proponents characterize these charges as discriminatory and point out that when Arizona's Salt River Project instituted a mandatory demand charge for rooftop solar customers last year, applications for new rooftop solar installations fell by more than 95%, as in a turf war. Reference Hiatt140
The question as to whether residential PV system owners should pay for use of the grid either through a reduced net metering credit or other means has prompted cost-benefit studies on the value of solar PV to the grid, as reviewed in Ref. Reference Hallock and Sargent141. PV benefits the electricity grid through avoided energy costs, reduced financial risks, increased grid resiliency, avoided CO2 emissions and increased jobs. Solar PV avoids energy costs for utilities by reducing the amount of electricity they must generate, including the amount to cover losses in generation, long-distance transmission and distribution. Solar PV reduces the demand for conventional electricity and so avoids capital and capacity investment into new power plants and transmission and distribution infrastructure. As solar PV is not affected by the volatility of fuel prices and has fewer installation risks, it has reduced financial risks. Decentralized generation generally increases grid resiliency. As shown in the last section, the environmental impact of solar PV is negligible compared to conventional electricity generation, and therefore virtually all the costs for environmental compliance, and related damages to health and society are avoided. Finally, solar PV provides the economic stimulus from generating jobs at a rate 20 times that of the overall US economy (in 2014). In 11 separate studies, 3 commissioned by utilities, 2 by public utilities commissions, and 6 by nonutility organizations, only 2 studies (commissioned by utilities) estimated the benefits of solar less than the retail electricity rate. The mean value that was assigned to rooftop solar from all 11 studies was 16.90 US¢/kW h, compared with an average US residential retail electricity rate of 11.88 US¢/kW h in 2012. Reference Hallock and Sargent141 A framework for accounting the costs and benefits of distributed energy resources, from the perspective of all grid customers and to society as a whole, developed for New York's REV program, cites a similarly long list of benefits. Reference Woolf, Whited, Malone, Vitolo and Hornby142
While municipal or regional organization of distributed renewables are steadily moving forward, 143 continental-scaled projects such as the European framework to develop ‘smart grids’ as a vehicle to encourage high penetration of distributed renewable energy resources, are progressing much more slowly. According to the EC, a smart grid is an upgraded electricity network capable of two-way digital communication between supplier and consumer, intelligent metering and monitoring. Reference Zgajewski144 Technical standards are necessary to implement smart grids over the many regions of Europe. But due to the lack of a single concept of what a smart grid is, coupled with the tension field between competing commercial interests of market players, an agreement on the technical standards for smart grid functionalities has, since 2011, not yet been forthcoming. About a dozen Member States have agreed to roll-out smart meters. But only about half of them actually deliver the ten functionalities to benefit customers recommended in the EU's 3rd Energy Package legislation. In cases where these meters are used only to the benefit of utilities (e.g., to reduce nontechnical losses, or for remote reading of customer usage), it will be difficult to convince customers of the added value of these meters. Especially so, considering the customers are bearing the cost, not only of the installation of the meters, but also for the costs of privacy, security, data handling, and other nonmonetary issues. Reference Zgajewski144 A pan-continental energy data platform may eventually be worthwhile, but the emerging issues and delays indicate that it should not be a prerequisite for the transition to renewable energy generation.
Economic and social consequences and opportunities
The issue of whether economic growth is slowed by reducing global GHG emissions to the level necessary to curb global warming (i.e., by 40% by 2030) has been tackled in a report by the United Nations Industrial Development Organization and the Global Green Growth Institute. The ‘Global Green Growth’ report analyzes realistic scenarios for 5 different countries (Brazil, Germany, South Africa, Indonesia, and Republic of Korea). 32 It shows that the global economy can be healthy while meeting the emission targets if most countries invest annually about 1.5% of their economy's GDP in energy efficiency and clean renewable energy. The study argues that since investments totaled about 0.5% of global GDP in 2011, that 1.5% appears plausible. 32 Indeed, 1.5% of global GDP is roughly a quarter of the total ‘post-tax’ fossil fuel subsidies estimated by the IMF (see section “Electricity prices, the energy market and subsidies” above). In addition, the report discusses the policy measures in each of these countries that could steer this kind of concerted policy action.
The clean renewable energy sources considered in the Global Green Growth report include solar, wind, geothermal, and small-scale hydropower, as well as low-emission bioenergy sources. They conclude that reaching the emission targets is not possible while maintaining a dependence on fossil fuels, especially since neither CCS nor nuclear technology offers viable long-term solutions. 32 They show that new investments in energy efficiency and clean renewables will generate more new jobs than would be had by maintaining or expanding the fossil fuel sector, even accounting for the fossil fuel jobs lost as that sector contracts. The net number of new jobs for these 5 countries are calculated to be between 0.7% and 1.9% of the projected labor force in 2030. 32 The jobs in the clean energy areas require general education levels (as opposed to highly specialized), opening up the employment possibilities to a greater fraction of job seekers. 32
In Germany, the country with the most installed PVs capacity, jobs in the PVs sector, from 2013 data, are spread rather evenly as percentage of population across Germany's provinces (Fig. 16). 145 The total renewable energy jobs in Germany was 371,000 in 2013, of which the PV sector provides 68,500. 145 As PVs converts sunshine into electricity, it valorizes a local resource that would otherwise not have direct economic value. The conversion of sunshine to electricity translates into salaries, taxes, and profits.
Renewable energy employment in German provinces, broken down by technology, 2013. 145

The Institute for Ecological Economy Research has developed a detailed model, available as a public on-line tool, for the calculation of regional value creation in Germany by renewable energies. 146 The results for the economic value created in 2012 by renewable energies are reproduced in Fig. 17. Reference Arentz, Heinback, Hirschl and Shroeder147 In 2012, renewable energy in Germany generated a total of €17 billion, of which €11 billion were returned to the communal level, while €6 billion was earned at the federal level.
Breakdown of value creation by renewable energy installations, 2012. Reference Zgajewski144 Inset: schematic of regional value creation.

Local energy sources support energy independence and security. Connie Hedegaard, the EU Commissioner for Climate Action, wrote in June, 2014, when the price of oil was about US$100 per barrel, about Europe's vulnerability from importing more two-thirds of all the gas and almost all the oil it consumes, at a cost of more than 1 billion euros per day. Renewables and energy efficiency not only preserve the climate but also strengthen Europe's energy security, at a time when developments in Ukraine, Syria, and Iraq underline how geopolitics can destabilize energy prices. By locally producing renewable energy, Europe was saving 30 billion euros a year in 2014, investing this money in Europe rather than in the oil & gas exporting nations. Reference Hedegaard148
The enormous societal savings of avoided fossil fuel costs due to the installment of renewable generators tends not to appear on the same public balance sheet as the cost of renewable support schemes. When they do appear together, it is clear that the benefit of avoided fossil fuel costs largely compensates investments in renewable energy. Figure 18 shows that the costs for the renewable energy support in Germany in 2011 was in fact compensated by avoided fossil fuel imports, the lowering of wholesale electricity price (i.e., the ‘merit order effect’ which benefits wholesale electricity customers), and tax revenues. Even without considering the credit from the merit order effect, the credits from avoided environmental damages, the economic stimulation to installers and renewable energy companies, and employment far outweigh the subsidy investment costs for renewable energy. 149
Economic analysis of the costs and benefits of the Renewable Energy Law in 2011, carried out by the German Federal Ministry for the Environment, Nature Conservation and Nuclear Safety. In 2011 14,200 more jobs were created, bringing the total number of renewable energy jobs to 381,600. 149

Renewables stimulate the shift from a ‘passive energy society’ to one in which citizens may engage in a variety of ways to determine the generation of the electricity they use. Reference Scheer34 Owning and/or participating in a local energy supply means greater energy security and price stability, as well as economic value creation in their local vicinity. In Europe, especially Germany, the regional, local and municipal levels of society are stimulating renewable energy installations to improve the social and environmental impacts of their local electricity supply. These organizations validate themselves as civic institutions by being able to reflect the democratic choice of their constituents.
Unlike in the conventional energy sector, renewable energy installations in Germany are owned (and operated) to a large extent, almost 50%, by civil society actors (citizens, farmers, civic energy cooperatives) (Fig. 19). 150 Civic energy cooperatives in Germany grew exponentially from ∼100 in 2007 to ∼900 in 2013. 151 Because they are now owners, the civil society actors develop a much more aware, involved and committed role in the energy supply structures than ever before, which also encourages innovation in the energy sector.
Breakdown of ownership of selected renewable energy installations in 2014. 150

The Rhein-Hunsrueck Kreis is a small region (“Kreis”) occupying a rural area of about 100 km2, with a population of about 100.000 living in small communities of typically 500–3000 inhabitants. 152 It has a total annual electricity consumption of about 0.5 TWh (2009). As member of the 100% renewable regions network, it has won several awards for its advanced implementation strategies. The current electrical power generating capacity from renewables were realized by a total investment sum of about €770 million, out of which €63 million in the Rhein-Hunsrueck Kreis itself. Annual revenues from these investments are on the order of €33 million (most importantly through feed-in tariff payments and land leasing revenues). Reference Fleck153 In 2014, about 175% of the annual electricity consumption was generated by renewable energy capacities, mainly by wind (502 MW), but also including some PV (73 MW) and biomass (4.4 MW). Reference Fleck154 The surpluses can be sold to large consumption centers in the vicinity of the region. In fact, this type of large over-production of electricity in rural areas can be expected to be exemplary to facilitate trade between rural and urban areas (a topic extensively covered during the recent 100% Renewable Energy Regions events in Kassel). 155
The architectural incorporation of PV, like no other electricity generating technology, into the built environment is growing more accomplished and aesthetic due to the fact that it operates without moving parts, noise, or emissions (Fig. 20). PV architecture actually increases the touristic value of regions. Indeed, in Germany, tourist guides for exploring renewable energy were so popular they have been republished in subsequent editions after the first sold out. Reference Nabiyeva156 The seamless incorporation of PV into the built environment is important from the point of view of being compatible with almost any other economic activity, enabling strong linkages to the rest of the economy, in contrast to fossil fuel extraction especially, but also fossil fuel refining and electricity generation to a significant degree.
Integration of PVs into various contexts in the built environment. 171

Opinion polls in the US and Europe show that the majority of people prioritize addressing climate change, and view renewables as beneficial both environmentally and economically. By one count as of March 2015, a total of 55 million people (including 8 countries, 60 regions or states, and 55 cities) have shifted or have committed to shifting within the next few decades to 100% renewable energy in at least one sector (e.g., electricity, transportation, heating/cooling). 157 Momentum for investing in clean renewables also comes from the fossil fuel divestment movement. The number of large investment funds to divest from coal is increasing. In September 2014, the Rockefeller Brothers Fund, the heirs of the oil magnate John Rockefeller, announced that they would divest from coal and tar sands by the end of 2014, and to plan to divest from other fossil fuel holdings over the next few years. 158 AXA, the largest insurance company in France, has announced they will sell 500 million euros ($559 million) of coal assets and triple green investments to 3 billion euros by 2020. Reference Patel159 The largest sovereign fund in the world, the $900 billion Norwegian Pension Fund, recently decided to unload stakes in firms that earn more than 30% of revenues from coal or produce more than 30% of their electricity from coal. As Norway's wealth fund controls 1.3% of the entire world's traded stocks, new policy is expected to cost the coal industry billions of dollars. Reference Carrington160 Hermann Scheer wrote that a technological revolution is not due to the development of a technology but rather to the consumers who grasp the new opportunities it offers. When a significant fraction of the society chooses to employ it, a social movement occurs, extending into all areas of society, changing norms and setting new cultural standards. Reference Scheer34
Conclusions
A kWh from an unsubsidized PV rooftop systems are now cheaper for 80% of EU households than a kWh of retail grid electricity. Yet the abrupt removal of policy support for PV in Europe, due to the inability of incumbent electrical power generators to recoup their costs, has radically slowed the growth of installations. As beating the retail electricity price does not guarantee the penetration of renewable installations, the energy transition is not certain to be achieved in time to curb global warming by ad hoc integration of renewable systems into the current electricity market and infrastructure. Instead, a concerted effort is needed and fundamental changes are required. Technology development needs to shift from competing to provide the lowest LCOE of a single technology, to maximizing the synergies between renewable technologies. A systems oriented approach is needed at all levels, even when judging whether an energy metric, such as the EROI, delivers what it claims. Subsidies, which develop infrastructure, complicate the cost comparison. Oil & gas received 10 times the annual amount than all renewables received, and they received it for 6 times longer and are still receiving it. This puts renewables at a significant competitive disadvantage, even if they can offer a competitive price. The technologies and economics are not at issue, rather the question is whether policy makers will be able to steer energy subsidies to match the future they profess to choose: the one built on a sounder environmental basis with renewables. Arguments that subsidies are not needed are not consistent with surveys of industry representatives, or models that assess the costs of renewables. Political leadership can also help all industry players to pull together to achieve an orderly transition of the electricity system. During the present time when governments have to tighten their budgets, policymakers should realize that support for renewables not only addresses climate change, but also serves to stimulate their regional economies. Reference Tagwerker161–172
Acknowledgments
The authors gratefully acknowledge the valuable comments of the anonymous reviewers and the editors.



