


Coeliac disease (CeD) is a common(Reference Singh, Arora and Strand1) immune-mediated disease(Reference Stamnaes and Sollid2) where intolerance to gluten can lead to severe health problems with a wide range of gastrointestinal (GI) and extra-intestinal symptoms(Reference Parzanese, Qehajaj and Patrinicola3). Although the majority of people with CeD recover when adhering to a gluten-free diet (GFD)(Reference Parzanese, Qehajaj and Patrinicola3), it is estimated that 29 % experience ongoing GI symptoms(Reference Sainsbury, Sanders and Ford4). Persistent GI symptoms in CeD, which overlaps with the typical features of irritable bowel syndrome (IBS)(Reference Chey, Kurlander and Eswaran5), have been associated with reduced quality of life(Reference van Megen, Skodje and Stendahl6,Reference Parker, Palsson and Sanders7) . A diet low in fermentable oligo-, di-, monosaccharides and polyols (FODMAP), developed by researchers at Monash University in Australia(Reference Gibson and Shepherd8,Reference Gibson and Shepherd9) , has shown to be successful in reducing GI symptoms in IBS(Reference Staudacher and Whelan10) and GFD-treated CeD(Reference van Megen, Skodje and Lergenmuller11–Reference Trott, Rej and Coleman13).
FODMAP naturally occur in many foods(Reference Varney, Barrett and Scarlata14) and include fructose (in excess of glucose), lactose, oligosaccharides (fructan, galacto-oligosaccharides (GOS)) and polyols (i.e. mannitol and sorbitol). When reaching the small intestine, FODMAP may increase the osmotic pressure attracting water into the gut lumen. Also, the microbes harbouring our intestine (i.e. the gut microbiota(Reference Rinninella, Raoul and Cintoni15)) produce gases such as CH4, H2 and CO2 when fermenting food components that reach the colon (e.g. undigested FODMAP), possibly resulting in luminal distention of the intestine. Thus, FODMAP-rich foods may trigger GI problems such as bloating and abdominal pain in susceptible individuals, although the direct mechanisms remain unclear(Reference Staudacher and Whelan10).
While we have previously shown that a low FODMAP diet (LFD) successfully provided symptom relief in GFD-treated CeD patients(Reference van Megen, Skodje and Lergenmuller11), there have been concerns that a diet that limits the nutrient source for the gut bacteria could adversely affect colonic health(Reference Vandeputte and Joossens16) by inducing changes in the composition of the gut bacteria and the metabolites they produce. Importantly, short-chain fatty acids (SCFA) produced by colonic bacteria supports mucosal homoeostasis locally (e.g. epithelial function, intestinal barrier function and immunoregulation) and can also affect other parts of the body when taken up into the circulation(Reference Blaak, Canfora and Theis17). The most abundant SCFA produced in the colon are acetic, butyric and propionic acid. An LFD has in some studies(Reference Valeur, Roseth and Knudsen18–Reference Cox, Lindsay and Fromentin20) reduced the concentrations of faecal SCFA in patients with IBS and inflammatory bowel disease (IBD) but did not have this effect in other studies(Reference Staudacher, Lomer and Anderson21–Reference Halmos, Christophersen and Bird23). Interestingly, although the evidence is limited, dietary FODMAP restriction may also reduce immune activation(Reference Hustoft, Hausken and Ystad19,Reference McIntosh, Reed and Schneider24) and visceral sensitivity by lowering the concentration of faecal lipopolysaccharides(Reference Zhou, Gillilland and Wu25).
To our knowledge, effects of an LFD on gut microbiota and related markers of intestinal health have not been reported in GFD-treated CeD patients. The main aims of the present study were therefore to investigate whether an LFD in this patient group affects (i) the faecal microbiota, (ii) the concentrations of faecal SCFA and (iii) the concentrations of faecal human neutrophil gelatinase-associated lipocalin (NGAL, also known as lipocalin 2/LCN2), a biomarker of gut inflammation(Reference Thorsvik, Damas and Granlund26). In addition, we investigated whether LFD-induced changes in faecal microbiota and SCFA could explain changes in GI symptoms and the importance of baseline faecal characteristics for the symptom response to the LFD.
Materials and methods
Participants and study design
The present study is part of a clinical trial which followed a nonblinded, parallel randomised design, conducted from October 2018 to August 2019 at Oslo University Hospital, Rikshospitalet, Norway. The design and study population have been described previously(Reference van Megen, Skodje and Lergenmuller11). In short, participants with verified CeD having persistent GI symptoms despite adherence to a GFD were recruited using a web-based national survey. For inclusion, the participants had to be well-treated on a GFD for at least 12 months with serological and mucosal recovery prior to inclusion (anti-tissue transglutaminase 2 IgA < 4 U/ml, anti-deaminated gliadin peptides IgG < 20 U, Marsh score 0–1). The criterion for persistent GI symptoms was a Gastrointestinal Symptom Rating Scale IBS version(Reference Wiklund, Fullerton and Hawkey27) (GSRS-IBS) total score ≥ 30 at screening. Exclusion criteria are described in detail by van Megen et al. (Reference van Megen, Skodje and Lergenmuller11).
The participants were randomised to either an LFD group or a control group. The random allocation sequence was created by an investigator with no clinical involvement in the trial using STATA 15 (StataCorp LP) with random block sizes of 2, 4 and 6. The block sizes were varied to avoid the possibility of guessing the pattern in the randomisation list. The allocation sequence was concealed for participants and the involved researchers until after completion of baseline assessments. Participants randomised to the LFD group were instructed to consume a GFD low in FODMAP, while participants randomised to the control group were instructed to continue their regular GFD. Both diet groups were followed up for four weeks as out-patients, and all participants were requested to refrain from introducing other dietary changes during the study period. Biological sampling including stool samples was performed at baseline and 4-week follow-up.
Outcomes
The present study reports on the secondary outcomes of the randomised controlled trial (RCT) designed to investigate whether reduction of dietary FODMAP can relieve GI symptoms in CeD patients with persistent IBS-like symptoms despite GFD-adherence. The primary outcome of the RCT was change in GI symptoms (GSRS-IBS scores), and the results have been reported previously(Reference van Megen, Skodje and Lergenmuller11). Briefly, GSRS-IBS is a questionnaire developed for self-evaluation of GI symptoms in IBS patients(Reference Wiklund, Fullerton and Hawkey27). It consists of thirteen items which together covers symptoms related to satiety (two items), abdominal pain (two items), diarrhoea (four items), constipation (two items) and bloating (three items). All the items have a response scale from 1 (no discomfort at all) to 7 (very severe discomfort).
The primary outcomes of the present study were differences in faecal microbiota, SCFA and NGAL between the control and LFD group at 4-week follow-up. Additionally, we investigated associations between changes in GI symptoms (GSRS-IBS scores) and changes in gut microbiota and SCFA and associations between faecal characteristic at baseline and symptom response.
Collection and preparation of stool samples
The participants were instructed to collect stool samples in 13 ml tubes at home the same weeks as the sampling days (baseline, 4-week follow-up) and store the samples in their own freezers until the visits at the clinic. The samples were transported to Oslo University Hospital by the participants at the day of their visits, keeping the sample under cold conditions (∼4°C) enabled by a specially made freezing element in Styrofoam boxes. The samples were temporarily stored at −20°C for about 4 weeks followed by long-term storage at −80°C and transferred between collaborating institutions on dry ice.
Approximately 24 h prior to aliquotation, the samples were moved from −80 to −20°C. The samples were slightly thawed on ice before preparing smaller aliquots in 1·5 ml Eppendorf tubes using sterile scalpels in a laminar air flow cabinet to avoid contamination of the environment. The samples were kept on ice during the aliquotation procedure to maintain a semi-frozen condition. To avoid contamination between samples, disposable scalpels and working tools were used when possible, and non-disposable tools were washed between each sample with warm detergent-containing water followed by disinfection with 70 % ethanol and DNA decontamination reagent (43944, Sigma-Aldrich). Faecal aliquots were weighted and logged, and the aliquots designated for DNA extraction were added 600 μl room temperature Stool transport and Recovery Buffer (cat. no. 03335208001, Roche) and vortexed. All aliquots were stored at −80°C until further processing.
DNA extraction from faecal material
Faecal aliquots for DNA extraction (∼0·2 g in 600 μl Stool transport and Recovery Buffer) were crudely homogenised by vortexing and 300 μl of the resulting suspensions were transferred to tubes containing acid-washed glass beads (∼0·2 g < 106 μm, ∼0·2 g 425–600 μm and 1 2·5–3·5 mm, Sigma-Aldrich). All samples were processed twice on FastPrep 96 to obtain cell lysis (1800 rpm, 40 s, 5 min cooling step at room temperature in-between, MP BioMedicals). Processed samples were centrifuged (∼13 226 × g , 10 min), and 50 μl supernatants were transferred to 96-well plates for protease treatment followed by DNA extraction using Mag Midi LGC kit (cat. no. NAP40420, LGC Genomics) according to the manufacturer’s protocol on a KingFisher Flex DNA extraction robot (Thermo Fisher Scientific).
Library preparation and gene sequencing of 16S rRNA
Gene sequencing of 16S rRNA was performed according to the workflow reported by Avershina et al. (Reference Avershina, Lundgard and Sekelja28). After DNA extraction from faecal material, 16S rRNA genes were amplified by PCR using prokaryote-targeting primers (online Supplementary Table 1 and 2). The resulting PCR products (∼466 bp) were purified using AMPure XP (Beckman-Coulter) and ten further PCR cycles with index primers modified with Illumina adapters were performed (online Supplementary Table 3–5), resulting in PCR products of ∼594 bp. All PCR products were qualitatively confirmed by gel electrophoresis. Quantification, normalisation and pooling of individual libraries were followed by purification by AMPure XP and quantification of the pooled library. The pooled library was diluted to 6 pM and sequenced with the MiSeq Reagent Kit V3 (Illumina, cat. nr. MS-102–3003, Illumina) on the Illumina MiSeq following Illumina’s protocol (16S Metagenomic Sequencing Library Preparation Part# 15044223 Rev. B), except we used nuclease free-water instead of Tris for PhiX library dilution. PhiX (20 %, Illumina, cat. nr. FC-110–3001) served as internal control.
Processing of 16S rRNA sequencing data
The resulting 300 bp forward and reverse paired-end reads from gene sequencing of 16S rRNA were assembled, split into their respective samples and quality-filtered using QIIME(Reference Caporaso, Kuczynski and Stombaugh29). The resulting dataset included in total 4 058 950 high-quality and chimera-checked sequences from the 138 samples (10 367–114 847 sequences/sample), with mean (sd) sequencing depth of 29 413 (14 540) sequences/sample. Sequences were clustered into taxonomically assigned operational taxonomic units (OTUs) with ≥ 97 % identity using the closed-reference USEARCH algorithm (version 8)(Reference Edgar30,Reference Edgar31) against the SILVA database (release 128)(Reference Pruesse, Quast and Knittel32). The OTU counts for each sample were normalised by down-sampling (rarefying) to an even library size of 10 000 sequences/sample in QIIME (core_diversity_analyses.py). No relationship was found between number of observed OTUs in the normalised OTU table and the original sequencing depth (online Supplementary Fig. 1). In the normalised dataset, 986 OTUs were identified in total (rarefaction curves in online Supplementary Fig. 2(a)). The OTUs were taxonomically binned into nine phylum (p_)-, 16 class (c_)-, 19 order (o_)-, 34 family (f_)- and 119 genus (g_)-level taxa when excluding OTUs with no taxonomic assignment below kingdom level (OTUs classified as ‘unassigned’ or ‘unknown bacteria’) and those taxa detected in less than 30 % of the samples at both time points in both diet groups. For analyses where only baseline samples were included, six genera were excluded since not detected in more than 30 % of the samples in either diet group. This OTU filtering was chosen to achieve a state of representativeness and robustness. Taxa abundances are presented as relative abundance (%) where the lowest detectable abundance was 0·01 %.
Bacterial α- and β-diversity
Bacterial between-sample diversities (β-diversity; Jaccard, Bray–Curtis and weighted UniFrac distances(Reference Lozupone, Hamady and Kelley33)) and within-sample diversities (α-diversity; Chao1 and Shannon–Wiener index) were calculated based on normalised OTU table(s) using QIIME default scripts (core_diversity_analyses.py). The Chao1 and Shannon–Wiener index aim to describe bacterial richness (estimated number of species (OTUs)) and total diversity (richness and evenness combined) of a bacterial community, respectively. Higher α-diversity indicates a more diverse community. Rarefaction curves for the Chao1 and Shannon–Wiener index are provided in online Supplementary Fig. 2(b) and (c). β-diversity aim to quantify the overall dissimilarity (‘distance’) between two bacterial communities, where weighted Unifrac distances are phylogenetic distances, Bray–Curtis abundance-based distances and Jaccard incidence-based distances. All β-diversity indices used are expressed as dissimilarities ranging from 0 to 1, where higher numbers indicate less similar communities. For each participant, the β-diversity of the baseline and 4-week follow-up sample was used as a measure of change in the overall bacterial community structure (referred to as ‘within-subject β-diversity’). Ordination of β-diversities was performed using non-metric multidimensional scaling. Details are provided in online Supplementary method description.
Short-chain fatty acids measurements by GC-flame ionisation detection
Faecal homogenates for SCFA measurements by GC with flame ionisation detection were prepared by homogenising ∼0·5 g faeces in 2 ml distilled water containing 3 mmol/l 2-ethylbutyric acid (internal standard) and 0·5 mmol/l sulphuric acid. A fraction of 2·5 ml of the homogenate was vacuum distilled, according to the method of Zijlstra et al. (Reference Zijlstra, Beukema and Wolthers34), as modified by Hoverstad et al. (Reference Hoverstad, Fausa and Bjorneklett35) and added 12 % formic acid (30 µl per 500 µl distillate). The distillate was analysed with GC (Agilent 6850, Agilent) using a HP-FFAP WAX capillary column (part number 19091F-112E, serial number USE400345H, Agilent J&W GC columns; Agilent). The SCFA acetic, propionic, butyric, iso-butyric, valeric, iso-valeric, caproic and iso-caproic acid were quantified using internal standardisation employing flame ionisation detection. The results for all SFCA were adjusted for wet weight and are expressed as mmol/kg faeces and relative amount (% of total).
Neutrophil gelatinase-associated lipocalin measurements by ELISA
Preparation of faecal aliquots for NGAL measurements by ELISA was based on Chassaing et al. (Reference Chassaing, Srinivasan and Delgado36) with some modifications. Faecal aliquots (∼100 mg) were mixed with 1 ml room temperature Dulbecco’s phosphate-buffered saline (L0615, Biowest) with 0·1 % Tween20 (P1379, Sigma-Aldrich). Homogenous faecal suspensions were obtained by vigorously mixing using a MM2 mixer mill (Retsch, speed 60, 20 min) with adapters for Eppendorf tubes (22·008·0005, Retsch). The suspensions were centrifuged for 10 min (13 523 × g , 4°C) and the resulting supernatants were diluted 1:100 in Dulbecco’s phosphate-buffered saline prior to ELISA. The 1:100 dilution was considered the most optimal for avoiding inhibitory effects based on experiments testing various dilutions. ELISA procedure was performed using Human lipocalin-2/NGAL Duoset ELISA (DY1757, R&D Systems) according to the manufacturer’s instructions with some modification. Modifications included using Dulbecco’s phosphate-buffered saline without Tween20 for the first wash and blocking with reagent diluent at 4°C overnight during plate preparations, using an eleven-point standard curve, and after adding samples, incubating plates with shaking (300 rpm, horizontal movement). Standard curves were generated using four-parameter logistic curve fit in Softmax Pro (version 6·5, 2015, Molecular Devices). Samples were analysed in duplicates. The NGAL results were adjusted for wet weight and are expressed as ng/g faeces.
Statistics
All statistical analyses were performed using R(37). Details are provided in online Supplementary method description, including evaluation of model assumptions and specific use of packages and functions in R. All statistical analyses were performed per protocol, where only participants with available faecal outcomes at baseline and 4-week follow-up were included. Alternatives to exclusion, i.e. imputation of missing values, were not considered suitable since stool samples were only collected at two time points.
Sample size
As previously reported(Reference van Megen, Skodje and Lergenmuller11), the sample size estimation for the RCT was based on a clinically relevant change in the GSRS-IBS total score, defined as a reduction of seven points (sd, 10 points) from baseline to 4-week follow-up. With a power of 80 %, and a two-sided 5 % significance level, it was estimated that thirty-four participants were needed in each diet group. The total number was increased to seventy-four participants to account for 10 % drop-out.
Between-group comparisons
Multiple linear regression (ANCOVA)(Reference Vickers and Altman38) was performed to estimate the effect of diet group (difference between the control and LFD group) at 4-week follow-up while adjusting for baseline values of the outcome variable in question (follow-up values ∼ baseline values + diet group + (baseline values × diet group)). The interaction term (baseline values × diet group) was excluded when P interaction > 0·05, leaving the reduced model with only baseline values and diet group as explanatory variables (follow-up values ∼ baseline values + diet group). The estimated interaction or diet group effects are reported together with corresponding P values (P interaction or P group). Transformation of baseline and follow-up values (log10 or square root) was used when model assumptions were not reasonably met. ANCOVA was performed for the outcome variables Chao1 index, Shannon–Wiener index, taxa abundances, SCFA and NGAL.
Independent two-sample t test or Wilcoxon rank-sum exact test (in cases where residuals were not reasonably normally distributed) was performed to compare within-subject β-diversity (single-value responses) between diet groups.
Within-group comparisons
Prior to between-group comparisons of taxa abundances, within-group comparisons (baseline v. 4-week follow-up within diet groups) using Wilcoxon signed-rank test (exact or with continuity correction) were performed. This within-group analysis approach was included as a measure for reducing the number of taxa that would be subject to between-group comparison. Only taxa which had changed or tended to change from baseline to follow-up within the LFD group were included for between-group comparisons.
Correlations
Spearman’s correlation was run to assess associations between change in GI symptoms and change in faecal outcomes variables (taxa abundances, propionic acid and valeric acid) and between change in GI symptoms and faecal baseline characteristics (α-diversity, taxa abundances, SCFA and NGAL). Spearman’s rank correlation coefficients (Rho) and P values are reported. Rho between 0 and (-) 0·3 is described as negligible, between (-) 0·3 and (-) 0·5 as weak, between (-) 0·5 and (-) 0·7 as moderate, between (-) 0·7 and (-) 0·9 as high and between (-) 0·9 and (-) 1 as strong.
Statistical significance
For most statistical testing, unadjusted P values below 0·05 were considered statistically significant. However, for within-group comparison of taxa abundances and Spearman’s correlation for GI symptoms against baseline taxa abundance, an unadjusted P value below 0·05 was only considered statistically significant if the Benjamini–Hochberg (BH) false discovery rate-adjusted P value was also below 0·05, otherwise the result was referred to as a tendency.
Results
Participants, gastrointestinal symptoms and FODMAP intake
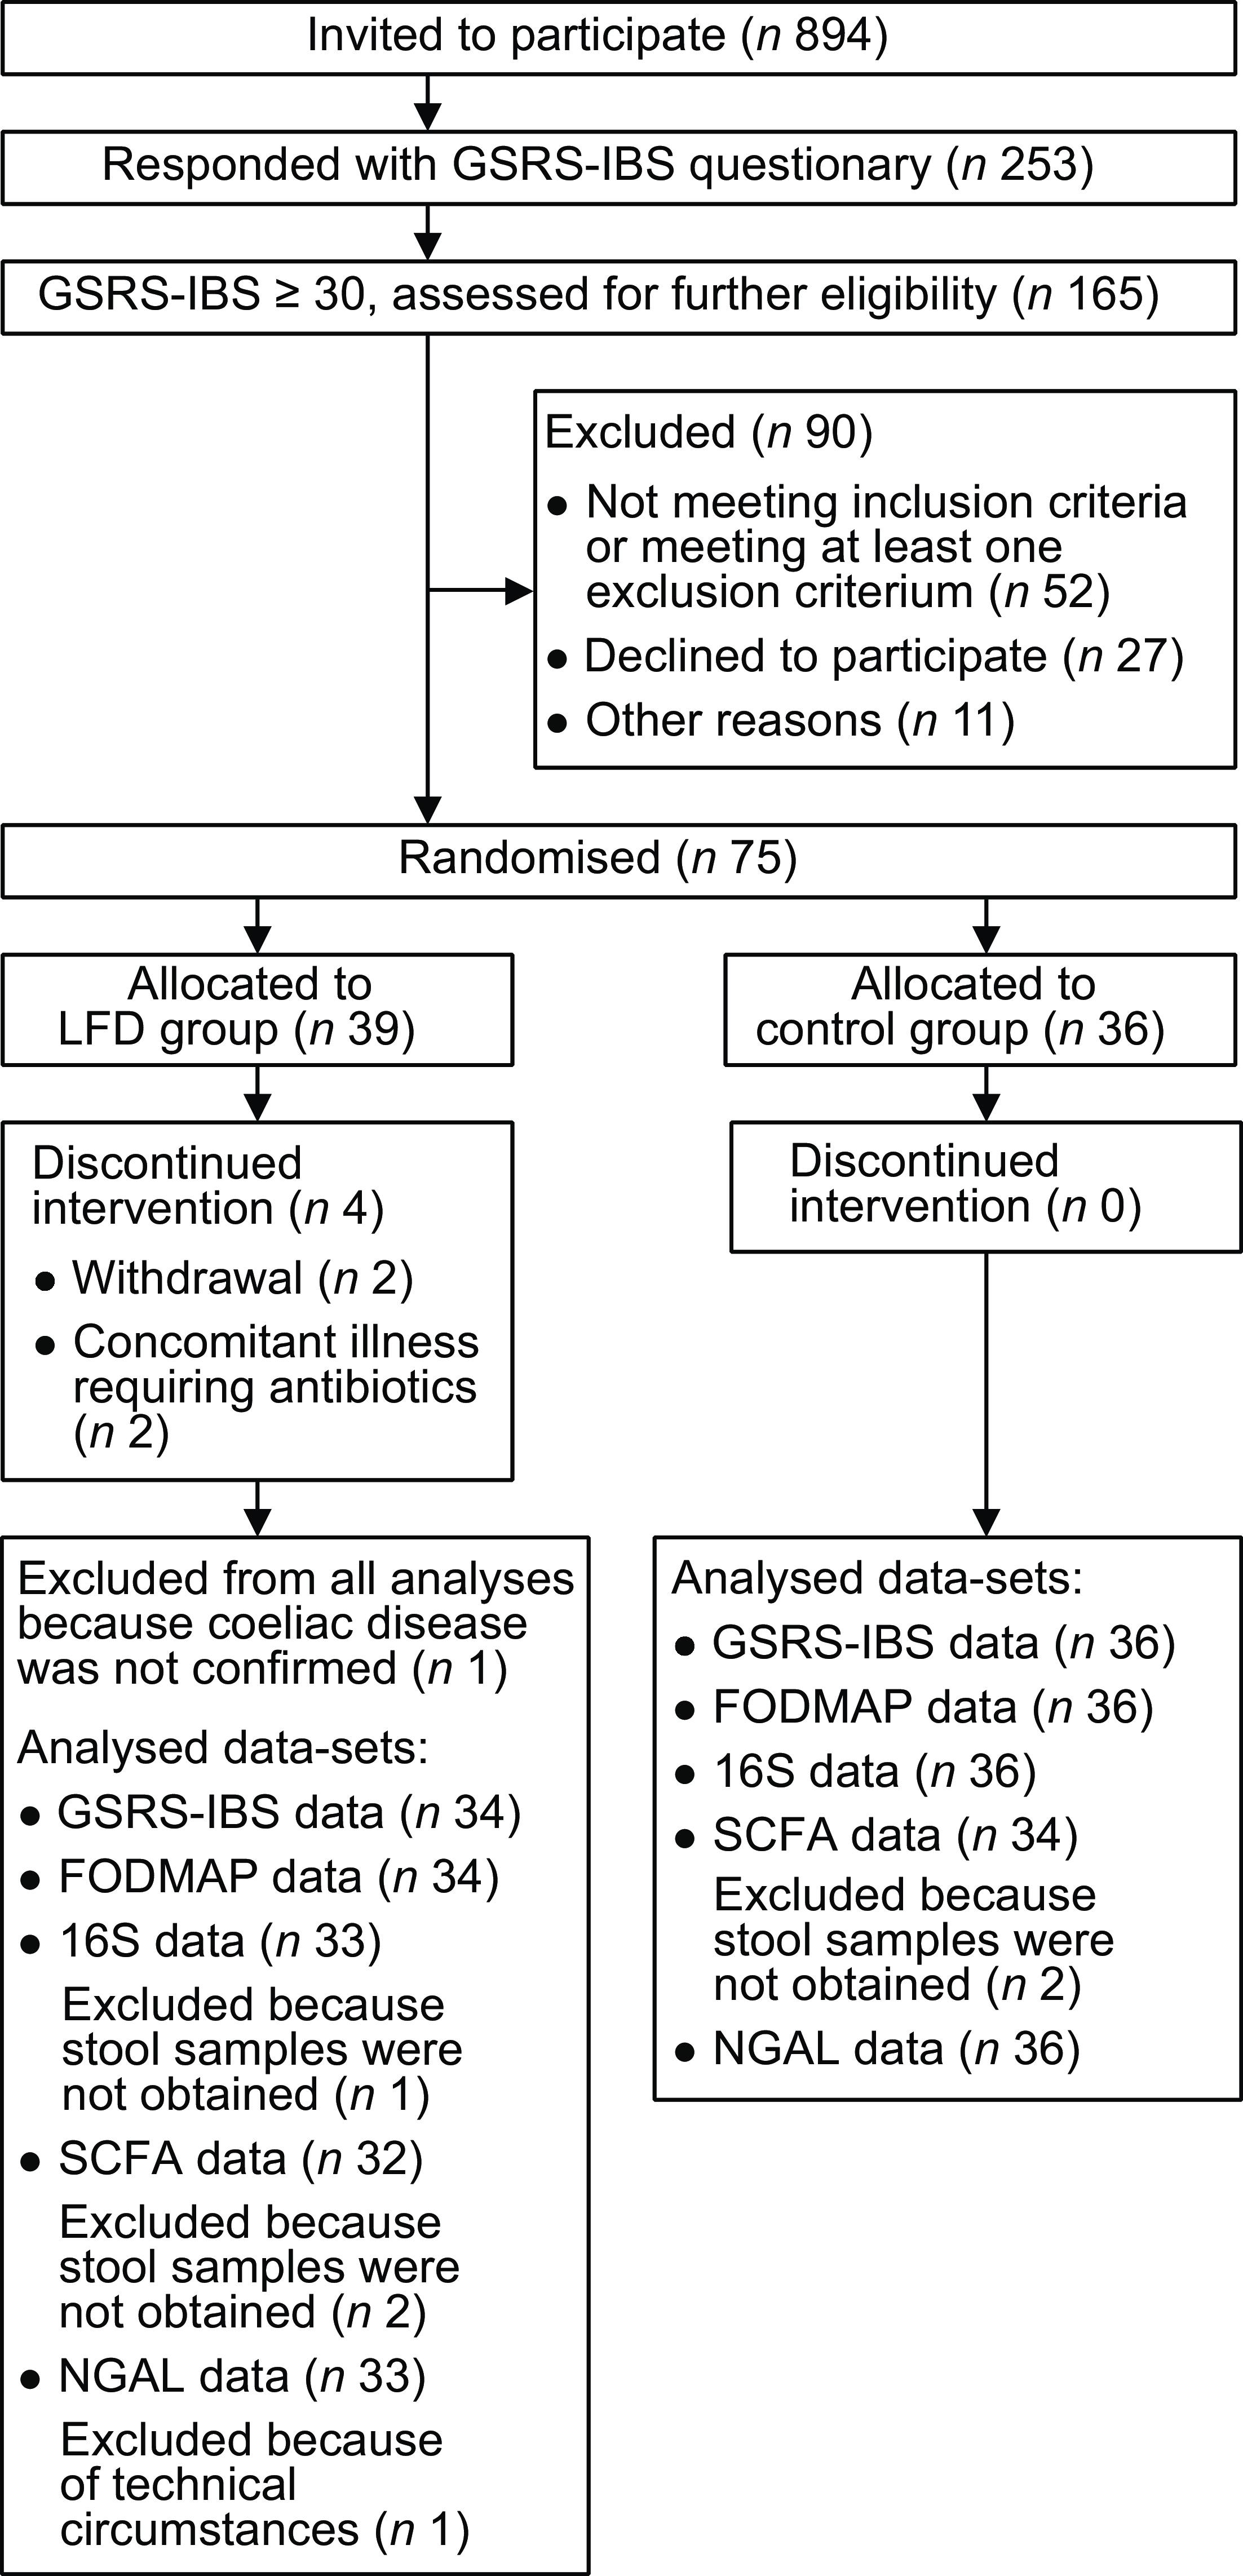
Participant flow chart is provided in Fig. 1. In total, 894 persons were invited by email to participate in the study. Of the 253 that responded, 165 met the inclusion criterion of GSRS-IBS total score of 30 or higher. Of these, fifty-two were excluded for not meeting the other inclusion criteria or for meeting at least one exclusion criterion, twenty-seven declined to participate and eleven were excluded due to other reasons(Reference van Megen, Skodje and Lergenmuller11). The remaining seventy-five participants were randomised and allocated to the control (n 36) or LFD group (n 39). Two participants in the LFD group discontinued the intervention due to concomitant illness requiring antibiotic treatment, two participants withdrew and one participant was excluded since CeD was not confirmed. GSRS-IBS score data, estimated FODMAP intake and stool samples were collected at baseline and 4-week follow-up from the seventy participants that completed the study (control group: n 36; LFD group: n 34). NGAL analysis was performed on faecal samples from all participants, while one participant in the LFD group was excluded from the microbiota analysis due to insufficient faecal material. Insufficient faecal material also led to exclusion of four participants from the SCFA analysis (two from each diet group).
Flow chart of the population selection process with inclusion and exclusion of participants and overview of analysed samples/data. FODMAP, fermentable oligosaccharides, disaccharides, monosaccharides and polyols; GSRS-IBS, gastrointestinal symptom rating scale IBS version; IBS, irritable bowel syndrome; LFD, low FODMAP diet; NGAL, neutrophile gelatinase-associated lipocalin; SCFA, short-chain fatty acids.
Baseline characteristics of the participants stratified by diet groups are presented in Table 1. Briefly, the participants were mostly females (84 %) around 40 years of age in which approximately 50 % had BMI categorised as overweight or obese. Furthermore, most participants had a Marsh score equal to 0, with maximum score of 1, and several participants reported food allergies or intolerances (43 %). Additional baseline characteristics have been previously reported(Reference van Megen, Skodje and Lergenmuller11).
Participant characteristics at baseline*
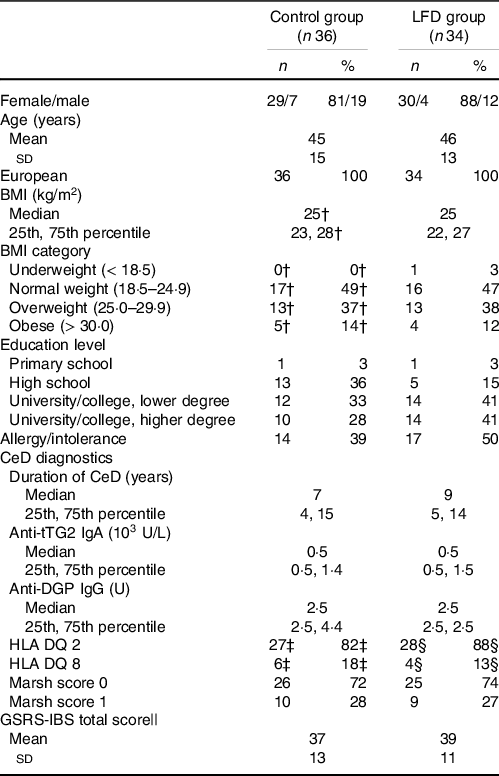
* Values are presented as n and percentage for categorical variables, means with sd for normally distributed variables or medians with 25th and 75th percentile for non-normally distributed variables. Median is used for variables where data were not normally distributed in at least one group. LFD, low FODMAP diet; FODMAP, fermentable oligosaccharides, disaccharides, monosaccharides and polyols; CeD, coeliac disease; tTG, tissue transglutaminase; DGP, deaminated gliadin peptide; HLA, human leukocyte antigen; GSRS-IBS, gastrointestinal symptom rating scale IBS version; IBS, irritable bowel syndrome.
† n 35 (one missing).
‡ n 33 (three missing).
§ n 32 (two missing).
|| GSRS-IBS total scores are presented as mean with sd but are not checked for normality because the method is based on the mean independently of normality.
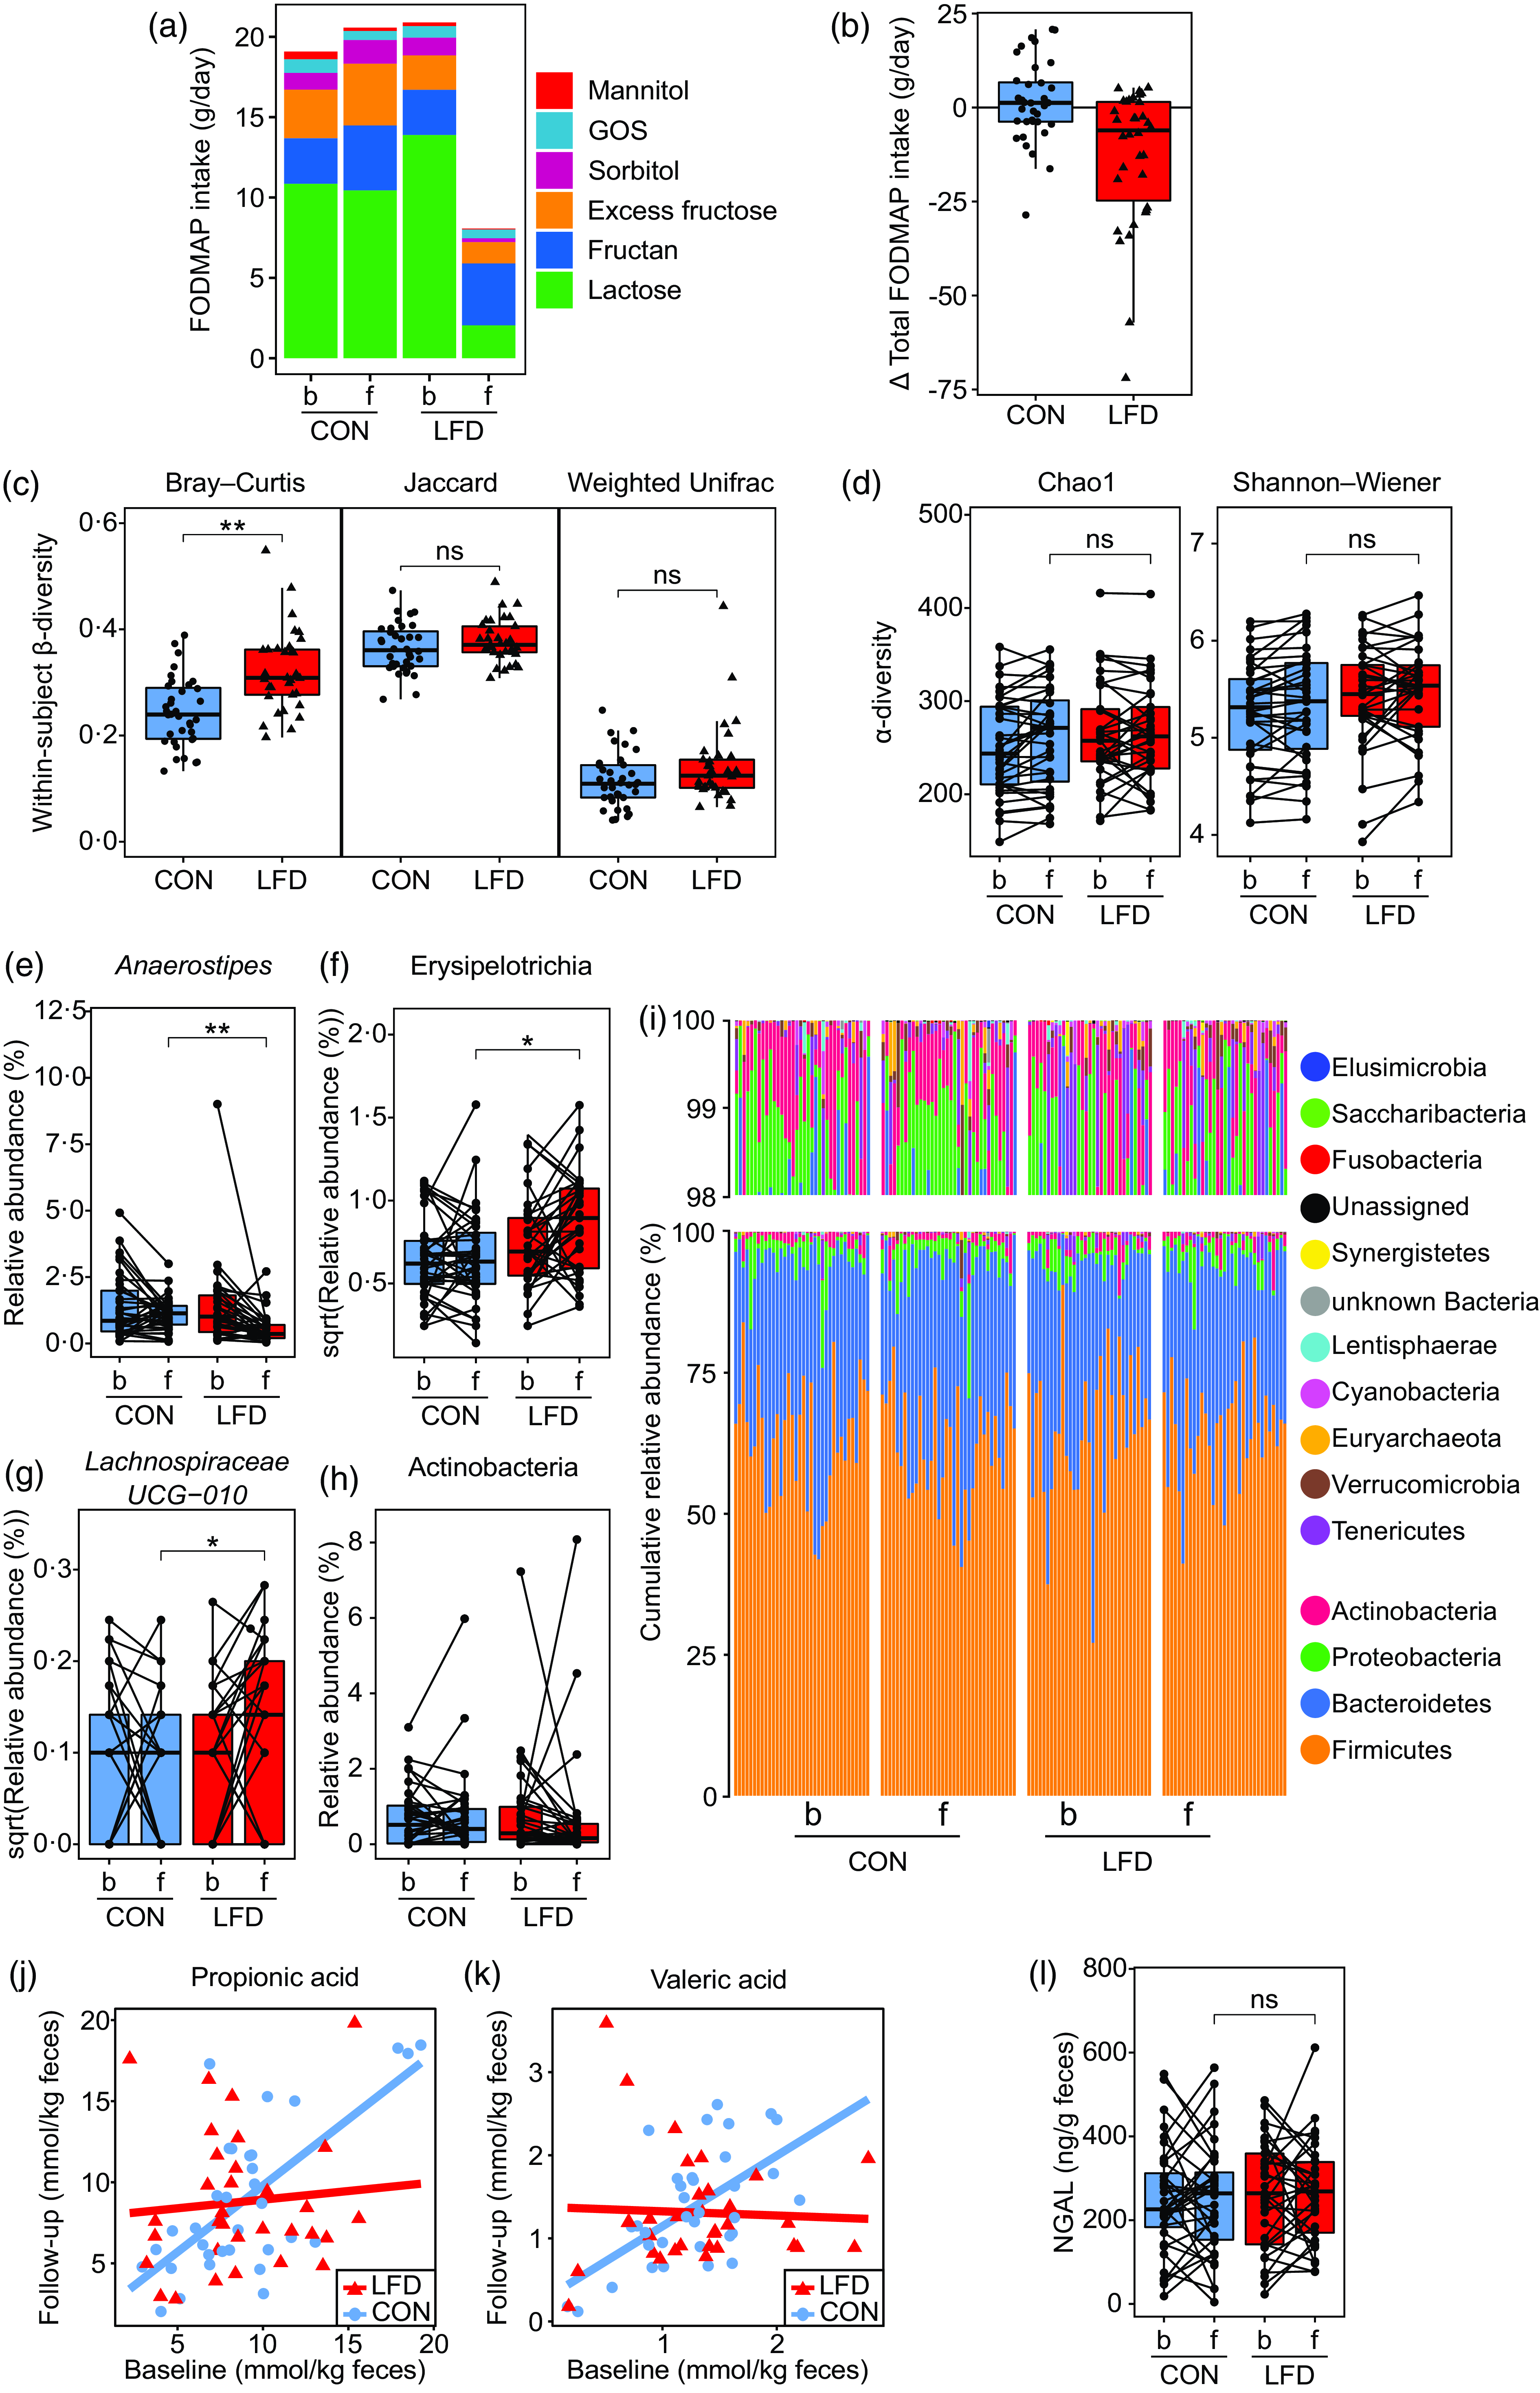
As described by van Megen et al. (Reference van Megen, Skodje and Lergenmuller11), the participants in the LFD group reported a lower intake of total FODMAP at follow-up than in the control group. The reduction was mainly achieved by a reduced intake of excess fructose (monosaccharide), lactose (disaccharide), sorbitol and mannitol (polyols) (Fig. 2(a) and (b)). No difference between the LFD and control group was found for fructan or GOS (oligosaccharides) at follow-up. For the primary outcome of the RCT, it was found that the LFD significantly reduced GI symptoms in the LFD group as measured by GSRS-IBS total score and dimension scores abdominal pain, bloating, diarrhoea and satiety, but not for constipation(Reference van Megen, Skodje and Lergenmuller11).
FODMAP intake, faecal microbiota, faecal SCFA and faecal NGAL for the control (‘CON’) and low FODMAP diet (‘LFD’) group. (a) FODMAP intake (g/d) at baseline (‘b’) and 4-week follow-up (‘f’) for the CON (n 36) and LFD (n 34) group. Colours represent subgroups of FODMAP (lactose, fructan, excess fructose, sorbitol, GOS and mannitol). (b) Change in total FODMAP intake (g/d) from baseline to follow-up for the CON (n 36) and LFD (n 34) group. Each circle/triangle represents the change for one participant. Change is defined as follow-up minus baseline value. (c) Faecal within-subject β-diversity for the CON (n 36) and LFD (n 33) group. From left to right: Bray–Curtis, binary Jaccard and weighted Unifrac. Each circle/triangle represents the β-diversity between the baseline and follow-up sample for one participant. Between-group comparison was performed using independent two-sample t test (Jaccard, Bray–Curtis) or Wilcoxon rank-sum exact test (weighted Unifrac). (d) Faecal α-diversity at baseline and follow-up for the CON (n 36) and LFD (n 33) group. From left to right: Chao1 and Shannon–Wiener index. Between-group comparison at follow-up was performed using ANCOVA with adjustment for baseline values (no interaction). (e)-(h) Faecal relative abundances (%) or square root transformed relative abundances at baseline and follow-up for the CON (n 36) and LFD (n 33) group of the bacterial (e) genus Anaerostipes, (f) class Erysipelotrichia (identical to family Erysipelotrichaceae), (g) genus Lachnospiraceae UCG-010 and (h) class Actinobacteria. Each circle represents one sample from one participant, and samples from the same participant are connected with a line. Between-group comparison at follow-up was performed using ANCOVA with adjustment for baseline values (no interaction). (i) Cumulative faecal relative abundances (%) of all detected phyla at baseline and follow-up for the CON (n 36) and LFD (n 33) group. One bar represents one participant at one timepoint. (j), (k) Faecal concentrations (mmol/kg faeces) of (j) propionic and (k) valeric acid at baseline and follow-up for the CON (n 34) and LFD (n 32) group. Each circle/triangle represents one participant. Red and blue lines represent the fitted ANCOVA model with follow-up values as response variable and with baseline values, diet group and diet group × baseline interaction as explanatory variables. (l) Faecal concentrations (ng/g faeces) of NGAL at baseline and follow-up for the CON (n 36) and LFD (n 33) group. Each circle represents one sample from one participant, and samples from the same participant are connected with a line. Between-group comparison at follow-up was performed using ANCOVA with adjustment for baseline values (no interaction). FODMAP, fermentable oligosaccharides, disaccharides, monosaccharides and polyols; GOS, galacto-oligosaccharides; NGAL, neutrophile gelatinase-associated lipocalin; SCFA, short-chain fatty acids. ns: P > 0·05; *P < 0·05; **P < 0·0001.
Effects of the low FODMAP diet on the faecal microbiota
To evaluate effects of the LFD intervention on faecal microbiota, we performed a 16S rRNA gene-based sequencing approach, comparing the diet groups with regard to β-diversity, α-diversity and relative abundance of bacterial taxa (Fig. 2(c)–(i)).
Change in the overall faecal microbiota (Bray–Curtis β-diversity) was greater for the low FODMAP diet group
Three different measures of between-sample diversity (β-diversity) were used to assess the overall change (‘distance’) in bacterial community structure between the baseline and follow-up sample for each participant (‘within-subject β-diversity’): (1) Jaccard, (2) Bray–Curtis and (3) weighted Unifrac distances (Fig. 2(c)). Higher within-subject β-diversity indicates more change from baseline to follow-up and the three distance measures utilise different community factors as illustrated by correlation plots provided in online Supplementary Fig. 3.
The within-subject Bray–Curtis distances were higher in the LFD group than in the control group (t test, estimate: 0·08, P < 0·001, Fig. 2(c)) implying that the participants switching to an LFD had on average more changes in bacterial abundances from baseline to follow-up than those in the control group. No difference in within-subject β-diversities was found between the control and LFD group for within-subject Jaccard (t test, estimate: 0·01, P = 0·21, Fig. 2(c)) or weighted Unifrac distances (Wilcoxon rank-sum test, P = 0·12, Fig. 2(c)).
To further evaluate whether the participants in the LFD group obtained a more uniform microbiota, distinguishable from the control group, we constructed non-metric multidimensional scaling ordination plots of the Bray–Curtis distances for the total sample population as well as separately for baseline, follow-up and for each of the diet groups (online Supplementary Fig. 4). No distinct clustering of the samples according to diet group or time point was observed. Most importantly, the follow-up samples from the control and LFD group did not cluster according to group (online Supplementary Fig. 4(c)), and the baseline and follow-up samples from the LFD group did not cluster according to time point (online Supplementary Fig. 4(e)). These results indicate that the LFD did not induce large systematic changes in the faecal microbiota.
No effect of the low FODMAP diet on faecal bacterial richness or evenness; α-diversity
Two different indices of within-sample diveristy (α-diversity) were calculated and compared between the diet groups at follow-up with baseline adjustment (ANCOVA): (1) the Chao1 index (richness; estimated number of species) and (2) the Shannon–Wiener index (richness and evenness combined). No difference was found between the diet groups for Chao1 (estimate: −7·7, P group = 0·20) or Shannon–Wiener (estimate: 0·01, P group = 0·86) (Fig. 2(d)). ANCOVA model plots for the Chao1 and Shannon–Wiener index are provided in online Supplementary Fig. 5.
Lower faecal abundance of Anaerostipes in the low FODMAP diet group
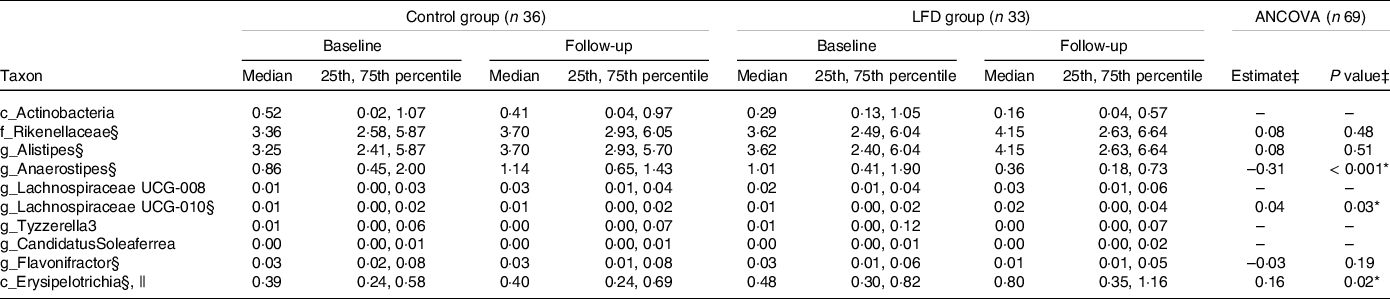
To obtain a more detailed understanding of the changes in faecal microbiota induced by the LFD, we evaluated the effect of the LFD on bacterial relative abundances (%) at different taxonomic levels (phylum, class, order, family and genus). First, the number of comparisons between the diet groups was reduced by excluding the taxa where no change had occurred from baseline to follow-up within the LFD group (online Supplementary Table 6). When only focusing on the taxa that had changed or tended to change within the LFD group (ten in total), between-group comparisons by ANCOVA with baseline adjustment (Table 2, ANCOVA model plots in online Supplementary Fig. 6) showed that the LFD group had significantly lower abundance of genus Anaerostipes (P group < 0·001, Fig. 2(e)) and higher abundance of class Erysipelotrichia (P group = 0·02, Fig. 2(f)) at follow-up than the control group. The low abundant genus Lachnospiraceae UCG-010 was also found to be higher in the LFD group than in the control group at follow-up (P group = 0·03, Fig. 2(g)). Anaerostipes and Erysipelotrichia were detected in faecal samples from all participants, while Lachnospiraceae UCG-010 was only detected in 60 % of the samples.
Between-group comparisons of faecal bacterial abundances at baseline and 4-week follow-up in the control and LFD group†
* P < 0·05.
† Bacterial abundances (%) are presented as medians with 25th and 75th percentile. LFD, low FODMAP diet; FODMAP, fermentable oligosaccharides, disaccharides, monosaccharides and polyols.
‡ Between-group comparison: ANCOVA models were fitted with follow-up values as response variable and with baseline values and diet group as explanatory variables. Estimated difference between the diet groups at follow-up (control as reference) with corresponding P group value from ANCOVA. Only taxa which had shown a change or tendency for change within the LFD group (within-group comparison using Wilcoxon signed-rank test, online Supplementary Table 6) were subject to between-group comparison. ANCOVA could not be performed for four out of ten taxa due to strong deviations from parametric model assumptions, low abundance and/or low detectability.
§ ANCOVA performed on square root transformed baseline and follow-up values.
|| Completely dominated by family Erysipelotrichaceae.
Between-group comparisons by ANCOVA could not be performed for the abundant class Actinobacteria and the low abundant genera Lachnospiraceae UCG-008, Tyzzerella3 and Candidatus Soleaferrea due to strong deviations from parametric model assumptions, low abundance and/or low detectability (Table 2). The within-group comparisons (online Supplementary Table 6) showed that Actinobacteria (mainly genus Bifidobacterium, Fig. 2(h)) and Tyzzerella3 tended to decrease, while Lachnospiraceae UCG-008 and Candidatus Soleaferrea tended to increase within the LFD group. For these four taxa, the within-group analysis showed no tendency for change from baseline to follow-up within the control group.
Generally, the faecal microbiota of the participants was dominated by the phylum (median relative abundance) Firmicutes (65 %), followed by Bacteroidetes (30 %), Proteobacteria (2·3 %) and Actinobacteria (1 %). Only these four phyla were detected in faecal samples from all participants (Fig. 2(i)). We also observed that the variation in relative abundances was high between and within participants. To exemplify, the relative abundance of Firmicutes ranged from 27 to 91 % and Actinobacteria ranged from 0·08 to 11 %.
Effects of the low FODMAP diet on faecal short-chain fatty acids
To investigate the impact of the LFD on microbial metabolism, we compared the control and LFD group with regard to faecal concentrations of SCFA, which are produced in the colon through bacterial fermentation of carbohydrates and proteins. Average faecal concentrations (mmol/kg faeces) and relative amounts (% of total) of SCFA at baseline and follow-up stratified by diet groups are presented in Table 3.
Between-group comparisons of faecal SCFA at baseline and 4-week follow-up in the control and LFD group†
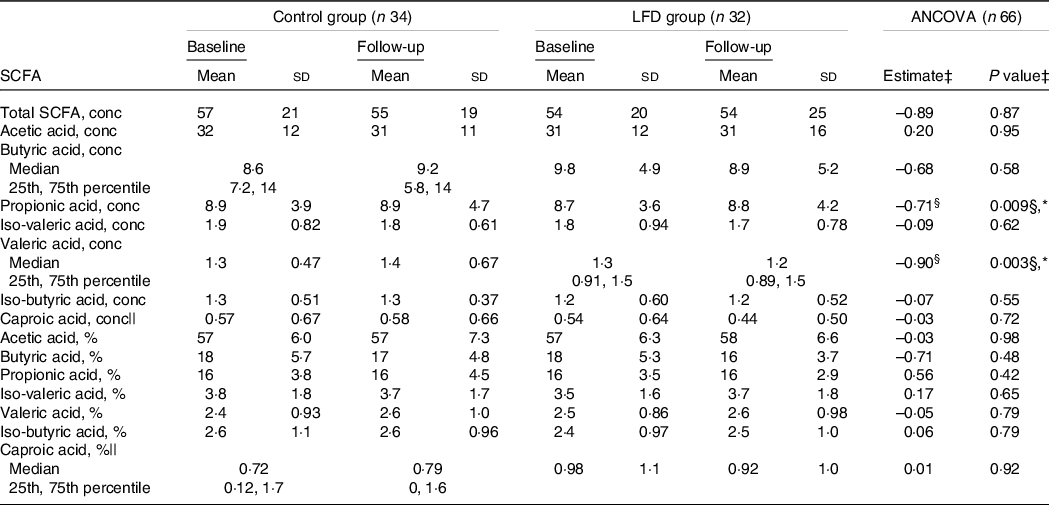
* P < 0·05.
† SCFA concentrations (‘conc’, mmol/kg faeces) and percentages (‘%’, of total SCFA) are presented as means with sd or medians with 25th and 75th percentile. SCFA, short-chain fatty acids; LFD, low FODMAP diet; FODMAP, fermentable oligosaccharides, disaccharides, monosaccharides and polyols.
‡ Between-group comparison: ANCOVA models were fitted with follow-up values as response variable and with baseline values and diet group as explanatory variables. Estimated difference between the diet groups at follow-up (control as reference) with corresponding P group value from ANCOVA, except where specified.
§ Estimated baseline values × diet group interaction (control as reference) with corresponding P interaction value from ANCOVA.
|| ANCOVA performed on square root transformed baseline and follow-up values.
Using ANCOVA with baseline adjustment, we found an interaction between baseline concentrations and diet group for both propionic (P interaction = 0·009) and valeric acid (P interaction = 0·003) (Table 3, Fig. 2(j) and (k)). These interactions indicate that, compared with the control group, the LFD led to lower follow-up concentrations of propionic and valeric acid in participants with high concentrations at baseline. No difference between the control and LFD group at follow-up was found for total SCFA, acetic, butyric, iso-butyric, iso-valeric or caproic acid concentrations, and no differences between the diet groups were found for SCFA relative amounts (Table 3). Iso-caproic acid was measured but excluded from statistical analysis since only detected in 9 % of the samples. Boxplot with response for each participant and ANCOVA model plot for all SCFA can be found in online Supplementary Fig. 7 (concentrations) and Supplementary Fig. 8 (relative amounts).
Effect of the low FODMAP diet on faecal neutrophil gelatinase-associated lipocalin
To evaluate the potential effect of the LFD on intestinal inflammation, we measured the faecal concentrations of the sensitive inflammation marker NGAL (Fig. 2(l)). At baseline, the control and LFD group had mean (sd) NGAL concentrations of 250 (130) and 261 (129) ng/g faeces, respectively, and at follow-up, the concentrations were 250 (133) and 264 (120) ng/g faeces, respectively. By applying ANCOVA with adjustment for baseline values, the LFD group was estimated to have NGAL concentration of 8·5 ng/g faeces higher than the control group at follow-up, which was considered a nonsignificant difference (P group = 0·74). ANCOVA model plot can be found in online Supplementary Fig. 9. One participant in the LFD group was excluded from the statistical analysis due to technical issues with sample handling in the laboratory.
Correlations between gastrointestinal symptoms and faecal microbiota
Since the LFD was shown to improve GI symptoms in the study population(Reference van Megen, Skodje and Lergenmuller11), we assessed the potential association between changes in faecal microbiota and changes in GSRS-IBS symptom scores.
By performing Spearman’s correlation tests between changes in GSRS-IBS scores and within-subject Bray–Curtis distances independent of diet group, no significant correlations were found (online Supplementary Table 7, P ≥ 0·11). Within the LFD group, smaller within-subject Bray–Curtis distances (i.e. less change in overall microbiota structure) were weakly associated with larger reduction in diarrhoea (Rho = 0·44, P = 0·010, online Supplementary Fig. 10(a), Supplementary Table 7). Within the control group, smaller within-subject Bray–Curtis distances were weakly associated with larger reduction in constipation (Rho = 0·40, P = 0·01, online Supplementary Fig. 10(b), Supplementary Table 7).
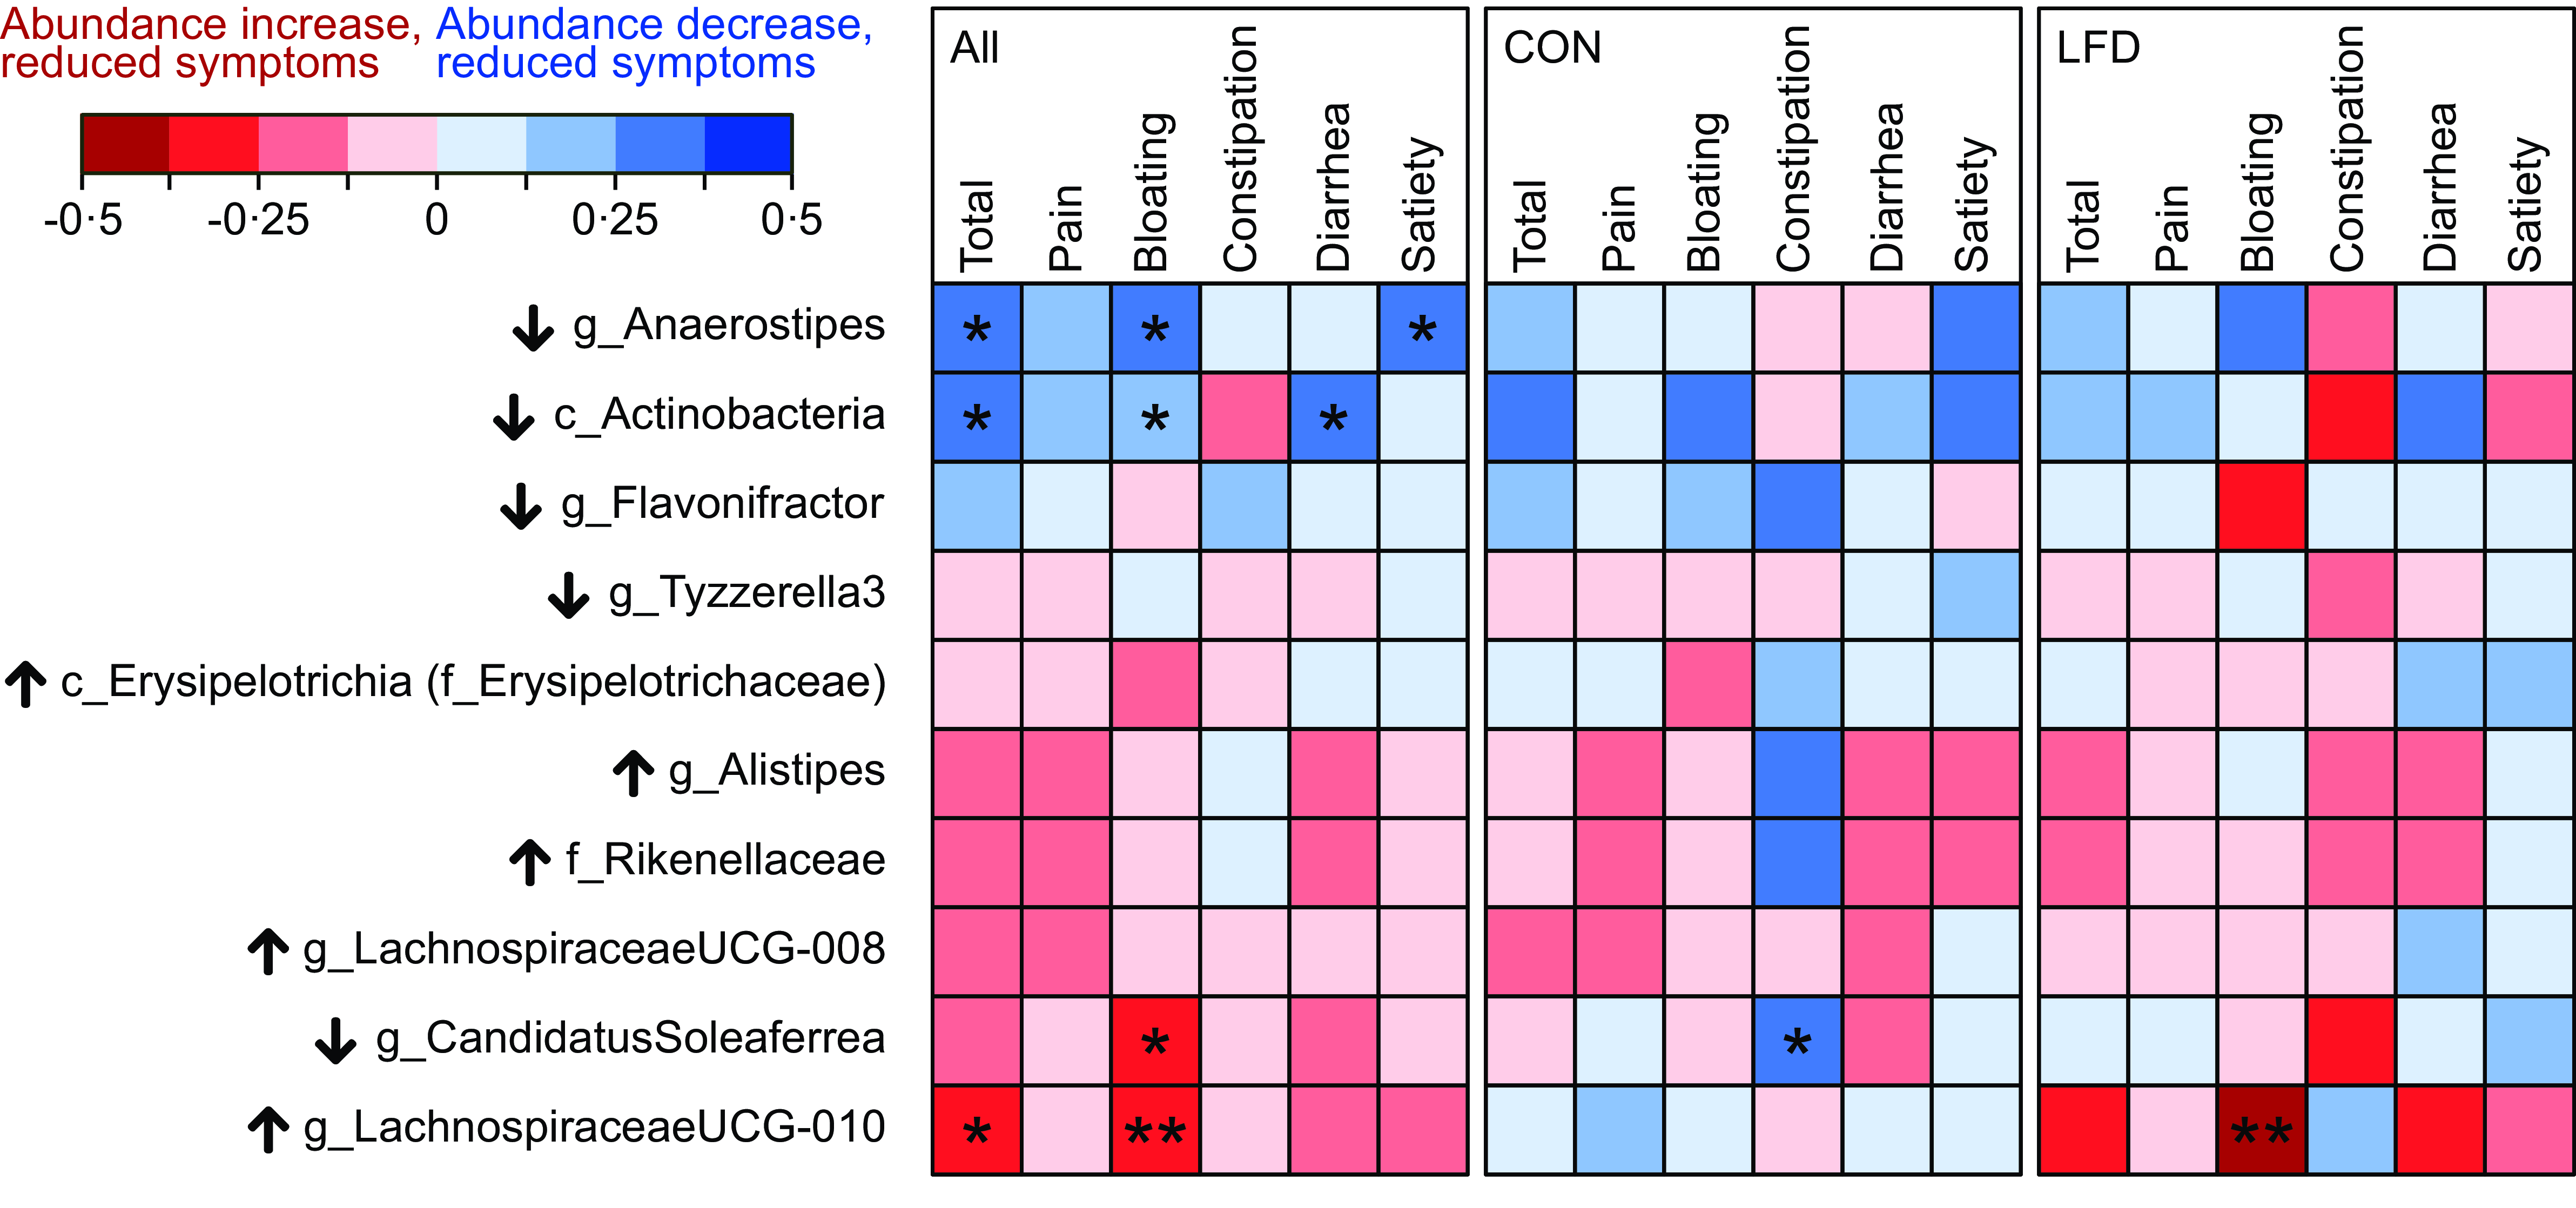
Spearman’s correlation tests between changes in bacterial abundances and changes in GSRS-IBS scores were also performed. A correlogram in Fig. 3 summarises the results, while details (Rho and P values) are provided in online Supplementary Table 8–10. Only taxa that changed or tended to change in LFD were included in the analysis (see Table 2 for taxa selection), and tests were first performed independent of diet group. Reduced relative abundances of both Anaerostipes (Rho = 0·26, P = 0·03) and Actinobacteria (Rho = 0·25, P = 0·04) were associated with reduced GSRS-IBS total scores. Regarding GSRS-IBS dimensions, reduced Anaerostipes abundances were associated with reduced bloating (Rho = 0·31, P = 0·01) and satiety scores (Rho = 0·30, P = 0·01), while reduced Actinobacteria abundances were associated with reduced bloating (Rho = 0·25, P = 0·04) and diarrhoea scores (Rho = 0·29, P = 0·02). Furthermore, increased abundances of Lachnospiraceae UCG-010 were associated with reduced GSRS-IBS total scores (Rho = –0·25, P = 0·04) and bloating scores (Rho = –0·36, P = 0·003). Finally, increased abundances of Candidatus Soleaferrea were associated with reduced bloating scores (Rho = –0·27, P = 0·02). All mentioned correlations were considered weak or negligible. When repeating the correlation analyses separately for each diet group, only Lachnospiraceae UCG-010 in the LFD group (Rho = –0·49, P = 0·004) and Candidatus Soleaferrea in the control group (Rho = 0·34, P = 0·04) displayed significant correlations.
Correlogram illustrating Spearman’s rank correlation coefficients (Rho) between change in bacterial abundances and change in GSRS-IBS scores (total score and dimensions pain, bloating, constipation, diarrhoea and satiety). Analysis was performed for the total population (‘All’, left panel, n 69) and separately for the control (‘CON‘, middle panel, n 36) and low FODMAP diet (‘LFD‘, right panel, n 33) group. Change is defined as 4-week follow-up minus baseline value. Only the taxa which changed in abundance, or tended to change, from baseline to follow-up in the LFD group were included (see Table 2). Details (Rho and P values) are provided in online Supplementary Table 8–10. Black arrows next to taxon names indicate the direction of change that was observed in the LFD group for that specific taxon (↑: increased abundance; ↓: decreased abundance). Colour scale (red to blue) indicates strength and direction of the correlations (Rho). Significant correlations are marked with asteriks. Positive correlation indicates that reduced bacterial abundances are associated with reduced GSRS-IBS scores, while negative correlation indicates that increased abundances are associated with reduced GSRS-IBS scores. FODMAP, fermentable oligosaccharides, disaccharides, monosaccharides and polyols; GSRS-IBS, gastrointestinal symptom rating scale IBS version; IBS, irritable bowel syndrome. *P < 0·05; **P < 0·01.
Correlations between gastrointestinal symptoms and faecal short-chain fatty acids
The LFD intervention seemed to decrease the faecal SFCA concentrations (mmol/kg faeces) of propionic and valeric acid in participants with high baseline concentrations. We therefore assessed whether changes in propionic and valeric acid concentrations were associated with changes in GSRS-IBS symptom scores. Spearman’s correlation tests were first performed independent of diet group (online Supplementary Table 11). Increased concentrations of propionic acid were negligibly associated with reduced satiety scores (Rho = −0·25, P = 0·04), while changes in valeric acid concentrations were not associated with changes in GSRS-IBS total scores or dimensions (P ≥ 0·28). When performing correlation analyses separately for each diet group, no correlations were considered significant (online Supplementary Table 11, P ≥ 0·23).
Correlations between gastrointestinal symptoms and faecal baseline characteristics
The primary analyses of faecal microbiota, SCFA and NGAL revealed only minor differences between the control and the LFD group at follow-up. Additionally, few significant correlations were found between changes in faecal microbiota/SCFA and changes in GI symptoms. We therefore performed exploratory analyses to investigate whether the different faecal characteristics at baseline could be associated with the GSRS-IBS response to the LFD. Spearman’s correlation was used to assess associations between the faecal baseline characteristics (α-diversity, relative abundance of taxa, SCFA and NGAL) and changes in GSRS-IBS total scores. Analyses were performed independent of diet group and within each diet group.
No associations were found between changes in GSRS-IBS total scores and baseline α-diversity (Rho ≤ 0·11, P ≥ 0·53, online Supplementary Fig. 11(a) and (b)). Of the bacterial taxa present in at least 30 % of the samples in at least one of the diet groups at baseline, abundance of eleven taxa tended to be associated with changes in GSRS-IBS total scores independent of diet group and/or within the LFD group (unadjusted P < 0·05, BH-adjusted P > 0·05, online Supplementary Table 12). These included the abundant family Bacteroidaceae (completely dominated by genus Bacteroides), family Ruminococcaceae and class Negativicutes (mainly the family Veillonellaceae). Lower Bacteroidaceae abundances at baseline were weakly associated with reduced GSRS-IBS total scores (Rho ≥ 0·25, P ≤ 0·04, independent of diet group and within the LFD group, online Supplementary Fig. 11(c)), higher baseline abundances of Ruminococcaceae were weakly associated with reduced GSRS-IBS total scores (Rho = –0·36, P = 0·04, within the LFD group, online Supplementary Fig. 11(d)) and lower abundances of Negativicutes at baseline were weakly associated with reduced GSRS-IBS total scores (Rho ≥ 0·26, P ≤ 0·04, independent of diet group and within the LFD group, online Supplementary Fig. 11(e)). In the control group, only two low abundant taxa (family Clostridiaceae1, genus Clostridiumsensustricto1) were positively associated with changes in GSRS-IBS total scores (Rho = 0·33, P = 0·05, online Supplementary Table 12).
For faecal SCFA, low concentrations and relative amounts of caproic acid were weakly associated with reduced GSRS-IBS total scores (Rho ≥ 0·27, P ≤ 0·03, Supplementary Fig. 11(f) and (g). Results from all SCFA variables are summarised in online Supplementary Table 13.
Finally, no associations were found between changes in GSRS-IBS total scores and baseline NGAL concentrations (Rho ≤ 0·13, P ≥ 0·29, online Supplementary Fig. 11(h)).
Discussion
To our knowledge, we are the first to report on the impact of an LFD on the faecal microbiota composition and related variables of gut health in GFD-treated CeD patients with persistent GI symptoms. After four weeks, certain differences in gut microbiota were detected between the control and LFD group, and the SCFA results indicated that the LFD resulted in lower concentrations of propionic and valeric acid in participants with initially high concentrations. Biomarker of gut inflammation was, however, unaffected by the LFD.
Importantly, we show that the participants in the LFD group had greater shifts in their overall microbiota profiles (Bray–Curtis within-subject β-diversity) from baseline to 4-week follow-up than the control participants. Furthermore, since a difference between the diet groups was only observed for the Bray–Curtis measure of within-subject β-diversity, and not for Jaccard and Weighted Unifrac, this suggests that the greater microbiota shifts in the LFD group were mainly characterised by abundance changes, and not by the bloom or disappearance of species or by phylogenetic changes. Our result contrast the result from a study of LFD in IBS, where no difference in β-diversity was found between the LFD and control group(Reference Staudacher, Lomer and Farquharson39). Furthermore, although the faecal microbiota had changed more in the LFD group than in the control group, these shifts did not result in any difference in bacterial α-diversity between the groups at follow-up. The finding that the LFD did not affect the bacterial α-diversity is consistent with that of other studies(Reference Cox, Lindsay and Fromentin20,Reference McIntosh, Reed and Schneider24,Reference Harvie, Chisholm and Bisanz40,Reference Staudacher, Scholz and Lomer41) .
In previous studies of LFD, a decline in Bifidobacterium abundance has been the most consistent finding(Reference Hustoft, Hausken and Ystad19–Reference Halmos, Christophersen and Bird22,Reference Staudacher, Lomer and Farquharson39,Reference Staudacher, Scholz and Lomer41–Reference Dieterich, Schuppan and Schink44) . Because Bifidobacterium spp. are beneficial for human health(Reference Hidalgo-Cantabrana, Delgado and Ruiz45), a reduction in these spp. due to FODMAP restriction has risen a concern for a potential unbeneficial effect for gut health. In the present study, we did not see a strong ‘anti-bifidogenic’ effect by the LFD as reported by others. We only observed a tendency for reduced abundance of the class Actinobacteria (mainly genus Bifidobacterium) within the LFD group. This discrepancy might be related to the lack of reduction in FODMAP fibres (fructan/GOS) in the present study, as compared with other LFD studies that report on a significant reduction in these FODMAP(Reference Cox, Lindsay and Fromentin20–Reference Halmos, Christophersen and Bird23,Reference Staudacher, Lomer and Farquharson39,Reference Harvie, Chisholm and Bisanz40,Reference Bennet, Bohn and Storsrud43) . Another explanation for the discrepancy might be a possible presence of initially low abundances of Bifidobacterium, which has been reported in other trials of GFD-treated CeD patients(Reference Collado, Donat and Ribes-Koninckx46–Reference Golfetto, de Senna and Hermes51). A low-gluten diet(Reference Hansen, Roager and Sondertoft52) and a GFD(Reference De Palma, Nadal and Collado53) have been shown to reduce Bifidobacterium abundance in healthy adult.
High abundance of the genus Anaerostipes has been identified as a potential biomarker of a healthy core microbiota in humans(Reference Lo Presti, Zorzi and Del Chierico54) and mice(Reference Wang, Lang and Shen55), possibly mediated through the production of the SCFA butyric acid(Reference Blaak, Canfora and Theis17). Thus, our distinct finding of lower follow-up abundances of Anaerostipes in the LFD group could indicate a potential undesired effect of the LFD. Also, the LFD group had modestly higher follow-up abundances of bacteria belonging to the class Erysipelotrichia and genus Lachnospiraceae UCG-010. Although literature on the implication of these bacteria in health and disease is unresolved(Reference Kaakoush56) and scarce, a few papers point in the direction of association between high bacterial abundances and adverse gut-related conditions(Reference Lo Presti, Zorzi and Del Chierico54,Reference Kaakoush56–Reference Coffey, Nielsen and Wemheuer58) .
While an LFD has previously been shown to affect bacterial metabolism with reduced faecal concentrations of the SCFA acetic(Reference Valeur, Roseth and Knudsen18,Reference Cox, Lindsay and Fromentin20) and butyric(Reference Valeur, Roseth and Knudsen18,Reference Hustoft, Hausken and Ystad19) acid, no effect of the LFD was observed for these acids in the present study, possibly due to the lack of systematic reduction in fructan and GOS intake. Instead, our results indicate that the LFD reduced the concentrations of propionic and valeric acid in those participants with initially high concentrations. To our knowledge, a reduction in these SCFA due to an LFD has not been reported before. While SCFA are generally reported to be positively associated with gut health, certain evidence suggests that a reduction in SCFA following the LFD could be regarded as favourable in the patient group of present study. First, high concentrations of SCFA (including propionic and valeric acid) have been observed in adults with long-term GFD-treated CeD compared with healthy controls(Reference Caminero, Nistal and Herran59,Reference Nistal, Caminero and Vivas60) , possibly indicative of a bacterial dysbiosis in the intestine. Second, high concentrations of SCFA (acetic and propionic acid) have been associated with more abdominal pain in IBS(Reference Tana, Umesaki and Imaoka61). Thus, if ‘unusual’ high SCFA concentrations indicate a state of bacterial dysbiosis that potentially triggers GI symptoms, reduced concentrations by the LFD may be a favourable effect. However, there are many potential mechanisms that can explain the reduced faecal concentrations of valeric and propionic acid, including reduced production, increased absorption by colonocyte and increased bacterial utilisation(Reference Blaak, Canfora and Theis17). Interpretations of the reduced SCFA concentrations in the present study therefore remain speculative without further assessments. Also, since the present study did not include healthy controls, we do not know if the faecal SCFA concentrations were abnormal in the treated CeD patients at baseline.
Low-grade inflammation has been implicated in IBS pathology(Reference Hod, Ringel-Kulka and Martin62,Reference Akiho, Ihara and Nakamura63) and could also be involved in triggering IBS-like concomitant symptoms in GFD-treated CeD(Reference El-Salhy, Hatlebakk and Gilja64,Reference Olano, Lopez and Freire65) . Furthermore, since an LFD has been shown to reduce the blood concentrations of proinflammatory cytokines in IBS patients(Reference Hustoft, Hausken and Ystad19), we wanted to investigate whether an LFD could induce changes in a faecal marker of intestinal inflammation. We considered NGAL a relevant marker for this purpose since NGAL has been characterised as a highly sensitive marker of intestinal inflammation in IBD, with tendency for elevated concentrations in IBS(Reference Thorsvik, Damas and Granlund26). However, in our study population, no difference in faecal NGAL concentrations was found between the control and LFD group at follow-up. It is possible that we could have measured an effect of the LFD if a more sensitive faecal marker had been investigated. Beta-defensin 2 is one such candidate that could be worth investigating in symptomatic GFD-treated CeD since it was measured in higher concentrations in IBS patients compared with healthy controls(Reference Langhorst, Junge and Rueffer66,Reference Shulman, Devaraj and Heitkemper67) .
Since the LFD to some extent affected the gut microbiota and SCFA, we investigated whether these changes were associated with changes in GI symptoms. Interestingly, within the LFD group, lesser change in the overall microbiota profiles (lower within-subject β-diversity) was weakly associated with larger reduction in diarrhoea. This finding could indicate that an optimal symptom response to the LFD is obtained when it is reducing the amount of water in the small intestinal and/or gas production while not extensively affecting the bacterial composition. We also explored whether faecal characteristics at baseline were determinants for symptom response to the LFD since not all participants in the LFD group experienced the same level of symptom relief. We found that low baseline abundance of Bacteroides was weakly associated with greater symptom response to LFD, which is in line with some studies(Reference Bennet, Bohn and Storsrud43,Reference Chumpitazi, Hollister and Oezguen68) . However, other studies have observed the opposite association(Reference Valeur, Smastuen and Knudsen69,Reference Chumpitazi, Cope and Hollister70) . Furthermore, in agreement with previous reports(Reference Valeur, Roseth and Knudsen18,Reference Hustoft, Hausken and Ystad19,Reference Halmos, Christophersen and Bird22) , the symptom improvement in response to the LFD in the present study was not associated with baseline concentrations of any of the major SCFA produced in the colon. However, we did observe that higher symptom response was weakly associated with low baseline concentrations of the minor abundant SCFA caproic acid (also known as hexanoic acid), but the potential mechanism behind this association is unknown.
As already mentioned, one explanation for the lack of uniform changes in gut microbiota and SCFA by the LFD in the present study could be the lack of reduction in FODMAP fibres (fructan/GOS), although the intake of total FODMAP was reduced on average from 21 to 8 g/d(Reference van Megen, Skodje and Lergenmuller11). For fructan/GOS, the mean intake at baseline and follow-up in the LFD group was 2·8/0·7 and 3·8/0·5 g/d, respectively, with no difference in follow-up intake between the control and LFD. For comparison, the mean amount of total FODMAP and FODMAP fibres in a typical Australian diet was ∼24 and ∼5·5 g/d(Reference Halmos, Christophersen and Bird22). No systematic reduction in fructan/GOS during the LFD in the present trial may be related to the fact that gluten-containing cereals and grains already excluded from the study participant’s diet are also a considerable dietary source of FODMAP oligosaccharides(Reference Muir, Varney and Ajamian71). The FODMAP restriction in the presents study was instead mainly characterised by reduced intake of lactose, excess fructose and polyols. In this regard, it is important to recognise that the effect of reduced intake of lactose and excess fructose on the gut microbiota highly depends on how much (or how little) of the consumed FODMAP that escapes digestion in the small intestine and becomes available for bacterial fermentation. For example, in a study of people with or without lactose malabsorption, Bifidobacterium abundance was only increased by lactose intake in the group with lactose malabsorption(Reference Szilagyi, Shrier and Heilpern72). While lactose malabsorption is a common issue in CeD under active intestinal inflammation,(Reference Alkalay73) less is known about the prevalence of fructose and lactose malabsorption/intolerance in long-term GFD-treated CeD, but it has been reported(Reference Ghoshal, Ghoshal and Misra74–Reference Barrett, Irving and Shepherd77). In the present study, participants were not assessed for malabsorption, so we are not able to link the variable bacterial responses directly to variations between participants in fructose/lactose malabsorption status. However, several participants reported having GI symptoms as response to the intake of lactose-containing foods, which could indicate that at least lactose malabsorption was present in our study population(Reference Wilder-Smith, Materna and Wermelinger78). Thus, variations in lactose and/or fructose malabsorption could potentially explain why few uniform changes were found in specific bacterial taxa in response to the LFD. It should also be noted that the baseline intake of lactose and excess fructose in the LFD group in the present study was considerably higher (13·9 v. 1·35 g/d) and lower (2·1 v. 12·7 g/d), respectively, compared with the previously mentioned Australian study(Reference Halmos, Christophersen and Bird22). Such differences in baseline diets highlight the difficulties regarding between-study comparisons.
This study has several limitations that should be acknowledged. Importantly, the sample size estimation for the RCT was based on a clinically relevant change in total GSRS-IBS score reported by van Megen et al. (Reference van Megen, Skodje and Lergenmuller11). It is therefore possible that the sample size of 32–36 participants in each diet group provided insufficient power to detect difference between the control and LFD group regarding the faecal outcomes assessed in this study (i.e. microbiota, SCFA and NGAL). The assumed effect size for the total GSRS-IBS score was relatively high (Cohen’s d of ∼0·7, calculated from data reported in van Megen et al. (Reference van Megen, Skodje and Lergenmuller11)), which might not be realistic for the faecal outcomes in this study. The duration of the intervention period should also be noted. In this study, we employed a 4-week FODMAP restriction period, which is commonly used in clinical practice. However, it is also important to investigate the effects of an LFD on gut microbiota and related variables for more extended FODMAP restriction periods. Additionally, it is important to note that the LFD is not recommended as a long-term diet. Instead, LFD serves as method for determining the FODMAP subtypes that a patient can tolerate through a restriction, reintroduction and personalisation phase(Reference Whelan, Martin and Staudacher79). Therefore, examining the effect of LFD on gut microbiota in all three phases, rather than solely after the restriction phase, may be equally important. Furthermore, since the RCT was not blinded, we cannot rule out the possibility that the LFD group, while anticipating improvements, would overestimate symptom improvements. Thus, our analyses for assessing associations between faecal outcomes and GI symptoms should be interpreted with caution. Lastly, it must be emphasised that the microbiota characterisation in the present study was performed by the 16S rRNA sequencing approach and thus limited to measure the effects of the LFD on bacteria and archaea. Future studies should therefore investigate the impact of LFD on other microbes that harbour the human intestine, such as fungi. Other aspects related to the gut bacteria could be of relevance, including total bacterial load (as opposed to relative abundances), secondary bile acids and gas production.
Conclusion
In conclusion, the present study demonstrates that a 4-week LFD impacts the gut microbiota to some degree in adult GFD-treated CeD patients having persistent GI symptoms. Specifically, the LFD led to changes in overall community structure of the faecal microbiota, with a possible unfavourable low faecal abundance of Anaerostipes, and low concentrations of the faecal SCFA propionic and valeric acid in participants with high concentrations of these acids at baseline. However, few uniform abundance changes of specific bacterial taxa within the LFD group were observed, indicating a highly individualised microbial response to the LFD. Nevertheless, the relatively modest effects of the LFD on the gut bacterial composition and related variables in the CeD patients of the present study are encouraging given the beneficial effects of the LFD strategy to treat functional GI symptoms.
Acknowledgments
We acknowledge Gunn Helen Malmstrøm and Jennifer T. Fiennes (Lovisenberg Diaconal Hospital) for performing the analysis of the SCFA, and Maria Fossli and Marianne Stendahl Deocareza (master students, University of Oslo) for contributing to the collection of stool samples. We are also thankful to Trude Elise Aspholm (Norwegian University of Life Sciences) for supervision during the NGAL analysis. We thank Morten Nilsen, Inga Leena Angell and Ida Ormaasen for technical support. Finally, we would like to thank all the participants in the study.
This work was supported by the Norwegian research fund for coeliac disease (S.K.B) and South-Eastern Norway Regional Health Authority (C.H.). The funding sources had no role in the design, analysis or writing of this article.
The authors’ responsibilities were as follows – A. M. H.: conducted research (microbiota laboratory analysis), analysed data and performed statistical analyses and wrote paper; F. V. M.: designed research (clinical trial administration); M. K. O. G.: conducted research (NGAL analysis); J. V.: conducted research (responsible for SCFA analysis); K. R.: provided essential materials (facilitating the microbiota analysis); G. I. S.: designed research (conceptualisation); C. H.: designed research (conceptualisation); K. E. A. L.: designed research (conceptualisation, funding acquisition); S. K. B.: designed research (conceptualisation, funding acquisition), conducted research (supervision), analysed data, wrote paper, had primary responsibility for final content and all authors: read, commented and approved the final manuscript.
There are no conflicts of interest.
This study was conducted according to the guidelines laid down in the Declaration of Helsinki, and all procedures involving human participants were approved by the Regional Committee for Medical and Health Research Ethics, South East A on 24 August 2018 (identification 25809). Written informed consent was obtained from all participants. The study was also registered at clinicaltrials.gov with the registration number NCT03678935. The manuscript was prepared according to the CONSORT statement (http://www.consort-statement.org).
Supplementary material
For supplementary material/s referred to in this article, please visit https://doi.org/10.1017/S0007114523001253


 Open access