


Introduction
Flowline models are commonly used to simulate the evolution of valley glaciers. They have been applied to many glaciers in the world to study historical changes in glacier lengths (e.g. Reference OerlemansOerlemans, 1986; Reference Huybrechts, de Nooze, Decleir and OerlemansHuybrechts and others, 1989; Reference GreuellGreuell, 1992), the response of glaciers to climate forcing (e.g. Reference KrussKruss, 1984; Reference OerlemansOerlemans, 1997) and the behaviour of a surge-type glacier (Reference BindschadlerBindschadler, 1982). Because flowline models are essentially one-dimensional, they can be applied to glaciers for which relatively little is known. Information about bedrock and surface elevations along the central flowline, in addition to the ice-flow speed and mass balance, is sufficient to model the evolution of a glacier.
Because of their simplicity, however, flowline models tend to neglect important details of glacier dynamics and mass balance. With respect to the dynamics, the ice flux is determined only from the center-line ice thickness and surface slope along the flowline. Therefore, the effect of valley shape on the variations in flow speed across the glacier and the influence of converging or diverging flow on the evolution of the ice thickness are not considered appropriately. To incorporate such effects into the computation, flowband models have been developed and used for valley glaciers (e.g. Reference BindschadlerBindschadler, 1982; Reference Wallinga and van de WalWallinga and Van de Wal, 1998; Reference Fountain, Neumann, Glenn and ChinnFountain and others, 2004). In these models, the cross-sectional geometry is parameterized as a simple shape (e.g. trapezoid, semi-ellipse or parabola), and the ice flux through the cross-section is evaluated using an appropriate shape factor (Reference NyeNye, 1965). Glacier cross-sections are often too complex to be represented as a simple shape, and the shape factor is very sensitive to the geometrical factor used for the parameterization when the glacier is deep and narrow, as is the case with many valley glaciers. Therefore, the accurate evaluation of the ice flux in flowband models has proved to be difficult, and it is one of the key issues to consider if reliable results are to be obtained. A possible solution is to use a three-dimensional (3-D) time-dependent ice-flow model (Reference Albrecht, Jansson and BlatterAlbrecht and others, 2000; Reference Schneeberger, Albrecht, Blatter, Wild and HockSchneeberger and others, 2001). Because such 3-D modelling requires a large amount of field data and computation time, it is also important to keep the model as simple as possible for it to be a useful tool.
This paper proposes a new flowline model, which better includes valley shape effects in the computation of the ice flux. This study was motivated by new datasets obtained for Rhonegletscher, Switzerland. The bedrock geometry was measured by an ice radar, digital elevation models (DEMs) were constructed from maps from 1878 and old aerial photographs (Reference Bauder, Funk and HussBauder and others, 2007), the equilibrium-line altitude (ELA) was reconstructed from temperature and precipitation records in the region (Reference ZahnoZahno, 2004), and the measurement of ice-flow speed by Reference MercantonMercanton (1916) was reanalyzed. Although flowline models have been applied to this glacier to simulate the historical front variations and to study the sensitivity to climate change (Reference Stroeven, van de Wal, Oerlemans and OerlemansStroeven and others, 1989; Reference Wallinga and van de WalWallinga and Van de Wal, 1998), the bedrock geometry used in these studies differs significantly from that obtained by the ice-radar measurement. This work therefore uses the newly obtained basal topography. Because our first attempt at flowband modelling with a trapezoidal parameterization failed to reproduce the observed surface elevation changes (Reference ZahnoZahno, 2004), the treatment of ice dynamics was improved by using a two-dimensional (2-D) ice-flow model tuned with the measured flow rate. Instead of using a shape factor, the ice flux was calculated by integrating the flow-speed field computed by a 2-D ice-flow model applied to the glacier cross-section. The cross-section at a gridpoint was determined by the bedrock elevation data. The reliable computation of the ice flux eliminated unknown parameters in the ice dynamics and enabled us to tune the mass-balance gradients to reproduce the glacier changes of the past. In this paper, we describe an improved flowline model and show the results of its application to Rhonegletscher.
Model
Flowline models solve the one-dimensional continuity equation
where h is the ice thickness, ḃ the mass-balance rate, F the vertically integrated flux per unit width and x the coordinate along the flowline (Fig. 1). To include the 2-D effects in the model, Equation (1) is integrated over the glacier cross-section:

Fig. 1. A sketch of the model geometry. The dotted line is an actual glacier surface, and the shaded area is the modelled glacier cross-section.
The cross-sectional area, glacier width and flow velocity component perpendicular to the cross-section are denoted by a, w and u, respectively. The y and z axes are considered to be along the transverse and vertical directions in the cross-section (Fig. 1). The volume of ice flux, Q, through the cross-section, a, is computed using a 2-D ice-flow model. The flow model calculates the horizontal flow-speed field within the cross-section by solving the equations for balance of shear stresses and Glen’s flow law (Reference NyeNye, 1965):
where τ
ij
and ![]() are the shear stress and strain rate, ρ the ice density, g the gravitational acceleration, S the surface elevation, A the rate factor and τ
e the effective stress. The basal flow speed u
b is introduced as a linear function of the basal shear stress τb
:
are the shear stress and strain rate, ρ the ice density, g the gravitational acceleration, S the surface elevation, A the rate factor and τ
e the effective stress. The basal flow speed u
b is introduced as a linear function of the basal shear stress τb
:
To solve Equation (4), the stresses on the lefthand side were substituted by u using Equation (5) and the relationships ![]() and
and ![]() . The differential equation obtained was solved for u within the glacier cross-section by the finite-difference method. Equation (6) was used as the basal boundary condition, and the stress-free condition was imposed at the glacier surface. Starting from the solution of a linearly viscous flow, new effective stress and basal flow-speed distributions were calculated from the previously determined flow-speed field, and the calculations were repeated until the flow speed converged within 10-5 ma–1.
. The differential equation obtained was solved for u within the glacier cross-section by the finite-difference method. Equation (6) was used as the basal boundary condition, and the stress-free condition was imposed at the glacier surface. Starting from the solution of a linearly viscous flow, new effective stress and basal flow-speed distributions were calculated from the previously determined flow-speed field, and the calculations were repeated until the flow speed converged within 10-5 ma–1.
By coupling the ice-flow model with Equation (2), the evolution of the glacier surface along the flowline is determined as follows. Given a 2-D bedrock map, the shape of the glacier cross-section is known from the surface elevation at a gridpoint. The ice flux Q is obtained by integrating the flow-speed field computed for the cross-section with the 2-D flow model. The surface elevation and down-glacier slope are assumed to be constant across the glacier. With a mass balance given as a linear function of the surface elevation, Equation (2) is solved for da with a finite time-step dt and a grid length dx. The change in the cross-sectional area is then converted to a surface elevation change depending on the valley shape.
Model Application
Rhonegletscher
The proposed model was applied to Rhonegletscher, a 10 km long valley glacier in the Swiss Alps (Fig. 2). The historical changes of this glacier have been well documented since the 17th century by paintings, photographs, maps and DEMs. For this study, DEMs of past glacier geometries were obtained on a 25 m mesh by digitizing maps constructed during the periods 1874–82 (Reference MercantonMercanton, 1916) and 1928–30 (Reference JostJost, 1936) and by the photogrammetric analysis of aerial photographs taken in 1959, 1980, 1991 and 2000 (Reference ZahnoZahno, 2004; Reference Bauder, Funk and HussBauder and others, 2007). The bedrock map shown in Figure 2a was constructed from a 2003 ice-radar survey (Reference ZahnoZahno, 2004). We defined the flowline to be along the valley bottom (Fig. 2a), taking the x axis from the up-glacier end of the study region. A comparison of the surface elevations for 1878 and 2000 along the flowline (Fig. 3) showed that the glacier retreated by 1700m and decreased in thickness by >50m at the current terminus. The surface flow speed was measured during the period 1874–1910 by tracking stones distributed on the glacier (Reference MercantonMercanton, 1916). Six flow-speed profiles across the glacier were generated from these measurements and were used for the calibration of the 2-D flow model. The annual mass-balance data were available only for the periods 1874–75, 1885–1910 (Mer-canton, 1916) and 1980–82 (Reference Chen and FunkChen and Funk, 1990). The ELAs determined from these measurements were used to reconstruct the ELA history for the region.

Fig. 2. Contour maps of Rhonegletscher showing (a) the glacier bed topography and (b) the surface topography observed in 1878. The contour intervals are 100m and the coordinates correspond to the official Swiss coordinate system. The flowline used in this study is indicated in (a) with the gridpoints located every 1 km. The locations of the cross-profiles used for the flow model calibration are indicated with the double circles.

Fig. 3. (a) The surface elevation of Rhonegletscher observed in 1878, 1929, 1980 and 2000. It decreased steadily from 1878 to 2000. (b) The surface-elevation changes since 1878.
Ice dynamics
First, the parameters of the 2-D flow model were determined for Rhonegletscher. In Glen’s flow law (Equation (5)), a rate factor of A = 75 MPa–3 a-1 (determined for nearby Unteraargletscher (Reference GudmundssonGudmundsson, 1999)) was used, and the exponent n = 3 was assumed. The linear coefficient c(y) in the basal flow law (Equation (6)) was calibrated at six gridpoints, x = 3, 5, 8, 9, 10 and 11 km (double circles in Fig. 2a), where the measured flow-speed profiles were available, so that the computed surface speed profiles reproduced the measured flow speeds (Fig. 4). The surface elevation in 1878 was used for this calibration. The cross-section was discretized with a 20 × 20 mesh using the coordinate transformation described by Reference BlatterBlatter (1995). Matching of the computed and measured surface flow speeds was achieved by adjusting c(y) at the basal gridpoints through trial and error. The six sets of calibrated coefficients were interpolated along the x direction assuming that the basal flow speed was zero at the upstream margin of the glacier and c(x, y) was constant below the flux gate at x = 11 km. Although c(x, y) was assumed to be temporally invariant, the effect of the changing glacier geometry on the basal flow speed was taken into account by the stress-dependent basal flow law (Equation (6)).

Fig. 4. (a–f) The ice-flow speed measured and computed for the cross-sections at 3, 5, 8, 9, 10 and 11 km from the glacier top. The upper part of each panel shows the measured surface flow speeds (Reference MercantonMercanton, 1916) (open circles), computed surface flow-speed (thick line) and basal flow-speed (thin line) profiles. The lower part of each panel shows the computed horizontal flow-speed fields. The contour intervals are 10 (a–d), 20 (e) and 2 maf1 (f).
Second, the calibrated flow model was used to calculate the volume ice flux Q at gridpoints located at intervals of 1 km as a function of the ice thickness and surface slope. At x = 6 km, for example, Q(h,∂S/∂x) was obtained as in Figure 5b by repeating the flow model computation with the cross-sectional bedrock geometry in Figure 5a. The computed ice flux was interpolated to the intermediate gridpoints so that the flowline model could obtain Q for every time-step using the thickness and slope at the gridpoints. The relationship between the central ice thickness and the cross-sectional area (Fig. 5c) was used to convert the areal change to a thickness change.

Fig. 5. (a) The cross-sectional geometry of the bedrock at 6 km from the glacier top (thick line). The observed (dashed line) and modelled (solid line) surface profiles for 1878 are indicated. (b) The ice flux through the cross-section (m3 a-1) as a function of the ice thickness and surface slope. (c) The cross-sectional area of the glacier as a function of the ice thickness at the gridpoint.
Mass balance
The mass balance was provided as a linear function of the surface elevation S:
The ELA E was reconstructed for the period 1878–2003 from the temperature and precipitation records measured at nearby meteorological stations. We used the mean values of two stations at Andermatt (15km from Rhonegletscher; 1448ma.s.l.) and Reckingen (9km from Rhonegletscher; 1332ma.s.l.) for this purpose. The available mass-balance observations (Reference MercantonMercanton, 1916; Reference Chen and FunkChen and Funk, 1990) were utilized to correlate E (m) to the summer temperature (June–August) T s (˚C) and the annual precipitation P (mma-1) by multiple regression (Fig. 6). The best-fit relationship was given by:

Fig. 6. The summer temperature (June–August) (a) and annual precipitation (b) measured at Andermatt and Reckingen; and (c) the ELA reconstructed by Equation (8) (thin line) and observed by Reference MercantonMercanton (1916) and Reference Chen and FunkChen and Funk (1990) (asterisks). The bold lines are 5 year running means.
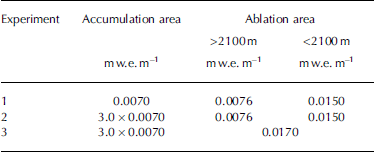
We start the modelling with the mass-balance gradients (∂b/∂z) reported by Reference Chen and FunkChen and Funk (1990) and Reference Wallinga and van de WalWallinga and Van de Wal (1998), and we then tune the balance gradients to reproduce the observed glacier changes of the past as discussed below. The sets of mass-balance gradients used in this study are summarized in Table 1.
Table 1. The sets of mass-balance gradients used in this study
Results and Discussion
Using the surface elevation observed in 1878 for the initial geometry, the glacier evolution was computed by solving Equation (2) with a time-step of 0.01 year and a grid size of 100 m. A time-step of 0.1 day was used only for the first 1000 steps to obtain a smooth surface. The surface elevation change over 125 years was simulated with the reconstructed ELA history, and the results were compared with the observations.
The first result obtained with the previously reported mass-balance gradients (Reference Chen and FunkChen and Funk, 1990; Reference Wallinga and van de WalWallinga and Van deWal, 1998) (experiment 1 in Table 1) showed too much thinning in the upper part of the glacier after 125 years (experiment 1 in Fig. 7), suggesting an underestimation of the snow accumulation. This was probably because the large catchment area was not incorporated in the flowline model. In the model, the glacier width was evaluated by using the surface elevation at the flowline, assuming a flat surface across the glacier (Fig. 1 and 5a). Because the surface is concave in the upper part of Rhonegletscher, marginal regions lying at higher elevations were not included and thus the accumulation was underestimated. The hypsometric curves of the modelled geometry differed significantly in the accumulation area from those obtained from the DEMs (Fig. 8). Taking the linear mass-balance gradient into account, the accumulation was underestimated by a factor of 3.0. This does not mean the surface area was underestimated by a factor of 3.0. The substantial discrepancy was due to the neglect of regions lying at very high elevations, where the accumulation is large. This is likely to be a general problem of flowline models arising from their one-dimensional nature.

Fig. 7. The surface elevation of Rhonegletscher observed in and computed for 2000 with the sets of mass-balance gradients in Table 1.

Fig. 8. Hypsometric curves constructed from the map for 1878 and the DEM for 2000 (solid line) and from the model (dashed line).
The correction of this problem is not simple, because it is unclear to which cross-section the neglected surface area belongs. Although the central surface elevation could be corrected by the elevation across the glacier, the redistribution of snowfall from steep side-walls to regions with a lower elevation by snowdrifts and avalanches makes the mass-balance regime complex. These processes are difficult to evaluate because mass-balance data are sparse in the upper part of Rhonegletscher. It is necessary to measure the spatial accumulation pattern in the upper part of the glacier to accurately include the effects of cross-sectional topography in the model. As a reasonable approximation, however, we increased the mass balance in the accumulation area at a uniform rate by multiplying a factor of 3.0 to the mass-balance equation (Equation (7)). This is equivalent to increasing the mass-balance gradient in the accumulation area by a factor of 3.0 (experiment 2 in Table 1). This simple procedure corrected the total accumulation by accounting for the fact that more accumulation was neglected in the higher altitude. It should be stressed that this factor was determined for Rhonegletscher based on the analysis in Figure 8 and thus it may not be readily adopted for other glaciers.
With this correction, the model results showed reasonable agreement with observations in the accumulation area, but failed to reproduce the observed terminus retreat (experiment 2 in Fig. 7). Finally, we adjusted the mass-balance gradient in the ablation area so that the modelled surface evolution (Fig. 9a and b) became similar to observations (Fig. 3a and b). The computed surface-elevation changes matched well with the observations in 1980 and 2000 except near the glacier top (0 < x < 2 km) where the ice thickness was influenced by the mass-balance correction. The observed length changes were well reproduced by the modelling results (Fig. 9c). The modelled ice volume was about 10% smaller than the observation at the beginning of the simulation (Fig. 9d) because the model neglected the marginal regions in the accumulation area. This discrepancy became smaller after 1929 as the result of the thickening near the top, and slight overestimation of thickness in other parts of the glacier. Comparison of the observed and modelled geometries in 1929, 1980 and 2000 showed that the volume was overestimated by 3.1–7.5% in the region x > 2 km. The thickening at 6 < x < 9:5 km in 1929 (Fig. 9b) might be related to the steep bed slope below the point x = 9:5 km. The longitudinal stress coupling, which was not incorporated in the model, may play a significant role in this region. It is also possible that the mass-balance regime used for this study was too simple. Two different mass-balance gradients in the ablation area and their temporal changes, as suggested by Reference Wallinga and van de WalWallinga and Van de Wal (1998), might improve the match to observations. However, it is difficult to find an observational basis for the further adjustment because mass-balance data are available only for limited periods and the data do not cover the entire glacier.

Fig. 9. (a) The surface elevation observed in 1878, and that computed for 1929, 1980 and 2000 with the tuned mass-balance gradient set (experiment 3 in Table 1). (b) The computed surface elevation changes since 1878. (c, d) The observed and computed changes in the glacier length (c) and ice volume (d).
The future evolution of Rhonegletscher is studied by assuming three constant mass-balance conditions: the mean for the period 1994–2003 and the most negative (2003) and most positive (1978) mass-balance values in the past 50 years (Fig. 10a). Although the latter two scenarios are unlikely to happen, they are used to assess the extreme limits of the glacier shape after 50 years. They are also useful to test the stability of the model under extreme conditions. The computed changes in length after 50 years are –600 and –2600m for the 1994–2003 mean and 2003 mass balance, while a 1500m increase is expected for the 1978 mass balance (Fig. 10b). The model predicts –18%, –58% and +38% volume changes for the three mass-balance conditions, respectively (Fig. 10c). With the modest scenario, the glacier does not reach a steady state after 50 years, suggesting a longer response time to current climate conditions. An interesting consequence of further glacier retreat is the formation of a proglacial lake due to the exposure of the overdeepening near the current terminus position.

Fig. 10. (a) ELA reconstructed for the past and assumed for the future. (b) The surface elevation and (c) ice volume computed for the future.
Conclusion
We proposed and tested a new flowline model that utilizes the cross-sectional geometry in the computation of the ice flux through the cross-section at each gridpoint. The aim of the new model was to take into account the influence of valley shape on ice dynamics accurately. We applied the model to Rhonegletscher, for which a bedrock map and several DEMs of the surface have been reconstructed recently and data on the surface flow speed are available. The first result suggested that the snow accumulation was underestimated because the flowline model neglected the marginal regions of the glacier in the accumulation area. This problem is likely to be a general weakness of one-dimensional glacier models. After the correction of the mass balance, the model reproduced the observed changes in the terminus position and the total ice volume within the error range of 15%. These results suggest that the proposed model has the potential to simulate glacier evolution accurately when adequate mass-balance data are provided. It should also be noted that the reliable computation of the ice flux reduces the number of unknown parameters, which have been used as tuning parameters in earlier flowline models.
A possible future improvement of the model is more accurate treatment of the neglected accumulation in the marginal part of the glacier. Taking into account an uneven surface elevation across the glacier may improve the performance, although it spoils the model’s simplicity and requires a detailed mass-balance model. For the reliable modelling of Rhonegletscher, it is important to know the actual mass-balance and ice-flow conditions. New field data are required to obtain accurate mass-balance gradients, the coefficients for the ELA in Equation (8) and the basal flow coefficient c.
Acknowledgements
We thank the members of the 2003 ice radar campaign from VAW, ETH Zürich, at Rhonegletscher. The manuscript was substantially improved by insightful comments and helpful suggestions from S. Marshall and J. Kavanaugh. We are also grateful to M. Sharp, the Scientific Editor of this paper. This research was partially supported by the Japanese Ministry of Education, Science, Sports and Culture, Grant-in-Aid for Young Scientists (Start-up), 18840002, 2006–2007.


