

Voluntary feed intake (FI) in fish, as in other animals, is controlled by a complex combination of nutritional, physiological and environmental factors(Reference Fletcher1). It has frequently been suggested that FI is controlled to maintain a relatively constant digestible energy (DE) intake, i.e. to meet the DE requirements(Reference Boujard and Médale2–Reference Lekva, Hansen and Rosenlund6). However, a few studies in fish have suggested the involvement of other nutritional factors in the control of FI(Reference Geurden, Gondouin and Rimbach7, Reference Tran-Duy, Smit and van Dam8). Studies that verify the importance of other well-known regulatory mechanisms of FI in mammals, such as glucostatic(Reference Mayer9) or lipostatic control(Reference Kennedy10), either lead to an ambiguous conclusion or show a lesser impact in fish(Reference Geurden, Gondouin and Rimbach7, Reference Bellamy11) than in terrestrial animals. The effect of non-protein energy (NPE) source (fat and starch) on FI in fish is unclear(Reference Grisdale-Helland, Shearer and Gatlin12) and has not been systematically assessed at least at a similar digestible protein (DP):DE ratio and DE content of diets.
Among the abiotic factors, dissolved oxygen (DO), pH and NH3 are recognised to affect FI in fish(Reference Kestemont and Baras13). The effect of the availability of oxygen on FI has been relatively well documented. Several studies have demonstrated that FI in fish decreases linearly with declining water DO content(Reference Buentello, Gatlin and Nei14–Reference Glencross17). The minimum DO level at which metabolic oxygen demand in fish limits FI is termed as incipient DO (iDO). Thus, below the iDO, FI depends on the DO concentration of water, whereas above the iDO, FI is independent of water DO concentration. Recent studies in Nile tilapia(Reference Tran-Duy, Smit and van Dam8) and rainbow trout (S. Saravanan et al., unpublished results) under non-limiting DO showed differences in DE intake, when fish were fed to satiation with diets differing in NPE source (starch v. fat). In addition, total heat production (considered theoretically as oxygen consumption) was found to be similar despite their difference in DE intake and retained energy (RE). These data suggest that the difference in FI between the dietary groups might be caused by limitations in maximum oxygen uptake or by metabolic oxygen demand as induced by nutrient processing. Since the amount of oxygen required to metabolise dietary macronutrients depends on whether they are used for growth (protein, fat or glycogen) or the production of ATP(Reference Mc Cue18, Reference Secor19), feeding diets with different macronutrient compositions results in different levels of metabolic or dietary oxygen demand (DOD), being defined here as the amount of oxygen (in mg) consumed per unit of DE (kJ DE) intake. In terrestrial vertebrates, evidence on the role of oxygen as a regulatory factor in the control of FI has been studied at various levels such as oxygen efficiency of the whole animal(Reference Ketelaars and Tolkamp20, Reference Ketelaars and Tolkamp21) or oxidative metabolism in the liver(Reference Friedman22) or hypothalamus(Reference Coppola, Liu and Andrews23), whereas the link between oxygen use and voluntary FI has not been considered in fish nutrition.
It has been postulated that, at non-limiting water DO conditions, FI in fish may be limited by the maximal physiological capacity of oxygen use (for growth and maintenance). In order to verify this hypothesis, voluntary FI and oxygen consumption were monitored in Nile tilapia fed diets with contrasting macronutrient composition at non-limiting water DO conditions. The objective of the present study is to verify the existence of an ‘oxystatic control of FI in fish’, i.e. intakes of diets with different oxygen demands are controlled by a physiological limit in metabolic oxygen use. If the hypothesis holds true, then fish will adjust intakes according to differences in DOD.
Experimental methods
All procedures involving animals were carried out in accordance with the Dutch law on experimental animals and were approved by the Wageningen University Animal Experimental Committee.
Diets
For the experiment, four iso-energetic diets were formulated according to a 2 × 2 factorial design to create contrasts in DOD between diets (Table 1). The first factor was the DP:DE ratio, which was changed by modifying the dietary protein levels, ‘low DP:DE ratio’ (LP diets) v. ‘high DP:DE ratio’ (HP diets). It is assumed that fish fed diets with the low DP:DE ratio will have minimal use of protein as energy source, whereas at the high DP:DE ratio, a substantial amount of protein will be used as energy source(Reference LeGrow and Beamish24). Thus, the contrast in the DP:DE ratio between diets will cause a difference in the protein:fat deposition ratio in fish(Reference Lee and Putnam5), and thereby generate a difference in DOD. The different DP:DE ratios (HP diets, 25 mg/kJ; LP diets, 14 mg/kJ) were created by exchanging an equal proportion (30 %) of protein ingredient mixture (fishmeal, wheat gluten, soya protein concentrate, pea protein concentrate and dl-methionine) by an equivalent amount of energy ingredient mixture (rapeseed oil, fish oil and gelatinised maize starch).
Formulation, ingredient composition and analysed nutrient content of the experimental diets

HPF, high digestible protein (DP):digestible energy (DE) ratio diet with fat as non-protein energy (NPE) source; HPS, high DP:DE ratio diet with starch as NPE source; LPF, low DP:DE ratio diet with fat as NPE source; LPS, low DP:DE ratio diet with starch as NPE source.
* Gelatinised maize starch (Merigel®100; Amylum Group).
† Fishmeal (999 LT Fish Meal – crude protein 72 %; Triple Nine Fish protein).
‡ Fish oil (999 Fish Oil; Triple Nine Fish protein).
§ Diamol (acid-insoluble ash, as inert marker for digestibility measurement) – Diamol GM; Franz Bertram.
¶ Mineral premix composition (to supply, mg/kg feed): 50, Fe (as FeSO4.7H2O); 30, Zn (as ZnSO4.7H2O); 0·1, Co (as CoSO4.7H2O); 10, Cu (as CuSO4.5H2O); 0·5, Se (as Na2SeO3); 20, Mn (as MnSO4.4H2O); 500, Mg (as MgSO4.7H2O); 1, chromium (as CrCl3.6H2O); 2, I (as CaIO3.6H2O). Vitamin premix composition (to supply, mg/kg feed): 10, thiamin; 10, riboflavin; 20, niacin; 40, pantothenic acid; 10, pyridoxine; 0·2, biotin; 2, folic acid; 0·015, cyanocobalamin; 1500, choline (as choline chloride); 100, ascorbyl phosphate; 3, retinyl acetate, 4·8, cholecalciferol (Rovimix® D3-500; DSM, Inc.); 100 I, α-tocopheryl acetate; 10, menadione (as menadione sodium bisulfite, 51 %); 400, inositol; 100, antioxidant BHT (E 321); 1000, calcium propionate.
∥ Calculated as follows: total carbohydrates (starch, free sugars and NSP) = 1000 − (crude protein+crude fat+ash).
** Gross energy value measured including energy from added cellulose; values within parentheses represent energy value calculated excluding energy from added cellulose (15 %).
The second factor was the type of NPE source: ‘starch’ v. ‘fat’. The oxygen demand of dietary starch and fat depends on whether it is used for ATP production through oxidation or deposited as an energy store (fat) in the body. The amount of oxygen required to deposit fat from dietary fat is lower than that required for lipogenesis from starch(Reference Blaxter25, Reference Reeds, Wahle and Haggarty26). Therefore, diets were formulated to contain either starch (diets HPS and LPS) or fat (diets HPF and LPF) as the major NPE source at both dietary DP:DE ratios. For the fat diets, 10 % of rapeseed oil was added as the NPE source, whereas for the starch diets, it was exchanged by 25 % of gelatinised maize starch, assuming a similar DE content of 10 % rapeseed oil to that of 25 % gelatinised maize starch. Furthermore, in order to have identical nutrient and energy density between these diets, 15 % of cellulose was included in the fat diets. The final ingredient compositions of the diets are shown in Table 1. Diets were produced by Research Diet Services. The ingredient mixture of each diet, excluding the major part of the oils, were mixed and hammer-milled (Condux LHM20/16; Hanau) through a 1 mm screen. The diets were processed by extrusion using a Clextral BC45 laboratory-scale twin-screw extruder (Clextral) with a 3 mm die, resulting in a pellet size of about 3 mm. In the HPS and LPS diets, all oils were added to the mixture before extrusion. In the HPF diet, 6 % of the oils and in the LPF diet, 9·1 % of the oils were added to the mixture before extrusion. Following extrusion, pellets were dried in a tray dryer at 70°C for 3 h and cooled to ambient temperature. Finally, the HPF and LPF diets were coated with the remaining part of the oils (5 and 10 %, respectively) and stored at 4°C.
Fish stock and pre-experimental rearing conditions
A stock of 300 juvenile (mean body weight 5 g) male Nile tilapia (NMT Manzala Silver strain) was obtained from a commercial fish breeder (Til Aqua International) and reared at the experimental facilities (‘De Haar Vissen’) of the Wageningen University, The Netherlands. Fish were housed in six tanks (120 litres) at a stocking density of fifty fish per tank. These tanks were connected to a common water recirculation unit comprising a trickling filter, a settling tank and a pump. Initially, fish were fed with a commercial starter feed (1·0 mm, 57 % crude protein, 15 % crude fat, Skretting, F-10; MP Pro Aqua Brut) for about 6 weeks and thereafter with larger feed pellets (2·5 mm, 47 % crude protein, 14 % crude fat, Skretting, F-1P Classic) until fish reached a body weight of 40 g. During this pre-experimental period (10 weeks), fish were hand-fed twice daily with a ration of about 10 g/kg0·8 per d. Fish were kept at optimal rearing conditions (water flow rate in tank, 6 litres/min; temperature, 28°C; DO, >5 mg/l; photoperiod, 12 h light–12 h dark).
Housing facility
The 48-d feeding trial was carried out in the Aquatic Metabolic Unit of Aquaculture and Fisheries group, Wageningen University, The Netherlands. This metabolic unit consists of twelve metabolic tanks (90 × 60 × 45 cm) in a series connected to a common water recirculation system consisting of a trickling filter, an oxygenation unit, a sump, a drum filter (Hydrotech 500®) and a cooling/heating system for maintaining uniform water quality throughout the study. Water was supplied to all tanks from a common inlet, thus ensuring identical water quality and drained through individual tank outlets into the system. The oxygenation unit maintained the concentration of DO in water by injecting pure oxygen into the common inlet, which was regulated by a mass flow controller (Brooks® Model 5850S; Brooks Instruments) and a microprocessor (Brooks® Read Out and Control Electronics Model 0154; Brooks Instruments). Each metabolic tank was equipped with a water flow meter (MAGFLOW® MAG 5000; Danfoss A/S) to regulate and monitor water flow. The volume of water within the tanks was kept identical (200 litres) by adjusting the standpipe. The water surface of each tank was covered with a water-resistant floating panel to prevent gas exchange between water and air. Within the floating panel, a circular feeding hatch (18·5 cm in diameter) with a removable floating lid was used to feed the fish. The inlet and outlet of each metabolic tank were linked to two separate sampling pipelines. One sampling pipe led to an auto-analyser (SANplusSYSTEM; Skalar) to continuously measure nitrite, nitrate, total-NH3-N, urea and CO2. The other sampling pipe led to a common measuring hub to continuously measure DO (WTW-Trioximatic® 700 IQ; WTW GmbH), pH (WTW-SensoLyt DW® (SEA) 700 IQ; WTW GmbH) and conductivity (WTW TetraCon325® 700 IQ; WTW GmbH) of water. The oxygen measurements from each metabolic tank were regulated by an electromagnetic valve (ASCO model 24/50 6 WFT; ASCO/Joucomatic), which controlled the water flow from the inlet and outlet of each tank to the common measuring hub. These electromagnetic valves were controlled by an algorithmic program via a user interface (HTBasic, version 9.5; TransEra Corporation), and the measured values of DO, water flow, pH and conductivity were automatically recorded in a personal computer.
In addition, the outlet of each tank was connected to a swirl separator (44 cm in height, 24·5 cm in diameter; AquaOptima AS) to collect faeces for the determination of nutrient digestibility. The faeces were collected in a detachable 250 ml bottle at the bottom of the swirl separator. To minimise the bacterial decomposition of faeces, the bottle was kept under ice. During feeding, another set of bottles were used in the swirl separator to collect the uneaten feed pellets flushed out from the tanks.
Experimental procedure
At the start of the experiment, 240 fish (mean body weight 40 g) from the stocking tanks (unfed for about 36 h) were taken out, anaesthetised (0·2 g tricaine methane sulfonate/l (MS-222, Finquel®; Argent Chemical Laboratories) with 0·4 g sodium bicarbonate/l as buffer), weighed individually and randomly distributed among the twelve metabolic tanks (twenty fish per tank). The respective diets were assigned randomly to triplicate tanks. Then, twenty fish were killed with an excess dose of anaesthesia (0·8 g tricaine methane sulfonate/l with 1·6 g sodium bicarbonate/l as buffer) for initial body composition, kept in plastic bags, sealed and stored at − 20°C until further analysis.
During the experimental period (48 d), fish were hand-fed with their respective diets twice daily to apparent satiation for an hour (09.00–10.00 and 16.00–17.00 hours). At the end of each feeding session, the uneaten pellets were collected and counted to determine FI accurately. Feed fed and uneaten feed were recorded for each feeding. From the second week of the trial, 30 min before each feeding, faeces were collected from the swirl separator and transferred to aluminium trays and stored at − 20°C until further analysis. A representative sample (50 g) of each diet was collected twice weekly and stored at 4°C.
Fish were kept under optimal water quality parameters during the entire study period with photoperiod (12 h light–12 h dark), temperature (27·7 ± 0·29°C), pH (6·8 (sd 0·11)), DO at tank inlet (8·8 (sd 0·75) mg/l) and outlet (5·6 (sd 0·58) mg/l), conductivity (2821 (sd 99) μS/cm), nitrite (0·02 (sd 0·01) mg N/l), nitrate (85 (sd 0·5) mg N/l) and total-NH3-N (0·12 (sd 0·06) mg N/l). After 20 d from the start of the experiment, as the DO level in tank outlets dropped below 5 mg/l, especially during postprandial hours, pure oxygen was injected into the common inlet until the end of the experiment, in order to ensure sufficient DO availability to the fish.
The volume of water and water flow were kept constant at 200 litres and 7 litres/min, respectively, in all tanks. Thus, the rate of replenishment (volume of water/water flow) of the entire tank water is achieved in about 30 min. The water was sampled for a duration of 5 min from the common inlet and outlet of each tank and flushed over the oxygen electrode for measuring oxygen concentration. Thus, within an hour, oxygen was measured twice in the common inlet and outlet of four tanks. Oxygen measurements were performed in a continuous cycle of 2 d (48 h; from 08.00 to 08.00 hours) in a set of four tanks consisting of all dietary treatments. Consequently, in 6 d, oxygen measurement was undertaken in all twelve tanks. This procedure was repeated until the end of the experiment resulting in five cycles of 48 h oxygen measurements for each tank. The oxygen electrode was calibrated once every week.
At the end of the experiment, fish were starved for about 36 h before handling. Fish from each tank were anaesthetised and weighed individually for the final body weight. From each tank, eight fish were randomly sampled for the analysis of the final body composition and handled in a similar way as the initial body composition samples.
Analytical procedure
Frozen fish samples were homogenised twice through a 4·5 mm die in a meat mincer (Gastromaschinen, GmbH model TW-R 70; Feuma) and subsamples were taken immediately for DM and protein analysis. The rest of the homogenised fish samples and faeces (pooled per tank) were then freeze-dried and finely ground using a blender. Before fat analysis, feed and faecal samples were hydrolysed by boiling for 1 h with 3 M-HCl. The proximate composition of feed, fish carcass and faeces was analysed in triplicate for DM, protein (Kjeldahl method), fat (Soxhlet method), ash, acid-insoluble ash, energy (bomb calorimeter) as described elsewhere(Reference Santos, Schrama and Mamauag27). Starch content was determined as glucose, using the amyloglucosidase/hexokinase/glucose-6-phosphate dehydrogenase method after ethanol (40 %) extraction and starch decomposition in dimethylsulfoxide/HCl(28).
Calculations
Weight-gain rate of fish (g/d) was calculated as the difference between the average individual final (W f) and initial (W i) body weight of fish per tank divided by the duration of the experimental period (t). The geometric mean body weight (W G; in g) was calculated as √(W i × W f). Growth rate of metabolic body weight (in g/kg0·8 per d) was calculated as (W f − W i)/(MBWG × t), where MBWG is the mean metabolic body weight of fish (in kg0·8), which was calculated as (W G/1000)0·8 and t, the duration (days) of the growth study. The lean body growth of fish (in g/d) was calculated as the difference between (W f − W f − fat) and (W i − W i − fat) divided by (t), where W f − fat and W i-fat are the crude fat content of the final and initial fish carcass, respectively, expressed on a fresh weight basis. Daily growth coefficient (in %/d) was calculated as 100 × (W f1/3 − W i1/3)/t.
Daily absolute FI (FIABS; g DM/fish per d) was calculated on a DM basis as FItot/(n × t), where FItot is the total FI per tank (in g DM) over the experimental period corrected for dead fish and uneaten pellets, n is the number of fish per tank, and t is the experimental period. FI as-fed (g/fish per d) was calculated in a similar way as FIABS but on an as-fed basis. FI of fish expressed as a percentage of body weight (g DM/100 g fish per d) was calculated as (FIABS/W G) × 100 and FI per metabolic body weight (FIMBW; g DM/kg0·8 per d) was calculated as FIABS/MBWG. The feed:gain ratio (FGR; DM intake/wet-weight gain) was calculated as FIMBW/MBWG.
Apparent digestibility coefficient (ADC; in %) of DM, protein, fat, total carbohydrate, gross energy and ash was calculated for each tank according to Tran-Duy et al. (Reference Tran-Duy, Smit and van Dam8), using acid-insoluble ash as an inert marker. Digestible nutrient intake (g or kJ/kg0·8 per d) was calculated as FIMBW × FeedZ × (ADCZ/100), where FeedZ is the nutrient content in feed on a DM basis (in g), ADCZ is the apparent digestibility of nutrients (in %) and Z represents DM, protein, fat, total carbohydrate, energy and ash.
The parameters of N balance, fat balance and energy balance were calculated per tank and expressed in mg N/kg0·7 per d, mg/kg0·9 per d and kJ/kg0·8 per d, respectively. The gross N intake (GN) was calculated as the product of total FI (g DM/kg0·7 per d) and N content of feed (mg/g). The digestible N intake (DN) was calculated as the product of GN and ADC of N (%). Faecal N loss (FN) was calculated as the difference between GN and DN. The retained N (RN) was calculated as the difference between the N content of the final and initial fish carcass. Branchial and urinary N loss (BUN) was calculated as the difference between DN and RN. Parameters of the fat balance were calculated as follows: gross fat intake (GF) was calculated as the product of total FI (g DM/kg0·9 per d) and the fat content of feed (mg/g). The digestible fat intake (DF) was calculated as the product of GF and ADC of fat (%). Faecal fat loss (FF) was calculated as the difference between GF and DF. The retained fat (RF) was calculated as the difference between the fat content of the final and initial fish carcass. Parameters of the energy balance were calculated as follows: gross energy intake (GE) as the product of FI (g DM/kg0·8 per d) and the energy content of the diet; DE intake as the product of GE and ADC of energy; branchial and urinary energy loss as the product of NH3-N and urea-N with their corresponding energy value of 24·9 and 22·5 kJ/g N(Reference Bureau, Kaushik and Cho29). NH3-N and urea-N were calculated from BUN based on the measured averaged ratio NH3-N:urea-N excretion of 9:1 over the diets (S. Saravanan et al., unpublished results). Metabolisable energy intake (ME) as the difference between DE and branchial and urinary energy loss; RE as the difference between the energy content of the final and initial fish carcass; and heat production as the difference between ME and RE; RE as protein (REp) as the product of retained protein (RN × 6·25) and 23·7, where 23·7 is the energy content of 1 g protein(Reference Brafield30); RE as fat as the difference between RE and REp, assuming total RE only in the form of fat and protein.
The oxygen consumption of the fish was calculated per tank and expressed as mg O2/kg0·8 per min, adopting the formula used for calculating NH3 excretion in fish(Reference Kaushik31): OXt = ((V L × ΔC)+(C t × ΔW))/(t × W mean), where OXt is the VO2 of fish per unit time (mg O2/kg0·8 per min), V L is the volume of water in the metabolic tank (in litres), ΔC is the variation in O2 concentration in the outlet between two consecutive measurements (C i − C i − t), C t is the mean O2 concentration of the inlet minus the outlet between two consecutive intervals (C i − C i − t/2), ΔW is the water flow per unit time (litres/min), t is the unit of increment in time (min) between two consecutive oxygen measurements, and W mean is the average predicted metabolic body weight of fish (kg0·8) during the measurement days. W mean was calculated as (W p/1000)0·8, where W p is the predicted daily body weight of individual fish, estimated as W i(Reference Fletcher1–Reference Boujard, Gélineau and Covès48)+DFIi(Reference Fletcher1–Reference Boujard, Gélineau and Covès48)/FGRtank, where DFIi(Reference Fletcher1–Reference Boujard, Gélineau and Covès48) is the daily FI per fish per tank (in g/fish), W i is the average initial body weight of fish, i is the ith day of the experiment, and FGRtank is the feed:gain ratio of each tank calculated for the entire experimental period.
DOD (mg O2/kJ or mg O2/g) for each diet was calculated by dividing mean daily oxygen consumption (mg O2/kg0·8 per d) of fish in each tank by their respective DE (kJ/kg0·8 per d) or daily dry FI (g DM/kg0·8 per d). Similarly, efficiency of oxygen utilisation for energy retention (i.e. oxygen efficiency; kJ RE/mg O2 consumed) was calculated by dividing RE (kJ/kg0·8 per d) of fish within each tank by their respective mean daily oxygen consumption (mg O2/kg0·8 per d).
Statistical procedures
Statistical analyses were performed using SAS 9.1 (SAS Institute). The homogeneity of variances among the groups was checked by Levene's F test (PROC ANOVA). All variables met the assumption of equal variances (P>0·05). The parameters related to FI, oxygen consumption, growth and nutrient utilisation were subjected to a two-way ANOVA in order to test the effect of DP:DE ratio, type of NPE and their interaction (PROC GLM). Normal distribution of the residuals was verified using the Kolmogorov–Smirnov test (PROC UNIVARIATE). The total digestible carbohydrate intake and RF overruled the assumption of normal distribution (P < 0·05) and logarithmic data transformation satisfied the assumptions. When the interaction between DP:DE and NPE was significant (P < 0·05), comparison of means was performed using the Tukey–Kramer test. A linear regression (PROC REG) analysed the relationship between DOD or oxygen efficiency and DE intake of each treatment unit.
Results
Growth
The survival of the fish during the experimental period was above 98 % and did not differ among the dietary treatments (P>0·05). Data on growth and feed utilisation of the fish over the entire study period are reported in Table 2. The mean initial body weight was not different among the dietary groups (P>0·05). The mean final body weights were higher for fish fed with fat as NPE (P < 0·02), as was the growth rate expressed per unit metabolic body weight, being 9·3 % higher in fish fed the fat diets relative to the starch diets. A similar trend was observed for the overall growth rate (daily growth coefficient) or lean body growth. While growth parameters were not affected by the DP:DE ratio of the diet (P>0·05), the FGR was significantly improved in fish fed the high DP:DE ratio diets (P < 0·01). Similarly, the protein efficiency ratio was affected by the dietary DP:DE ratio (P < 0·001) with higher efficiency in the LP diets than in the HP diets. There were no interaction effects between the DP:DE ratio and NPE on any of the growth parameters.
Growth performance of Nile tilapia fed the experimental diets for 48 d (n 3) (Mean values with their standard errors)

HPF, high digestible protein (DP):digestible energy (DE) ratio diet with fat as non-protein energy (NPE) source; HPS, high DP:DE ratio diet with starch as NPE source; LPF, low DP:DE ratio diet with fat as NPE source; LPS, low DP:DE ratio diet with starch as NPE source; GRMBW, growth expressed in metabolic body weight; DGC, daily growth coefficient; FGR, feed:gain ratio; PER, protein efficiency ratio.
* PER = wet weight gain:protein intake.
Feed intake and digestible nutrient intake
FI and digestible nutrient intake of Nile tilapia are shown in Table 3. FI (expressed as-fed, ABS, percentage and MBW of fish) was affected by the type of NPE source (P < 0·03) and to a lesser extent by the DP:DE ratio (P = 0·07), which disappeared when FI was expressed on a DM basis. Although not significantly different, fish fed the LP diets had approximately 6 % higher FI than the HP diets. On the other hand, tilapia fed diets containing starch as the main NPE had a significantly reduced FI (9·5 %) compared with those fed the fat diets.
Feed intake (FI), digestible nutrient intake (on DM basis, except DM) of Nile tilapia and dietary oxygen demand (DOD) of the experimental diets (n 3) (Mean values with their standard errors)

HPF, high digestible protein (DP):digestible energy (DE) ratio diet with fat as non-protein energy (NPE) source; HPS, high DP:DE ratio diet with starch as NPE source; LPF, low DP:DE ratio diet with fat as NPE source; LPS, low DP:DE ratio diet with starch as NPE source; FIABS, absolute FI; FIPCT, FI expressed in percentage body weight of fish; FIMBW, FI expressed in metabolic body weight.
Digestible DM, protein, fat and total carbohydrate (without cellulose) intakes were affected by both DP:DE ratio and NPE of the diets (P < 0·02). As expected by the experimental design, DP intake was 41 % lower with the LP diets than with the HP diets. Digestible fat and carbohydrate intakes were also affected by both DP:DE ratio and NPE of the diets (P < 0·001). In contrast to digestible macronutrient intakes, DE intake was not affected by the source of NPE (P>0·05), but was affected by the dietary DP:DE ratio, being higher at the low DP:DE ratio than at the high DP:DE ratio (P < 0·05). There was no interaction between the effect of DP:DE ratio and NPE on any of the observed FI and digestible nutrient intake variables (P>0·05).
Oxygen consumption
The oxygen consumption (mg O2/kg0·8 per min) of Nile tilapia (Fig. 1), affected by both DP:DE ratio and NPE of the diet (P < 0·01), showed a significant interaction between the two effects (P = 0·01). The multiple means comparison (Tukey's test) showed that except for the LPF (5·4 (sd 0·14)) diet group, oxygen consumption was similar in the other three diet groups (HPF, 5·9 (sd 0·05); HPS, 6·0 (sd 0·04); LPS, 5·8 (sd 0·04)).
Effect of the diets on oxygen consumption (mg O2/kg0·8 per min) of Nile tilapia. Values are means (n 3), with standard deviations represented by vertical bars. a,b Mean values with unlike letters were significantly different (P < 0·05). HPF, high digestible protein (DP):digestible energy (DE) ratio diet with fat as non-protein energy (NPE) source; HPS, high DP:DE ratio diet with starch as NPE source; LPF, low DP:DE ratio diet with fat as NPE source; LPS, low DP:DE ratio diet with starch as NPE source.

Dietary oxygen demand
The DOD of the diets expressed both on DM and DE intake (Table 3) was influenced by the DP:DE ratio and the NPE of the diet (P < 0·01). The HP diets induced an 11 % higher oxygen demand than the LP diets. Similarly, the starch diets led to an 11 and 7 % higher oxygen demand per unit DM and DE intake, respectively, compared with the fat diets. No interaction effect was observed for DOD. Intriguingly, DE intake showed a significant inverse linear relationship (R 2 0·81) with DOD of the diets (Fig. 2). Fish fed the LPF diet with the lowest DOD had highest DE intakes, followed by the LPS, HPF and HPS groups.
Relationship between dietary oxygen demand (DOD) and digestible energy (DE) intake of Nile tilapia fed diets differing in digestible protein (DP):DE ratio and non-protein energy (NPE) source. For every unit increase in DOD, DE intake of Nile tilapia would decrease by 14·4 kJ (n 12; P < 0·001). y = 713 − 14·4x; R 2 0·81. HPF (○), high DP:DE ratio diet with fat as NPE source; HPS (●), high DP:DE ratio diet with starch as NPE source; LPF (Δ), low DP:DE ratio diet with fat as NPE source; LPS (▲), low DP:DE ratio diet with starch as NPE source.

Body composition
The initial and final whole-body compositions of tilapia are presented in Table 4. The dietary DP:DE ratio had a significant effect on the final body composition of tilapia. A similar effect was observed for the dietary NPE source, except for DM and gross energy content where no effect was found (P>0·05). The fat content of fish fed the LP diets was 37 % higher than fish fed the HP diets. Consequently, LP-fed fish had about 19 % higher energy deposit per unit body weight compared with HP-fed fish. There was no interaction effect between the DP:DE ratio and NPE on the final body composition, except for the protein content (P < 0·05).
Effect of the digestible protein (DP):digestible energy (DE) ratio of the diet and the non-protein energy (NPE) source (fat v. starch) on final body composition (on fresh weight basis) of Nile tilapia (n 3)(Least square mean values with their standard errors)
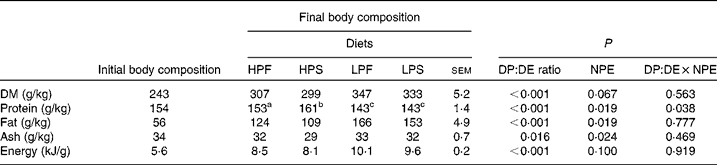
HPF, high DP:DE ratio diet with fat as NPE source; HPS, high DP:DE ratio diet with starch as NPE source; LPF, low DP:DE ratio diet with fat as NPE source; LPS, low DP:DE ratio diet with starch as NPE source.
a,b,c Least square means within a row with unlike superscript letters were significantly different and assigned only if the interaction effect was significant (P < 0·05).
Nitrogen, fat and energy balance
N, fat and energy balances are shown in Table 5. All parameters of the N balance (GN, FN, DN, BUN and RN) were affected by the DP:DE ratio of the diets (P < 0·02) and, except for RN (P = 0·063), also by NPE (P < 0·02). GN and DN intake was about 41 % lower with the LP diets compared with the HP diets. The HP diets resulted in higher FN (33·5 %) and BUN (59 %) than the LP diets. RN represented 37 and 58 % in terms of DN intake in the HP and LP diets, respectively. GN, DN and RN were 7·1, 6·7 and 6·2 % higher, respectively, in fish fed the fat diets compared with the starch diets. No interaction effect between NPE and the DP:DE ratio was observed except for FN (P < 0·05).
Nitrogen, fat and energy balance in Nile tilapia fed the four experimental diets for 48 d (n 3)(Least square mean values with their standard errors)
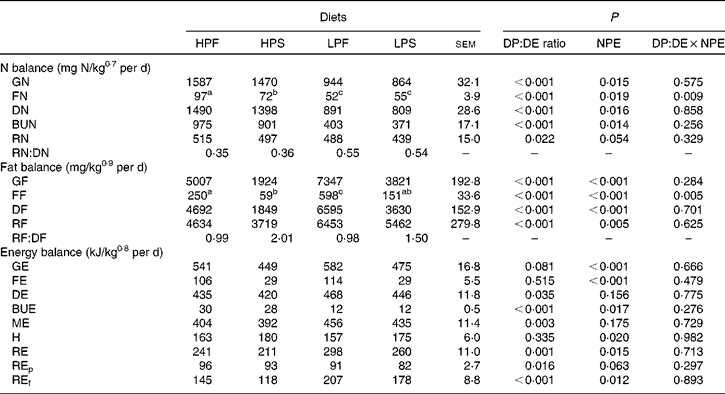
HPF, high digestible protein (DP):digestible energy (DE) ratio diet with fat as non-protein energy (NPE) source; HPS, high DP:DE ratio diet with starch as NPE source; LPF, low DP:DE ratio diet with fat as NPE source; LPS, low DP:DE ratio diet with starch as NPE source; GN, gross nitrogen intake; FN, faecal nitrogen loss; DN, digestible nitrogen intake; BUN, branchial and urinary nitrogen loss; RN, retained nitrogen; GF, gross fat intake; FF, faecal fat loss; DF, digestible fat intake; RF, retained fat; RF:DF, fat efficiency; GE, gross energy intake; FE, faecal energy loss; DE, digestible energy intake; BUE, branchial and urinary energy loss; ME, metabolisable energy intake; H, heat production; RE, retained energy; REp, retained energy as protein; REf, retained energy as fat.
a,b,c Least square means within a row with unlike superscript letters were significantly different and assigned only if the interaction effect was significant (P < 0·05).
Variables of the fat balance (GF, FF, DF and RF) were affected by the DP:DE ratio and the NPE of the diet (P < 0·01) without interaction, except for FF. RF was significantly (P < 0·05) different between the HP and LP groups, being about 30 % higher in the LP diet group compared with the HP diet group. The RF/DF (i.e. fat efficiency) was found to be above 1 for the starch diet groups (2·0, HPS; 1·5, LPS) and close to 1 for the fat diet groups.
The DP:DE ratio of the diet had no effect on GE, FE and heat production (P>0·05), but affected DE and ME intakes being about 11 % higher in fish fed the LP diets relative to the HP diets. On the other hand, the source of NPE did not affect DE and ME intakes, but showed a lesser effect on REp (P = 0·063). Although ME intakes of fish fed the starch and fat diets were found to be similar, the higher RE with the fat diets resulted in a 10 % lower heat production than with the starch diets. There was no interaction between the DP:DE ratio and the NPE of the diet on any of the energy balance parameters (P>0·05).
Discussion
Indispensable criteria
The following two main criteria need to be fulfilled to investigate the possible role of DOD on FI regulation: (1) the availability of DO from water should not be limiting for the fish and (2) the experimental diets should generate differences in oxygen demand in the species concerned.
It is well documented in many fish species that a reduction in the concentration of water oxygen lowers FI(Reference Buentello, Gatlin and Nei14–Reference Glencross17). The mean iDO concentration inside the tank for Nile tilapia has recently been reported to be 2·6 and 5·0 mg/l for small (60–100 g) and big (200–270 g) fish, respectively(Reference Tran-Duy, Schrama and van Dam32), below which FI decreases. Cho(Reference Cho33), however, underlined the importance of considering the rate of replenishment of oxygen per unit time (mg/l per s) rather than the mean oxygen concentration inside the tank. In the present study, oxygen was kept at an average of 8·8 mg/l in the inlet water and 5·6 mg/l in the outlet water, indicating a DO concentration higher than 5·6 mg/l inside the tank. This concentration, together with the 30 min total replenishments, ensured sufficient oxygen availability for the fish (40–250 g) throughout the experiment.
As intended, the diets generated differences in DOD (kJ/g DM or DE intake), related to both the DP:DE ratio (HP>LP) and the NPE source (starch>fat). The metabolic fate of a specific dietary nutrient for energy production depends on the relative proportions of energy-yielding nutrients and on the nutritional status of the fish. The high oxygen demand for the HP diets agrees with post-feeding oxygen consumption data reported in fish fed high-protein diets(Reference Kaushik, Doudet and Médale34, Reference Peres and Oliva-Teles35) and also with the use of protein for ATP production in fish(Reference Alsop and Wood36). The low oxygen demand in tilapia fed the high-fat diets, as observed in other studies(Reference Cho33, Reference Seth, Sandblom and Axelsson37), suggests that the majority of the dietary fat was used for fat deposition rather than for ATP production, as reflected by their higher level of body adiposity. In terms of ATP (oxygen) demand, the formation of fat from dietary lipids is considered to be less expensive than from either starch or protein(Reference Blaxter25, Reference Reeds, Wahle and Haggarty26), which probably explains the increase in DOD observed following the replacement of fat by starch as NPE source.
Control of feed intake
FI in several fish species, including Nile tilapia, has been found to be regulated by the dietary DE level in order to maintain a constant DE intake irrespective of the diet composition, provided all essential nutrients are present in adequate amounts and in the right proportions(Reference Boujard and Médale2–Reference Lekva, Hansen and Rosenlund6, Reference Kubaryk38). In the case of a very low dietary DE density, FI can be limited by the excessive bulk relative to the stomach volume induced by the physical characteristics of the feed(Reference Lovell39). However, some studies have reported an increase in stomach volume to allow increased DM intakes as shown in rainbow trout (35 % over a 10-week period)(Reference Ruohonen and Grove40), and in plaice(Reference Jobling41). In the present study, tilapia fed the LP diets compared with the HP diets with similar DE concentration displayed an 11 % higher DE intake. The present finding that tilapia did not adjust FI for constant DE intake is in line with observations in other studies(Reference Geurden, Gondouin and Rimbach7, Reference Peres and Oliva-Teles35, Reference Alanärä and Kiessling42, Reference Helland and Grisdale-Helland43), showing the absence of dietary DE intake compensations, and hence suggests a role of factors other than DE in the control of FI. A possible adjustment to make up for the low protein supply in the LP diets is one explanation for this.
Some studies in mammals have suggested that an animal seeks to eat until it reaches the maximum protein deposition as determined by its genetic growth potential(Reference Birkett and de Lange44, Reference Webster45). Also, some studies in fish have proposed that FI is controlled in order to achieve the maximal protein growth rather than to fulfil the daily energy needs(Reference Geurden, Gondouin and Rimbach7, Reference Azevedo, Leeson and Cho46, Reference Gélineau, Corraze and Boujard47). If it is indeed the maximal growth potential that determines FI, one would expect to have similar lean body growth, irrespective of the diet composition. In contrast, the results of the present study showed differences in lean growth and RN between the fish groups, which does not comply with the above claims.
As in mammals, reduced FI in fish fed high-fat diets has been attributed to increased adiposity or high body fat contents(Reference Boujard, Gélineau and Covès48–Reference Silverstein, Shearer and Dickhoff52). In the present study, high growth (growth rate expressed per kg metabolic body weight) in the fat groups resulted from the high deposition of body fat (lipid gain), as seen in other fish species fed high levels of dietary fat(Reference Grisdale-Helland, Shearer and Gatlin12, Reference Azevedo, Leeson and Cho53, Reference Vergara, Lopez-Calero and Robaina54). However, tilapia fed either the HPF or LPF diet did not reduce FI. On the contrary, these groups in fact had a higher FI, despite their high body fat content. Similar observations have been made in other fish such as turbot(Reference Saether and Jobling55) and rainbow trout(Reference Geurden, Gondouin and Rimbach7). The present results suggest that FI in Nile tilapia is not related to adiposity, which suggest the need for further studies on the lipostatic control of FI in poikilotherms.
Our previous observations showing different DE intakes concurrent with similar heat production in Nile tilapia(Reference Tran-Duy, Smit and van Dam8) and rainbow trout (S. Saravanan et al., unpublished results) suggest that DE intake might be limited and thus controlled by either constraints in the physiological capacity of oxygen uptake or metabolic oxygen use by the fish. This forms the basis of the proposed oxystatic theory, which to our knowledge has never been considered before in fish. The concept of the ‘oxystatic control of FI in fish’ tested here assumes that (maximal) FI is limited by the (maximal) capacity of oxygen use in the fish. In this view, it is expected to find similar oxygen consumption if fish are fed to satiation with diets differing in macronutrient composition. Thus, changes in DOD (by changing the macronutrient composition) are expected to induce differences in FI. Indeed, in the present study, the amount of oxygen consumed per unit metabolic body weight was similar for three out of the four diets. As such, the reduced DE intakes of fish fed the HP diets, which had a higher DOD than the LP diets but which resulted in equal oxygen consumption by the fish, possibly stem from physiological constraints in oxygen use, in line with the ‘oxystatic control of FI in fish’. Also in mammals, high levels of dietary protein have been reported to produce a higher satiating effect than fat(Reference Friedman22, Reference Stubbs, Harbron and Prentice56, Reference Anderson and Moore57), which has been attributed to their limited storage capacity and hence their (obligatory) partitioning towards oxidation. Interestingly, tilapia fed the LPF diet, however, consumed a lower amount of oxygen than fish from the other three dietary treatments. Moreover, tilapia fed this low oxygen-demanding diet displayed the highest FI. According to the oxystatic theory, LPF-fed fish could have eaten more since oxygen consumption did not reach its upper limit. As such, it is believed that FI in tilapia fed the LPF diet was limited by other constraints of physical (stomach capacity) or metabolic (lipid/protein gain) origin rather than by the maximum capacity of oxygen use.
The present data demonstrate that DE intake in tilapia is not only significantly related to the DOD, but also to the amount of energy retained per unit of oxygen consumed (Figs. 2 and 3). DE intakes decreased with increasing DOD but also increased linearly with increasing oxygen efficiency (i.e. amount of energy retained per unit of oxygen consumed). This parallels the finding in ruminants that ME increases with increasing oxygen efficiency(Reference Ketelaars and Tolkamp20). Based on these observations in ruminants, Ketelaars & Tolkamp(Reference Ketelaars and Tolkamp20, Reference Ketelaars and Tolkamp21) postulated the ‘oxygen efficiency theory’ in the control of FI. According to this theory, FI entails both benefits (energy gain) and costs (measured as oxygen consumption) to the animal, which strives to optimise its FI close to the value of maximum efficiency of oxygen utilisation for energy gain. The present results, however, do not allow us to conclude whether FI in Nile tilapia is regulated as a function of (maximising) oxygen efficiency or by a limit set by the (maximum) capacity of oxygen use by the fish.
Relationship between oxygen efficiency and digestible energy (DE) intake of Nile tilapia fed diets differing in digestible protein (DP):DE ratio and non-protein energy (NPE) source. The DE intake of tilapia increases linearly with increasing efficiency of oxygen utilisation for energy retention (n 12; P < 0·001). y = 323+3897x; R 2 0·74. HPF (○), high DP:DE ratio diet with fat as NPE source; HPS (●), high DP:DE ratio diet with starch as NPE source; LPF (Δ), low DP:DE ratio diet with fat as NPE source; LPS (▲), low DP:DE ratio diet with starch as NPE source; RE, retained energy.

In summary, the FI of Nile tilapia was related to dietary macronutrient-induced changes in oxygen demand. As such, even under normoxic conditions, oxygen consumption of fish appears to play a role in the dietary control of FI in tilapia. Further studies are warranted to explore other environmental and nutritional factors affecting oxygen use in fish and their metabolic implications in regulating FI in fish.
Acknowledgements
The authors thank Ep Eding and Menno ter Veld for their technical advice and support in operating the experimental system, and to Ronald Booms and Tino Leffering for their technical assistance during the sampling and laboratory analysis. The study was carried out in the aquatic metabolic unit co-funded by the NWO (code 805-34·025; Den Haag, The Netherlands). This study was funded by Wageningen University and performed in the framework of the collaborative INRA-WUR Platform for Sustainable Aquaculture. S. S., A. C. F.-S., I. G., S. J. K., J. A. J. V. and J. W. S. contributed to the concept and design of the study. S. S. and M. N. H. executed the experiment, performed the laboratory analysis and collected the data. S. S., I. G. and J. W. S. were involved in the data analysis. S. S. wrote the first draft of the manuscript and all authors contributed to the interpretation of the results, writing and agreed with the content of the final manuscript. There are no conflicts of interest.


