


I. Introduction
Wine grapes are one of the most economically relevant crops in many European countries in terms of gross production value (FAO, 2022).Footnote 1 Viticulture also ranks among the most pesticide-intensive agricultural sectors (Montaigne, Coelho, and Khefifi, Reference Montaigne, Coelho and Khefifi2016; Pertot et al., Reference Pertot, Caffi, Rossi, Mugnai, Hoffmann, Grando, Gary, Lafond, Duso, Thiery, Mazzoni and Anfora2017), negatively affecting human health and the environment (e.g., Baldi et al., Reference Baldi, Lebailly, Jean, Rougetet, Dulaurent and Marquet2006; Komárek et al., Reference Komárek, Čadková, Chrastný, Bordas and Bollinger2010). Thus, pesticide use and risk reductions are at the top of agricultural policy agendas. For instance, the European Union’s Farm-to-Fork strategy mandates a reduction in the overall use and risk of chemical and hazardous pesticides by 50% by 2030 (Schebesta and Candel, Reference Schebesta and Candel2020).
The production of wine grapes could thus play a key entry point in reducing pesticide use risks. The vast majority of pesticides used in vineyards are fungicides sprayed against fungal pathogens (Pertot et al., Reference Pertot, Caffi, Rossi, Mugnai, Hoffmann, Grando, Gary, Lafond, Duso, Thiery, Mazzoni and Anfora2017; de Baan, Reference de Baan2020). For example, on average, 12–15 treatments are required per season (peaking at 25–30 treatments in severe conditions) (Pertot et al., Reference Pertot, Caffi, Rossi, Mugnai, Hoffmann, Grando, Gary, Lafond, Duso, Thiery, Mazzoni and Anfora2017). As a result, grapevine is the most pesticide-intensive crop in European agriculture, with fungicide applications in vineyards representing 26% and 27% of total pesticide use in the European Union and Switzerland (Muthmann and Nadin, Reference Muthmann and Nadin2007; de Baan, Reference de Baan2020). Moreover, fungal pest pressure is expected to increase substantially in the future in European viticulture due to changing environmental conditions (Salinari et al., Reference Salinari, Giosuè, Tubiello, Rettori, Rossi, Federico, Cynthia and Maria Lodovica2006; Bregaglio, Donatelli, and Confalonieri, Reference Bregaglio, Donatelli and Confalonieri2013).
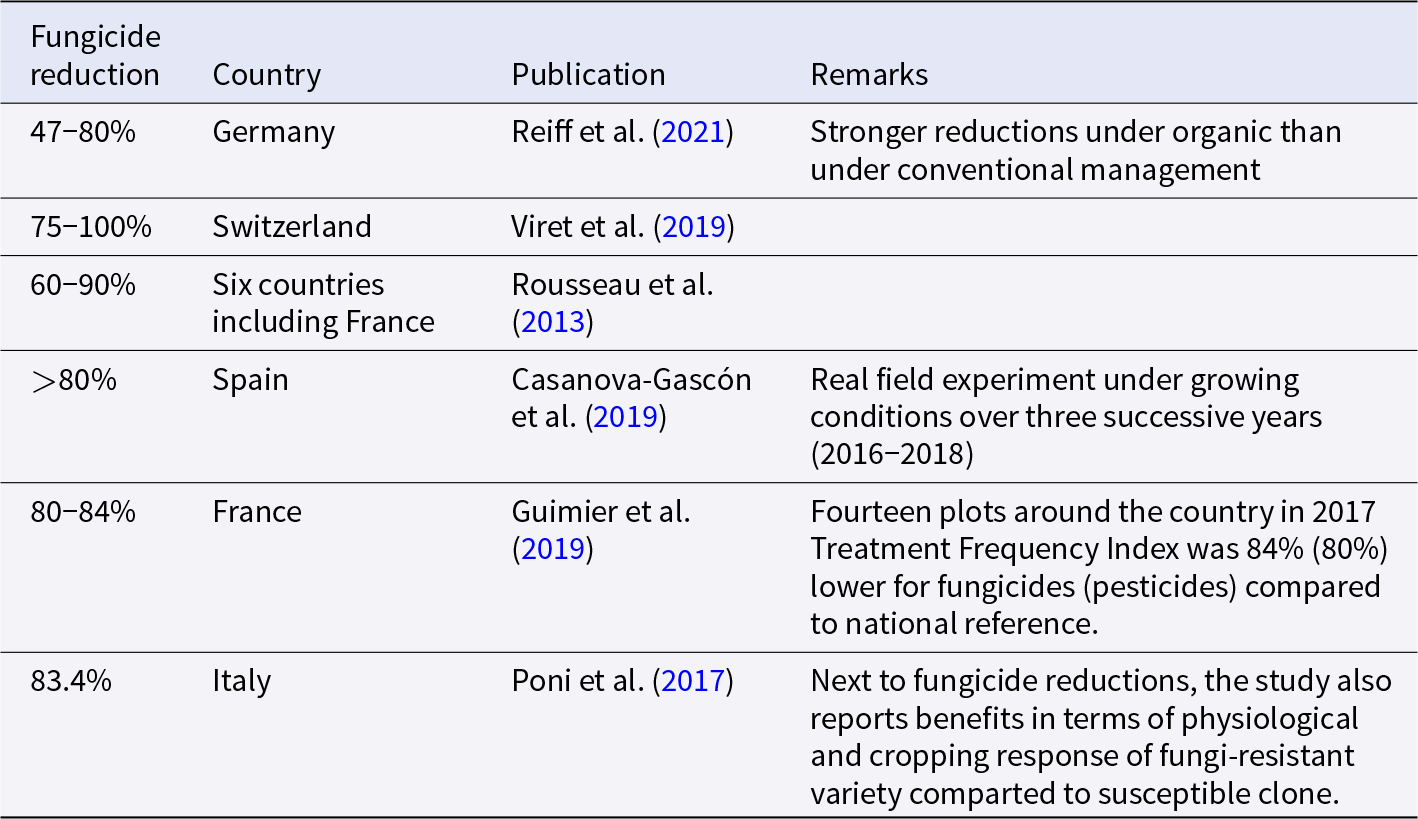
The biggest leverage to reduce fungicide use is switching to fungus-resistant varieties that allow fungicide use to be reduced massively (by around 80%) without depleting yield or quality of production (Poni et al., Reference Poni, Chiari, Caffi, Bove, Tombesi, Moncalvo and Gatti2017; Viret et al., Reference Viret, Spring, Zufferey, Gindro, Linder, Gaume and Murisier2019). However, the use of these varieties still remains globally limited (Finger, Zachmann, and McCallum, Reference Finger, Zachmann and McCallum2023). Integrating new varieties is a long-term process, as grapevine re-planting only takes place every 25–35 years (Carbone, Quici, and Pica, Reference Carbone, Quici and Pica2019). Thus, growers’ intentions for the future use of fungus-resistant varieties are very relevant for policy and industry. However, to what extent grapevine growers intend to switch to fungus-resistant varieties and what differences across farms explain these intentions remain unknown.
In this paper, we investigate grapevine growers’ expected future use of fungus-resistant varieties and the main predictors behind these future developments. We test and quantify the relevance of a large list of farmer- and farm characteristics as well as regional factors that may influence growers’ expected change in land devoted to fungus-resistant varieties in ten years compared to current land under cultivation. Using a supply response framework that examines predictors of 436 grapevine growers in Switzerland regarding their intentions of planting fungus-resistant varieties, we especially account for barriers and determinants relevant for future adoption.
Previous research highlighted the problem of global pesticide pollution from agricultural activities (e.g., Stehle and Schulz, Reference Stehle and Schulz2015; Tang et al., Reference Tang, Lenzen, McBratney and Maggi2021). Moreover, studies have documented societal demand and political pressures to reduce pesticide use in European agriculture (e.g., Möhring et al., Reference Möhring, Ingold, Kudsk, Martin-Laurent, Niggli, Siegrist, Studer, Walter and Finger2020; Finger, Reference Finger2021). This societal and political push to reduce pesticide risk was also documented for viticulture specifically (e.g., Montaigne, Coelho, and Khefifi, Reference Montaigne, Coelho and Khefifi2016; Schäufele and Hamm, Reference Schäufele and Hamm2017). Research on fungus-resistant varieties has mainly focused on consumer demand and concludes that there is generally acceptance among consumers for wines made from fungus-resistant varieties (e.g., Van Der Meer et al., Reference Van Der Meer, Weibel, Lévite and Häseli2010; Espinoza et al., Reference Espinoza, Hubert, Raineau, Franc and Giraud-Héraud2018; Nesselhauf, Fleuchaus, and Theuvsen, Reference Nesselhauf, Fleuchaus and Theuvsen2019; Borrello, Cembalo, and Vecchio, Reference Borrello, Cembalo and Vecchio2021; Vecchio et al., Reference Vecchio, Pomarici, Giampietri and Borrello2022). While the demand for specific wines can change rapidly, supply responses by producers typically lag behind (Cuellar, Karnowsky, and Acosta, Reference Cuellar, Karnowsky and Acosta2009; Consoli et al., Reference Consoli, Fraysse, Slipchenko, Wang, Amirebrahimi, Qin, Yazma and Lybbert2021). Thus, growers’ decisions are also of key relevance.
Yet, only two studies investigate the adoption decision from the producer side. Finger, Zachmann, and McCallum (Reference Finger, Zachmann and McCallum2023) study the currently observed early-stage adoption of fungus-resistant varieties, focusing on the relevance of the supply chain. They find that the closer the producer is to the final consumer of wine, the more likely the producer is to grow fungus-resistant varieties. Zachmann, McCallum, and Finger (Reference Zachmann, McCallum and Finger2023a) study whether nudging grapevine growers with personalized information about their use of environmentally toxic fungicides induces changes in planting intentions of fungus-resistant varieties. The low level of knowledge that exists about the adoption decisions of these varieties and especially on future adoption intentions by producers increasingly represents the bottleneck in the transition toward more sustainable viticulture and especially pesticide use reductions, which is particularly pressing since viticultural supply is a slow-moving process (Masson et al., Reference Masson, Soustre-Gacougnolle, Perrin, Schmitt, Henaux, Jaugey, Teillet, Lollier, Lallemand, Schermesser and Westhalten2021).
We contribute to this knowledge gap by shedding light on grapevine growers’ intentions about the future adoption dynamics of fungus-resistant varieties. Moreover, we investigate the importance of explanatory groups of factors such as farmer- and farm characteristics, growers’ perceptions, preferences, and personality traits, as well as regional characteristics, for the expected change in land devoted to these varieties. Specifically, we investigate from a large list of potential determinants, thus considering the “big picture”, which factors drive the adoption dynamics. We focus on the expected change between the share of land devoted to fungus-resistant varieties in ten years and the current plantation share. Given the difficulty in forecasting into the distant future, a ten-year horizon is reasonable to account for the typical 25–35 year cycle of vineyard replanting as well as accounting for bounded human prediction capabilities (e.g., Simon, Reference Simon, Eatwell, Milgate and Newman1990). Importantly, we use the expected value from a triangular distribution around the elicited share in ten years and, as such, account for uncertainties inherent in the long-term expectations (Hardaker et al., Reference Hardaker, Lien, Anderson and Huirne2015).
Our results suggest that Swiss grapevine growers expect to substantially increase their share of land devoted to fungus-resistant varieties within the next ten years. Specifically, we find that about one-third of new plantings in the next decade will be fungus-resistant. As a result, the expected farm level share (unweighted average) of land devoted to fungus-resistant varieties in ten years is 27.4% (compared to 10.2% in 2022), thus increasing by 169%. We show that farmer- and farm characteristics explain most of the variability in the change of land devoted to fungus-resistant varieties in ten years and today. Especially farms with a higher replantation rate in the next ten years (e.g., those with older grapevines) expect to increase their share of land devoted to fungus-resistant varieties. Moreover, grapevine growers who perceive fungus-resistant varieties to be superior for human health of the farmers and communities surrounding farms compared to traditional varieties indicate that they should increase their land share. Furthermore, non-organic grapevine growers indicate a substantial increase in their share of land devoted to fungus-resistant varieties, contrary to organic grapevine growers, who are mainly early adopters. Given the expected substantial increase in land devoted to fungus-resistant varieties, agricultural policy can facilitate the transition by ensuring the availability of required information and resources. This land expansion leads, ceteris paribus, to a massive reduction in pesticide treatments in Swiss vineyards.
In the remainder of this paper, we present background on viticulture and pesticide use, including the role of fungus-resistant varieties and our case study in Section II. Then, we present the conceptual framework, empirical strategy, and data used in Section III. Section IV follows with the results and their discussion. Finally, Section V concludes and provides policy implications.
II. Background
A. Viticulture and pesticides
The production of wine grapes is of great economic importance in several countries (Appendix A). For example, in Chile, France, Spain, and Switzerland, grapes account for the largest share of gross production value among all crops, with a share between 17.3% and 39.9% (FAO, 2022). Vitis vinifera (European) varieties are the most important species for winemaking, accounting for about 94% of land under grapevines globally (Bavaresco, Reference Bavaresco2019). However, due to their high susceptibility to fungal infestations, fungicides are intensively sprayed on Vitis vinifera varieties (Bavaresco, Reference Bavaresco2019). Viticulture ranks thus also among the most pesticide-intensive crops globally (Maggi et al., Reference Maggi, Tang, la Cecilia and McBratney2019; Masson et al., Reference Masson, Soustre-Gacougnolle, Perrin, Schmitt, Henaux, Jaugey, Teillet, Lollier, Lallemand, Schermesser and Westhalten2021; Tang et al., Reference Tang, Lenzen, McBratney and Maggi2021). In Switzerland, vineyards are responsible for 58% of all fungicide treatments and 27% of total pesticides in Swiss agriculture at large (de Baan, Reference de Baan2020).
Viticulture is thus a key sector to reduce pesticides. This applies to all production systems, including organic production.Footnote 2 This is particularly relevant because copper-based plant-protection products, which are widely used, especially in organic viticulture, have been shown to be harmful to the environment (Komárek et al., Reference Komárek, Čadková, Chrastný, Bordas and Bollinger2010; Mackie, Müller, and Kandeler, Reference Mackie, Müller and Kandeler2012).Footnote 3 Copper usage has therefore been increasingly restricted by European agricultural authorities over the last years, with the aim of a total phasing out in the near future (European Commission, 2009; Bundesrat, 2017).
B. Fungus-resistant varieties
The single most effective strategy to reduce pesticide use in viticulture, including copper-based products, is the plantation of fungus-resistant varieties. Numerous studies across Europe report fungicide use reductions from using fungus-resistant varieties on average by around 80% (Appendix B). Fungus-resistant varieties result from cross-breeding Vitis vinifera species and wild grapes such as Vitis labrusca or Vitis rupestris (Asian or American grapevines) that have been exposed to fungal pressure and thus developed natural defense mechanisms. Private and public breeding initiatives have attempted to insert resistance genes from American or Asian varieties into European varieties to shift toward a disease prevention approach for crop protection (Villano and Aversano, Reference Villano and Aversano2020). While first-generation hybrids have not proven successful for their wine quality, due to advancements in breeding methods, current fungus-resistant varieties carry both resistance genes and a high degree of Vitis vinifera genes, resulting in varieties that are well-accepted by consumers (e.g., Van Der Meer et al., Reference Van Der Meer, Weibel, Lévite and Häseli2010; Pedneault and Provost, Reference Pedneault and Provost2016; Vecchio et al., Reference Vecchio, Pomarici, Giampietri and Borrello2022).
While many wine regions globally feature beneficial climatic conditions for fungal disease development (e.g., Thind et al., Reference Thind, Arora, Mohan, Raj and Naqvi2004), the adoption of fungus-resistant varieties remains low. For example, the land share devoted to fungus-resistant varieties ranges between 1% and 3% in countries like Switzerland, Austria, Germany, and France (Finger, Zachmann, and McCallum, Reference Finger, Zachmann and McCallum2023).Footnote 4
Fungus-resistant varieties offer major benefits to grapevine growers (Pertot et al., Reference Pertot, Caffi, Rossi, Mugnai, Hoffmann, Grando, Gary, Lafond, Duso, Thiery, Mazzoni and Anfora2017; Villano and Aversano, Reference Villano and Aversano2020). For example, economic benefits from reduced fungicide applications (e.g., less product costs, labor, fuel, etc.) and environmental advantages due to enhanced biodiversity resulting from fewer adverse effects on flora and fauna from spraying.Footnote 5 Soil becomes less compact due to fewer spraying cycles, and less accumulation of pesticide metabolites occurs, particularly from copper-based products. Growers may also reduce the risk of losses from diseases due to increased resistance of the varieties to pathogens. Disadvantages of fungus-resistant varieties mainly stem from uncertainties relating to long-term resistance, agronomy, vinification, and marketing (Montaigne, Coelho, and Khefifi, Reference Montaigne, Coelho and Khefifi2016; Pedneault and Provost, Reference Pedneault and Provost2016; Pertot et al., Reference Pertot, Caffi, Rossi, Mugnai, Hoffmann, Grando, Gary, Lafond, Duso, Thiery, Mazzoni and Anfora2017).
C. Switzerland: The ideal case study
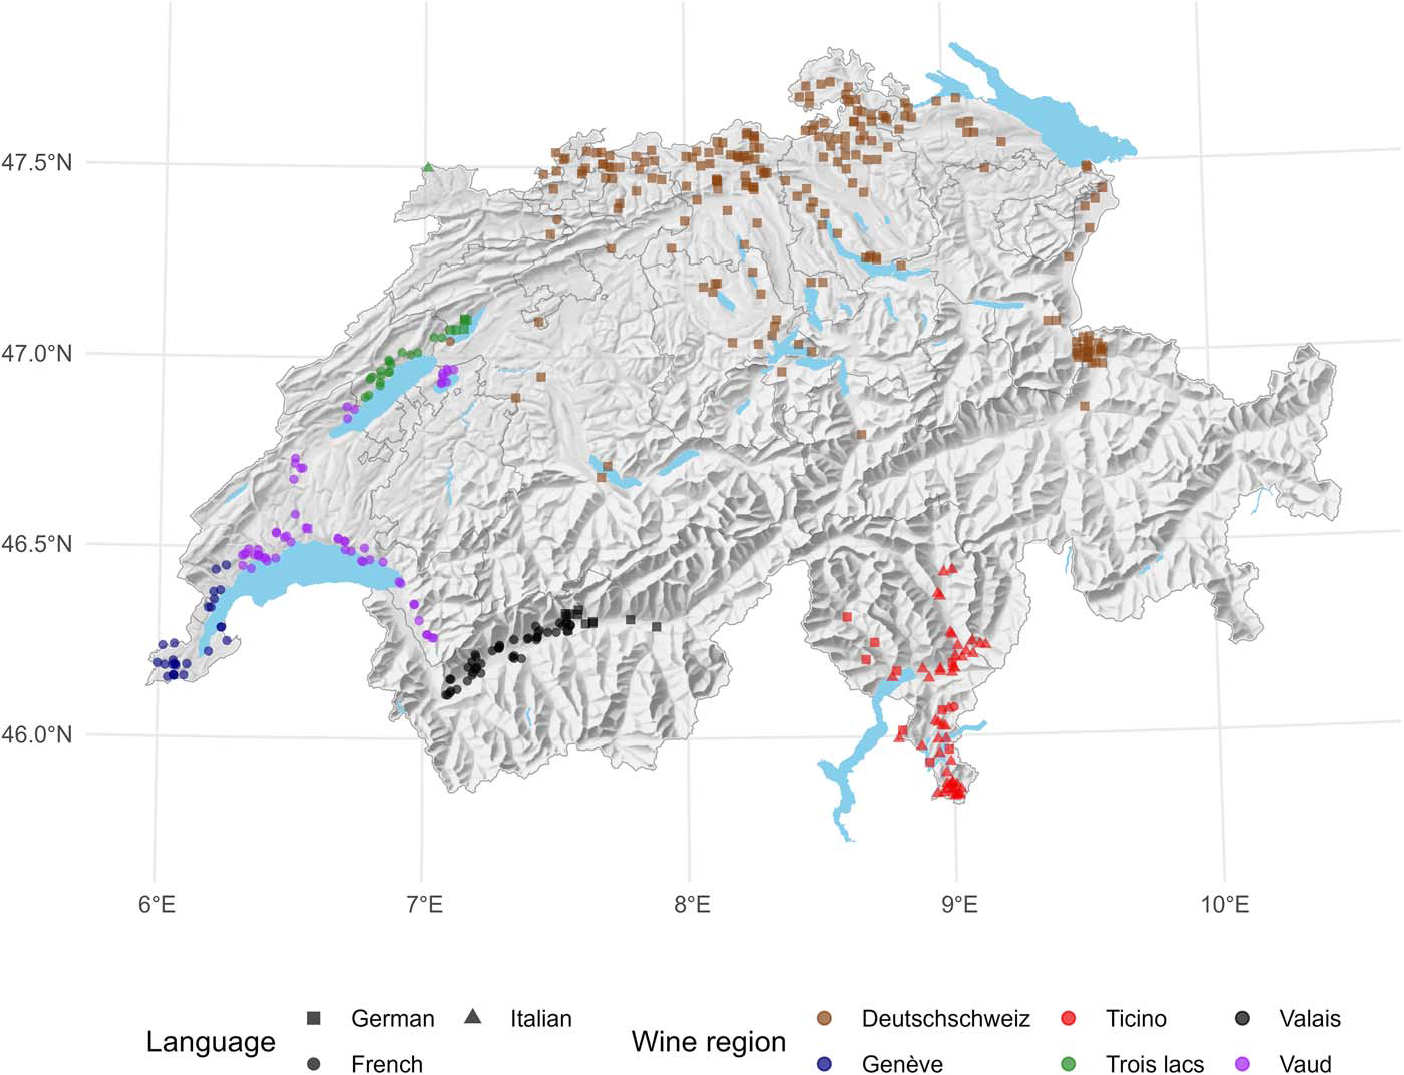
In Switzerland, the share of land under fungus-resistant varieties from total land under wine grapes remains low; it was 2.8% in 2021 (Bundesamt für Landwirtschaft (BLW) 2022).Footnote 6 The adoption intensity, however, differs across the six different Swiss wine regions (see Figure 1). Adoption rates are higher in the Deutschschweiz (German-speaking part of Switzerland), Geneva, and the Trois Lacs (Three Lakes) region, and lower in Ticino, Valais, and Vaud (Finger, Zachmann, and McCallum, Reference Finger, Zachmann and McCallum2023).
Sample overview (N = 436) by wine region (N = 6) and language (N = 3).

Switzerland is subject to a temperate and humid climate, with varying degrees, and thus there is high fungal pressure across the country, which will likely increase due to changing climates (Salinari et al., Reference Salinari, Giosuè, Tubiello, Rettori, Rossi, Federico, Cynthia and Maria Lodovica2006; Bregaglio, Donatelli, and Confalonieri, Reference Bregaglio, Donatelli and Confalonieri2013). Switzerland has a competitive wine market in which a major supermarket, in cooperation with large wineries, has recently begun labeling their wines as low in pesticides (Finger, Reference Finger2021). Moreover, agricultural policy as well as society envision sharp pesticide risk reductions in the near future, making Switzerland the ideal case study to investigate the adoption dynamics of fungus-resistant varieties (Finger, Reference Finger2021).
III. Materials and methods
A. Conceptual model
Plantation decisions for perennial crops like wine grapes are characterized by taking longer between initial planting and first harvest, which is followed by an extended period of regular output at an eventually declining rate (French and Matthews, Reference French and Matthews1971). Modeling perennial crops must thus take long-term time and risk aspects into account.Footnote 7
We assume grapevine growers adjust acreage for fungus-resistant varieties by considering changes in (expected) utility over time (now and in the future) and across variety types (traditional and fungus-resistant varieties).Footnote 8 Grapevine planting does not necessarily happen from one year to another, expected future utility from fungus-resistant varieties is thus conditional on the desired long-term land share the grower wishes to devote to these varieties. The change in the share of land devoted to fungus-resistant varieties that is the desired minus the current (or last period) land share is thus given by comparing (discounted) utility differences of the alternatives over time (Fernandez‐Cornejo, Reference Fernandez‐Cornejo1998). Expected utility is a function of expected prices and costs, which define profits, and other features of fungus-resistant varieties that reward (dis)utility to the grower. Expected utility differentials and thus decisions across farms are driven by farmer- and farm characteristics, regional factors, as well as the perceptions, preferences, and personality traits of grapevine growers.
Farmer- and farm characteristics such as the degree of specialization, the size of the farm, structural factors such as the share of old grapevines, the production system, marketing channels, and labeling, as well as grapevine growers’ education and (self-assessed) knowledge about fungus-resistant varieties, may all determine profits and costs, including switching and adjustment costs (Gardebroek and Oude Lansink, Reference Gardebroek and Oude Lansink2004). Grapevine growers’ risk preferences are crucial to explaining economic decisions, and especially time preferences are relevant to comparing long-term utility levels across time (Falk et al., Reference Falk, Becker, Dohmen, Enke, Huffman and Sunde2018; Iyer et al., Reference Iyer, Bozzola, Hirsch, Meraner and Finger2020). Moreover, grapevine growers’ perceptions of fungus-resistant varieties, such as environmental and health benefits or marketing difficulties, as well as the perceived willingness to pay from consumers, may reward (dis)utility to grapevine growers (Piñeiro et al., Reference Piñeiro, Arias, Dürr, Elverdin, Ibáñez, Kinengyere, Opazo, Owoo, Page, Prager and Torero2020; Weersink and Fulton, Reference Weersink and Fulton2020; Finger and Möhring, Reference Finger and Möhring2022). Additionally, personality traits such as growers’ ambition, locus of control, and self-efficacy may matter for the adoption of preventive measures against pests (Knapp, Wuepper, and Finger, Reference Finger2021). Last, regional factors such as pest pressure or tradition may explain utility differentials across varieties and time.
B. Econometric strategy
Empirically, expected utility differentials remain unobserved; thus, we estimate the following linear model with ordinary least squares (OLS), including farmer- and farm characteristics, grapevine growers’ perceptions, preferences, and personality traits, as well as regional factors as explanatory variables:
 \begin{equation}\begin{gathered}
\Delta Share\,of\,land\,under\,FR{G_i} = \alpha + \gamma Farmer{\text{ - }}and\,farm\,characteristic{s_i} \hfill \\
+ \,\delta Regional\,factor{s_i} + \theta Perceptions\,and\,preference{s_i}\, + \rho Personality\,Trait{s_i} + {\varepsilon _i}, \hfill \\
\end{gathered} \end{equation}
\begin{equation}\begin{gathered}
\Delta Share\,of\,land\,under\,FR{G_i} = \alpha + \gamma Farmer{\text{ - }}and\,farm\,characteristic{s_i} \hfill \\
+ \,\delta Regional\,factor{s_i} + \theta Perceptions\,and\,preference{s_i}\, + \rho Personality\,Trait{s_i} + {\varepsilon _i}, \hfill \\
\end{gathered} \end{equation}  $\Delta Share{\text{ }}of{\text{ }}land{\text{ }}under{\text{ }}FR{G_i}$ is the difference in the expected share of land devoted to fungus-resistant varieties in ten years and the current share.Footnote 9 We calculate the expected share as the mean from a triangular distribution following Hardaker et al. (Reference Hardaker, Lien, Anderson and Huirne2015).Footnote 10 As such, we capture uncertainties inherent in the long-term prediction; ${\varepsilon _i}$ is the error term that we cluster at the wine region level, which are important decision-making units in viticulture, using a wild bootstrap approach due to the small number of clusters (Wooldridge, Reference Wooldridge2003).
To assess the sensitivity and mechanisms of our results, we conduct several further analyses. First, since our model contains many explanatory variables and thus potentially suffers from multicollinearity, we test for correlated variables using variance inflation factors. Thereafter, we re-run Model 1 using sub-groups of the explanatory variables. Moreover, we run Model 1 using LASSO regression, allowing us to identify insignificant or unimportant variables from the large list of explanatory factors (Tibshirani, Reference Tibshirani1996). Second, we regress Model 1 separately for the current and expected adoption shares. As such, we aim to describe current adopters as well as expected future adopters, independent of each other. Third, since the expected share is a projection into the future and, as such, subject to uncertainty, we investigate the variance of the expected land share distribution under fungus-resistant varieties in ten years. This provides insight into the (un)certainty around the predictions across growers in our sample.
C. Data
We use representative survey data from 436 grapevine growers in Switzerland (see Zachmann, McCallum, and Finger, Reference Zachmann, McCallum and Finger2023b). Figure 1 reports the scope of the data collection, which was done in the three main official Swiss languages and includes responses from grapevine growers in all wine regions. Data collection focused specifically on barriers and determinants that influence the adoption of fungus-resistant varieties, including detailed farmer- and farm characteristics, perceptions, preferences, as well as personality traits of the grapevine growers.
In the survey, grapevine growers were asked which varieties they grow and how much land they allocate to each variety, allowing for the calculation of the current share of land devoted to fungus-resistant varieties. Grapevine growers were also asked what share of land they would allocate to fungus-resistant varieties in ten years using a triangular distribution where they state the most likely, minimum, and maximum shares (Hardaker et al., Reference Hardaker, Lien, Anderson and Huirne2015). An important aspect is the expected replantation rate; thus, what share of their land growers intend to replant within the next ten years was elicited. We drop 75 (17.2%) grapevine growers from the sample that report no replanting of their vineyard in the next ten years. For those farms, the structural composition of the vineyards will not change and is thus not the focus of our analysis.
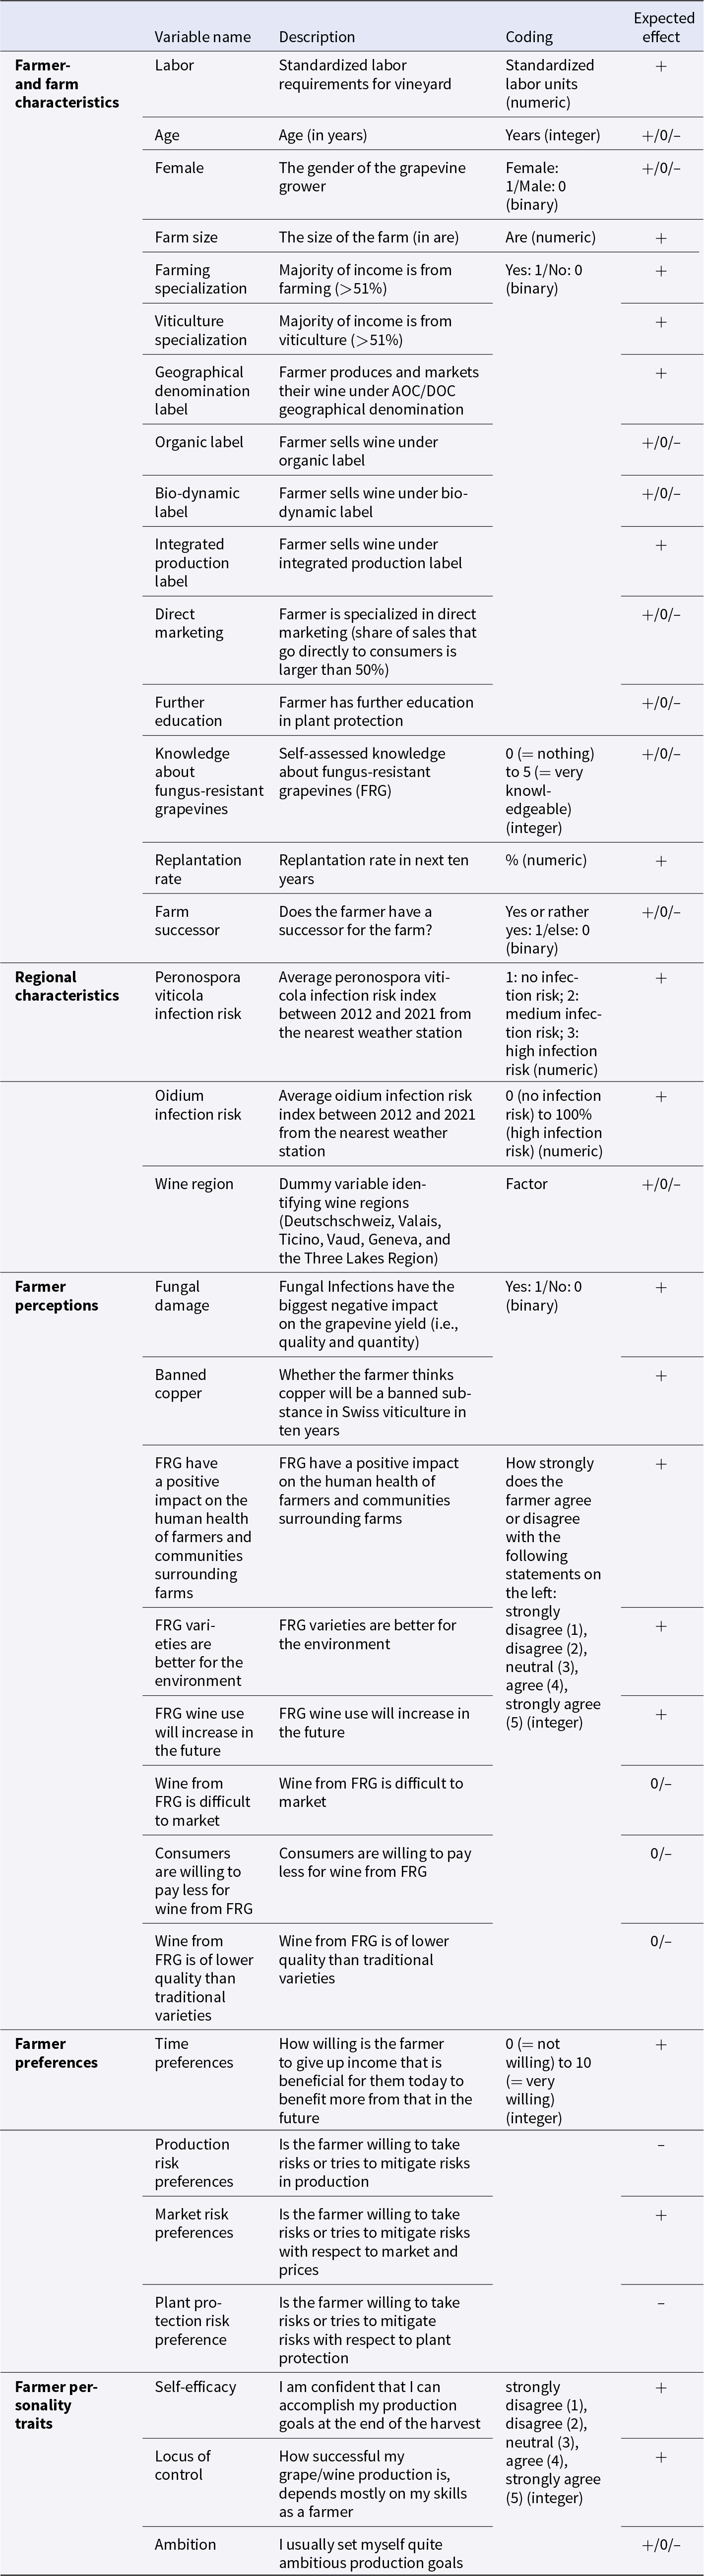
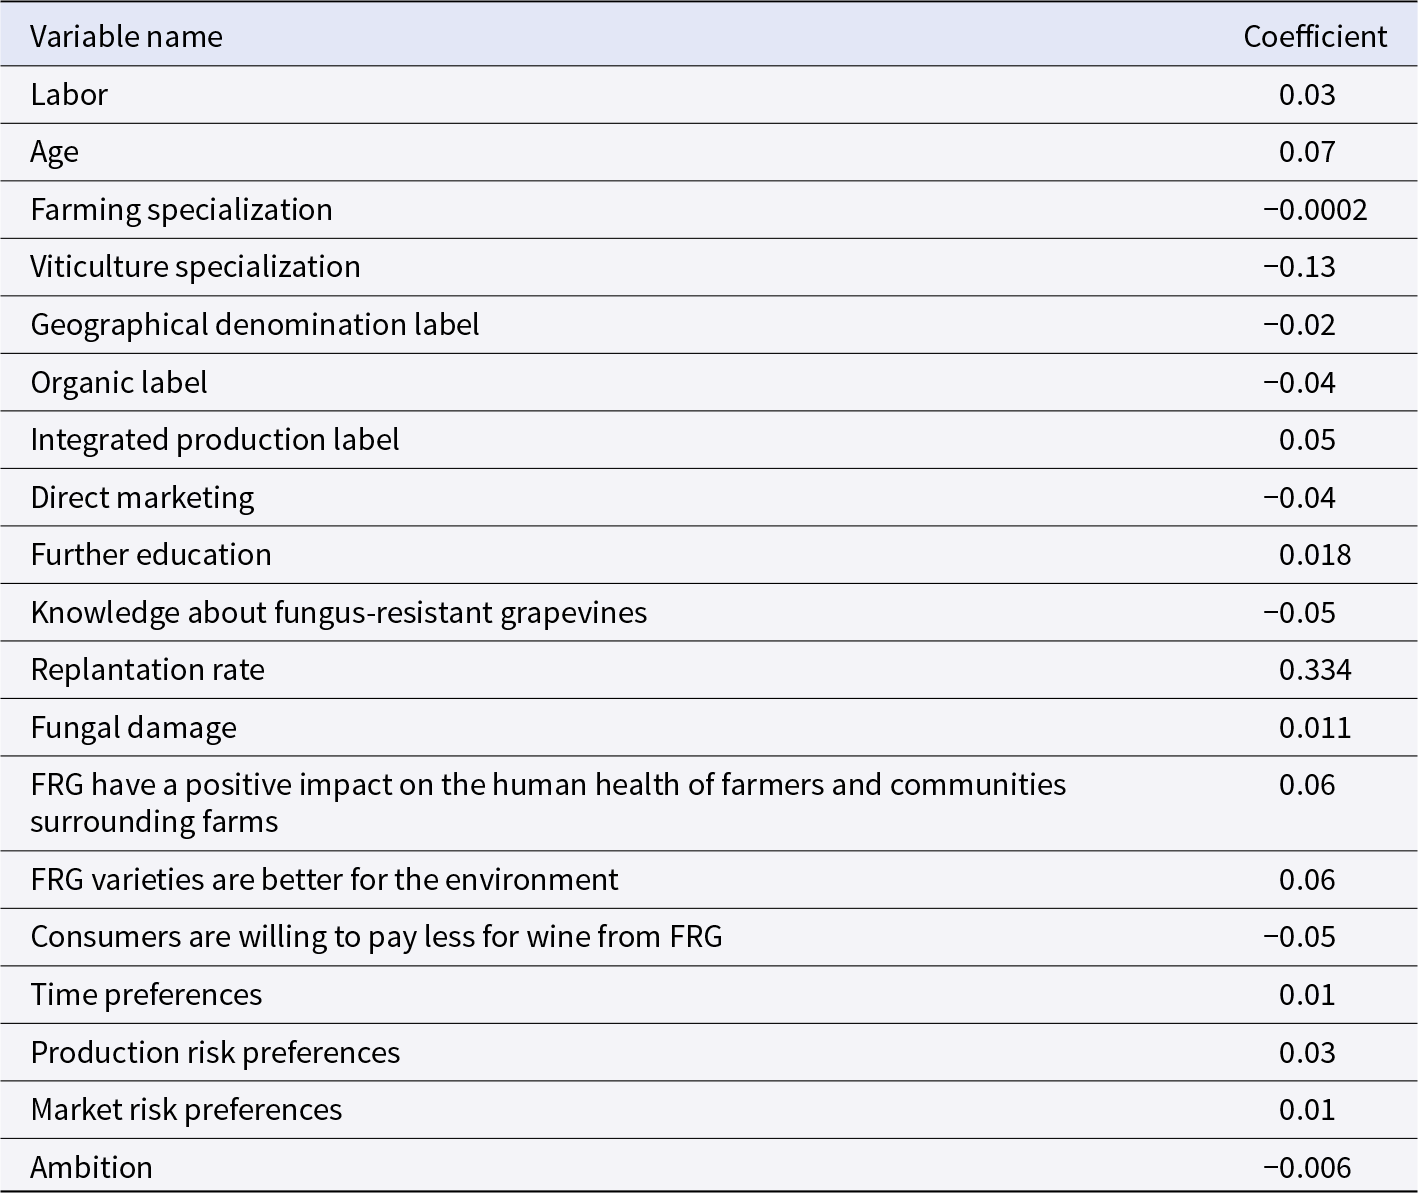
Refer to Table 1 for a description of the included variables in our model and to Zachmann, McCallum, and Finger (Reference Zachmann, McCallum and Finger2023b) for detailed information on data collection. Table 1 also reports the coding of the variables and the expected effects.Footnote 11
Description of variables

Notes: The focus here is on technology adoption, since improved varieties such as fungus-resistant grapevines are considered new technologies in the literature (e.g., Doss, Reference Doss2006; Shiferaw et al., Reference Shiferaw, Kassie, Jaleta and Yirga2014). For the expected effect, + refers to an expected increase, – to a decrease, and 0 stands for no change in the expected change of the share of land devoted to fungus-resistant varieties. Refer to online Supplementary Material B for the derivation of the expected effects and sources.
IV. Results
A. Descriptive results
At the time of the survey in 2022, 40.1% of the grapevine growers in the sample had at least one fungus-resistant variety cultivated. This is an increase of around 100% compared to 2016–2018 (Finger, Zachmann, and McCallum, Reference Finger, Zachmann and McCallum2023). However, the unweighted average of the farm-level shares of land that are devoted to fungus-resistant varieties is still low, at 10.2%. This represents an increase of 42% from 7.2% in 2016–2018.Footnote 12 The expected farm-level share of land devoted to fungus-resistant varieties in ten years, as stated by survey participants, is 27.4%, thus increasing by 169%.
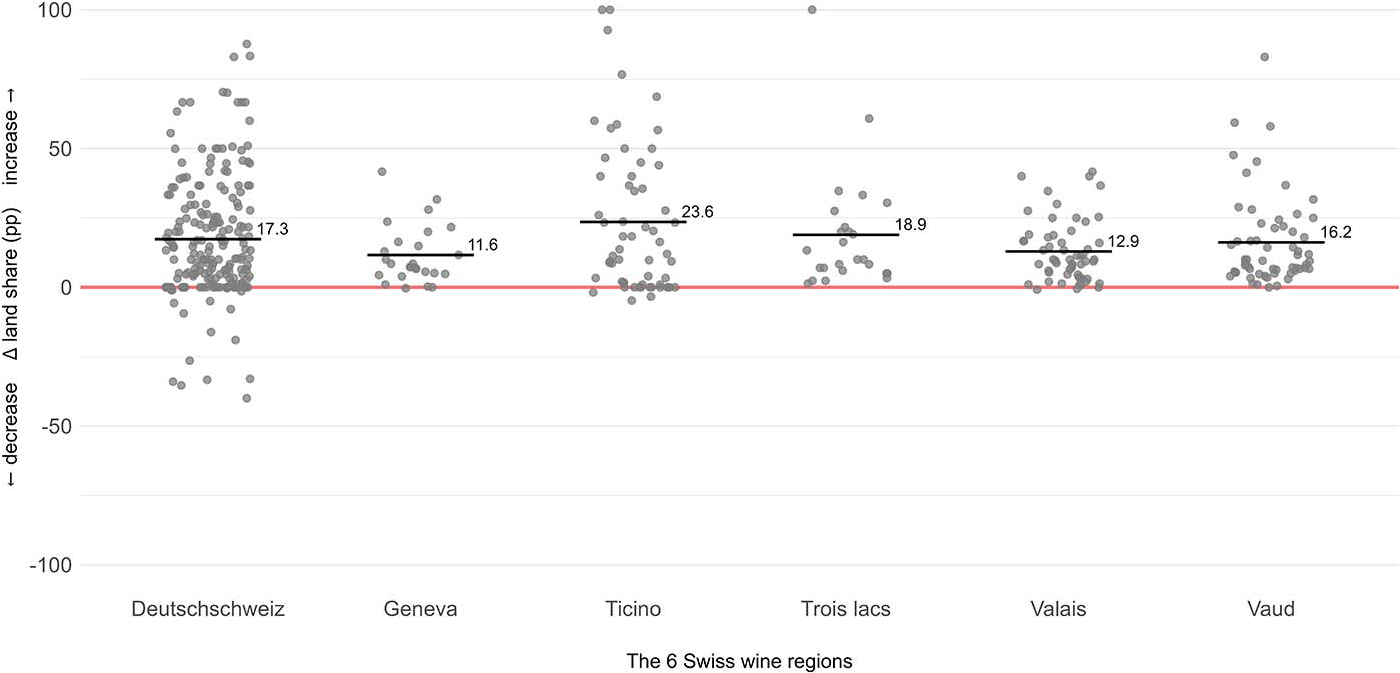
Figure 2 shows the change in percentage points (pp) between the expected share of land devoted to fungus-resistant varieties in ten years and the current shares per farm and wine region. Although a few grapevine growers in the German-speaking part of Switzerland and Ticino report a decrease in their land devoted to fungus-resistant varieties (N = 22 out of 436), the large majority expects an increase in the plantation intensity of fungus-resistant varieties. The change is largest in Ticino (on average 24pp), the Trois Lacs region (19pp), and the German-speaking part of Switzerland (17pp), and lower in Vaud (16pp), Valais (13pp), and Geneva (12pp).Footnote 13
Change in expected land share devoted to fungus-resistant varieties per farm and region (percentage points).

B. Regression results
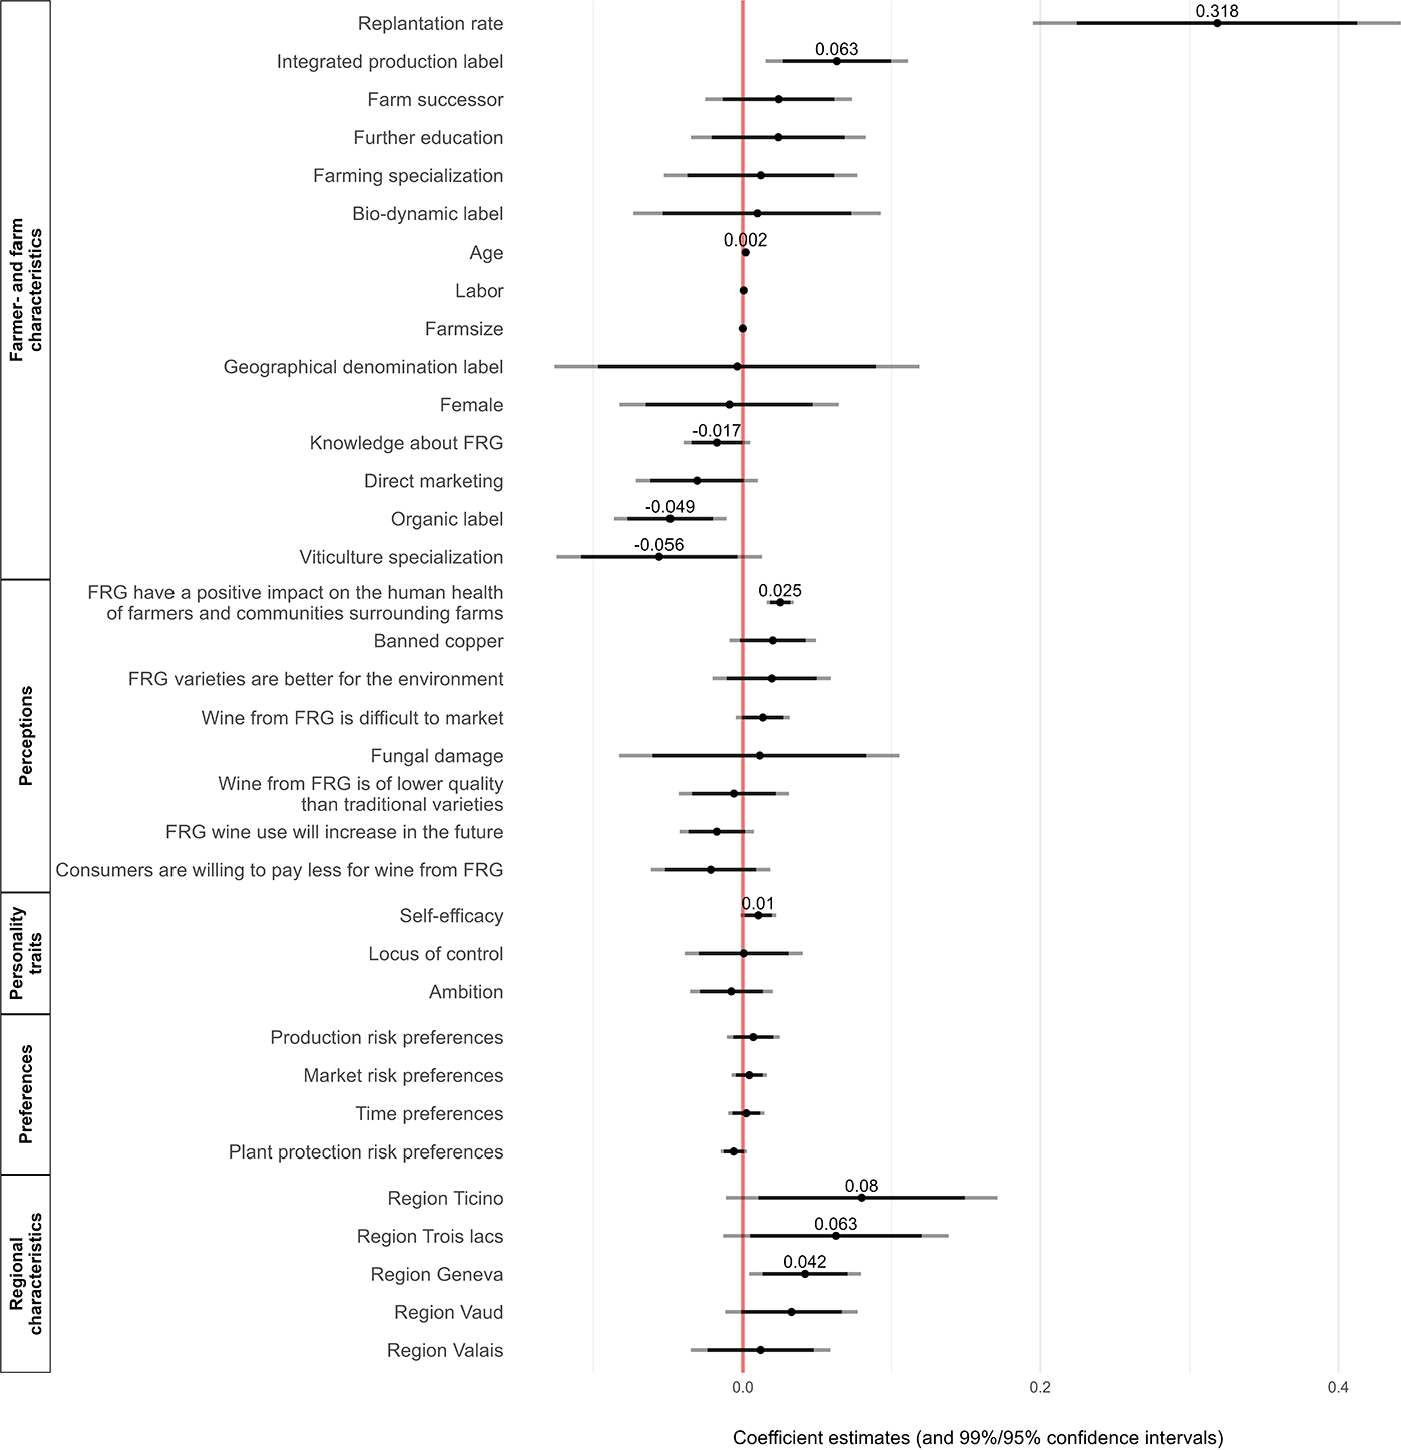
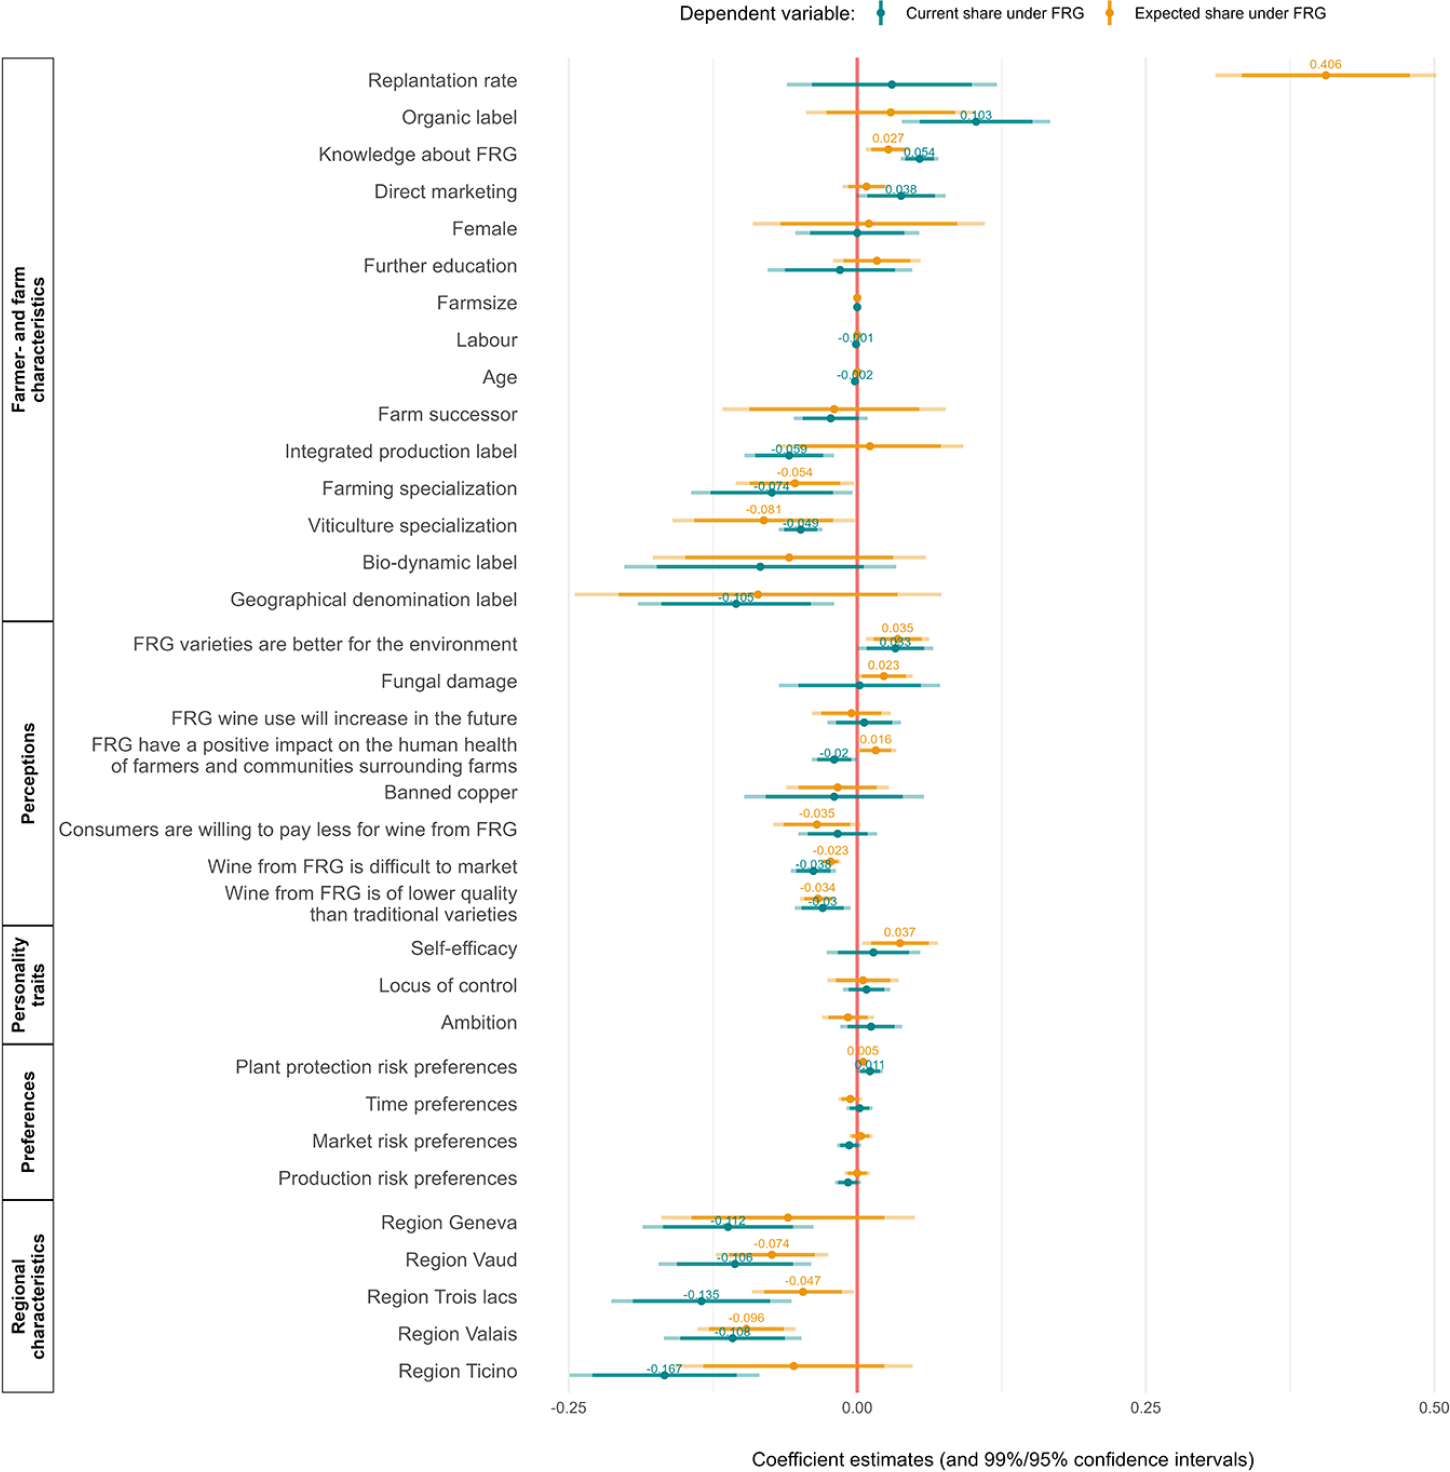
Figure 3 reports coefficient estimates and 99%/95% confidence intervals from Model 1. Coefficient estimates are vertically ordered from farmer- and farm characteristics to perceptions, personality traits, preferences, and regional characteristics.
Coefficient plots and 99%/95% confidence intervals from Model 1.

Figure 3 shows that the expected replantation rate has a large positive effect on the expected future change of fungus-resistant varieties. A 1pp increase in the replantation rate is associated with a 0.32pp increase in the land devoted to fungus-resistant varieties.Footnote 14 Moreover, grapevine growers who produce under integrated production expect to increase their share under fungus-resistant varieties by 6.3pp compared to the baseline (i.e., conventional grapevine growers excluding integrated production).Footnote 15 Contrary to this, organic producers expect to decrease their share under fungus-resistant varieties by 4.9pp compared to the baseline. Generally, we find that conventional grapevine growers (i.e., non-organic growers) expect to increase their land devoted to fungus-resistant grapevine varieties more compared to organic producers (Appendix F). Furthermore, we find that grapevine growers who perceive fungus-resistant varieties to be advantageous for human health of farmers and communities surrounding farms (compared to traditional varieties) indicate that they should increase their share. More specifically, a grapevine grower with the strongest agreement that fungus-resistant varieties have a positive impact on human health indicates increasing the land under fungus-resistant varieties by 10pp more compared to a grapevine grower with the strongest disagreement (5 vs. 1 on the Likert scale).
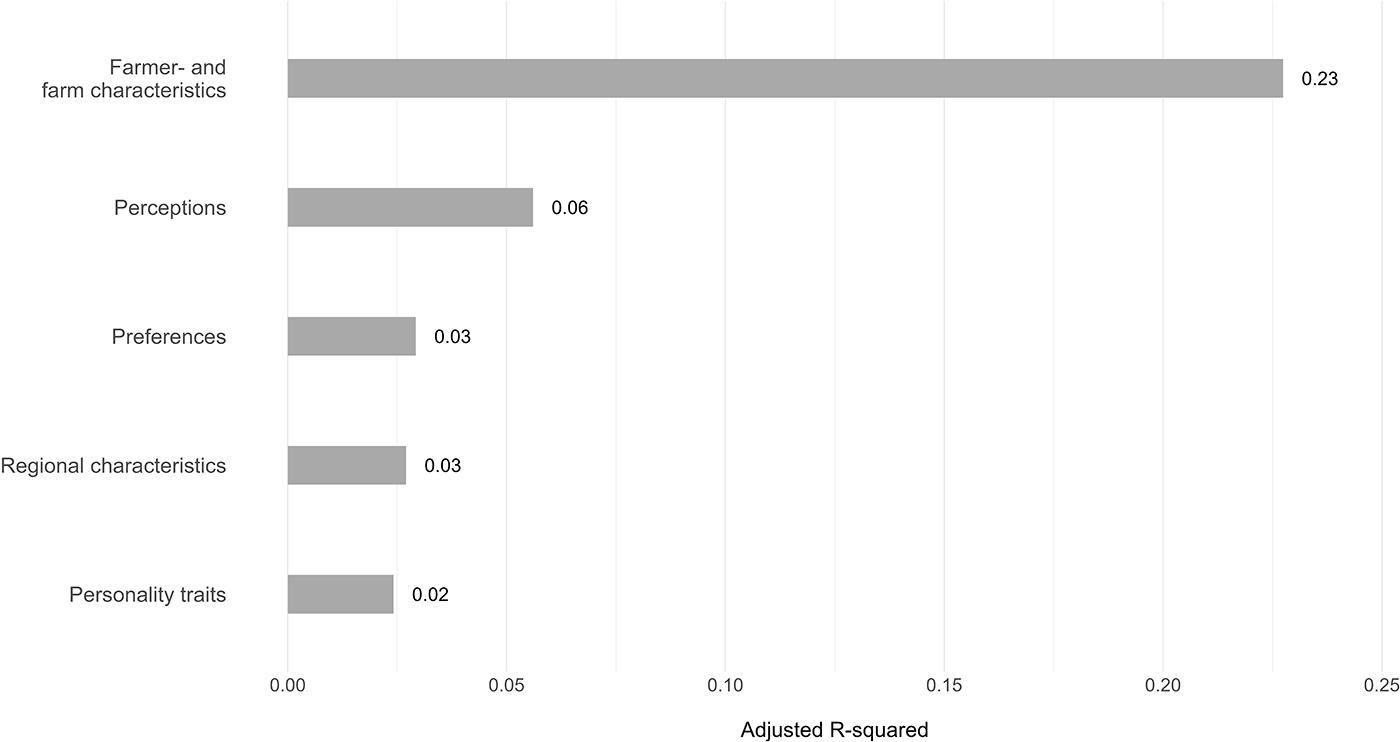
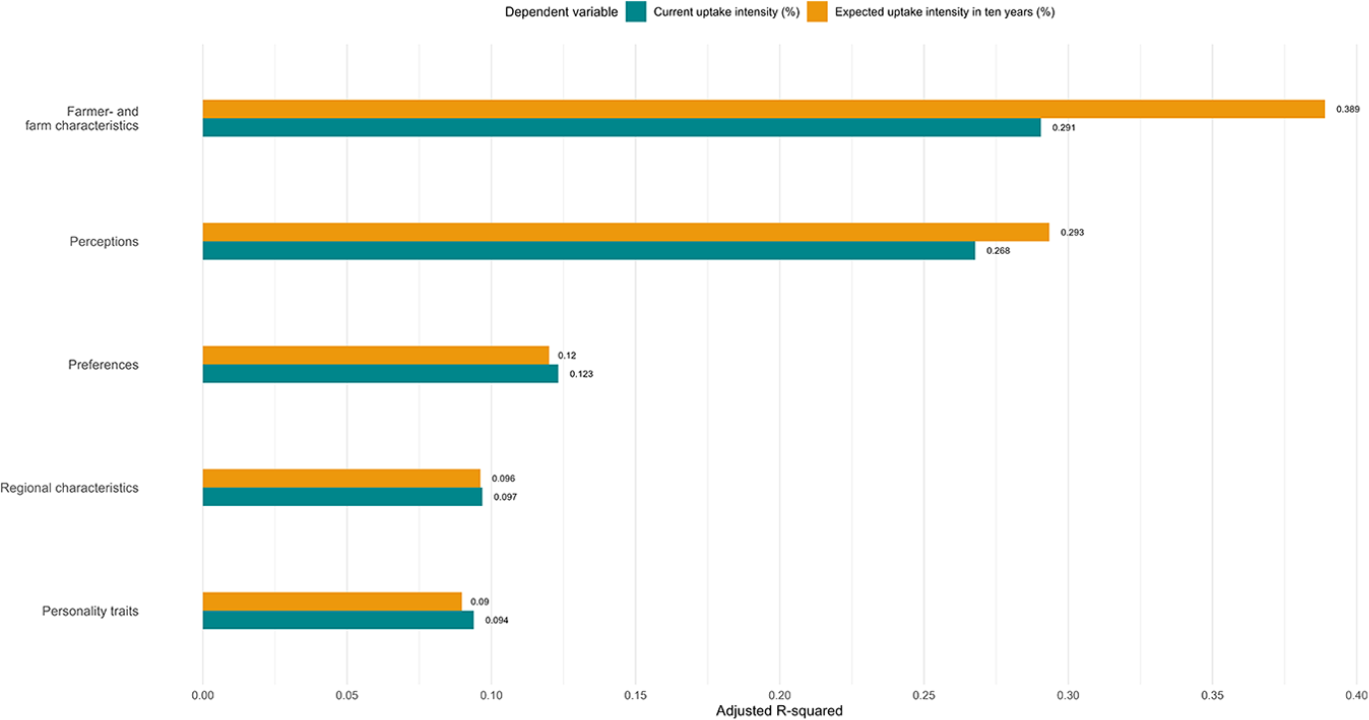
Overall, we find that farm- and farmer characteristics and, as such, structural factors explain most of the change between the future expected share of land devoted to fungus-resistant varieties and the current share, as shown in Figure 4. The figure reports the adjusted R-squared, that is, coefficients of determination of models only including the variables of each group.
Relevance of groups on the adoption dynamics of fungus-resistant varieties.

C. Robustness checks
Our results remain robust to several tests and further analyses.
First, variance inflation factors confirm that there is little concern for multicollinearity among the variables (Appendix D). However, grapevine growers’ time preferences and risk preferences play a role when separately included into Model 1 (together with uncorrelated control variables). Specifically, growers who are more willing to give up something today to benefit more from it in the future and are more willing to take risks in the marketing and production domain indicated an increase in the share of land devoted to fungus-resistant varieties. Moreover, a LASSO regression shows that the main variables under discussion are also selected with this mechanical approach, yielding similar levels and directions of the effects.
Second, regressions on the current and expected plantation intensities reveal patterns that are in line with existing studies (Appendix E). For instance, current adopters cultivate their grapes mainly with organic methods and market their wines directly to consumers (e.g., Finger, Zachmann, and McCallum, Reference Finger, Zachmann and McCallum2023). Additionally, grapevine growers with high self-assessed knowledge regarding fungus-resistant varieties use more of these varieties, as well as those who perceive that fungus-resistant varieties are better for the environment compared to traditional varieties. Contrarily, growers who perceive fungus-resistant varieties to be better for the health of farmers and surrounding communities currently have less land devoted to these varieties.
Third, we indicate that grapevine growers are certain about the projection of their expected land share under fungus-resistant varieties in ten years (Appendix G).
D. Discussion
Our results show that over the next ten years, approximately 4,876 ha of land in Switzerland will be newly planted with grapevines, with 1,560 ha devoted to fungus-resistant varieties.Footnote 16 The expected share of land devoted to fungus-resistant varieties in ten years’ time is 27.4%. Ceteris paribus, this means that the number of pesticide treatments in vineyards will be reduced massively, at least by around 32,000 treatments per year (see online Supplementary Material C). This implies major economic savings at the farm level as well as reduced impacts on the environment. Moreover, it aligns with recent societal demand and policy goals to reduce pesticide use (Finger, Reference Finger2021).
Furthermore, our results suggest that current (early adopters) are mainly farms producing under organic standards. However, we also find that important future adopters will be conventional, that is, non-organic growers. This is in line with existing literature suggesting that fungus-resistant varieties are one important instrument in integrated pest management but not a stand-alone solution (e.g., Pertot et al., Reference Pertot, Caffi, Rossi, Mugnai, Hoffmann, Grando, Gary, Lafond, Duso, Thiery, Mazzoni and Anfora2017). Moreover, a large supermarket chain, which is a major player in the Swiss wine market, and an organization of integrated producers in Switzerland recently established a sustainable wine label with a focus on reducing pesticide use. Using fungus-resistant varieties is one of the strategies growers can use to achieve these reductions and produce under the new label. Such industry collaborations and the corresponding price markups for growers may be crucial for the adoption dynamics of fungus-resistant varieties.
V. Conclusions and policy implications
Fungus-resistant grapevines offer a unique opportunity to reduce pesticide use in agriculture and thus meet pesticide risk reduction targets. Using a sample of 436 Swiss grapevine growers, we investigate future adoption dynamics of fungus-resistant varieties and how these are influenced by a wide range of factors. Our results suggest that grapevine growers in Switzerland expect to devote a large share of their new plantings over the next decade to these varieties. Specifically, we find that one-third of new plantings in the next decade will be fungus-resistant varieties. As a result, the expected share of land devoted to fungus-resistant varieties in ten years is 27.4% (compared to 10.2% in 2022), thus increasing by 169%. Farmer- and farm characteristics explain most of the variability in the future expected adoption dynamics, followed by growers’ perceptions, preferences, regional characteristics, and personality traits.
Our results have important public and industry policy conclusions. Fungus-resistant varieties will become more relevant in the near future. Grapevine growers see a large growth in land devoted to fungus-resistant varieties, which would have massive implications for pesticide use in Swiss agriculture. Policy shall pick up this opportunity and support this process further, tailoring a mix of policy instruments to farmer- and farm characteristics.
First, in competitive wine markets, niche products like low-pesticide wine may be attractive to grapevine growers looking to differentiate (Masset and Weisskopf, Reference Masset, Weisskopf, Ugaglia, Cardebat and Corsi2019). Labeling low-/no pesticide wine could thus encourage the adoption of fungus-resistant varieties.
Second, partnerships between grapevine growers (associations) and industry organizations like retailers and cooperatives could reach more growers and consumers and help reduce the risks and costs for grapevine growers in adopting fungus-resistant varieties, thus helping to timely and thoroughly reduce pesticide use and risks across the sector (e.g., Möhring and Finger, Reference Möhring and Finger2022).
Third, since our results predict a substantial increase in the land devoted to fungus-resistant varieties, agricultural policy can help facilitate the exchange of experience between grapevine growers regarding fungus-resistant varieties as well as ensuring the availability of sufficient planting material. Given the currently low intensity of cultivation and the associated low level of experience with these varieties (e.g., regarding pesticide treatments, agronomy, vinification, availability, and marketing), sharing knowledge, and conducting demonstration plots, trials, and evaluations on local farms or at research stations may help increase self-efficacy about fungus-resistant varieties that positively influences future adoption in our sample. Our results give support for specific targeting of action toward some producers that are less likely to adopt fungus-resistant varieties and/or regions where adoption is needed (e.g., due to pollution problems).
Varietal adaptations are lengthy processes, so it is important to focus on long-term expectations. However, this presents a challenge because it relies on hypothetical predictions rather than actual planting decisions. However, the use of intentions is common in the literature since it is one of the few options for expectation elicitations and, in most cases, reflects actual ex-post behavior.
Future research could study the determinants of the adoption dynamics of grapevine growers in different contexts and use novel methods. Specifically, investigating causal mechanisms relevant for the adoption of fungus-resistant varieties is of great value for understanding factors influencing grapevine growers’ decision-making toward low-pesticide practices.
Supplementary material
The supplementary material for this article can be found at https://doi.org/10.1017/jwe.2023.36
Acknowledgments
The authors thank the producers who answered the survey. We also thank the editor and anonymous reviewers for helpful feedback.
Competing interests
The authors declare no competing interests and acknowledge the support of the Swiss National Science Foundation under the project “Evidence-based Transformation in Pesticide Governance” (Grant 193762).
A. Economic relevance of wine grape production
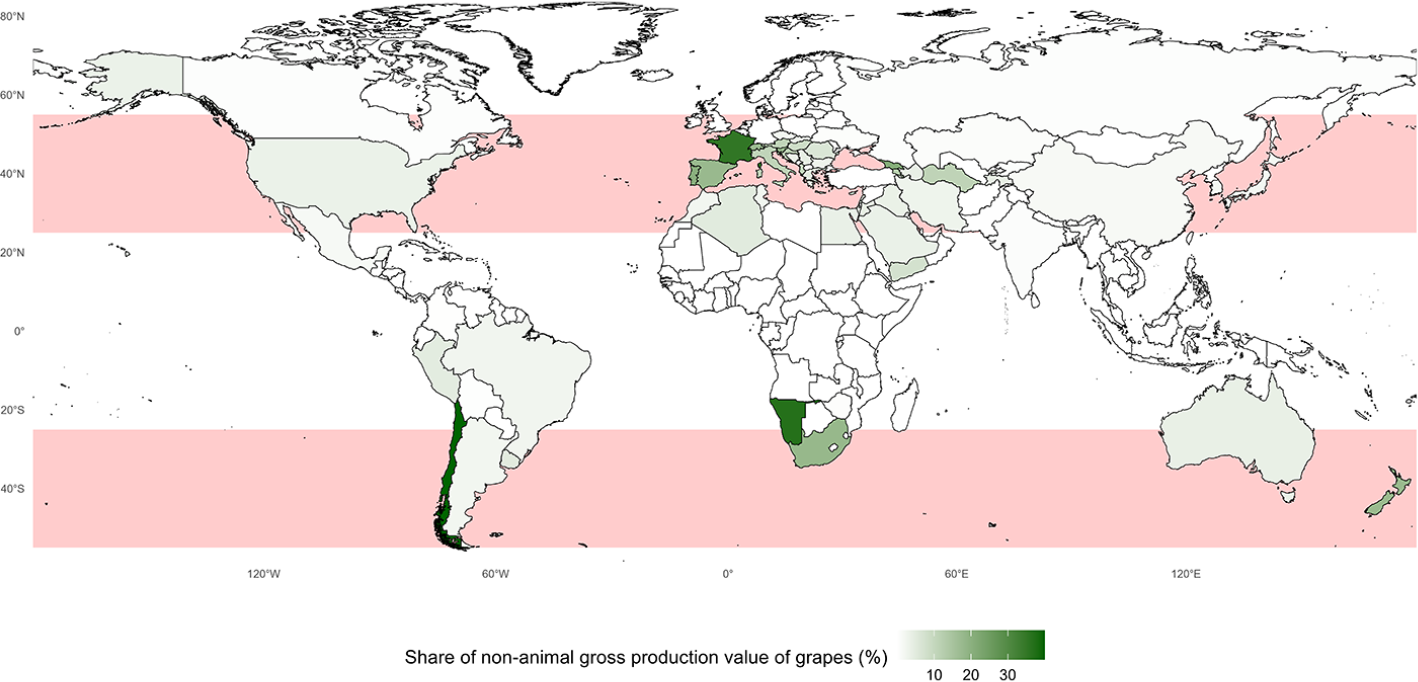
Figure A1 shows the share of gross production values from grapes from total non-animal production averaged between 2010 and 2020. Countries with no data available are shown in white. The red-highlighted areas identify regions in the 25th and 55th parallel in both the northern and southern hemispheres where most wine production takes place. The figure illustrates that for countries where wine grapes are grown, they are highly economically relevant, accounting for shares of gross production values from total non-animal production between 20 and 30%.
Global economic relevance of wine grape production.

B. Reduction potential of fugus-resistant varieties
Table B1 shows a literature review of the reduction potential of fungus-resistant varieties across Europe. Thus, the reduction potential of fungus-resistant varieties is substantial (at around 80%) in different contexts (e.g., countries, climates, etc.).
Literature review on reduction potentials of fungus-resistant varieties

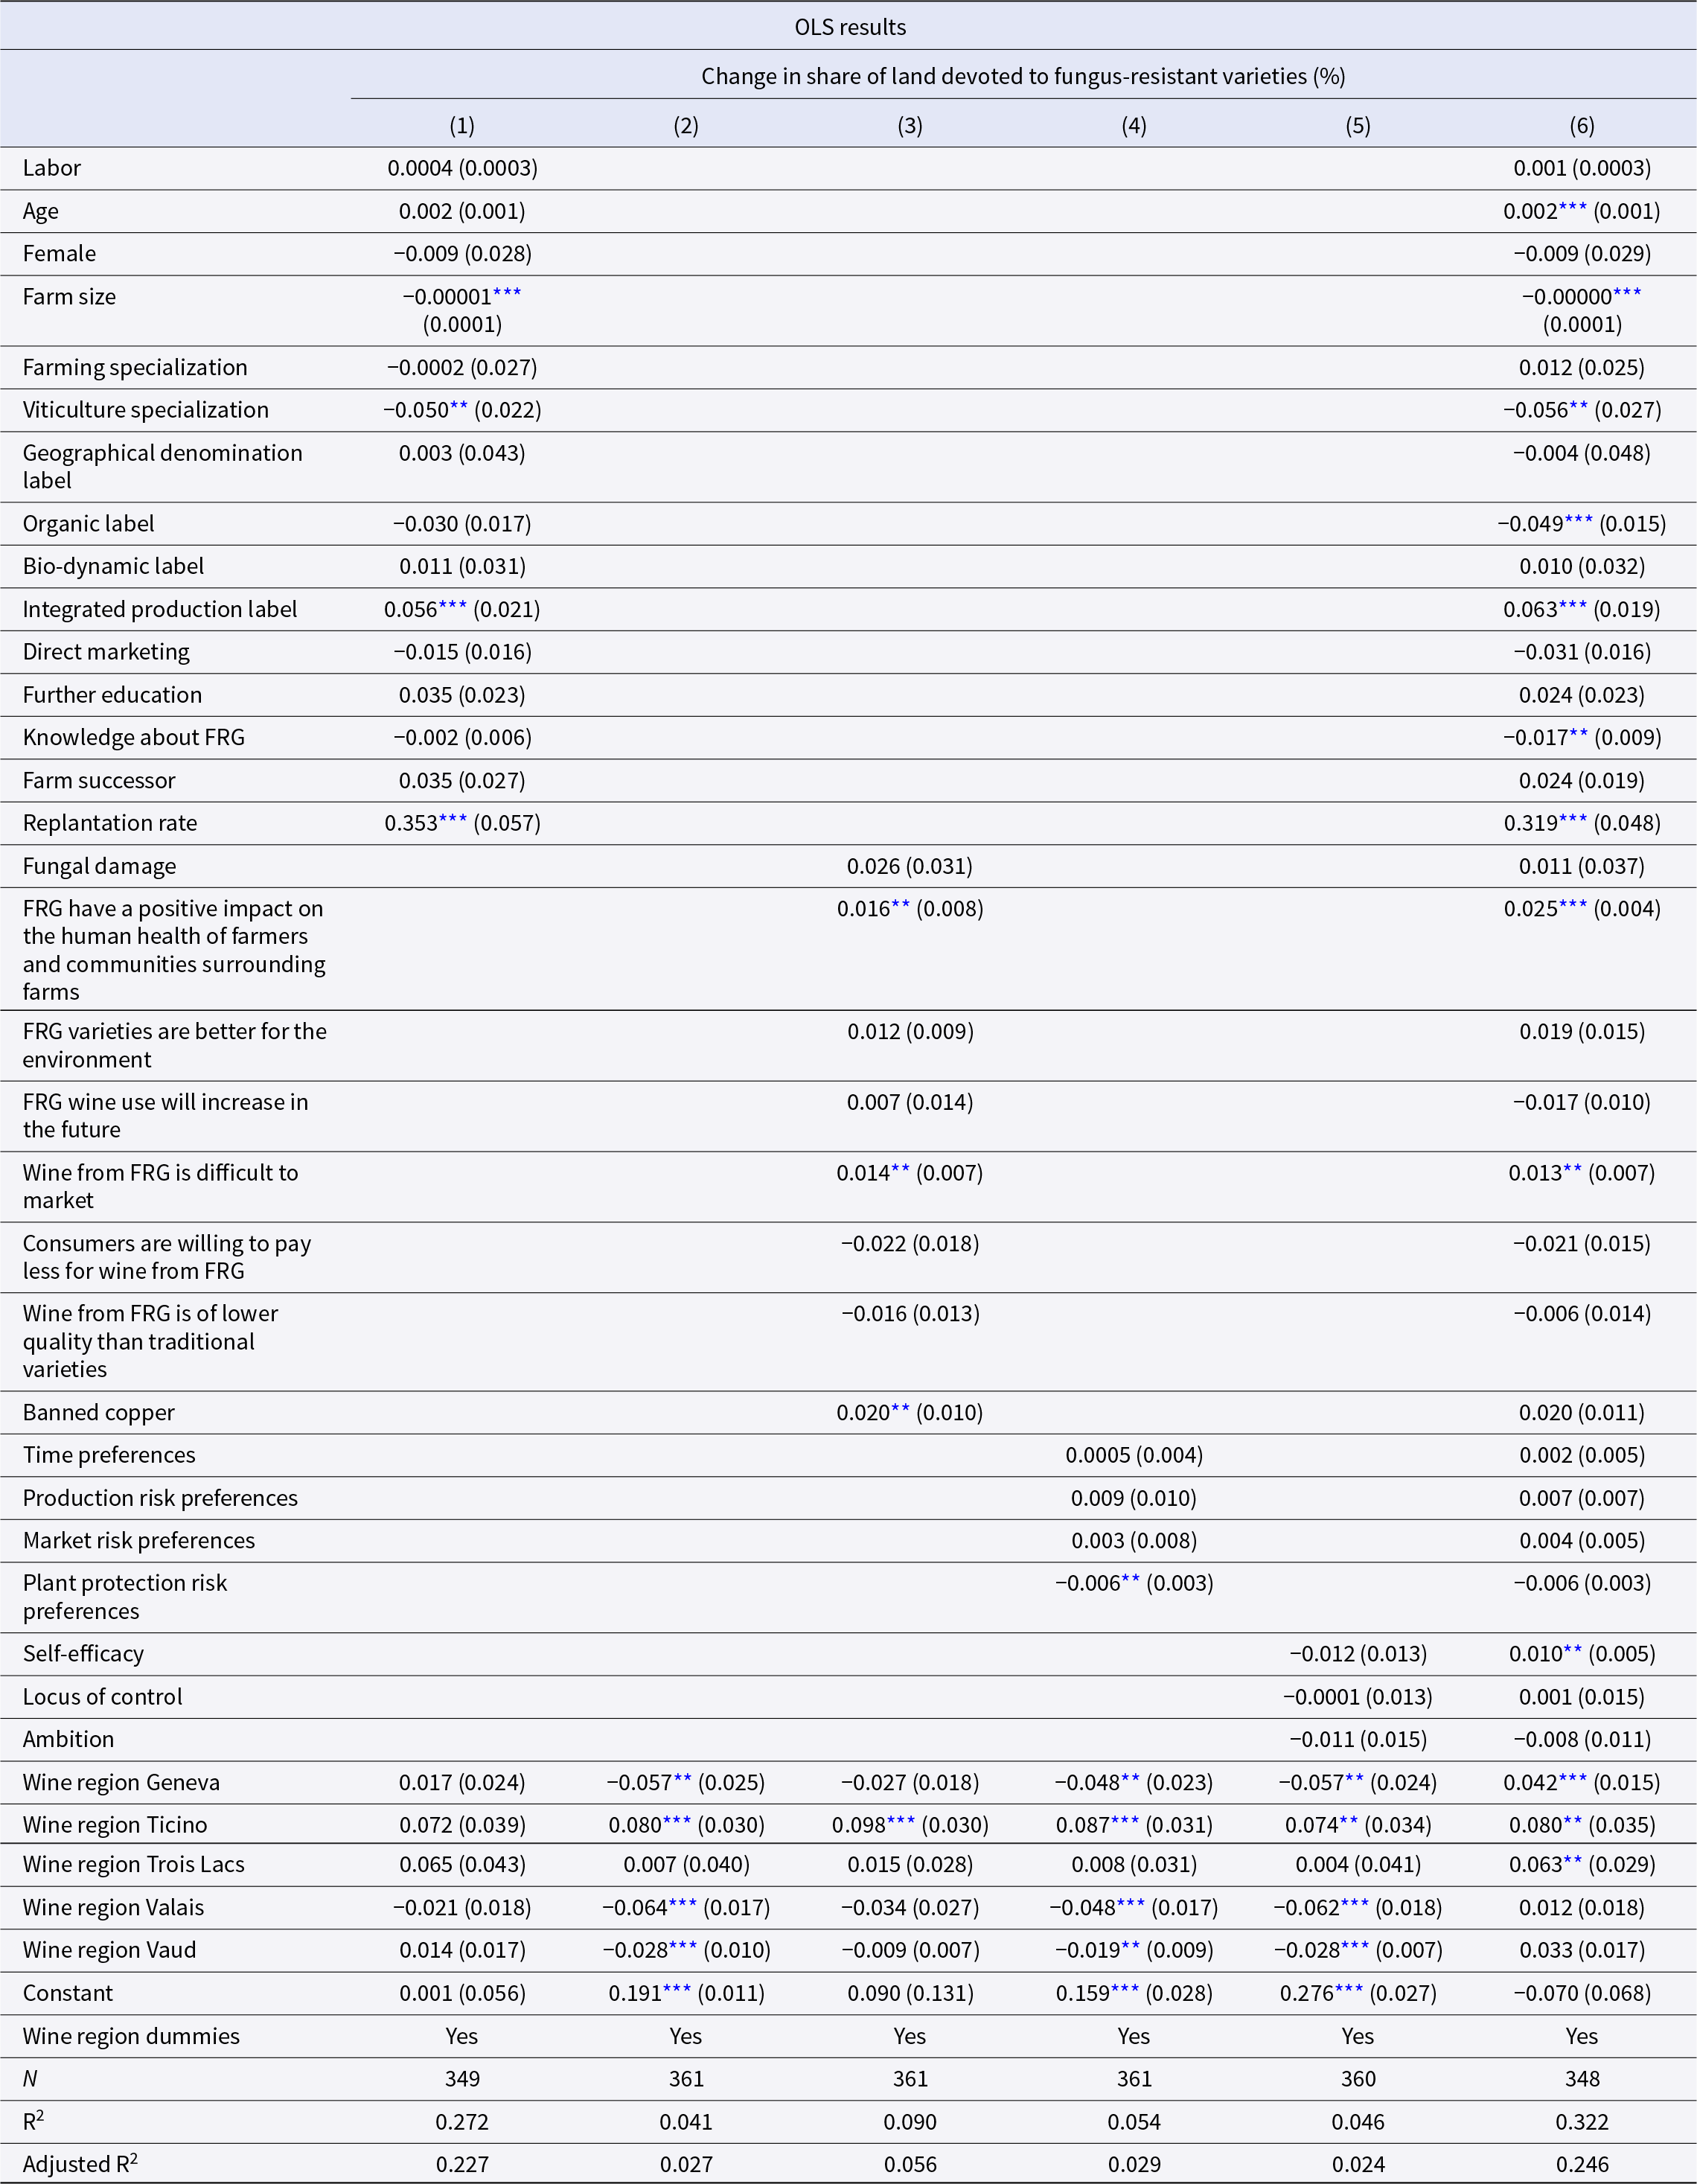
C. Regression results full table
Table C1 reports full regression results from Model 1. Column (1) includes only farmer- and farm characteristics, Column (2) regional factors, Column (3) perceptions, Column (4) preferences, Column (5) personality traits, and finally, Column (6) all variables jointly (this is the base for Figure 3).
Full regression output from Model 1

*** Significant at the 1 percent level.
** Significant at the 5 percent level.
Notes: Clustered and wild bootstrapped standard errors in the wine region are shown in parentheses.
D. Correlations between variables
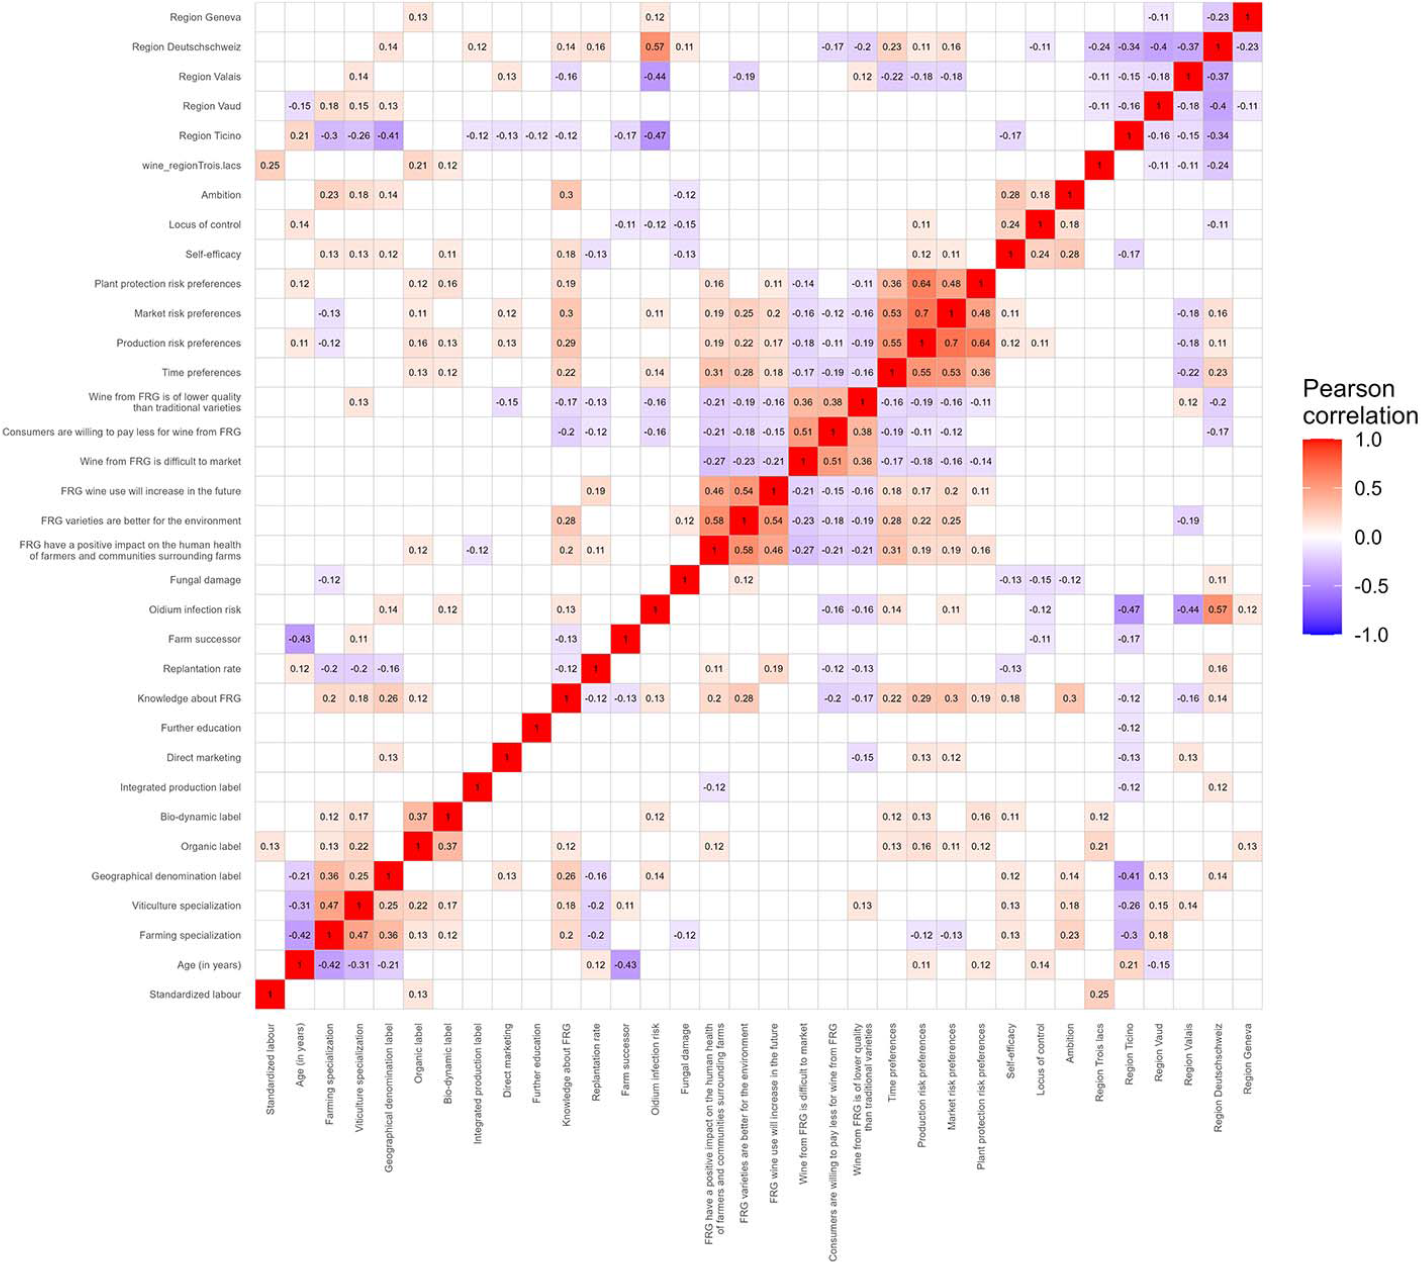
Since our model includes many variables that may be correlated with each other, biasing both the magnitude and precision of the estimated effects, we conduct tests for potential multi-collinearity among the variables included in our main model. We start with a correlation matrix (see Figure D1).
Correlation matrix of all variables.

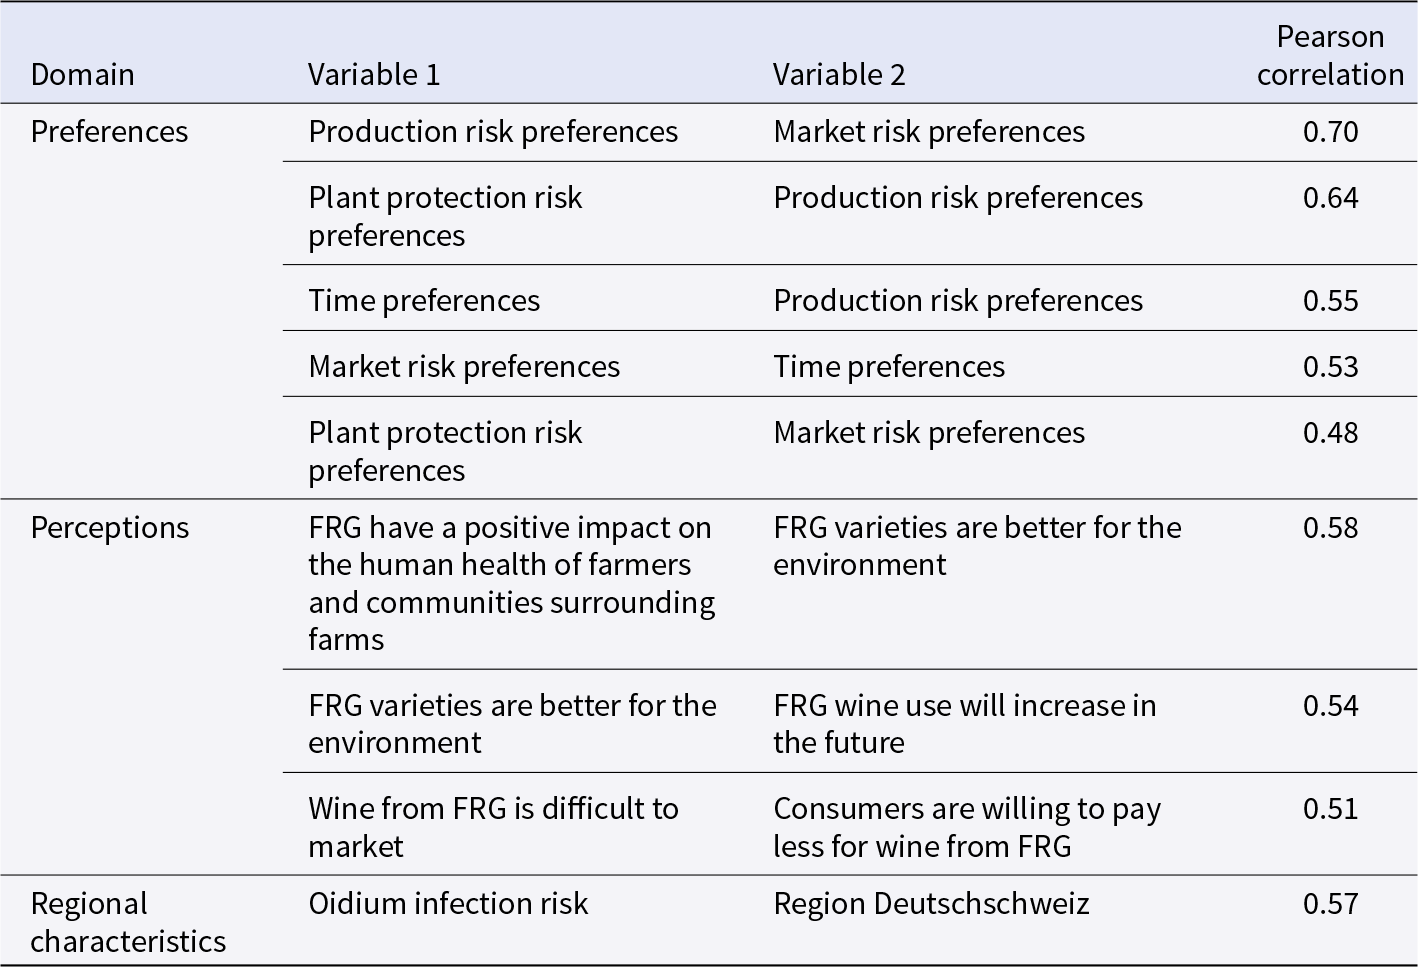
Figure D1 shows correlations between all variable pairs. We use as a threshold for correlations among variables the top 95th percentile of the significant correlation distribution (e.g., | $\rho $| > 0.4705). As a result, we find correlated blocks of variables in the domains of preferences, perceptions, and regional characteristics (see Table D1).
Correlated variables

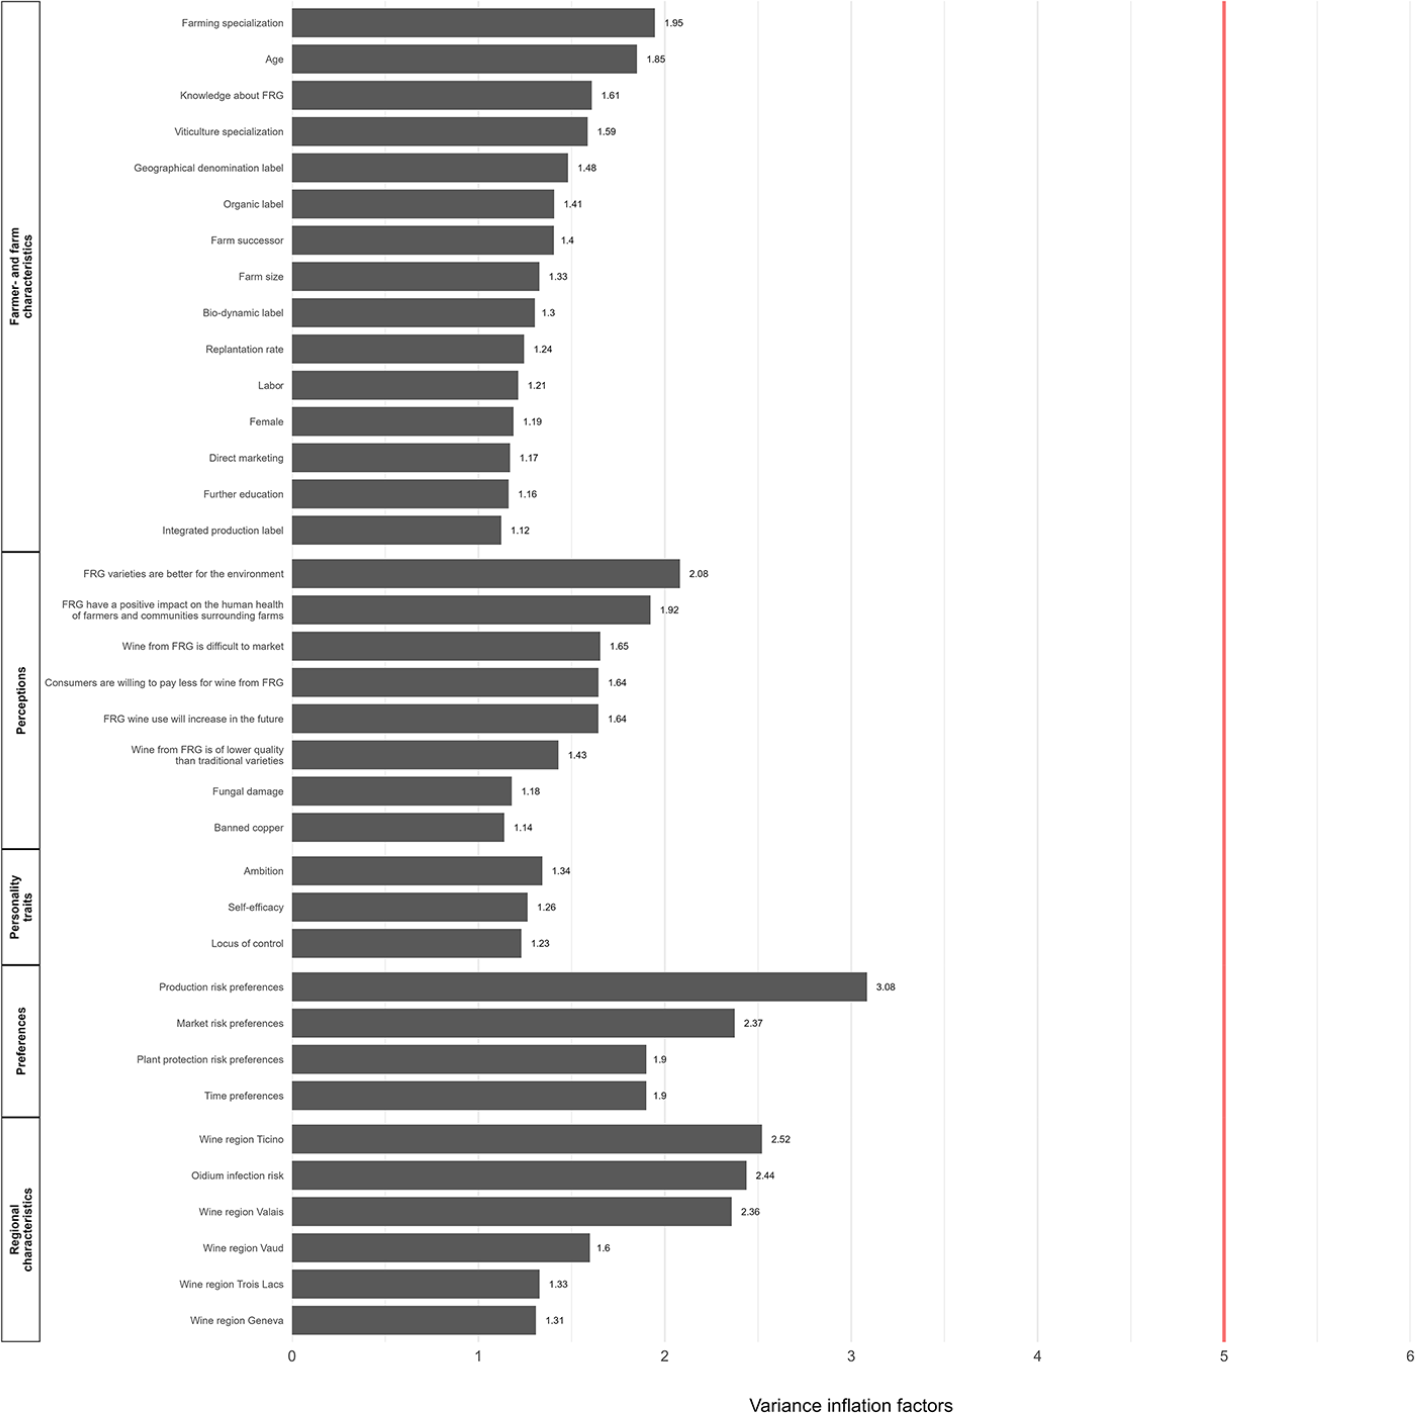
Next, we calculate variance inflation factors (VIF) from Model 1, including all predicting variables (except for region Deutschschweiz due to perfect collinearity). We use 5 as a critical factor to determine whether multicollinearity is present (e.g., Akinwande, Dikko, and Samson, Reference Akinwande, Dikko and Samson2015). Figure D2 reports that no variable has a variance inflation factor that is larger than 5. However, the same variable blocks as shown in Table D1 depict large variance inflation factors.
Variance inflation factors.

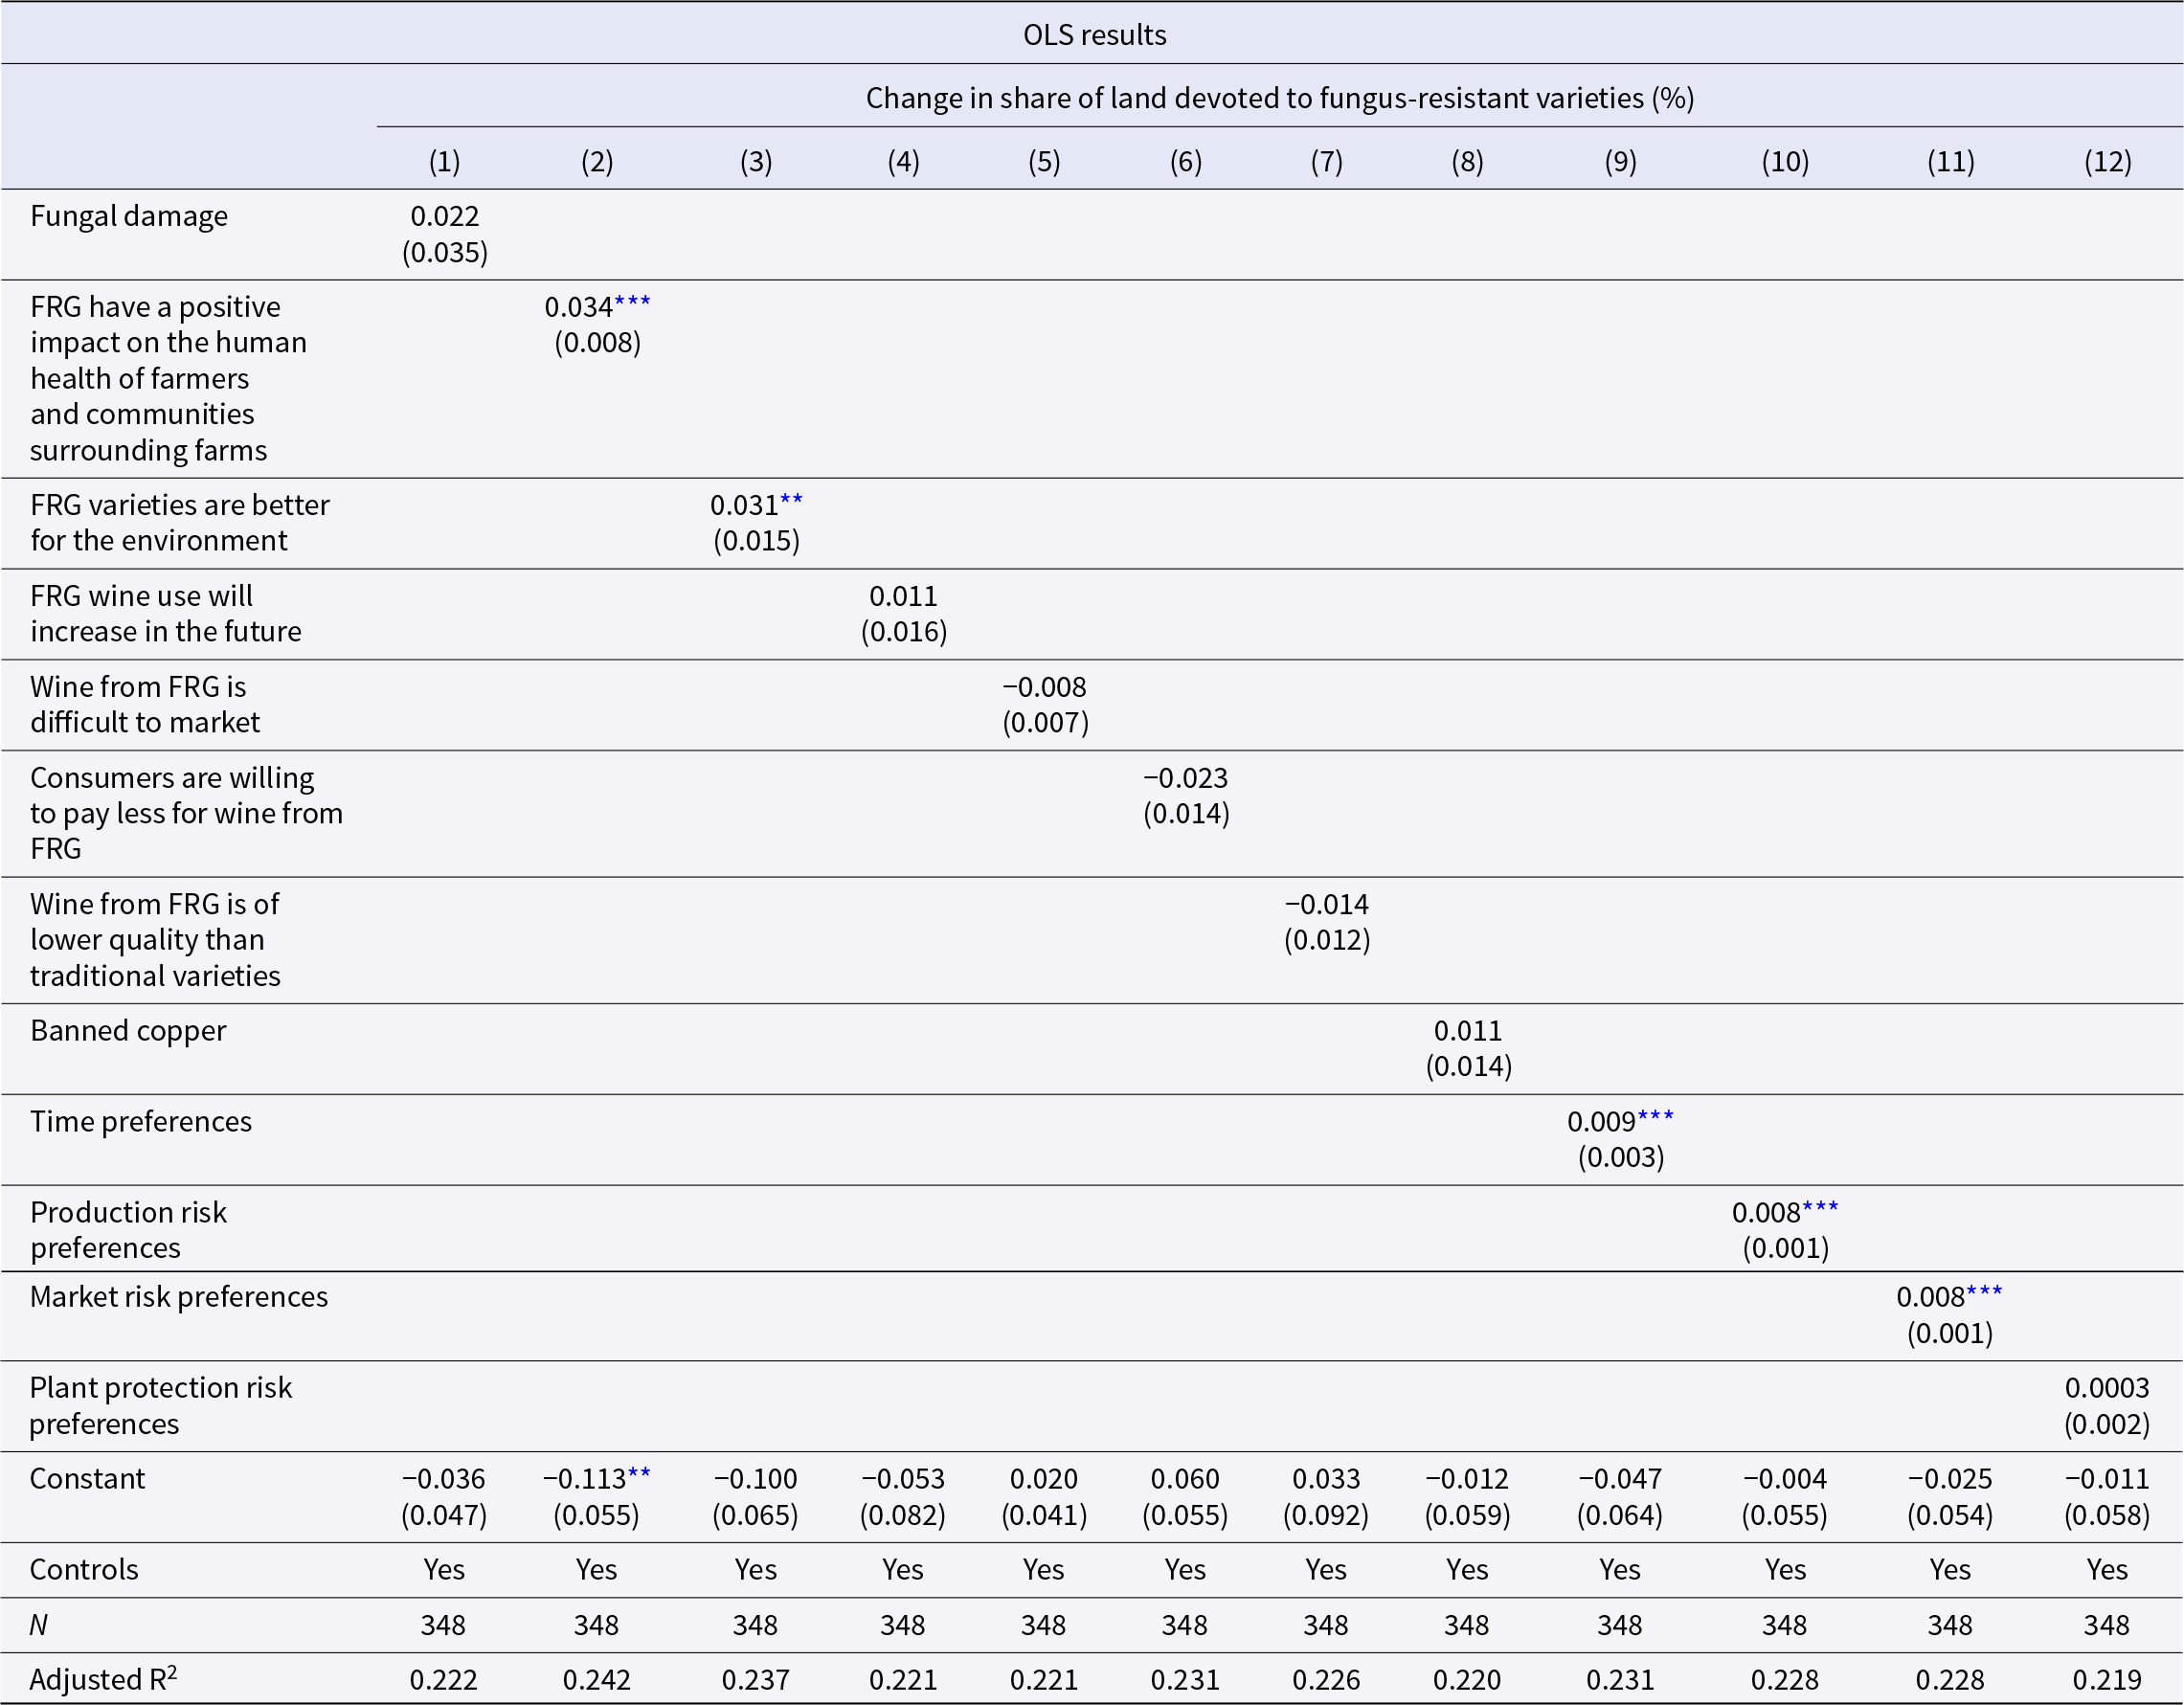
Therefore, we include perceptions and preferences separately into Model 1 to see if sign and significance change due to correlations. Table D2 reports that we do not observe any changes to the sign of the respective coefficients; however, we estimate some of the preferences and perceptions with greater precision (at the 99%/95% confidence level). Specifically, grapevine growers who perceive fungus-resistant varieties to be better for human health of farmers and communities surrounding farms, or who perceive them to be better for the environment, indicate that they should increase their land under these varieties. Moreover, we find that grapevine growers who are more willing to give up something today in order to benefit more from it in the future (i.e., time preferences) indicate an increase in land share under fungus-resistant varieties. When separately included in Model 1, production and marketing risk preferences also play a role. Specifically, grapevine growers who are more willing to take risks in the production and marketing domain indicate that they will increase their share of fungus-resistant varieties in the next decade.
Separate inclusion of preferences and perceptions

*** Significant at the 1 percent level
** Significant at the 5 percent level.
Notes: Clustered and wild bootstrapped standard errors at the wine region are shown in parentheses.
Here we show output from LASSO regression using cross-validation to identify  ${\lambda _{{\text{min}}\left( {MSE} \right)}}$, which minimizes mean-square error. Table D3 shows the selected variables and their coefficients; it shows that the main variables under discussion are also selected with LASSO, as well as yielding similar levels and signs of the effects.
LASSO regression output

E. Regression results for current and expected uptake intensities
Figure E1 shows the barriers and determinants of the current and expected uptake intensities of fungus-resistant varieties. Both models use the full sample (N = 436).
Regression results for current and expected uptake intensities (%).

Figure E1 confirms that the replantation rate has a big impact on expected plantation intensity in ten years, but not on current plantation intensity. Moreover, organic grapevine growers have currently adopted fungus-resistant varieties more intensively, in contrast to grapevine growers under integrated production.
Figure E2 shows that farm- and farmer characteristics (29%) as well as perceptions (27%) explain the largest share of the variation in the current uptake intensity as measured by the adjusted R-squared, similar to the variability in expected land shares to fungus-resistant varieties in ten years with 39% of farm- and farmer characteristics and 29% of perceptions.
Adjusted R-squared for current and expected uptake intensities.

F. Current and expected share per production system and group
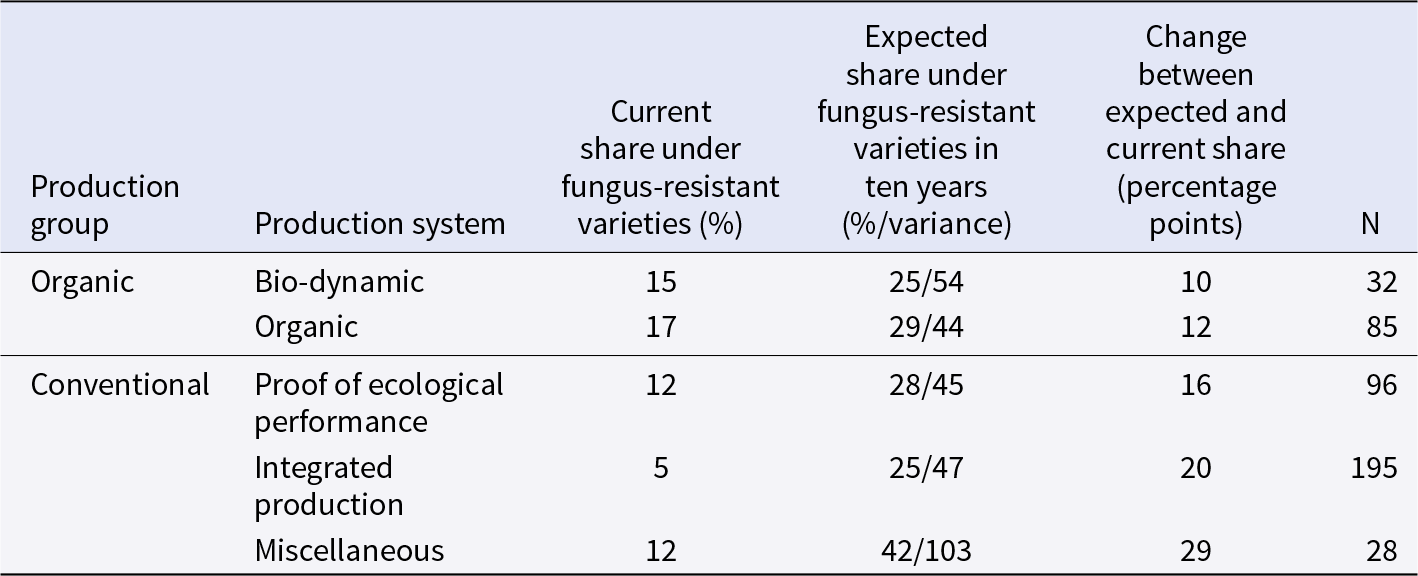
Table F1 shows that grapevine growers across all production systems are expected to increase their land devoted to fungus-resistant varieties on average, however, to varying degrees. For instance, grapevine growers under integrated production expect to increase their land from currently 5% to 25%. Similarly, grapevine growers farming under proof of ecological performance expect to increase their land from 12% to 28%. The change in land share devoted to fungus-resistant varieties is lower for organic and bio-dynamic producers that currently adopt more intensively, at 17% and 15%, respectively. Moreover, we see that grapevine growers who do not produce under a specific production system (and thus are not eligible for direct payments) expect to increase their share substantially (by 29pp), although subject to large uncertainty (mean variance of 103).
Current and expected share per production system

Note: Miscellaneous refers to grapevine growers who have not or indicated a different production system compared to the four mentioned (e.g., hobby growers, traditional production, etc.).
Thus, at the production group level, organic grapevine growers currently have 16% of their land devoted to fungus-resistant varieties, while for conventional growers this share is at 9.6%. In ten years, organic growers expect to have 27%, while conventional growers expect to have 31% of their land under fungus-resistant varieties.
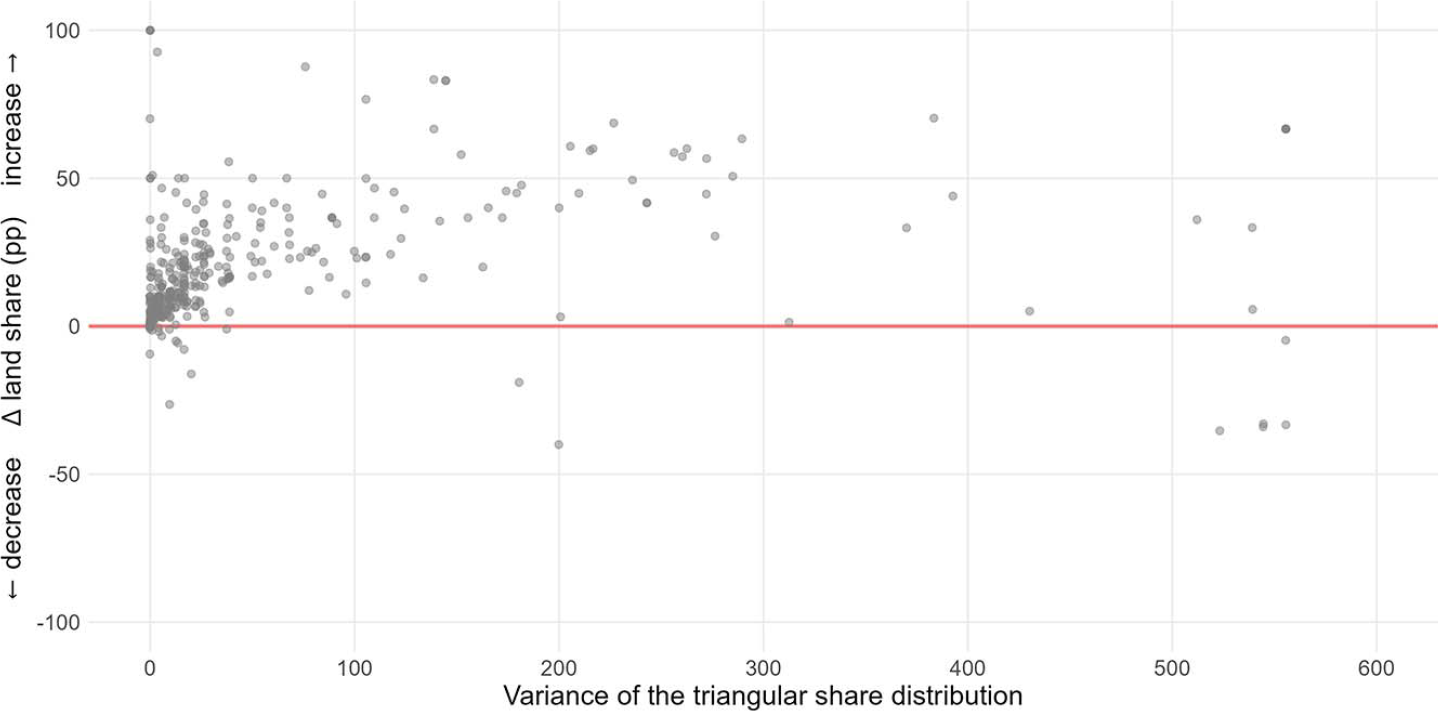
G. Uncertainty in the expected land share in ten years
We show the relationship between the change in the expected land share under fungus-resistant varieties (ten years and today) and the variance of the triangular distribution around the expected land share under fungus-resistant varieties. The variance is calculated as in Hardaker et al. (Reference Hardaker, Lien, Anderson and Huirne2015). Figure G1 shows that there is no clear relationship between the change in the expected land share and the uncertainty inherent in the long-term prediction.
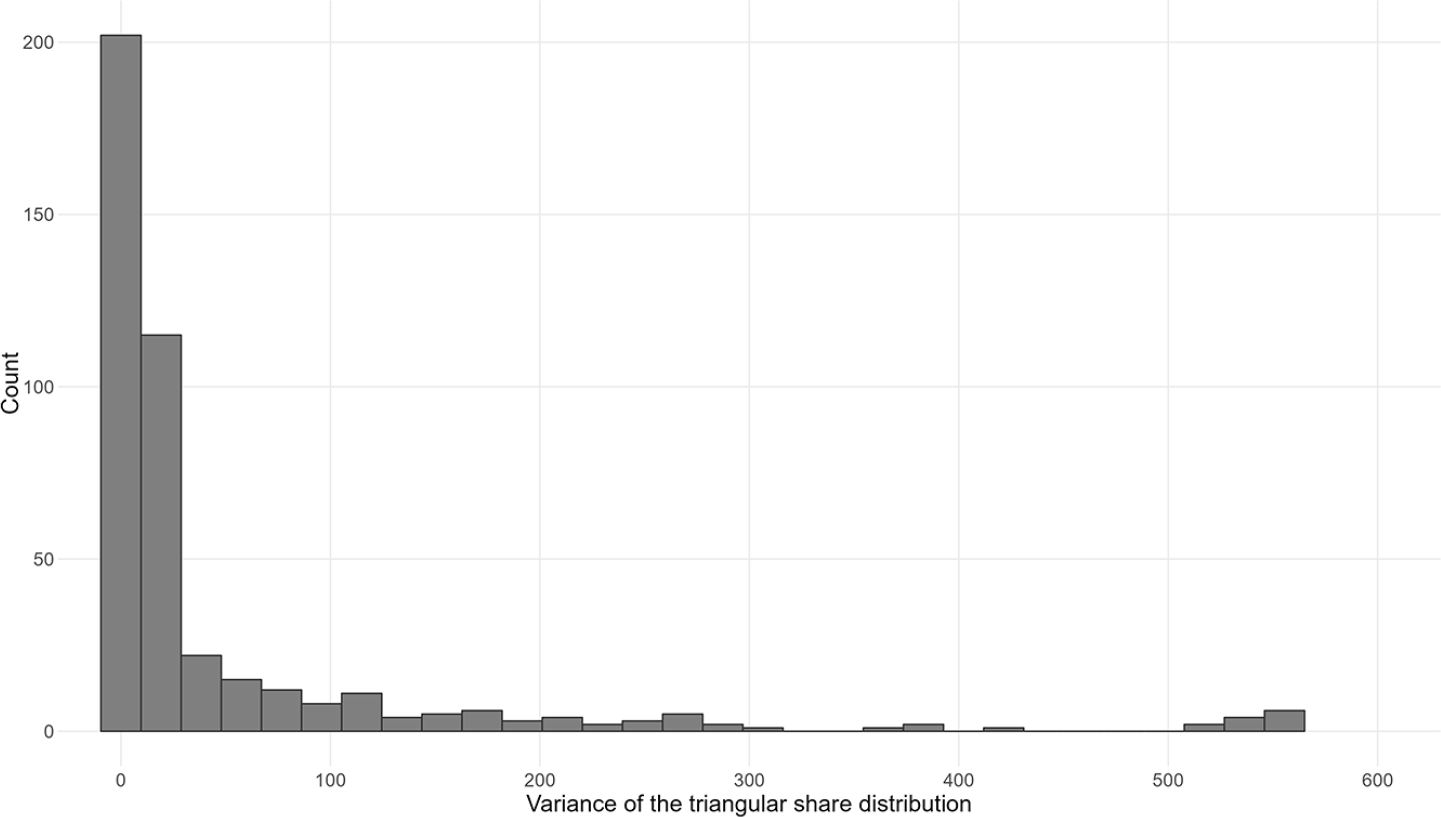
Moreover, Figure G2 shows that the vast majority of grapevine growers in our sample report a small variance (e.g., a standard deviation below 10 in the projected land share under fungus-resistant varieties in ten years).
H. Pest pressure and uptake of fungus-resistant varieties
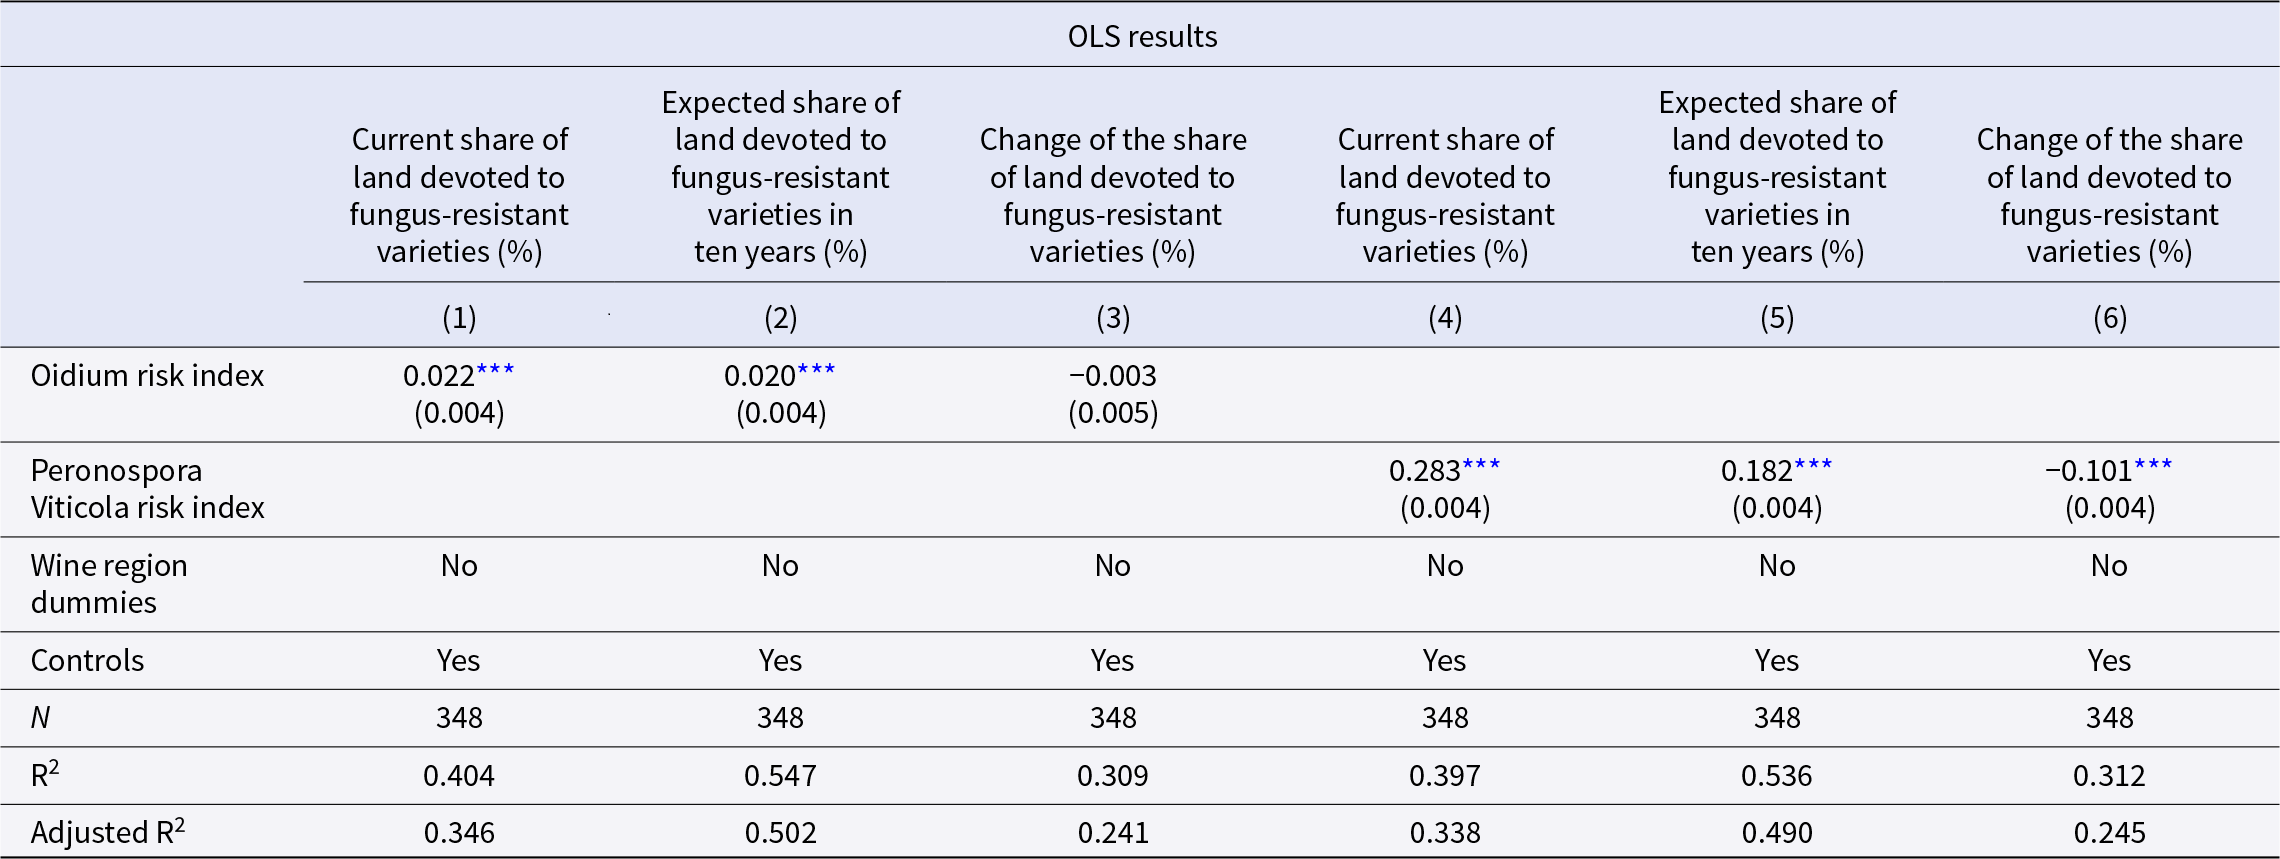
Table H1 shows regression results for the current share of land under fungus-resistant varieties, the expected share under fungus-resistant varieties in ten years, and the change in the land share devoted to fungus-resistant varieties between the expected and the current share. However, here we dropped the regional dummies and included the Oidium and Peronospora infection risk index averages between 2012 and 2021 from the nearest weather station as proxies for local pest pressure. Note that the scales of the two indices are different. While the Peronospora infection risk index is measured as 1 = no infection risk, 2 = medium infection risk, and 3 = high infection risk, the Oidium index is continuous from 0 = no infection risk to 100% = high infection risk.
Fungal pest pressure and the uptake of fungus-resistant varieties

*** Significant at the 1 percent level.
Note: Clustered standard errors are shown in parentheses.
The results show that farms that are in regions where both Oidium and Peronospora infection risks are higher, currently have more land under fungus-resistant varieties and expect to devote more to these varieties in ten years. However, for the change in the land share, we find mixed results.
Change in the expected land share and uncertainty.

Frequency distribution of the variance around the expected share.


 Open access