


Highlights
-
• We tested the role of the OCP and TMS universals in L2 Mandarin tonal perception.
-
• Bayesian analyses supported the null effects of the two phonological universals.
-
• Learners’ lexical knowledge of Chinese characters did not predict L2 tonal development.
-
• Domain-general pitch acuity was associated with more accurate L2 tonal perception.
1. Introduction
Among studies of L2 Mandarin acquisition, lexical tones are arguably the most studied structures. Tones are essential for distinguishing lexical meanings in Mandarin, which makes them one of the primary linguistic components for learners from the very beginning. While it is widely acknowledged that Mandarin Chinese lexical tones pose a serious challenge for speakers from a non-tonal background, previous research has shown that, given enough time and training, many learners are able to identify and produce tone categories fairly well (Lee, Tao, & Bond, Reference Lee, Tao and Bond2009; Pelzl, Lau, Guo, & DeKeyser, Reference Pelzl, Lau, Guo and DeKeyser2019; H. Zhang, Reference Zhang2007, Reference Zhang2016). However, mastering individual tone categories (i.e., on isolated monosyllables) does not ensure good performance with tones within words, which are predominantly disyllabic in Mandarin (Duanmu, Reference Duanmu2007; Wen, Qiu, Leong, & Van Heuven, Reference Wen, Qiu, Leong and Van Heuven2023). Several recent studies suggest that learners’ increased difficulties with tone sequences are influenced by two phonological universals, the Obligatory Contour Principle (OCP, Leben, Reference Leben1973) and the Tonal Markedness Scale (TMS, Hyman & VanBik, Reference Hyman and VanBik2004; Ohala, Reference Ohala and Fromkin1978). Expanding upon prior research, the present study assesses the role of the OCP and the TMS in L2 tonal acquisition with a perceptual testing protocol, which allowed us to better disentangle the potential effects of phonological universals from those of confounding variables, such as articulatory difficulty and lexical effects.
1.1. Phonetics, phonology and L2 acquisition of Mandarin tones
The primary acoustic correlate of tones is the fundamental frequency (F0). Higher F0 leads to a higher perceived pitch and all spoken languages employ pitch differences linguistically. When spreading over intonational phrases, pitch indicates different sentence types (e.g., in English, rising intonation for yes–no questions, falling intonation for statements). When carried by individual syllables or words, as in Mandarin, pitch displays as tone, signalling lexical contrasts (see Gussenhoven & Chen, Reference Gussenhoven and Chen2020, for a recent overview on the pitch from a cross-linguistic perspective).
The four lexical tones in Mandarin are traditionally denoted as Tone 1 (T1) to Tone 4 (T4). By referring to pitch height (high/low) and pitch movement/contour (rising, falling, or dipping), these tonal categories can be classified as high-level (T1), rising (T2), low-level (or low-dipping) (T3)Footnote 1 and falling (T4).
Research on L2 acquisition of Mandarin tones has been primarily concerned with how lexical tones are acquired in isolated syllables (see Pelzl, Reference Pelzl2019, for a recent overview). It has been shown that Mandarin lexical tones are very challenging for novice learners, especially for those from a non-tonal background (e.g., So & Best, Reference So and Best2010), but tones can be mastered after adequate training and enough time. For instance, L2 tonal difficulties can be mitigated rapidly with a few phonetic training sessions (Silpachai, Reference Silpachai2020; e.g., Wang, Spence, Jongman, & Sereno, Reference Wang, Spence, Jongman and Sereno1999) and advanced learners may even achieve near-native perceptual (Lee et al., Reference Lee, Tao and Bond2009; Pelzl et al., Reference Pelzl2019; Zou, Chen, & Caspers, Reference Zou, Chen and Caspers2017) and production performance (Song, Reference Song and Yang2021; H. Zhang, Reference Zhang2007, Reference Zhang2016) in monosyllabic contexts.
Given that around 70% of the words in Mandarin are disyllabic (Duanmu, Reference Duanmu2007; Wen et al., Reference Wen, Qiu, Leong and Van Heuven2023), it may come as a surprise that few studies have explored how L2 learners handle tone sequences. Such a research gap might be rooted in the intuition that mastering isolated tones will lead to fairly good performance in identifying tone sequences in disyllabic words, as individual tones can be regarded as the building blocks of tonal sequences. However, several studies demonstrate that compared to individual tones, disyllabic tone sequences are generally more challenging for L2 learners (Chang & Bowles, Reference Chang and Bowles2015; Hao, Reference Hao2012; Pelzl et al., Reference Pelzl2019; Silpachai, Reference Silpachai2020). The increased difficulty with tone sequences may be attributed to several factors that all play a larger role in sequences than in individual tones: a higher short-term memory load; tone sandhi (e.g., when a T3 precedes another T3, the first one becomes a T2, T3-T3 → T2-T3, Huang & Johnson, Reference Huang and Johnson2011); coarticulatory influence (e.g., T1 ends high in isolation but it surfaces as falling before T2, Chang & Bowles, Reference Chang and Bowles2015); and the potential need for more extensive lexical access (given that the Mandarin lexicon is largely disyllabic). Moreover, another line of research suggests that learning disyllabic tone sequences is further influenced by some universal processes common to language learning and human language more generally (Song, Reference Song and Yang2021; H. Zhang, Reference Zhang2007, Reference Zhang2016). In the following subsections, we provide a concise introduction to the two phonological principles that have been objects of inquiry in prior research, the OCP and the TMS, and review the evidence for their active role in L2 tonal acquisition.
1.2. Phonological universals in L2 tonal acquisition
1.2.1. Obligatory contour principle
The restriction on co-occurrence of identical or homorganic sound structures has long been known to phonologists since Greenberg (Reference Greenberg1950). Similar observations on the Mende tonal system, where no adjacent identical tones are allowed (e.g., *HHL and *LLH), have led Leben (Reference Leben1973) to propose the very first version of OCP: when two identical tones occur on adjacent vowels, the rightmost one is deleted. Subsequent studies have demonstrated that the most general form of OCP (disallowing adjacent identical elements, without referring to which structural property is targeted) leaves unexplained surface counterexamples in many languages (e.g., Goldsmith, Reference Goldsmith1976; Odden, Reference Odden1986, Reference Odden1988). As noted in Boersma (Reference Boersma1998), in order to maintain the belief that the OCP is a phonological universal, one has to conceptualise it as a violable constraint (e.g., under the framework of Optimality Theory, Prince & Smolensky, Reference Prince and Smolensky2004) or relativise it to certain phonological structures in a language-specific manner.
Besides assessing how well the OCP serves as a tool for formal phonological analysis, another line of research that has received much attention concerns its psychological reality. Studies with native listeners of Hebrew (Berent & Shimron, Reference Berent and Shimron1997), Arabic (Frisch & Zawaydeh, Reference Frisch and Zawaydeh2001) and English (Coetzee, Reference Coetzee, Frota, Vigário and Freitas2005, Reference Coetzee and Parker2008) have consistently reported that nonwords containing OCP-violating sequences are judged to be less well-formed than nonwords that conform to the OCP. In lexical decision tasks, OCP-violating nonwords are rejected faster than control items by native listeners of Hebrew (Berent, Everett, & Shimron, Reference Berent, Everett and Shimron2001), Arabic (Frisch & Zawaydeh, Reference Frisch and Zawaydeh2001) and Dutch (Shatzman & Kager, Reference Shatzman and Kager2007). Dutch listeners may use their language-specific restriction on the co-occurrence of multiple labial consonants (OCP-Labial, e.g., */spVp/) as a cue for speech segmentation (Boll-Avetisyan & Kager, Reference Boll-Avetisyan and Kager2014). More recently, Gong (Reference Gong2022) found that a phonotactic pattern conforming to the OCP was easier to learn in artificial language learning experiments, compared to a place harmony (an anti-OCP) process and to an arbitrary pattern.
Further evidence supporting the OCP as a universal phonological principle comes from large-scale quantitative typological reports, which show that nearly all languages are restricted by some kind of similarity avoidance (Graff, Reference Graff2012; Mayer, Rohrdantz, & Plank, Reference Mayer, Rohrdantz and Plank2010; Pozdniakov & Segerer, Reference Pozdniakov and Segerer2007).
1.2.2. Tonal markedness scale
Phonetically speaking, some tones are intrinsically more complex than others. Level tones mainly involve F0 height, while contour tones additionally entail an F0 slope. Although rising and falling tones are both contour tones, they appear to show different degrees of phonetic complexity. Ohala (Reference Ohala1973) observed in a production experiment that, for a given pitch interval, a rising tone systematically takes longer to produce than a falling tone. Falling tones may thus be seen as phonetically less demanding, since they need less time to reach a certain level of prominence than rising tones (Ohala, Reference Ohala and Fromkin1978; Xu, Reference Xu2002; Xu & Sun, Reference Xu and Sun2002). These phonetically-grounded differences in tonal complexity were later formalised by Hyman and VanBik (Reference Hyman and VanBik2004) as the TMS (*Rising >> *Falling >> *Level), which was used to explain the tone sandhi pattern in Hakha Lai.
Patterns consistent with the TMS have been attested in first language acquisition and typological studies. In a longitudinal study with four Mandarin-acquiring toddlers, Hua and Dodd (Reference Hua and Dodd2000) reported that the stabilisation of lexical tones generally followed the TMS (i.e., T2 < T4 < T1). Moreover, in a typological survey by J. Zhang (Reference Zhang2002, Reference Zhang, Hayes, Kirchner and Steriade2004), the tone distribution of 187 genetically diverse languages corroborated the implicational relationship predicted by the TMS: if a language has contour tones, it also employs level tones; and if it has rising tones, it also employs falling tones.
1.3. The presence of OCP and TMS in L2 tonal acquisition
The effects of OCP and the TMS have been reported in several studies on L2 tonal production. In a reading task of Chinese real words, H. Zhang (Reference Zhang2007) observed that L1-English learners, who had studied Mandarin for about 5 months, tended to avoid producing identical tones on adjacent syllables, especially in the case of contour tone pairs (i.e., T2-T2 and T4-T4). Such tonal dissimilation can hardly be attributed to the learners’ L1 English, which does not contain any lexical tones, or to the target language Mandarin, where only T3-T3 sequences are avoided. Under the OT-theoretic framework, H. Zhang speculated that the OCP, as part of the learners’ Universal Grammar, was responsible for the observed L2 tonal dissimilation. Moreover, after splitting tone sequences into individual tones, H. Zhang observed that the learners’ production accuracies corroborated the TMS (i.e., T2 < T4 < T1).
In a subsequent study, H. Zhang (Reference Zhang2016) examined L2 tonal production by intermediate learners of Mandarin with three different L1s (English, Japanese and Korean). This study constituted an insightful test of phonological universals, because if L2 phonology was subject to the OCP, the dispreference of identical tone sequences would be attested, regardless of the learners’ L1. H. Zhang (Reference Zhang2016) found two pieces of evidence suggesting OCP effects. First, for all three learner groups, target identical tone sequences were replaced by non-identical ones more frequently than the reverse direction. Second, identical tone pairs, when taken together, were produced less often than what would be expected given their target proportions. However, the OCP only affected rising and falling tone pairs (T2-T2 and T4-T4), not level pairs (T1-T1). In addition to the OCP effect, H. Zhang (Reference Zhang2016) further observed that the production accuracy of both identical tone sequences (T2-T2, T4-T4, T1-T1) and individual tones (T2, T4, T1) followed the TMS (i.e., T2 < T4 < T1).
Following the research direction of H. Zhang (Reference Zhang2007, Reference Zhang2016), Song (Reference Song and Yang2021) investigated the OCP and the TMS in the spontaneous YouTube speech of four L1-English learners with near-native Mandarin proficiency. Song observed that the production accuracy of individual tones (i.e., T2 < T4 < T1), but not that of tone sequences (i.e., T2-T2 > T4-T4), corroborated the TMS. The OCP effect, defined as lower accuracy for identical than non-identical sequences, was only obtained for T4-T4.
To summarise, there is some evidence for OCP effects in L2 tonal production, but they might be tone-specific. As for the TMS, it has been consistently verified on the production of individual tones, whereas conflicting evidence exists for its operation on tonal pairs. Given that the aforementioned three studies examined learners at different stages of L2 Mandarin learning, the divergence between their findings raises the possibility that the effects of the phonological universals may change over the course of L2 development (e.g., Major, Reference Major2001). In particular, given that the OCP (except on T3-T3) and the TMS are both in conflict with the target Mandarin phonology, one may expect that learners with more advanced Mandarin proficiency are better at overcoming the interference of these two universals. Extending prior research, the current study assesses whether the effects of the phonological universals are modulated by learners’ L2 speech proficiency. In the following section, we review two measures that have been shown to be good predictors of L2 Mandarin speech proficiency.
1.4. Predictors of L2 speech proficiency
Decades of research have led to a consensus that L2 learning and processing exhibit significant individual differences (Hulstijn, Reference Hulstijn2012; Sandlund, Sundqvist, & Nyroos, Reference Sandlund, Sundqvist and Nyroos2016). Two predictors of L2 speech proficiency, in particular, are a learner’s vocabulary size and their auditory processing abilities.
With regard to vocabulary size, it is clear that a solid mastery of lexical knowledge is a prerequisite for effective language use, such that as L2 lexical competence increases, so too does general L2 proficiency (Meara, Reference Meara, Brown, Malmkjaer and Williams1996; Zhou & Li, Reference Zhou and Li2021). In the case of L2 speech development, prior research indicates that learners with larger vocabularies can better distinguish between confusable L2 sound categories (Bundgaard-Nielsen, Best, Kroos, & Tyler, Reference Bundgaard-Nielsen, Best, Kroos and Tyler2012; Bundgaard-Nielsen, Best, & Tyler, Reference Bundgaard-Nielsen, Best and Tyler2011; Daidone & Darcy, Reference Daidone and Darcy2021; Llompart, Reference Llompart2021). This is because learning phonological neighbours may contribute to the consolidation and refinement of existing phonological representations in the lexicon. Furthermore, learners’ vocabulary size has been shown to play a critical role in L2 phonotactic learning (Spinelli, Forti, & Jared, Reference Spinelli, Forti and Jared2021), consistent with the view that phonotactic generalisations are made across lexical entries.
In addition to lexical knowledge, the rate of success in L2 speech acquisition has been demonstrated to be closely associated with individual differences in auditory acuity, that is, the ability to detect subtle differences in various aspects of acoustic input at a fine-grained level (Auditory Precision Hypothesis - L2, for an overview, see Saito, Reference Saito2023). This is presumably because learners with better auditory acuity can increase the precision of their auditory representations, which contributes to the increase of L2 speech proficiency. Auditory acuity can be estimated in a global manner (e.g., Kachlicka, Saito, & Tierney, Reference Kachlicka, Saito and Tierney2019; Saito, Sun, et al., Reference Saito, Sun, Kachlicka, Alayo, Nakata and Tierney2022), namely as the average of duration, pitch, and formant discrimination scores, or in a dimension-specific way. In a recent study, Saito, Sun, et al. (Reference Saito, Sun, Kachlicka, Alayo, Nakata and Tierney2022) assessed the role of perceptual acuity in L1-Japanese learners’ perception of English lateral-rhotic contrast, which is mainly cued by the F3 formant difference. They found that this notoriously difficult English liquid contrast was discriminated more accurately by L1-Japanese learners with more precise processing of the F3 formant. This finding suggests that dimension-specific auditory acuity is strongly linked to the acquisition of phonological contrasts that are robustly distinguished by that particular dimension. By extension, we expect that learners with good pitch acuity show advantages in the acquisition of Mandarin lexical tones.
1.5. The present study
The goal of the current study is to further assess the role of two phonological universals, the OCP and the TMS, in L2 tonal acquisition via a perceptual testing protocol with a group of learners of Mandarin, whose L1 European Portuguese does not employ pitch at the lexical level. Unlike the tasks employed in previous studies, our experiment was designed to tap into pre-lexical perception, to better disentangle the influence of phonological universals from other confounding factors, namely, the quality of phono-lexical representation and articulatory difficulty.
First, given that the underlying representations of Mandarin lexical tones may be fuzzy even for advanced learners (Pelzl et al., Reference Pelzl2019, Reference Pelzl, Lau, Guo and DeKeyser2021a), it is unclear to what extent the prior evidence for phonological universals, which was obtained on the basis of real-word production accuracy (Song, Reference Song and Yang2021; H. Zhang, Reference Zhang2007, Reference Zhang2016), can be attributed to inaccurate lexical encoding. To give an example, learners’ production of target /T4-T4/ as [T1-T4], which was interpreted as an OCP effect, may stem from the fact that learners have wrongly represented disyllabic words carrying two falling tones as /T1-T4/ in their L2 lexicon.
Second, deviations in L2 tonal production may result from articulatory imprecision. It has been shown that, even after establishing distinct tone categories, as revealed by good perceptual discrimination or accurate identification, L2 learners may still not be able to produce lexical tones very well (Elliot, Reference Elliot1991; Nagano-Madsen & Wan, Reference Nagano-Madsen and Wan2017), suggesting that L2 difficulties with Mandarin tones might be articulatorily motivated. This is because, in production, learners need to not only construct the distinct abstract tone categories, but also learn how to phonetically implement them through the corresponding articulatory gestures (e.g., controlling the timing of F0 movement), which can be quite challenging for learners from a non-tonal background.
The presence of these two confounding factors casts some doubt on previous real-word production studies, which have, nevertheless, attributed their findings to phonological universals exclusively (Song, Reference Song and Yang2021; H. Zhang, Reference Zhang2007, Reference Zhang2016). To address this issue, the current study employs a perceptual identification task with pseudowords, thereby precluding the potential influence of imprecise lexical encoding and articulation. Given that the OCP and the TMS are primarily conceptualised as restrictions on surface phonological forms (Song, Reference Song and Yang2021; e.g., H. Zhang, Reference Zhang2007, Reference Zhang2016)—which are the outputs of pre-lexical perception—we posit that a pseudoword identification task constitutes a suitable tool for examining the role of these two phonological universals in L2 tonal acquisition.
Apart from directly tapping into the representational level where the OCP and the TMS arguably operate, our experimental design displayed several other methodological improvements. In particular, we have made use of a much larger number of participants and stimuli than those in previous studies: H. Zhang (Reference Zhang2007, Reference Zhang2016) employed two test items for each tone pair (each produced twice), and Song (Reference Song and Yang2021) examined the productions of four L2 learners, whereas we have tested 59 participants on 96 tonal syllables (see Method). Moreover, the same set of tonal syllables were used in the identical and non-identical conditions, allowing for a more stringent test of the OCP, while the tone pairs we presented (T2-T2, T4-T4 and T1-T1) were well-matched in various lexical statistics to appropriately test for the TMS.
The current study seeks to answer the following research questions:
-
1. Is L2 tonal perception subject to OCP effects? We expected to find OCP effects in L2 tonal perception, at least for some tone pairs (e.g., T4-T4, Song, Reference Song and Yang2021). OCP effects would be borne out if the accuracy rate in the identical condition was lower than in the non-identical condition, because the OCP should force identical tone pairs into non-identical ones, but not vice versa.
-
2. Is L2 tonal perception subject to TMS effects? We hypothesised that learners’ identification accuracy of tone pairs (H. Zhang, Reference Zhang2016) and that of individual tones (Song, Reference Song and Yang2021; H. Zhang, Reference Zhang2016) would both conform to the TMS (i.e., T2 < T4 < T1).
-
3. Are the effects of the OCP and the TMS modulated by L2 speech proficiency? We predicted that the effects of OCP and TMS would be more pronounced in learners with lower Mandarin proficiency. Given that both the OCP (except for T3-T3) and the TMS are not active in Mandarin phonology, an increase in L2 speech proficiency should lead learners to gradually overcome the influences exerted by these two universals.
2. Method
2.1. Participants
Fifty-nine native speakers of European Portuguese (48 women, mean age = 21.63 years, SD = 2.51) were recruited at the University of Minho, Portugal, where they were enrolled in degree programmes in Chinese language and culture. Twenty-four participants had studied in a formal classroom setting for 1 year, 32 for 2 years, and 3 for 3 years. None had studied Mandarin prior to entering university (all had an age of onset of acquisition >17 years old), nor lived in Mandarin-speaking countries. All participants reported having normal speech and hearing. No participant reported being fluent in, nor regularly using a tonal language other than Mandarin.
Participants’ Mandarin speech proficiency was assessed with the LEXTALE_CH vocabulary test (Chan & Chang, Reference Chan, Chang, Bertolini and Kaplan2018) and with a pitch discrimination task from the auditory processing test batteries developed by Saito, Sun, et al. (Reference Saito, Sun, Kachlicka, Alayo, Nakata and Tierney2022). The participants of this study are quite heterogeneous in terms of their Mandarin speech proficiency, as revealed by their LEXTALE_CH scores (range: −17 to 47, SD = 10.72) and by their pitch acuity scores (range: 3.71–85.23, SD = 16.96). The two test scores were only weakly (and non-significantly) correlated (r = −0.16, t = −1.20, p = .235), which suggests that these two tests essentially measure different constructs of L2 Mandarin proficiency.
2.2. Materials
Ninety-six Mandarin tonal syllables were selected from the lexical database DoWLS-MAN (Neergaard, Xu, German, & Huang, Reference Neergaard, Xu, German and Huang2022), to create 48 disyllabic pseudoword items carrying two identical lexical tones (Identical condition: 16 × T1-T1, 16 × T2-T2, 16 × T4-T4). The same set of syllables was also used to create another set of 48 disyllabic items with distinct tones (Non-identical condition: 8 × T1-T2, 8 × T2-T1, 8 × T1-T4, 8 × T4-T1, 8 × T2-T4, 8 × T4-T2). None of the experimental stimuli included low-level tones (T3), because in Mandarin /T3-T3/ undergoes tone sandhi to become [T2-T3], and thus it is not possible to create disyllabic stimuli with identical T3 tones.
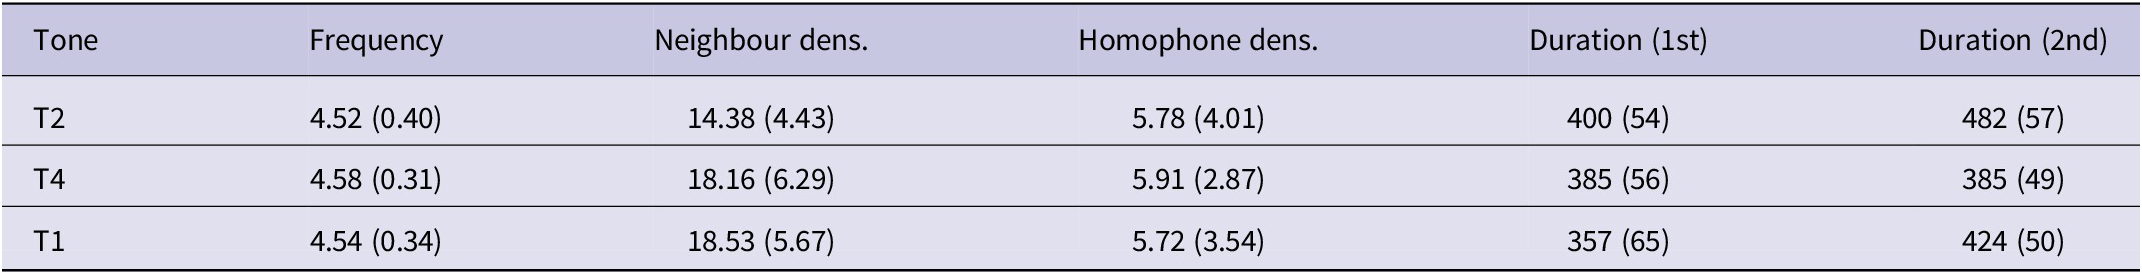
The syllables that were used to create the pseudowords were matched as close as possible across the three tones (i.e., T2, T4, T1) in mean (phonological) frequency, mean (phonological) neighbourhood density, and mean homophone density, as shown in Table 1. The matching minimises the possibility that any observed difference between experimental conditions would stem from learners’ lexical knowledge (e.g., participants could be more familiar with the monosyllabic stimuli in T2-T2 than those in T4-T4).
A female native speaker of Mandarin was recorded reading the stimulus list in a sound-attenuated room at the University of Minho in Portugal, using a Zoom H4n pro recorder, and a Shure SM58 microphone, at an audio sampling rate of 44.1 kHz. All recorded sound files were adjusted to the average intensity of 70 dB in Praat 6.1.05 (Boersma & Weenink, Reference Boersma and Weenink2022). The speaker was a Mandarin instructor and was uninformed as to the nature of the research. Four repetitions of the stimulus list were recorded and, for each pseudoword, we selected the token that was produced more naturally and without creaky phonation, without neutralizing durational differences (see Table 1 for the mean durations of each tone in each syllabic position).
2.3. Procedure
A perceptual identification task was created and hosted using Gorilla Experiment Builder (Anwyl-Irvine, Massonnié, Flitton, Kirkham, & Evershed, Reference Anwyl-Irvine, Massonnié, Flitton, Kirkham and Evershed2020). Participants performed the task in a quiet room at the University of Minho. The test trials were presented in a single block in a self-paced task. Stimuli were presented over headphones at a comfortable listening level and were randomised in different orders for each participant. Prior to the task, participants were told that they were going to hear a set of disyllabic Mandarin-like pseudowords, one at a time. Their task was to identify the two lexical tones in each stimulus, by typing their answers into a single text box using the keys 1, 2, 3 and 4, representing the four Mandarin tones. Participants were explicitly told that the stimuli were not real words in Mandarin and that the neutral tone would not occur. Note that participants were not informed that T3 would never occur in the task, because excluding T3 from possible responses could increase the accuracy rate of T2, which is often confused with T3 by L2 learners (e.g., Pelzl et al., Reference Pelzl2019).
At the beginning of the session, participants responded to a background questionnaire and signed a consent form. After the perceptual identification task, participants performed the LEXTALE_CH vocabulary test and the pitch discrimination task (see Participants). The whole session took approximately 30 minutes to complete.
2.4. Data analysis
One participant performed the task twice (as revealed by the background questionnaire), so her second set of responses was removed from the dataset. No other participants, items, or observations were excluded.
One-character responses (e.g., “2”; 1.09%) were considered incorrect both when analysing tone pairs and individual tones. Responses with only one valid digit within a two-character sequence (e.g., “2?”; 0.16%) were considered incorrect in the analysis of tone pairs but were assessed for correctness in the analysis of individual tones. Responses with no valid digits (e.g., “??”; 0.018% of the total) were considered incorrect in all analyses.
We present three different analyses below, each tailored to a research question of interest. The first analysis assessed the OCP by comparing the identification accuracies of identical versus non-identical tone pairs. The second analysis assessed the TMS by comparing, within identical tone pairs, the identification accuracies of rising (T2-T2), falling (T4-T4) and level (T1-T1) tones. Additionally, the TMS was assessed at the level of individual tones by comparing their identification accuracy in each of the two syllabic positions. Finally, the third analysis investigated the effect of our two L2 speech proficiency measures (i.e., vocabulary size and pitch acuity) on participants’ accuracies and assessed whether the OCP and TMS effects were modulated by L2 proficiency.
All analyses made use of mixed-effects binomial (logistic) regression, which is recommended for the analysis of binary data, such as correct versus incorrect responses (Jaeger, Reference Jaeger2008; Quené & van den Bergh, Reference Quené and van den Bergh2008; Veríssimo & Clahsen, Reference Veríssimo and Clahsen2014). Each statistical model contained the appropriate fixed-effect predictors dictated by the research question of interest. Random effects were additionally included to capture variation across participants and items. In order to prevent overconfident results, all models employed a ‘maximal’ random-effects structure, that is, they included all random slopes that were allowed by the experimental design (Barr, Levy, Scheepers, & Tily, Reference Barr, Levy, Scheepers and Tily2013; Oberauer, Reference Oberauer2022).
The statistical models were fit in a Bayesian framework. Bayesian analyses combine prior information with evidence from the data to produce a posterior distribution for each parameter, which is a probability distribution over a parameter’s possible values (for introductions to Bayesian statistics, see Vasishth, Nicenboim, Beckman, Li, & Kong, Reference Vasishth, Nicenboim, Beckman, Li and Kong2018; Veríssimo, Reference Veríssimo2025). In the analyses below, we present the posterior distributions for every effect of interest, accompanied by their means and 95% ‘credible intervals’, which is the range within which a parameter lies with 95% probability.
In addition, Bayesian models allow for conducting hypothesis tests for effects of interest. Bayesian hypothesis testing is based on comparing an ‘alternative model’ that includes the effect of interest, to a ‘null model’, which does not. The evidence that the data provides in favour of one versus the other model is the ‘Bayes factor’ and allows inferring about the existence of an effect (e.g., Schad, Nicenboim, Bürkner, Betancourt, & Vasishth, Reference Schad, Nicenboim, Bürkner, Betancourt and Vasishth2022; Schmalz, Biurrun Manresa, & Zhang, Reference Schmalz, Biurrun Manresa and Zhang2023). Importantly, and in contrast to frequentist analyses, Bayes factors can provide support for the null hypothesis, that is, for the equality between conditions or groups (Dienes & Mclatchie, Reference Dienes and Mclatchie2018; Rouder, Speckman, Sun, Morey, & Iverson, Reference Rouder, Speckman, Sun, Morey and Iverson2009). For each effect reported in the current paper, we calculated the natural logarithm of the Bayes factor in favour of the alternative hypothesis (lnBF10, Kass & Raftery, Reference Kass and Raftery1995) using the Savage-Dickey method (Dickey & Lientz, Reference Dickey and Lientz1970; Wagenmakers, Lodewyckx, Kuriyal, & Grasman, Reference Wagenmakers, Lodewyckx, Kuriyal and Grasman2010). Values of lnBF10 greater than 1 support the hypothesis that an effect is different from zero (H1), while negative values smaller than −1 support the hypothesis that the effect is absent (H0); values of lnBF10 between −1 and 1 are essentially inconclusive (Kass & Raftery, Reference Kass and Raftery1995; Veríssimo, Reference Veríssimo2025).
Bayesian models require specifying prior distributions on model parameters. We employed weakly informative priors on all parameters. In accordance with various recommendations (Gelman, Jakulin, Pittau, & Su, Reference Gelman, Jakulin, Pittau and Su2008; Ghosh, Li, & Mitra, Reference Ghosh, Li and Mitra2018; McElreath, Reference McElreath2020; Vasishth et al., Reference Vasishth, Nicenboim, Beckman, Li and Kong2018), priors on fixed effects were normally distributed with mean 0 and SD 2.5, priors on random effects were exponentially distributed with rate 1, and priors on random correlations were LKJ-distributed with shape 2. The appropriateness of these priors was confirmed through prior predictive checks. Additionally, we have conducted prior sensitivity analyses (e.g., Schad, Betancourt, & Vasishth, Reference Schad, Betancourt and Vasishth2021; Sinharay & Stern, Reference Sinharay and Stern2002) for the most important effects in this paper (see Appendix S1).
Analyses were performed with the brms package in R (Bürkner, Reference Bürkner2017; R Core Team, 2020). The procedures for fitting Bayesian models and assessing their convergence followed recent recommendations (Schad et al., Reference Schad, Betancourt and Vasishth2021; Vasishth et al., Reference Vasishth, Nicenboim, Beckman, Li and Kong2018; Veríssimo, Reference Veríssimo2025).
3. Results
3.1. Comparison between identical vs. non-identical pairs
To assess the OCP, we compared accuracy proportions in identical versus non-identical tone pairs (identical: T1-T1, T2-T2, T4-T4; non-identical: T1-T2, T2-T1, T1-T4, T4-T1, T2-T4, T4-T2). The mixed-effects binomial model included condition as a fixed effect (coded with sum contrasts, −0.5 = ‘non-identical’, 0.5 = ‘identical’). Random effects included random intercepts for participant and syllable pair, as well as by-participant random slopes for condition.
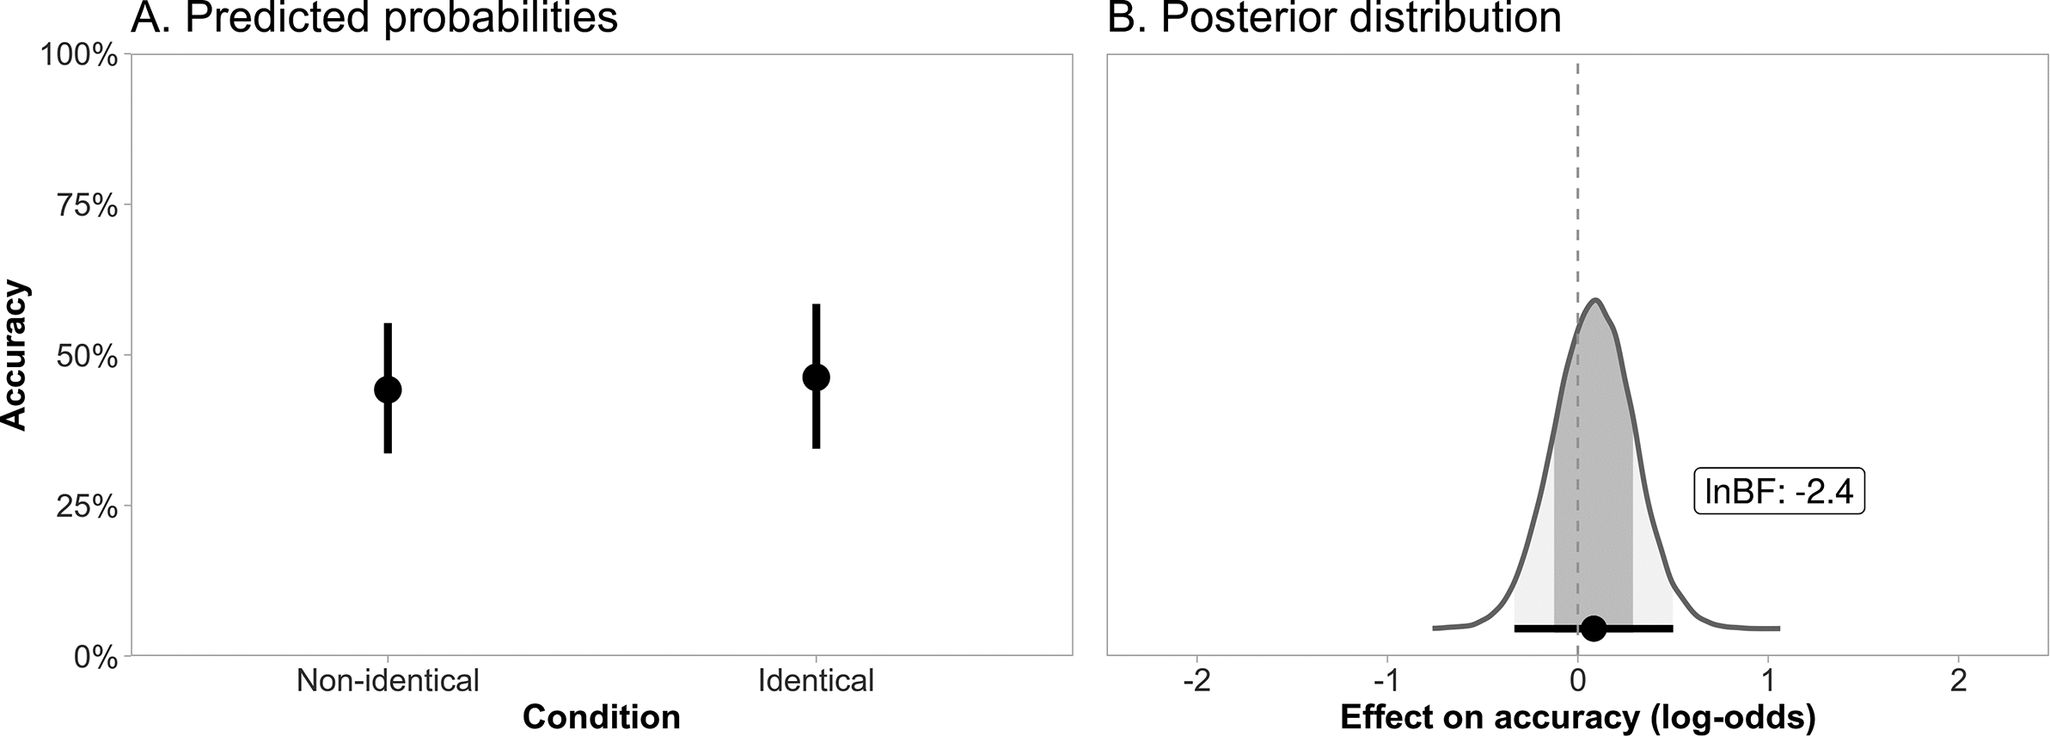
Figure 1A shows the model-based predicted proportions of correct responses in identical and non-identical conditions (empirical proportions averaged across subjects were 47.5% in identical and 45.4% in non-identical conditions). Figure 1B shows the posterior distribution for the effect of condition (i.e., for the accuracy difference between identical and non-identical conditions) in the modelled log-odds scale. The difference between conditions was estimated to be very small in magnitude, with the 95% interval spanning both negative and positive values (b = 0.08 [−0.33, 0.50]). Moreover, the Bayes factor analysis (also shown in Figure 1B) showed evidence against a difference between conditions, that is, it supported the null hypothesis that tonal perception is equally accurate in identical and non-identical pairs. A prior sensitivity analysis showed that this conclusion held for a range of reasonable priors (see Appendix S1). In sum, the results showed no indication that identical tone pairs were less accurately identified than non-identical pairs, a pattern that would be expected if the OCP had been applied.
(A) Means (circles) and 95% credible intervals (vertical bars) of predicted proportions of correct responses in identical and non-identical conditions. (B) Posterior distribution of the difference between identical and non-identical conditions in the log-odds scale. Shaded areas show 68% and 95% credible intervals. The black circle and horizontal line represent the mean and 95% credible interval. The numeric label is the natural logarithm of the Bayes factor in favour of the alternative hypothesis (values greater than 1 support the existence of an effect and values smaller than −1 support its absence).

Summary of syllable characteristics (means and SDs) in each of the three identical tone pairs

Note: All metrics were obtained from the DoWLS-MAN database (Neergaard et al., Reference Neergaard, Xu, German and Huang2022) as phonological metrics. Frequency is log10 of number of occurrences in a corpus of 46.8 million characters (Cai & Brysbaert, Reference Cai and Brysbaert2010). Durations for the first and second syllabic positions are expressed in milliseconds.
3.2. Comparison between tones
To assess the TMS, we compared accuracy proportions between rising (T2-T2), falling (T4-T4) and level (T1-T1) identical tone pairs. The mixed-effects binomial model included tone as a fixed effect, coded with treatment contrasts (with T4-T4 as the reference level). The model’s random-effects structure included random intercepts for participant and syllable pair, as well as by-participant random slopes for tone.
Figure 2A shows the model-based predicted proportions of correct responses for the three tone pairs (empirical proportions were 33.4% for T2-T2, 52.5% for T4-T4 and 56.6% for T1-T1). While the accuracy proportions were numerically consistent with the pattern predicted by the TMS (i.e., T2-T2 < T4-T4 < T1-T1), rising pairs were particularly difficult to identify relative to falling and level pairs.
(A) Means (circles) and 95% credible intervals (vertical bars) of predicted proportions of correct responses for the different tone pairs (rising, falling, level). (B) Posterior distributions and natural logarithm of Bayes factors for the differences between tone pairs (rising vs. falling, level vs. falling) (see Figure 1 caption for further details).

Figure 2B shows the posterior distributions of differences between rising and falling pairs (T2-T2 vs. T4-T4) and between level and falling pairs (T1-T1 vs. T4-T4), accompanied by their corresponding Bayes factors. The results provided strong support for the hypothesis that rising tones are perceived much less accurately than falling tones, as revealed by a large (negative) estimate (b = −1.16 [−1.71, −0.62]) and a large Bayes factor (‘very strong’ evidence, in the scale of Kass & Raftery, Reference Kass and Raftery1995). The sensitivity analysis showed that the same conclusion can be drawn for a range of reasonable priors (see Appendix S1). In contrast, the difference between level and falling tones was estimated to be much smaller (b = 0.34 [−0.14, 0.82]) and the negative Bayes factor for this comparison actually provided evidence for equal accuracy in level and falling tones. With wider priors than employed in our default analyses, the evidence for equality between level and falling tones became stronger, whereas with narrower priors, there was no support for their equality nor for their difference. In sum, our results show that rising pairs (T2-T2) are indeed harder to identify correctly, as predicted by the TMS, but falling tones (T4-T4) cannot be distinguished from level tones (T1-T1) in their identification accuracy.
3.2.1. Comparison between individual tones in each position
We have also investigated whether the individual syllables were subjected to the TMS by comparing the identification accuracies of the different tones in the first and second syllabic positions separately. Figure 3 displays the proportions of responses of each type, averaged across participants, for each of the presented tones (rising, falling, level) and in each syllabic position. Two noteworthy aspects can be gathered from the inspection of the empirical proportions. First, the TMS was clearly violated in the second syllabic position, since falling tones (T4) were more accurately identified than level tones (T1). Second, rising tones (T2) were very frequently misidentified as low-level (T3) in both syllabic positions, despite the fact that the experiment did not include any T3 stimuli (in contrast, T3 responses were almost never produced when T4 and T1 were presented).
Mean proportions (across participants) of T1, T2, T3 and T4 responses for each of the presented tones (rising, falling, level) and in each syllabic position. Error bars show 95% confidence intervals.

To statistically assess the TMS on individual tones, we fitted a mixed-effects binomial model that included tone (rising, falling, or level), position (first or second) and their interaction as fixed effects. The tone was coded with treatment contrasts (with T4 as the reference) and position was coded with nested contrasts, so that separate estimates could be obtained for the differences between tones in each syllabic position (see Schad, Vasishth, Hohenstein, & Kliegl, Reference Schad, Vasishth, Hohenstein and Kliegl2020). Additionally, the model included random effects for participant, syllable pair and individual syllable, as well as all random slopes allowed by the design.
Figure 4A displays the predicted proportions of correct responses for rising (T2), falling (T4) and level (T1) tones in the first and second syllabic positions. The results for the first syllabic position were numerically in line with the TMS (i.e., T2 < T4 < T1; empirical proportions T2: 55.2%, T4: 57.8%, T1: 70.6%). However, in the second position, falling tones were more accurate than level tones (i.e., rising < level < falling; empirical proportions T2: 48.7%, T4: 84.0%, T1: 70.1%). Figure 4B shows the posterior distributions for the differences between rising and falling tones (T2 vs. T4) and between level and falling tones (T1 vs. T4) in the first and second positions, with their corresponding (logged) Bayes factors.
(A) Means (circles) and 95% credible intervals (vertical bars) of predicted proportions of correct responses for the different tone pairs (rising, falling, level), separately for the first and second syllabic positions. (B) Posterior distributions and natural logarithm of Bayes factors for the differences between tone pairs (rising vs. falling, level vs. falling) in each syllabic position (see Figure 1 caption for further details).

In the first syllabic position, Bayes factors indicated positive evidence for a more accurate identification of level tones than falling tones (i.e., T1 > T4: b = 0.71 [0.29, 1.14]), but equal accuracy for falling and rising tones (i.e., T2 = T4: b = −0.37 [−0.83, 0.08]). In contrast, in the second syllabic position, we have obtained strong evidence that both rising and level tones are identified less accurately than falling tones (i.e., T2 < T4: b = −2.49 [−3.07, −1.95]; T1 < T4: b = −0.96 [−1.50, −0.42]). We have additionally compared accuracies in the first versus second positions for each of the three tones. Whereas falling tones were identified much more accurately in second than in first position (T4: b = 1.90 [1.46, 2.35], lnBF10 = Inf), rising and level tones were equally accurate in both positions (T2: b = −0.22 [−0.55, 0.11], lnBF10 = −2.4; T1: b = 0.23 [−0.16, 0.64], lnBF10 = −2.4). These positional effects were supported by interactions. Specifically, the differences between accuracies on falling versus the other two tones were larger in the second than in the first position (T2 vs. T4: b = 2.12 [1.54, 2.71], lnBF10 = 39.5; T1 vs. T4: b = 1.67 [1.08, 2.25], lnBF10 = 11.7). In contrast, the difference between level and rising tones did not interact with position (b = 0.45 [−0.04, 0.95], lnBF10 = −1.4).
3.3. The role of L2 speech proficiency
In our final analyses, we assessed whether the OCP and TMS were modulated by L2 speech proficiency. A first statistical model, focussed on the OCP, included by-participant vocabulary size and pitch acuity scores as predictors (both centred and standardised), as well as their interactions with condition (identical vs. non-identical).
Figure 5A shows the posterior distributions and logged Bayes factors for the overall main effects of the two proficiency measures and their interactions with condition. Because the condition was coded with sum contrasts (i.e., −0.5/0.5), the main effects reflect the average effects of vocabulary size and pitch acuity across the two conditions, while the interactions reflect how much the difference between identical and non-identical pairs (the putative OCP effect) changes for every standard deviation in proficiency.
(A) Posterior distributions for the main effects of vocabulary size and pitch acuity and their interaction with the (A) OCP contrast, i.e., tone pairs in identical vs. non-identical conditions, and (B) the TMS contrasts, i.e., rising (T2-T2) vs. falling (T4-T4) and level (T1-T1) vs. falling (T4-T4) identical tone pairs.

Vocabulary size did not have an effect on tone identification. Although its posterior mean (and the majority of the posterior distribution) was estimated to be positive (b = 0.29 [−0.08, 0.66]), the Bayes factor analyses provided support for the null hypothesis. Moreover, vocabulary size played no role in modulating the OCP effect, as revealed by a near-zero interaction (b = −0.03 [−0.32, 0.26]; see Figure 5A).
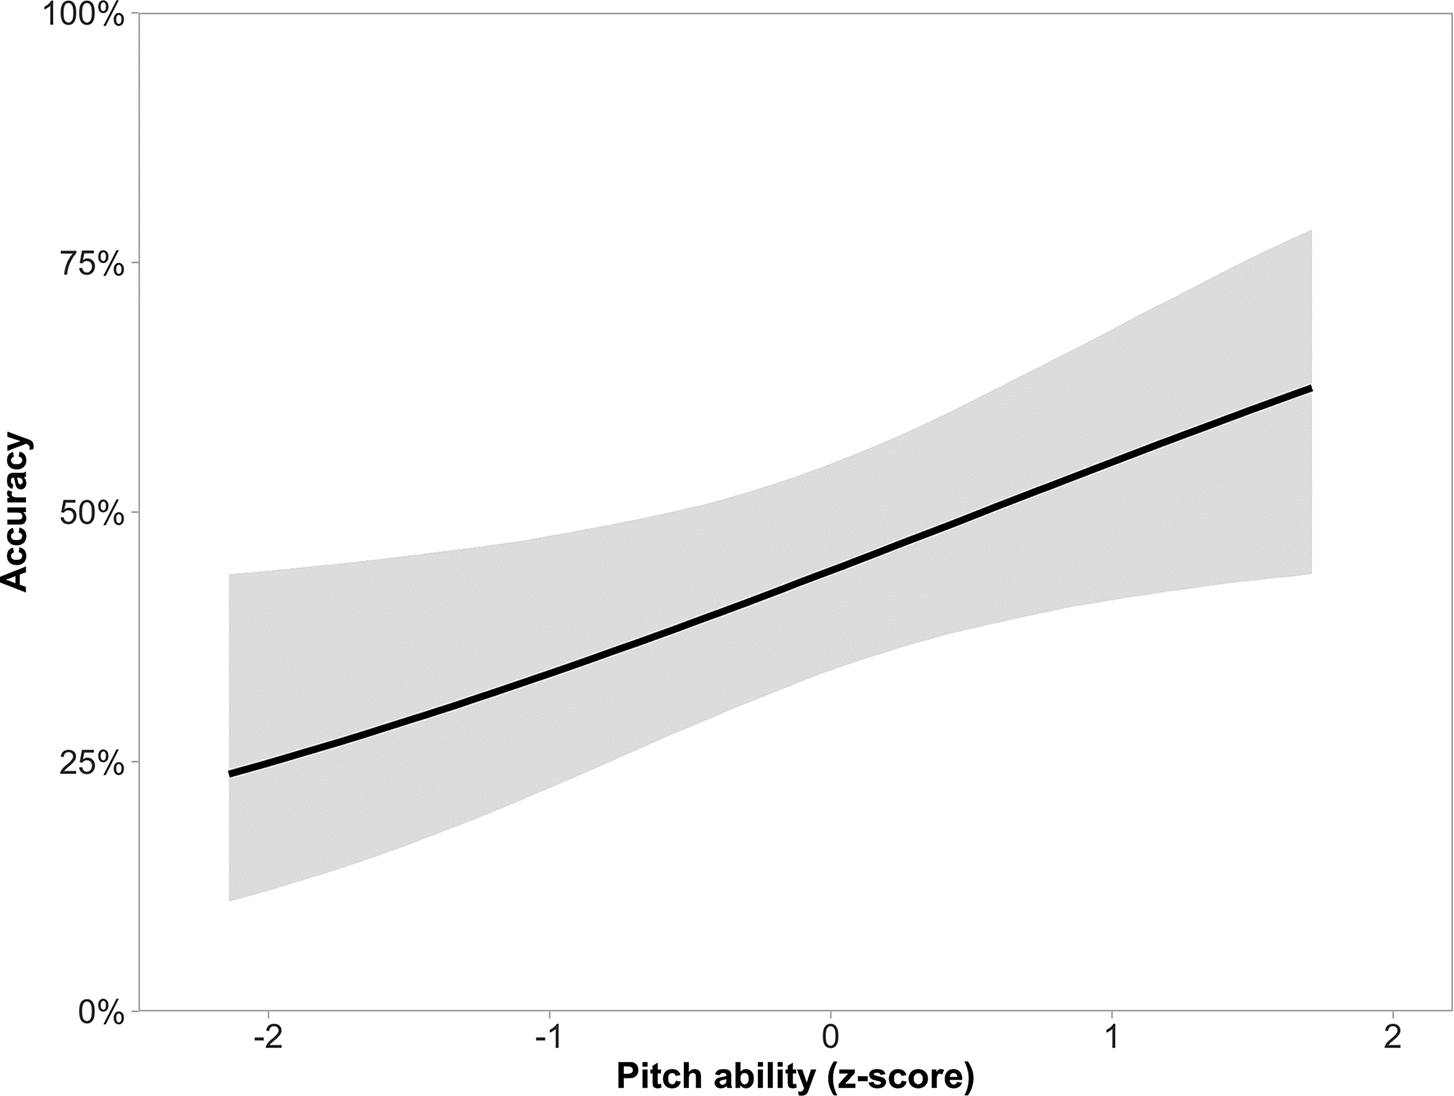
In contrast to vocabulary size, we obtained a clear effect of pitch acuity on tone identification: participants with better pitch acuity were more accurate at identifying tones, across identical and non-identical pairs (b = 0.54 [0.17, 0.91]. The predicted effect of pitch acuity on identification accuracy is displayed in Figure 6. This effect was found to be relatively large, with predicted accuracies ranging from approximately 25% to 60% (for participants who were 2 SDs below and above the mean, respectively).
Mean and 95% credible interval of the predicted effect of (centred and standardised) pitch acuity on the proportion of correctly identified tone pairs (averaged across identical and non-identical tone pairs).

The second proficiency analysis concerned the TMS and again included participant vocabulary size and pitch acuity scores as predictors, as well as their interactions with the relevant tone pair contrasts (i.e., rising vs. falling and level vs. falling). The posterior distributions and logged Bayes factors for these effects are displayed in Figure 5B. Recall that, unlike the OCP analyses, an assessment of the TMS on the identification of tone pairs requires comparing tones within the identical condition. Thus, proficiency effects in this model were estimated for the identical tone pairs only.
As in the OCP proficiency analysis, there was no overall main effect of vocabulary size on accuracy (b = 0.35 [−0.13, 0.84]), and the differences between tone pairs were not modulated by vocabulary size (T2-T2 vs. T4-T4: b = −0.17 [−0.69, 0.33]; T1-T1 vs. T4-T4: b = −0.12 [−0.53, 0.29], with Bayes factors supporting the null hypotheses in all cases (see Figure 5B). As for pitch acuity, we again obtained a main effect of pitch acuity on identification accuracy (b = 0.79 [0.32, 1.28]), but no interactions with the tone pair contrasts (T2-T2 vs. T4-T4: b = −0.17 [−0.70, 0.34]; T1-T1 vs. T4-T4: b = 0.09 [−0.31, 0.49]).
4. General discussion
In the current tone identification experiment, we have tested the effects of two different phonological universals that have been proposed to constrain the L2 acquisition of Mandarin tones (Song, Reference Song and Yang2021; H. Zhang, Reference Zhang2007, Reference Zhang2016): (i) the OCP, which manifests as a dispreference for adjacent identical tones, and (ii) the TMS, according to which rising (T2) tones are dispreferred relative to falling (T4) tones and both of these are dispreferred relative to level (T1) tones. The OCP was tested by comparing accuracy rates in disyllabic pseudowords with identical and non-identical tone pairs. Bayesian mixed-effects analyses revealed that L2 learners were equally accurate in both conditions, suggesting that the OCP is not involved in tone identification. The TMS was tested by comparing accuracies in rising (T2-T2), falling (T4-T4) and level (T1-T1) tone pairs. Although participants were less accurate on rising tone pairs, there was little evidence for a difference between falling and level tones. An analysis of accuracy rates in each syllabic position (across identical and non-identical pairs) also showed that the TMS was not fully supported in either position. We have additionally explored whether the potential effects of universals are modulated by L2 phonological proficiency but found no evidence for such interactions. Instead, a clear effect of learners’ pitch acuity was observed on tone identification accuracy.
4.1. OCP effects
The absence of OCP effects in L2 tonal perception is at odds with the findings of prior production studies (Song, Reference Song and Yang2021; H. Zhang, Reference Zhang2007, Reference Zhang2016). To a certain extent, the null result of OCP in L2 perception poses a challenge to the generalizability of previous findings, especially considering the methodological improvements implemented in the current experiment (larger statistical power and better-matched stimuli between conditions). Given that the previously attested tonal dissimilation cannot be attributed to cross-linguistic influence, H. Zhang reasoned that L2 learners must have access to Universal Grammar, which supplies an innate universal constraint set, including the OCP. Nevertheless, the innateness of the OCP remains contentious. For example, a series of learning experiments conducted by Boll-Avetisyan and colleagues suggests instead that the OCP operates as a language-specific phonotactic constraint and is acquired on the basis of input distribution (Boll-Avetisyan, Reference Boll-Avetisyan2012; Boll-Avetisyan & Kager, Reference Boll-Avetisyan and Kager2014).
If the OCP were not responsible, what would explain the prior production results? As mentioned in the Introduction, one possibility is that the apparent OCP effects (e.g., /T4-T4/ produced as [T1-T4]) are actually due to miscoded phono-lexical forms (e.g., a target disyllabic word carrying two falling tones wrongly represented as /T1-T4/ in the L2 lexicon), which are retrieved as input in L2 tonal word production. Supporting evidence can be found in a series of studies conducted by Pelzl and colleagues (Pelzl et al., Reference Pelzl2019, Reference Pelzl, Lau, Guo and DeKeyser2021a; Pelzl, Lau, Guo, & DeKeyser, Reference Pelzl, Lau, Guo and DeKeyser2021b), who found that, even for advanced learners with excellent tone identification abilities and a good command of vocabulary, the tonal representations in their mental lexicon may still be fuzzy (i.e., missing, incorrect, or uncertain). For a detailed discussion of factors that may contribute to such fuzziness, interested readers are referred to Pelzl et al. (Reference Pelzl, Lau, Guo and DeKeyser2021b). Despite the plausibility of this alternative account, we believe that future work combining comparable perceptual and production experiments (Nagle & Baese-Berk, Reference Nagle and Baese-Berk2022) with the same group of L2 learners is needed before the OCP can be fully rejected.
Another way to explain the asymmetry between perceptual and production evidence is to acknowledge modality-specific OCP effects, which are attainable in several theoretical frameworks. The first one is to assume that the OCP is articulatory in nature (rearticulating the same gesture successively entails more effort than realising two different gestures, Dell, Reference Dell1986), thus affecting L2 production exclusively. However, this straightforward account is not uncontroversial, because many studies that conceptualise the OCP as an articulatory constraint (e.g., Benus, Smorodinsky, & Gafos, Reference Benus, Smorodinsky, Gafos, Arunachalam and Scheffler2004; Gafos, Reference Gafos2002, Reference Gafos, Goldstein, Whalen and Best2006) adhere to the theoretical view that gestures are perceptual primitives. That is to say, in order to model the production-specific effects, the articulation-based approach to OCP would need to depart from its fundamental premise. The second possibility is that L2 learners have developed distinct perception and production grammars (Ramus et al., Reference Ramus, Christophe, Jacquemot, Kouider, Dupoux, Fougeron, Kühnert, D’Imperio and Vallée2010). This view is consistent with a growing number of studies showing that L2 speech perception and production do not always develop in tandem (see Nagle & Baese-Berk, Reference Nagle and Baese-Berk2022, for a review). However, it remains unclear why L2 Mandarin learners only integrate tonal similarity avoidance into their production grammar. Furthermore, even without assuming distinct grammars, modality-specific patterns may emerge, which leads us to a third possibility. In generative phonology, the mismatch between speech perception and production has been explicitly formalised in a number of studies. For instance, in Smolensky’s (Reference Smolensky1996) optimality-theoretic model, a single grammar was proposed to explain why young English children may pronounce ‘cat’ as [kæ] themselves but would at the same time object to [kæ] when uttered by an adult. In speech perception (mapping from phonological surface forms to underlying forms), structural constraints such as the OCP cannot exert their effects, because they target surface forms, which are the non-evaluable input to perception (richness of base, Prince & Smolensky, Reference Prince and Smolensky1993). In contrast, during production (mapping from underlying forms to surface forms), structural constraints have an effect, because the surface forms they evaluate are now the output. More recently, discrepancies between speech perception and production have also been modelled (Boersma & Hamann, Reference Boersma, Hamann, Calabrese and Wetzels2009b; Cavirani & Hamann, Reference Cavirani and Hamann2022; Zhou & Hamann, Reference Zhou and Hamann2024), under the Bidirectional Phonology and Phonetics Model (Boersma, Reference Boersma, Benz and Mattausch2011; Boersma & Hamann, Reference Boersma, Hamann, Boersma and Hamann2009a). An explicit formal account is beyond the scope of this paper. Future modelling studies, as well as experiments examining both L2 tonal perception and production, will be necessary to proceed with a complete formalisation along these lines.Footnote 2
4.2. TMS effects
Our results did not fully support the predictions of the TMS, neither for tone pairs nor for individual tones. Accuracy for falling tone pairs (T4-T4) was comparable to that of level tones (T1-T1), against the TMS. Moreover, we have found that the results on tone pairs stemmed from particular patterns in each syllabic position. In the word-initial (first syllabic) position, learners were indeed more accurate at identifying level tones (T1), but falling tones (T4) and rising tones (T2) showed similar low accuracy rates. This pattern does not strictly conform to the TMS (*Rising >> *Falling >> *Level), but is better characterised as an instantiation of tone complexity (Contour >> Level). In the word-final (second syllabic) position, rising tones were again very difficult to identify, but the identification of falling tones was much more accurate and it even surpassed that of level tones—again, a pattern that does not align with the TMS.
The comparable accuracy rates for rising and falling tones in word-initial position contradict prior production studies, all of which have found TMS effects on individual tones. We speculate that this discrepancy may be attributable to the articulatory nature of the TMS. Unlike OCP, which is widely considered phonological in the literature, the TMS was formalised by Hyman and VanBik (Reference Hyman and VanBik2004) as a phonetically-grounded constraint, based on the articulatory evidence provided by Ohala (Reference Ohala and Fromkin1978). A similar modality-specific pattern driven by articulatory constraints has been observed in the L2 acquisition of Mandarin tone sandhi. Qin (Reference Qin2022) observed that a sandhi process motivated by articulatory ease was more productive in L2 production than a phonetically arbitrary sandhi; however, this articulatory effect does not appear to exist in L2 perception (Luo, Williams, & Post, Reference Luo, Williams and Post2024). For formal modelling of how articulatory constraints lead to a mismatch between L2 perception and production, interested readers are referred to Zhou and Hamann (Reference Zhou and Hamann2024).
Learners’ general difficulty with T2 across positions may be due to its confusability with T3 (Hao, Reference Hao2012; Pelzl et al., Reference Pelzl2019; e.g., So & Best, Reference So and Best2010, Reference So and Best2014), which is supported by the substitution patterns obtained in the current study (see Figure 3). The confusion between T2 and T3 likely arises from their perceptual-acoustic similarity, since both display an initial dip pitch followed by a rising contour (Moore & Jongman, Reference Moore and Jongman1997; Pelzl et al., Reference Pelzl2019). Moreover, their confusability may also be enhanced by current pedagogical practices. Despite the fact that the most common allotone of T3 is low-level (Duanmu, Reference Duanmu2007), its citation form, low-dipping, is often taught in the classroom and appears recurrently in textbooks (He, Wang, & Wayland, Reference He, Wang and Wayland2016; Pelzl et al., Reference Pelzl2019; Shi, Reference Shi2007; J. Zhang, Reference Zhang, Huang, Li and Simpson2014). Thus, the presence of a dipping contour in T2 may be misidentified as a cue to T3, or T3 might be regarded as T2 if its dip is not apparent enough.
Concerning the positional effect for falling tones, it may stem from cross-linguistic interaction. Although European Portuguese does not employ pitch for lexical contrast, it does use pitch movements to delineate the boundary of intonational phrases (Frota, Reference Frota2000, Reference Frota and Jun2014; Viana, Reference Viana1987). Specifically, a declarative boundary-final tone manifests as a falling contour, which resembles the Mandarin falling tone to a certain degree. It is therefore plausible that the participants in this study have transferred this L1 prosodic feature to L2 tonal learning, leading to higher identification accuracy of T4 phrase-finally. Relying on L1 phrase-level pitch to acquire Mandarin lexical tones has long been reported (Broselow, Hurtig, & Ringen, Reference Broselow, Hurtig, Ringen, Ioup and Weinberger1987; Chunsheng Yang, Reference Yang2016; C. Yang & Chan, Reference Yang and Chan2010; H. Zhang, Reference Zhang2013). For instance, in a study with native speakers of English, which also displays a declarative-final falling contour, Broselow et al. (Reference Broselow, Hurtig, Ringen, Ioup and Weinberger1987) have also found that T4 was more accurately identified in the final position than in the non-final position, a result they attributed to positive L1 prosodic transfer. Another potential explanation for the positional effect pertains to the presence of an additional cue for T4 identification, namely duration. Falling tones have the shortest duration in phrase-final position (Ho, Reference Ho1976). Indeed, in our stimuli, T4 was the shortest tone in the second syllabic position (see Table 1), but longer than T1 in the first position. These hypotheses can be explored in future studies employing synthesised stimuli and controlling for the prosodic contexts in which they occur.
4.3. Are the effects of universals modulated by L2 proficiency?
The divergent findings observed in the tonal production of participants at different stages of L2 learning (Song, Reference Song and Yang2021; H. Zhang, Reference Zhang2007, Reference Zhang2016) led us to hypothesise that the effects of phonological universals might be modulated by L2 speech proficiency. In particular, we expected that L2 tonal phonology would be less influenced by the OCP and the TMS, with an increase in learners’ Mandarin speech proficiency. Contrary to our prediction, the Bayesian analyses support the null effects for such an interaction. Instead, a relatively large effect of pitch acuity on tone identification accuracy was obtained. This finding has two important implications for our current understanding of the relationship between domain-general auditory processing and L2 speech development.
On the one hand, the observed effect sheds light on how different constructs of pitch acuity are related to L2 tonal perception. A listener’s pitch aptitude can be inferred from their ability to perceive relative pitch differences in either linguistic (over speech units, including isolated vowels and monosyllabic Mandarin minimal pairs) or non-linguistic/domain-general (over sine waves) contexts. While many studies have found a positive correlation between linguistic pitch acuity and L2 tonal perception (Chandrasekaran, Sampath, & Wong, Reference Chandrasekaran, Sampath and Wong2010; Perrachione, Lee, Ha, & Wong, Reference Perrachione, Lee, Ha and Wong2011; e.g., Wong & Perrachione, Reference Wong and Perrachione2007), domain-general pitch acuity was shown to only underlie the generalisation of tone learning to stimuli produced by novel speakers (Bowles, Chang, & Karuzis, Reference Bowles, Chang and Karuzis2016). Extending these previous findings, we demonstrated that domain-general pitch acuity plays an important role in L2 tonal perception, consistent with the Auditory Precision Hypothesis-L2 (Mueller, Friederici, & Männel, Reference Mueller, Friederici and Männel2012; Saito, Reference Saito2023). In particular, L2 learners with better auditory acuity exhibited heightened sensitivity to F0 differences in the Mandarin input, thus acquiring the mapping of specific F0 height/movement to the corresponding Mandarin tone category more effectively.
On the other hand, the current findings on pitch acuity help generalise the predictive power of domain-general auditory processing to different L2 learning settings. In prior research, the positive relationship between auditory acuity and phonological proficiency was only robustly observed in naturalistic L2 learning (Saito, Sun, et al., Reference Saito, Sun, Kachlicka, Alayo, Nakata and Tierney2022; Zheng, Saito, & Tierney, Reference Zheng, Saito and Tierney2022), but not in classroom settings (Saito, Suzukida, Tran, & Tierney, Reference Saito, Suzukida, Tran and Tierney2021). Saito et al. (Reference Saito, Suzukida, Tran and Tierney2021) posited that L2 classroom learners cannot entirely benefit from auditory acuity because they typically receive and process a relatively limited amount of aural input in L2 classroom contexts. The results of the present study, however, suggest otherwise. Though our participants mainly received Mandarin input through formal instruction, having ‘good ears’ (domain-general pitch acuity) does lead to better performance with the perception of Mandarin tones. Note that the comparison between studies should be made with caution due to methodological differences. The outcome variable phonological accuracy in Saito et al. (Reference Saito, Suzukida, Tran and Tierney2021) was a broad measure, namely the average native-like ratings of three different constructs (segments, word stress and intonation), and the predictor (auditory acuity) was likewise assessed by collapsing across various acoustic dimensions, such as duration, pitch and formant. Given the multifaceted nature of these two variables, their correlation might be rather loose. In the current study, the relationship between the predictor and the outcome variable was arguably much tighter, as pitch acuity is more strongly related to the identification of lexical tones, which are reliably distinguished by pitch differences. Further support for the robust effects of auditory processing at the dimension-specific level can be found in Saito, Kachlicka, et al. (Reference Saito, Kachlicka, Suzukida, Petrova, Lee and Tierney2022), where F3 sensitivity was shown to predict the mastery of the English lateral-rhotic contrast (which is cued mainly by F3 differences) in both classroom and immersion learning settings.
The other predictor, Mandarin vocabulary knowledge—which has been considered a good indicator of L2 Mandarin speech proficiency—did not relate to the accuracy of L2 tonal perception. We speculate that this null result might be ascribed to the specific characteristics of the proficiency measure used in this study. First, the LEXTALE_CH vocabulary test (Chan & Chang, Reference Chan, Chang, Bertolini and Kaplan2018) assesses knowledge of written characters (tonal knowledge is not explicitly required), and thus may be less predictive of tone perception. Second, all of the LEXTALE_CH test items are single characters (monosyllabic), which might compromise the validity of the test, given that most Chinese words are disyllabic (Duanmu, Reference Duanmu2007). Future research interested in the lexical effects in L2 tonal perception is encouraged to consider a more recent version of the Chinese vocabulary test with two-character items, LexCHI (Wen et al., Reference Wen, Qiu, Leong and Van Heuven2023), which revealed higher correlations with a cloze test and a translation task than the single-character version.
5. Conclusion
This study set out to investigate whether the L2 perception of Mandarin tone sequences is governed by phonological universals—namely, the Obligatory Contour Principle (OCP) and the Tonal Markedness Scale (TMS)—and whether the potential effects of these universals are modulated by individual difference predictors, such as vocabulary size and pitch acuity.
Contrary to predictions derived from previous production studies, Bayesian mixed-effects analyses revealed null effects for both phonological universals in L2 perception. These findings point to a possible perception-production asymmetry in L2 tonal acquisition, calling for future studies to entertain the precise nature of these phonological universals and explicitly model how the two speech modalities interact in L2 phonological acquisition.
Notably, while vocabulary size—a common proxy for L2 speech proficiency—was unrelated to tone identification performance, learners’ pitch acuity turned out to be a robust predictor of learning success. This result not only provides support for the Auditory Precision Hypothesis, underscoring the role of domain-general auditory processing in L2 phonological acquisition, but also extends its applicability to classroom-based learning contexts.
Supplementary material
The supplementary material for this article can be found at http://doi.org/10.1017/S1366728925100114.
Data availability statement
All materials, data and code are openly available in the OSF repository at https://osf.io/ezadw.
Acknowledgements
We thank Ling Li for help in recording the stimuli, and the audiences of the Architectures and Mechanisms for Language Processing (AMLaP) 2023, Manchester Phonology Meeting (mfm) 2023, and Encontro Nacional da Associação Portuguesa de Linguística (ENAPL) 2022 conferences for helpful discussions. We are also grateful to the three anonymous reviewers for their insightful feedback on earlier versions of this paper.
Funding statement
This work has been funded by the Fundação para a Ciência e a Tecnologia (FCT, Foundation for Science and Technology), grant UID/00214: Center of Linguistics of the University of Lisbon.
Competing interests
The authors declare none.


 Open access