

Many factors contribute to changes in the dietary habits of a population including technological changes, urbanization, trade agreements, cultural shifts and public health campaigns. Globalization of the food supply and increased centralization have been described as both increasing and reducing dietary diversity( Reference Lang 1 , Reference Caraher and Coveney 2 ). The ‘burgerization’ or ‘systematic moulding of tastes’ described by Lang has occurred concurrently with an increased uptake of local specialties and ethnic cuisines( Reference Lang 1 ). Specifically in New Zealand (NZ), closer trade relations with Australia have made available to this population a wider range of foods. Furthermore, the NZ population has become more ethnically diverse, and with increased travel opportunities and faster communication, international influences are more prevalent.
Examining trends in food consumption patterns is essential to anticipate future diet-related health issues and provide an evidence base for future public health initiatives( Reference Briefel and Johnson 3 ). It is important that the NZ food-based dietary guidelines reflect current food patterns.
Both the 2008/09 New Zealand Adult Nutrition Survey (2008/09 NZANS) and the 1997 National Nutrition Survey (NNS97) provide detailed information on the dietary intakes of a sample of adults( 4 , Reference Russell, Parnell and Wilson 5 ) with calibration weights available to reflect the NZ population at the time. Both used 24 h diet recall and similar analytical methods including food group coding. The first objective of the present study was to ascertain what changes have occurred over the last decade in the food choices of NZ adults and the second was to determine whether these changes differed by sex and age group. The third objective was to describe sex and age group variation in the food choices of the 2008/09 NZANS participants. This research will provide an insight into key trends with respect to food group choices in NZ.
Methods
Study design and participants
The 2008/09 NZANS (n 4721) and the NNS97 (n 4636) were cross-sectional surveys of nationally representative samples of NZ adults (aged 15 years and above) with area-based sampling frames and oversampling of Māori and Pacific in both surveys( 4 ). In the 2008/09 NZANS there was also oversampling of two age groups (15–18 years and 71 years and over). Participants for the NNS97 were recruited from a sub-sample of the 1996/97 NZ Health Survey with an overall response rate of 50 %. The sample frame used for the NZ Health Survey had three stages. First, meshblocks (primary sampling units) were selected from fourteen geographically defined regions. Meshblocks are geographical units of approximately sixty-five dwellings, defined by Statistics New Zealand. Second, a random sample of households was taken within each meshblock and third, within each household a single participant was selected. Data were collected between December 1996 and November 1997( Reference Russell, Parnell and Wilson 5 ).
For the 2008/09 NZANS, a three-stage sample design was used with a response rate of 61 %. The sampling frame was also three stages; in the first stage meshblocks (primary sampling units) were stratified into twenty-one District Health Boards and selected to ensure geographical representation. Meshblocks can vary in size and were therefore selected proportional to size (with larger meshblocks more likely to be selected). In the second stage a random sample of seven households were selected from each meshblock, an additional twenty dwellings were also selected to screen for Māori, Pacific and the age groups 15–18 years and 71 years and over. Third, one participant from each household was randomly selected. Data were collected between October 2008 and October 2009. We have restricted analyses presented here to adults aged 19 years or more. Full details of methods and designs of the NNS97 and the 2008/09 NZANS are available( 4 , Reference Russell, Parnell and Wilson 5 ).
Informed consent was obtained from all participants. Ethical approval for the 2008/09 NZANS was granted from the Health and Disability Multi-Region Ethics Committee of NZ( 6 ) and ethical approval for the NNS97 was granted from fourteen ethics committees throughout NZ( Reference Russell, Parnell and Wilson 5 ).
Twenty-four hour diet recall
A computer-based multiple-pass 24 h diet recall was used for the collection of dietary intake data for both surveys. The recall software was updated between surveys to accommodate changes to the food supply. Interviews for both surveys took place within participants’ homes( 6 ). A second 24 h diet recall was collected on a sub-sample of participants for both 2008/09 NZANS (25 %) and NNS97 (15 %); however, for the present analyses only the first 24 h diet recall was used. In the initial stage of the diet recall, a ‘quicklist’ of all foods, beverages and dietary supplements was collected. In the second and third stages of the recall a detailed description of all foods and beverages was collected with information on the amounts consumed. Finally, in the fourth stage the foods were reviewed in chronological order and additions and changes made to the diet recall as necessary. Further details are available elsewhere( Reference Russell, Parnell and Wilson 5 , 6 ).
Food group classification
For each survey, all foods and beverages reported were coded to thirty-three main food groups. The food group coding scheme was similar for the two surveys, although in the 2008/09 NZANS some sub-food groups were added to allow for new foods( 6 ). Table 1 shows the classification of food groups used for the current research.
Classification of food groupsFootnote †
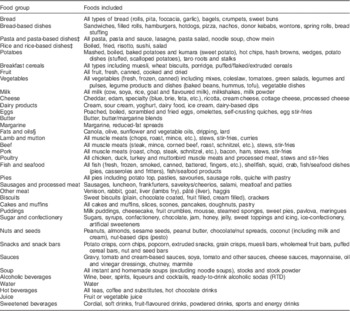
† Adapted from 2008/09 New Zealand Adult Nutrition Survey methodology report( 6 ).
‡ Previously, rice and rice dishes and pasta and pasta dishes were reported together as ‘grains and pasta’.
§ Captures fats and oils used in cooking when recipes were reported and fats and oils added before eating, e.g. olive oil.
In both surveys participants who reported mixed savoury dishes (e.g. casseroles, stir-fries), bread-based dishes (e.g. sandwiches and hamburgers) and salads were asked to report the recipe (both ingredients and amounts). If this was known, the ingredients were coded into separate food groups. For example, for a tomato sandwich, the bread would be coded into the bread food group, the margarine into margarine, the tomato into vegetables. However, if a participant was unable to report all detail of the ingredients, a description of the food was collected and it was coded according to the main food component. For example, a cheeseburger was coded into the sub-food group burgers and hotdogs within the main food group of bread-based dishes. The food group fats and oils captures fats (excluding butter or margarine/table spreads) used in cooking as part of a recipe and fats and oils added to food before consumption (e.g. an olive oil dip).
Statistical analysis
Data were analysed using the statistical software package Stata version 12·1. The data from the two surveys were combined and survey-specific sample weights were used to produce estimates that represented each population at the time of that survey( Reference Korn 7 ). The analytical sub-population excluded participants aged 15–18 years, so the final sample consisted of 8334 people (NNS97, n 4339; 2008/09 NZANS, n 3995). While participants may have been included in both samples, it was not possible to identify any such cases and the frequency of this should be relatively low as each sample included 1·2–1·5 % of the eligible population.
To match groups reported previously, age was categorized into four groups (19–30 years, 31–50 years, 51–70 years, ≥71 years)( 4 ).
To examine changes in the percentage reporting each food group between the two surveys, logistic regression models were created with survey (2008/09 NZANS or NNS97), sex and age group (as described above) entered as independent variables. The adjusted percentage of participants who reported each food group, stratified by sex and age group, was estimated using the ‘margins’ command in Stata 12·1. To examine differential changes by sex and age group, a three-way interaction was entered into the model: sex×age group×survey. Interaction effects for survey×sex were tested within each age group and for survey×age group within males and females separately. Contrasts were conducted to test for: (i) differences between NNS97 and the 2008/09 NZANS for all males and females; and then (ii) within each sex and age group. For the 2008/09 NZANS only, contrasts were conducted to test: (i) differences between males and females overall and within each age group; and (ii) differences by age group. Two-sided P values <0·05 were considered statistically significant in all cases. As this was an exploratory study, no adjustments were made for multiple comparisons and marginal results should be interpreted with caution. The difference between the surveys has been calculated as the percentage reporting the food group in the 2008/09 NZANS minus the percentage reporting the food group in the NNS97 so that positive differences reflect increases in consumption. The contribution to total daily energy from each food group was also calculated.
Sensitivity analysis
To examine whether the removal of low energy reporters altered our results, a sensitivity analysis was completed. Participants with a ratio of energy intake to estimated resting metabolic rate (EI:RMRest) of <0·9 were classified as low energy reporters. The method used to identify low energy reporters was consistent with that used by Pikholz et al.( Reference Pikholz, Swinburn and Metcalf 8 ) and Gemming et al.( Reference Gemming, Jiang and Swinburn 9 ), with specific equations from Swinburn et al. used for NZ Māori and Pacific ethnic groups to estimate fat mass from BMI and RMRest Reference Swinburn, Ley and Carmichael (10 ). Participants with incomplete data for weight and height, and those of non-European ethnicity within the derived NZ European and Others ethnic group were excluded from the sensitivity analysis.
Results
Table 2 shows the demographic characteristics of the 2008/09 NZANS and NNS97 participants. In the 2008/09 NZANS, there was a greater proportion of people in the 51–70 year age group compared with NNS97 reflecting a population-level increase in age( 11 ).
Characteristics of adults (aged 19 years and over) sampled in the New Zealand national nutrition surveys: NNS97 and the 2008/09 NZANS
NNS97, 1997 National Nutrition Survey; 2008/09 NZANS, 2008/09 New Zealand Adult Nutrition Survey; NZEO, New Zealand European and Others.
† Weighted percentage.
‡ From the χ 2 test.
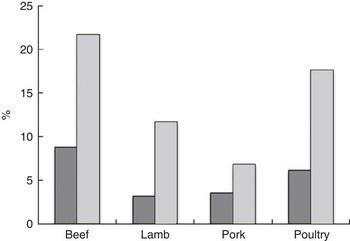
The percentage of mixed dishes within the meat food group, for which participants were unable to report ingredients and amounts of each ingredient, almost doubled between the two surveys (Fig. 1).
Percentage of mixed dishes, not reported as recipes, within meat food groups consumed by adults aged 19 years and over in the 1997 National Nutrition Survey (![]() ; n 4339) and the 2008/09 New Zealand Adult Nutrition Survey (
; n 4339) and the 2008/09 New Zealand Adult Nutrition Survey (![]() ; n 3995)
; n 3995)
Trends in percentage reporting food groups
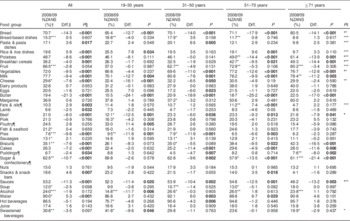
Tables 3 and 4 show for males and females the percentage of participants reporting the consumption of each food group in the 2008/09 NZANS and the difference (expressed as percentage points) from the NNS97. Overall for males and females, there was no evidence of a change in the percentage reporting the following food groups: bread-based dishes; fruit; dairy products; eggs; pork; fish and seafood; sausages and processed meat; nuts; juice; and sweetened beverages (all P>0·05).
Percentage of males reporting each food group in the 2008/09 NZANS and difference from the NNS97 by age group
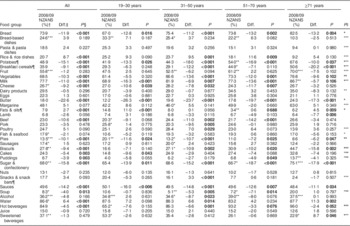
2008/09 NZANS, 2008/09 New Zealand Adult Nutrition Survey; NNS97, 1997 National Nutrition Survey.
† Significant difference compared with females in 2008/09 NZANS: *P<0·05, **P<0·01, ***P<0·001.
‡ Difference from NNS97 as percentage points.
§ P value for comparison between NNS97 and 2008/09 NZANS; significant P values indicated in bold font.
|| Significant relationship between prevalence of consumption and age group for 2008/09 NZANS: *P<0·05, **P<0·01, ***P<0·001.
¶ Potatoes: sex × survey interaction, P=0·006; breakfast cereals: sex × survey interaction, P=0·031; fats & oils: age group × survey interaction, P=0·016; snacks & snack bars: age group × survey interaction, P=0·032.
Percentage of females reporting each food group in the 2008/09 NZANS and difference from NNS97 by age group
2008/09 NZANS, 2008/09 New Zealand Adult Nutrition Survey; NNS97, National Nutrition Survey 1997.
† Significant difference compared with males in 2008/09 NZANS: *P<0·05, **P<0·01, ***P<0·001.
‡ Difference from NNS97 as percentage points.
§ P value for comparison between NNS97 and 2008/09 NZANS; significant P values indicated in bold font.
|| Significant relationship between prevalence of consumption and age group for 2008/09 NZANS: *P<0·05, **P<0·01, ***P<0·001.
¶ Fats & oils: age group × survey interaction, P=0·025; poultry: age group × survey interaction, P=0·024; puddings: age group × survey interaction, P=0·024; sugar & confectionery: age group × survey interaction, P=0·01.
Between the NNS97 and the 2008/09 NZANS, the percentage of participants reporting the consumption of bread, potatoes and breakfast cereals decreased for both males and females (P<0·001). For potatoes and breakfast cereals the decrease within the age group 31–50 years was greater for males than females (survey×sex interactions: potatoes, P=0·006; breakfast cereals, P=0·031). In contrast, for both males and females there was an increase in the percentage who reported rice and rice dishes (males, +8·7 %; females, +5·9 %, P<0·001), and for females only there was an increase in the percentage reporting pasta and pasta dishes (+3·6 %, P=0·017).
There was a decrease of approximately 10 % in all age groups for males and females (apart from those aged 19–30 years and males aged ≥71 years) who reported consuming vegetables (P<0·001). Furthermore, there was a decrease between the two surveys in the percentage who reported consuming milk and cheese (each P<0·001).
The percentage of males and females reporting butter nearly halved in the 12-year period. There was evidence of a differential change in the consumption of fats and oils by age group (survey×age group interaction: males, P=0·016; females, P=0·025). An increase was found for males aged 19–30 years (+11 %, P<0·001) and males aged ≥71 years (+4·5 %, P=0·009) but no evidence of change in the middle age groups. Among females there was an increase in the percentage reporting the consumption of fats and oils for those aged 51–70 years (+7·4 %, P<0·001) but no significant change in the other age groups.
For females the percentage who reported both beef (difference: −8·0 %, P<0·001) and lamb (−2·5 %, P=0·032) decreased and beef also declined for males (−10·6 %, P<0·001). Poultry was the only meat that increased over time, although the increase was significant only among males aged 31–50 years (+7·0 %, P=0·029) and females aged 19–30 years (+11·4 %, P=0·005). Among females there was evidence of a differential change in poultry consumption by age group (survey×age group interaction: P=0·024). The percentage of participants who reported consuming pies nearly halved for males (−10·1 %) and females (−9·8 %) in all age groups (apart from females aged ≥71 years).
The percentage reporting sauces was lower in the 2008/09 NZANS compared with the NNS97 (males, −14·2; females, −11·3 %, P<0·001) and there was also a decrease among males in the percentage reporting soup (−4·0 %, P=0·013).
The percentage reporting biscuits, cakes and puddings was lower in 2008/09 compared with 1997 for both males and females. For females, trends for puddings were inconsistent across age groups (survey×age group interaction: P=0·024).
For all age and sex groups there was a decline in the percentage reporting the consumption of sugar and confectionery apart from females aged 19–30 years. There was a significant increase in the percentage reporting snacks and snack bars between the surveys for females (+4·6 %, P=0·007). Among males the direction of change differed by age group (test for interaction: P=0·032), with males aged 31–50 years more likely to report snacks and snack bars in the 2008/09 NZANS (+3·3 %, P<0·001) and non-statistically significant changes in the other age groups.
Those reporting consuming alcohol declined between the 1997 and 2008/09 surveys among females aged 19–30 years (−11·7 %, P=0·006) and males aged 31–50 years (−8·7 %, P=0·023), but the percentage reporting water as a beverage increased for males and females (P<0·001).
Results from the sensitivity analysis, with the removal of low energy reporters, revealed that trends were in the same direction and of a similar magnitude to those presented in the main results (see online supplementary material, Supplementary Tables 1 and 2). However, the increase in poultry consumption was found to be greater among males with low energy reporters removed (+6·5 %, P=0·008).
Trends in sources of energy from food groups
Reported energy intake decreased between surveys for males in all age groups except those aged ≥71 years. Among females a significant decline was found for those aged 19–30 years (P=0·019; see online supplementary material, Supplementary Table 3).
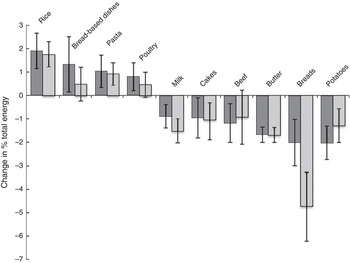
The ten food groups with the greatest change in percentage contribution to daily energy are shown in Fig. 2. Supplementary Tables 4 and 5 (see online supplementary material) provide a comparison for other food groups. In summary, the percentage of daily energy from rice and rice dishes, pasta and pasta dishes, bread-based dishes and poultry increased over time and there was a reduction in the percentage of daily energy from bread, potatoes, beef, milk, butter and cakes. Among females the percentage of daily energy from bread decreased by nearly 5 % (14·8 % to 10·1 %). All trends were in the same direction as those shown for the percentage reporting each food group.
Difference in mean percentage of total energy, between the 1997 National Nutrition Survey (n 4339) and the 2008/09 New Zealand Adult Nutrition Survey (n 3995), consumed by males (![]() ) and females (
) and females (![]() ) aged 19 years and over, for the ten food groups with the greatest change reported. Error bars indicate 95 % confidence intervals
) aged 19 years and over, for the ten food groups with the greatest change reported. Error bars indicate 95 % confidence intervals
Sex and age group comparisons for the 2008/09 New Zealand Adult Nutrition Survey
Differences between males and females are highlighted in Tables 3 and 4 (by asterisks). In the 2008/09 NZANS, males compared with females were more likely to report the consumption of bread-based dishes, pies, alcohol (all P<0·001), sugar and confectionery, sweetened beverages (both P<0·01) and sausages (P<0·05), and were less likely to report fruit (P<0·001), cheese (P=0·025), biscuits (P=0·006), soup (P=0·046) and water (P=0·036). In addition, females compared with males in the youngest age group were less likely to report the consumption of beef and pork (P=0·048 and P=0·049, respectively).
In the last column of Tables 3 and 4, significant associations between each food group and age group are highlighted (with asterisks). For both males and females there was evidence of an increase with age in the percentage reporting the consumption of bread, breakfast cereals, fruit, vegetables and potatoes. For males only there was an increase with age in the percentage reporting milk, cakes, puddings, soup and hot beverages. In contrast, there was a decrease with age in the percentage reporting the consumption of pasta and pasta dishes, rice and rice dishes, bread-based dishes, poultry, snacks and snack bars and sweetened beverages (all P<0·001). Among males the youngest age group was most likely to report fats and oils and least likely to report fish and seafood. The oldest age group was most likely to report consuming soup (males) and least likely to report fats and oils (females). Among males the youngest age group was less likely to report consuming butter compared with the oldest age group.
Discussion
An important finding was a minimum 10 % decrease in the percentage of NZ adults reporting core traditional foods of bread, potatoes, vegetables, beef and milk; in addition to a decrease in the percentage reporting butter, sugar and confectionery, pies and sauces. Bread, potatoes and beef remain major sources of energy and nutrients for the NZ diet. However, their decline and replacement with rice, pasta and poultry is evidence of an increase in dietary diversity. We found little evidence of differential changes in food group consumption by sex and age group. Despite few differences in the direction and magnitude of change by sex and age, our final analyses of the 2008/09 NZANS revealed that food group consumption was sex- and age-specific. In general, females were more likely to have a healthier profile of food selection compared with males and older adults were more likely to choose traditional foods.
Strengths and limitations
A major strength of the current research was the large nationally representative sample. Another strength was the consistent methodology for the 24 h diet recall and the food group coding.
However, no food grouping scheme is optimal; basic foods are easy to classify but mixed dishes require complex decisions and the frequency of these increased in the second survey. Not being able to specify and quantify components of mixed dishes influenced the way they were reported within a diet recall, and hence their food group allocation. For example, in the 2008/09 NZANS, more mixed dishes for which participants did not know the recipe were reported within the meat food groups (Fig. 1). Therefore in the 2008/09 NZANS, the meat food groups (such as beef) included a greater proportion of non-meat food items (such as sauces, rice, potatoes) compared with the NNS97, so they could be described as being more dilute in terms of meat content.
Another factor complicating the comparison between the two surveys is that reported energy intake was lower in the 2008/09 NZANS across all age groups in men and for women aged 19–30 years (Supplementary Table 1). The decline in energy intake observed could be a combination of an actual decline and an increase in under-reporting. All dietary assessment methods are associated with some level of under-reporting. However, an increase in under-reporting over time could have implications for our findings. Secular changes have been documented with respect to increased under-reporting( Reference Rennie, Jebb and Wright 12 ), thought in part to be due to increased health consciousness and social desirability( Reference Scagliusi, Ferriolli and Pfrimer 13 ) and an increased prevalence of overweight and obesity( 4 , Reference Gemming, Jiang and Swinburn 9 , Reference Garriguet 14 ). There is also evidence for selective under-reporting of some foods considered less socially desirable, such as cakes and pastries, sugar and confectionery, and hot chips/French fries( Reference Lafay, Mennen and Basdevant 15 ). In order to take into account the decline in energy intake between the surveys, we also examined trends using percentage of total energy from each food group and conducted a sensitivity analysis with low energy reporters removed. For both analyses the results were consistent and in the same direction as our main analyses (Supplementary Tables 3 and 4). We are therefore confident that the trends we found are robust and reflect what has actually occurred within the NZ population.
Trends in food group consumption
The decline in the consumption of the staple carbohydrate foods, such as bread and potatoes, is congruent with a higher consumption of rice and pasta. Potato consumption has similarly been shown to have declined among adults in the UK( Reference Whitton, Nicholson and Roberts 16 , Reference Wrieden, Armstrong and Sherriff 17 ), France( Reference Dubuisson, Lioret and Touvier 18 ), Spain( Reference Ribas-Barba, Serra-Majem and Salvador 19 ) and Sweden( Reference Krachler, Eliasson and Johansson 20 ). Suggested reasons for the displacement of potatoes in the UK include: (i) the longer time required to prepare and cook potatoes compared with pasta and rice; (ii) an increase in ethnic cuisine; and (iii) increased availability of rice and pasta( Reference Riley 21 ). These reasons are probably also applicable to NZ.
The large decrease we have shown in bread consumption should be closely monitored, in particular among young females. Our findings showed the compensatory increase in percentage of daily energy from bread-based dishes in males but not in females. Given the need to augment iodine intake and considering the reduced use of discretionary iodized salt, it is now mandatory to fortify bread with iodized salt in NZ and Australia( Reference Edmonds and Ryan 22 ). The effectiveness of this programme in NZ may be compromised if bread intake reduces. In addition, bread is a vehicle for folic acid – although unlike iodine, it is not mandatory that bread in NZ be fortified with folic acid( Reference Bradbury, Williams and Mann 23 ). Similar downward trends in bread consumption have occurred in the UK and the decline has been attributed to an increased perception of bread as ‘fattening’, the fad to reduce carbohydrate intake, avoidance due to perceived wheat or gluten intolerance or allergies, and increases in the relative price of bread( Reference O’Connor 24 ). In NZ, those of South Asian, East Asian and South-East Asian ethnicities are less likely than NZ Europeans to report consuming bread( Reference Parackal, Smith and Parnell 25 ). The proportion of these ethnicities is increasing in NZ. Between 1996 and 2006 the ‘Asian’ population approximately doubled to 9·2 % of the population (from 194 800 to 404 400)( 26 ). Bread is still a major source of energy and nutrients in NZ, but the potential nutritional impact of ongoing declines in consumption should be monitored.
Despite an ongoing ‘5+A Day’ campaign in NZ, fruit intake has not changed since 1997. In contrast, fruit intake in the UK and France has increased( Reference Whitton, Nicholson and Roberts 16 , Reference Dubuisson, Lioret and Touvier 18 ). Furthermore, our findings indicate a decrease in the percentage reporting the food group vegetables, although this may be partly offset by a greater intake of vegetables from mixed dishes. Work is currently in progress to disaggregate mixed dishes to provide a complete estimate of vegetable intake as has been conducted in the UK( Reference Fitt, Mak and Stephen 27 ) and the USA( Reference Branum and Rossen 28 ).
Between 1995 and 2002, the per capita red meat supply in NZ decreased by 36 %( Reference Laugesen 29 ). Descriptive results reported elsewhere showed Fe and Zn intakes declined for males between the NNS97 and 2008/09 ANS, and Zn intake declined among females( 4 ). A reduction in beef and lamb consumption has also been shown in other countries, including the USA( Reference Wang, Beydoun and Caballero 30 ) and in Australia along with an increase in poultry( Reference Espinel and Innes-Hughes 31 ). Our results revealed beef consumption decreased most among women aged 19–30 years, the age group most in need of haem Fe. However, a large increase in poultry consumption may to some extent have countered this effect. Young females may perceive chicken as light and fresh (‘feminine’ food), healthy (low in fat), versatile due to its blandness and convenient (portions that are easy to cook and prepare)( Reference Kennedy, Stewart-Knox and Mitchell 32 ). As in the UK( Reference Whitton, Nicholson and Roberts 16 ), poultry is now the most commonly eaten meat in NZ.
Our results show a reduction in reported butter consumption with concurrent small increases in fats and oils, and margarine. However, care should be taken in interpreting these results. The food group fats and oils included known ingredients in mixed dishes entered as a recipe. It also captures fats and oils possibly added before consumption, such as olive oil as a dip for bread. Similarly, butter and margarine consumption reflects known ingredients in mixed recipes (including sandwiches) and that added to food as a spread, but not baked goods and bread-based dishes (for which participants did not report recipes), and therefore we do not have a complete picture of consumption of various fats and oils. The percentage of daily energy from table spreads and margarine declined over the study period, possibly reflecting the greater availability of reduced-fat table spreads and the decline in bread consumption.
In 2008, food prices in NZ rose by 8 % from the previous year, the largest annual increase in food prices since 1990. There were substantial increases between 2001 and 2008 in the price of butter (89 %) and milk and cheese (22 %)( 33 ). Prices for these foods have continued to rise and this may have had a lasting impact on food choices( 34 ). It is interesting that although the percentage reporting milk declined, Ca intake was similar between the surveys for females and increased for males( 4 ). This may be because of increased fortification of dairy products, including Ca-enriched milk which was not available in 1997.
We found a decline in the percentage reporting some ‘eat less’ foods (sugar and confectionery, cakes, biscuits and puddings). This change may explain the significant decrease in sucrose intake reported for males between the two surveys( 4 ). There was a small increase in those reporting snack foods such as crisps and cereal bars. Within an Australian context, Branwell et al. argue that the disappearance of puddings and desserts is indicative of wider changes with respect to family eating habits which are driven by greater time pressures and increased availability of more convenient treats that can be eaten at any time of day( Reference Banwell, Broom and Davies 35 ).
Meat pies are considered an iconic national dish in NZ( Reference Bell and Neill 36 ). However, the combination of the pastry and poor-quality meat means they are often high in fat. Although still a popular takeaway food( Reference Smith, Gray and Fleming 37 ), their popularity is clearly waning.
Sex and age differences
The current analysis shows that there are differences in reported food choice between males and females across all age groups. This is congruent with other research which has shown a greater intake of foods such as fruit and vegetables among females( Reference Wardle, Haase and Steptoe 38 – Reference Roos, Lahelma and Virtanen 40 ). Females have been described as having a more ‘virtuous’ approach to food compared with males( Reference Beardsworth, Bryman and Keil 39 ). They are more likely to report to adhering to dietary guidelines and more inclined to consider moral and ethical issues surrounding food choice( Reference Beardsworth, Bryman and Keil 39 ).
The greater contribution of meat to the diet of males compared with females has been shown in Europe( Reference Ocke, Larrañaga and Grioni 41 , Reference Prättälä, Paalanen and Grinberga 42 ) and the USA( Reference Wang, Beydoun and Caballero 30 ). In the 2003–04 National Health and Nutrition Examination Survey males compared with females reported a higher intake of red meat but a lower intake of poultry( Reference Wang, Beydoun and Caballero 30 ). Research in the UK found more females reported they had decreased red meat intake in the past 10 years or had avoided red meat compared with males( Reference Beardsworth, Bryman and Keil 39 ). In our study we did not find evidence of a difference between males and females in the percentage who reported consuming beef, lamb or poultry or in the percentage of daily energy they contribute. We found, however, that males compared with females were more likely to report pies (mostly meat pies) and sausages and processed meats, all of which are higher in fat than leaner cuts of meat.
Nutrition education is frequently aimed at females as the gatekeepers of family health. Nevertheless, males carry a greater burden in terms of diet-related chronic disease. In 2006 CHD accounted for nearly double the number of deaths (12 %) in males compared with females (7 %) in NZ( 43 ). Males are increasingly sharing the food preparation for a household( Reference Gatley, Caraher and Lang 44 ) and may be a more important influence, and thus targets for future interventions. Health promotion campaigns targeting males should focus on decreasing consumption of processed meats, alcohol and sweetened beverages and on increasing both fruit and vegetable intakes.
Trends were in the same direction and of a similar magnitude by age group for nearly all food groups. This suggests that changes to the food supply and environment have impacted on different age groups equally. However, clear differences were found in food choices by age in the 2008/09 NZANS. Older adults were more likely to report fruit, vegetables, bread and potatoes compared with younger adults. They were also more likely to report cakes, puddings and biscuits compared with younger age groups, but were less likely to choose snacks, snack bars and sweetened beverages. Our results suggest older adults were more likely to follow a traditional NZ diet pattern with lower intakes of pasta and rice. To support this view, in previous research we found that young NZ adults were more likely to consume fast food compared with older adults( Reference Smith, Gray and Fleming 37 ).
Devine argues that a life-course approach should be taken to understand food preferences( Reference Devine 45 ). Earlier food preferences are maintained as we age and ‘past food experiences set the stage for current food choices’( Reference Devine 45 ). People born at different times have been exposed to different environments, nutritional information and dietary guidelines( Reference Devine 45 ). Some dietary changes occur in response to life events, such as pregnancy, but many dietary patterns are taken forward as we age. The dietary choices of the younger age groups do give some indication of future habits.
Conclusions
Food is inextricably linked to culture and changes to dietary patterns can be slow. However, in the past 50 years, with changes in agriculture we have seen the fastest change in food supply in human history. The present paper gives an overview of trends in adults’ food group consumption between two NZ national surveys over a 12-year period. We have found a reduction in the consumption of beef, potatoes and bread, all traditional pillars of a NZ diet; in contrast, there has been an increased consumption of rice and pasta. Greater inclusion of mixed dishes (such as stir-fries) provides challenges to the way we assess food intake and estimate amounts consumed in the future.
Further, in-depth analyses at the sub-food group level with consideration of the impact on nutrient intakes resulting from some of the key trends would be useful. A decrease in the percentage reporting pies, sugar and confectionery, biscuits, cakes, puddings and butter can be seen as change in a more healthful direction and in congruence with dietary guidelines. Our findings, however, do not demonstrate an improvement in fruit consumption and also show increases in the percentage reporting snacks and snack bars.
Acknowledgements
Financial support: The NZ Ministry of Health funded the surveys, which were undertaken collaboratively with the University of Otago. The NZ Crown is the owner of the copyright for the survey data. The results presented in this paper are the work of the authors. Conflict of interest: None. Authorship: L.A.M. and E.A.F. authors contributed equally to this work. C.S. conceived the paper, analysed the data and drafted the manuscript. A.R.G. was a statistician for the 2008/09 NZANS and provided statistical advice for this analysis. W.R.P. was a Principal Investigator for the 2008/09 NZANS and the NNS97. E.A.F. was a Nutritionist on the 2008/09 NZANS and L.A.M. on the NNS97. All authors were involved in interpretation of the data and revisions of the paper. All authors read and approved the final manuscript. Ethics of human subject participation: This study was conducted according to the guidelines laid down in the Declaration of Helsinki and all procedures involving human subjects/patients were approved by the Health and Disability Multi-Region Ethics Committee of New Zealand (2008/09 NZANS) and fourteen ethics committees throughout New Zealand (NNS97).
Supplementary material
To view supplementary material for this article, please visit http://dx.doi.org/10.1017/S1368980015000890


