


INTRODUCTION
The continuing rapid retreat of glaciers and ice sheets is one of the most prominent signs of climate change (Stocker and others, Reference Stocker2013). With the rapid shrinkage of glaciers, increased glacial meltwater runoff has become an important contributor to downstream water ecosystems (Huss, Reference Huss2011). Hood and others (Reference Hood, Battin, Fellman, O'Neel and Spencer2015) estimate that the global-scale glacier storage is ~6 Pg of organic carbon, most of which (77%) is in the form of dissolved organic carbon (DOC), and 15.34 Tg of DOC (0.43 Tg C yr−1) is expected to be liberated from glacier storage by 2050 with the majority (9.68 Tg, or 63%) coming from mountain glaciers. Due to the cascading impacts on nutrient and carbon cycle of downstream systems, the biogeochemical effects of glacial meltwater runoff have received increasing attention (Milner and others, Reference Milner2017).
Mountain glaciers are well developed in western China, with a total area of 43 087 km2 based on the results of the second Chinese glacier inventory (Guo and others, Reference Guo2015). Liu and others (Reference Liu, Xu, Kang, Li and Li2016) estimated DOC release rates from Chinese mountain glaciers was up to 15.4 ± 6.1 Gg yr−1. High bioavailability of DOC was found in glacier runoff in western China (Spencer and others, Reference Spencer2014). For example, Yan and others (Reference Yan2016) found that the bioavailability of DOC in surface snow samples from Laohugou glacier no. 12 (LHG) on the northern Tibetan Plateau (TP) was 46.2% of the total DOC concentration. Feng and others (Reference Feng2016) revealed the fingerprint of microbially derived dissolved organic matter (DOM) in cryoconite sampled from the ablation zone of LHG, and suggested that fresh snow and granular ice on the surface of TP glaciers could contain autochthonous DOM produced by an in situ microbial process. However, the composition and sources of DOM in snow samples in this region are still poorly understood. In this study, we attempt to investigate the DOM composition and source in connection with snowmelting processes, based on the collection and analysis different categories of snow samples in LHG.
MATERIALS AND METHODS
Sites and sampling
LHG (39.42° N, 96.55° E; 4260–5483 m a.s.l.; Fig. 1) is the largest valley glacier (9.85 km, 20.4 km2) in the Qilian Mountains at the northern TP. The altitude of the main peak, Daxueshan, is 5483 m. The glacier is the main water source for the Shule River which is the second river in the Hexi Corridor of Gansu province. Climate at LHG is dominated by the East Asian monsoon in summer, and westerlies in winter. Precipitation from May to September accounts for ~70% of the annual total (~350 mm) and is mainly influenced by the East Asian monsoon (Li and others, Reference Li, Qin, Sun, Zhang and Yang2012). The average annual temperature recorded by automatic weather station is ~−6 °C at the glacier terminus (Xu and others, Reference Xu2013). Arid and semiarid regions surround this region, with Tarim Basin (Taklimakan Desert) to the west, Qaidam Basin to the southwest, and the Gobi Desert to the north (Xu and others, Reference Xu2013). Like other glaciers on the TP, LHG has been experiencing significant and accelerating thinning and shrinkage since the mid-1990s (Du and others, Reference Du, Qin and Liu2008; Zhang and others, Reference Zhang, Liu, Shangguan, Li and Zhao2012). The average snow line of LHG retreated from 4800 to 4900 m between 1959 and 2006 (Du and others, Reference Du, Qin and Liu2008), and remote-sensing imagery shows the snow line at ~5000 m in recent years.
Location of the LHG and the sampling sites in this glacier.
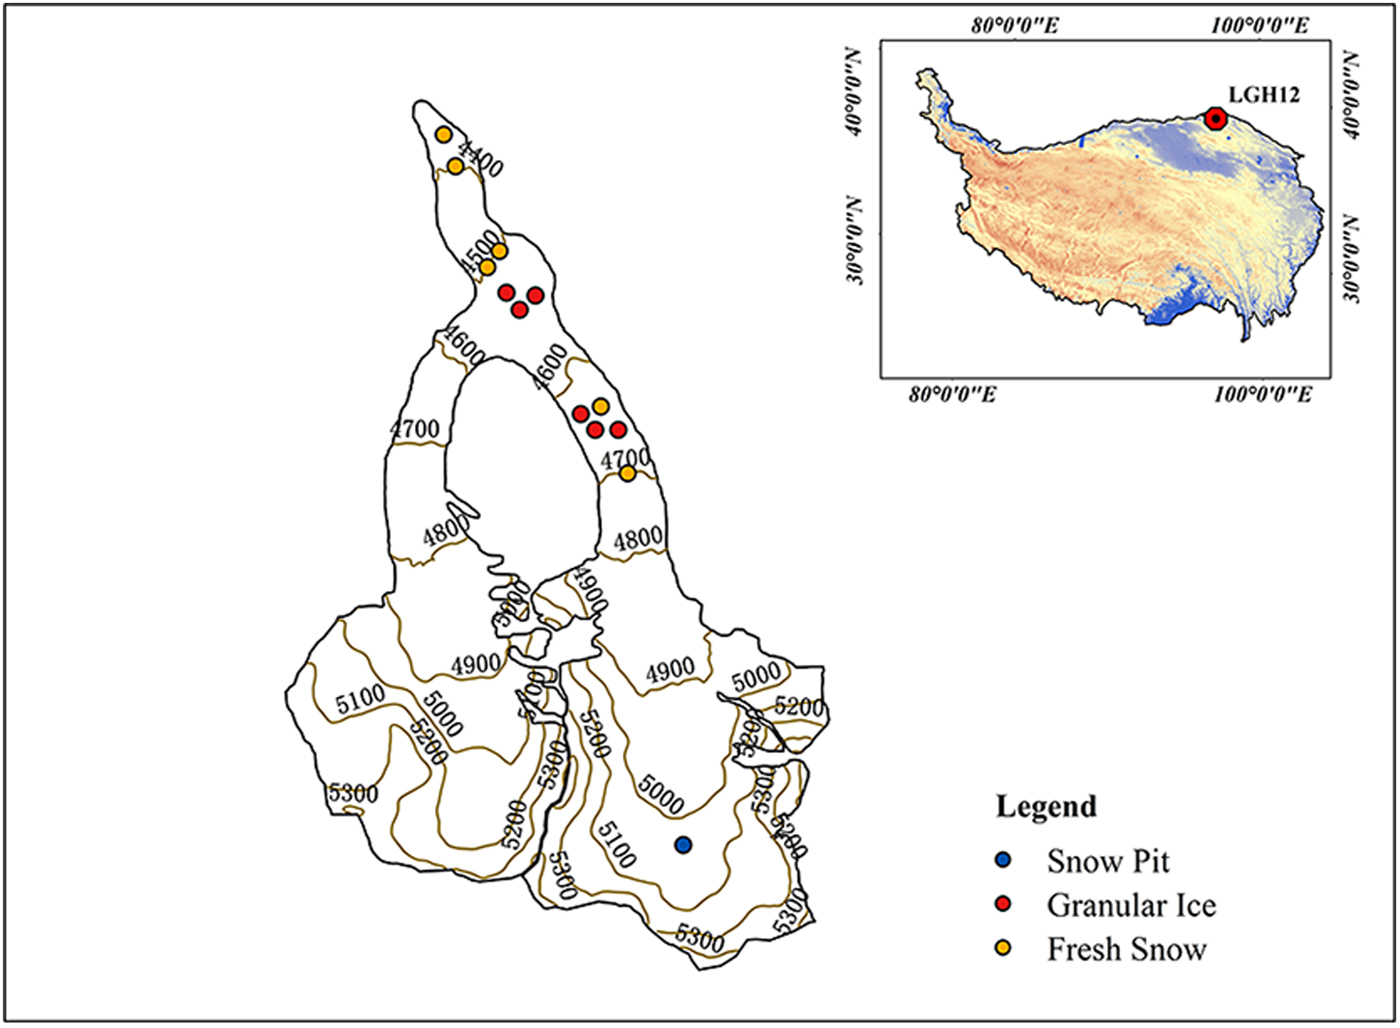
Six surface fresh snow and six surface granular ice samples were collected on 23 September 2015 in the ablation zone using a stainless steel scoop (Table 1). Granular ice samples represent aged snow that is subject to melting–freezing cycles. All samples were collected in a precleaned glass bottle (soaked in 1% alconox solution overnight, rinsed with Milli-Q water, and combusted at 400 °C for 6 h). In addition, a snow pit was dug in the accumulation zone at 5050 m a.s.l. on LHG on 25 August 2015 (Yan and others, Reference Yan2016). Snow samples were collected in Whirl-Pak bags (Whirl-Pak®, Nasco, USA) using a Teflon ice scoop continuously at 5 cm depth intervals from the bottom to the top of the snow pit by personnel wearing clean suits, masks and gloves. In total, 23 snow samples were collected from the pit. The samples were all stored in the dark using a cooler box during 1–2 days of transport. After arriving at the laboratory, they were stored at −18 °C until analysis. Prior to analysis, they were melted at room temperature in a dark environment. Once completely melted, they were filtered through a 0.45 µm capsule filter (Pall AquaPrep 600) using a precleaned filter holder.
Sampling information for snow, ice and snow pit in this study

DOC analysis
Filtered fresh snow and granular ice samples were first analyzed for DOC. In order to remove inorganic carbonates, 100 µL of 10% hydrochloric acid was used to acidify a 10 mL aliquot of melted fresh snow and granular ice sample. The sample was then analyzed using a Vario EL CN analyzer (Elementar, Hanau, Germany). The oxidization of non-purgable organic carbon in the sample at a combusting temperature of 850 °C in a carrier gas with controlled O2 concentration made gases containing carbon converted to CO2, which was measured using a non-dispersive infrared analyzer (Xu and others, Reference Xu2015).
We adopted the DOC concentration data for snow pit samples from LHG that were presented by Yan and others (Reference Yan2016). Their study focused on the bioavailability and light-absorbing features of DOC. In this case, the DOC concentrations of snow pit samples were analyzed by using a TOC-5000A analyzer (Shimadzu Corp, Kyoto, Japan). Acidified water samples (10 mL) were placed in muffled glass vials and sparged immediately before analysis. Sparged samples (100 µL) were injected into a combustion tube (the oxygen carrier gas was passed through and the combustion tube was heated to 680 °C) containing a Shimadzu catalyst (0.5% Pt on alumina). After passing through the combustion tube, the gas stream was bubbled through a 25% H3PO4 solution and passed through an electronic dehumidifier and halogen scrubber before entering the detector. The non-dispersive infrared detector and the integrator in the Shimadzu instrument were used without modification to quantify CO2.
These two different DOC analyzers employ a similar analytical method. The only difference being that the Vario EL CN analyzer can reach a higher combusting temperature (860 °C) than the TOC-5000A analyzer (680 °C), which led to a somewhat higher DOC concentration being determined by the former.
Absorption measurements
Measurements of light absorbance of all samples were analyzed using an ultraviolet-visible (UV-Vis) absorption spectrophotometer (UV-2700, Shimadzu, Japan) with a 5 cm quartz cuvette. The spectrum ranged from 200 to 900 nm with 1 nm step. The measurement used Milli-Q water sample as reference whose mean absorbance at 690–700 nm was subtracted for baseline correction of each absorbance spectrum. Optical density (absorbance value) and the corresponding absorption coefficient were obtained from
 $$a(\lambda ) = 2.303 \times A(\lambda )/L$$
where A(λ) is the measured absorbance for wavelength λ, L is the path length of the optical cell (L = 0.05 m) and the factor 2.303 is common-to-natural logarithm transformation.
Isotope analysis
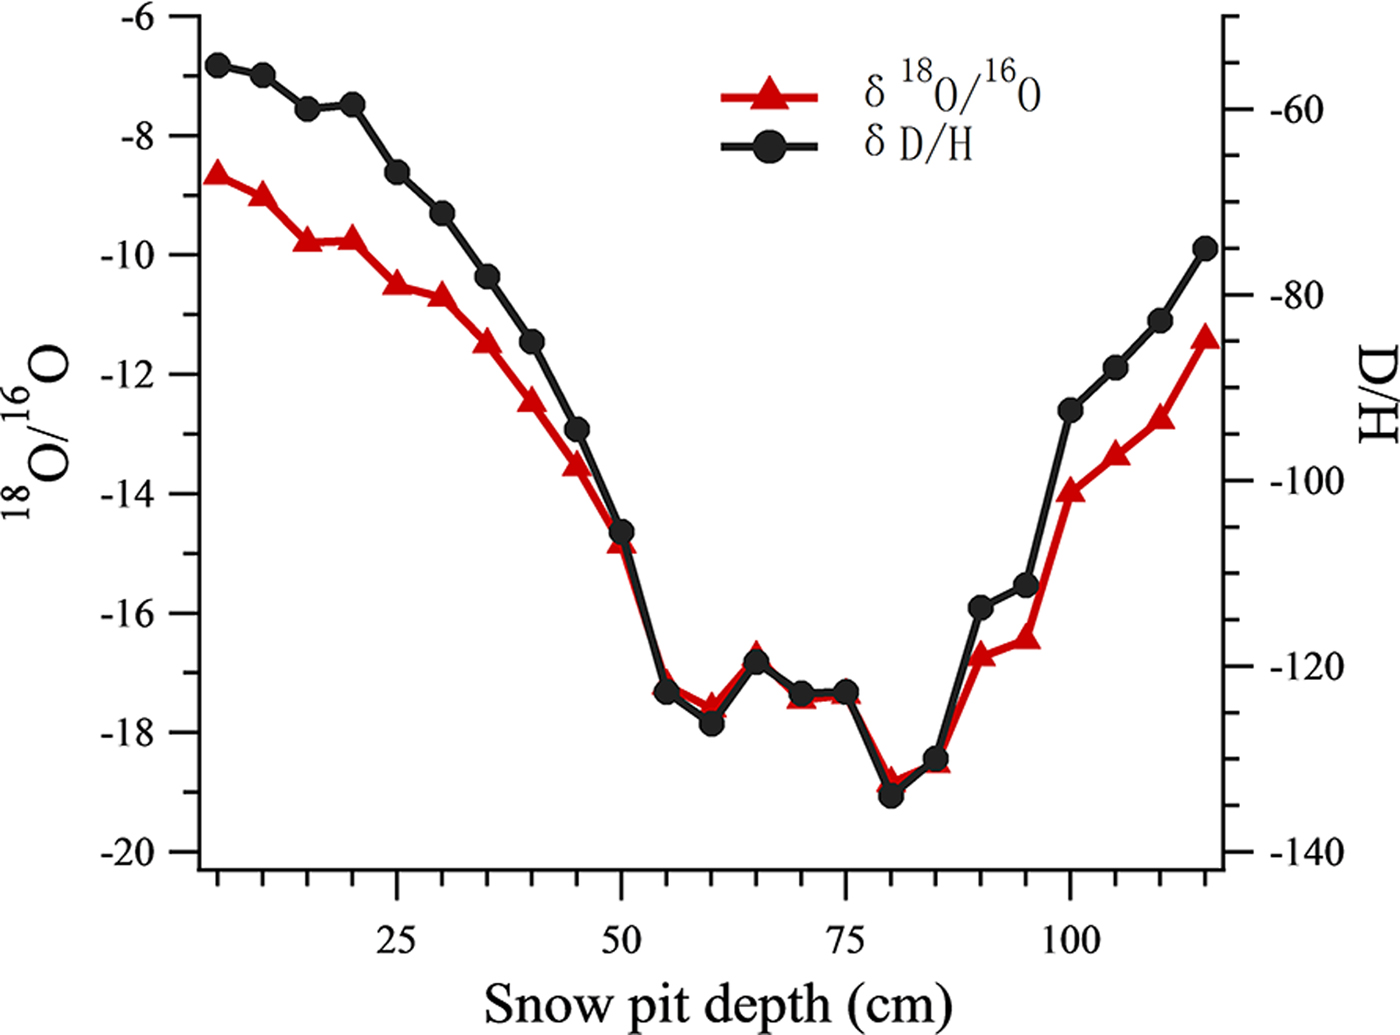
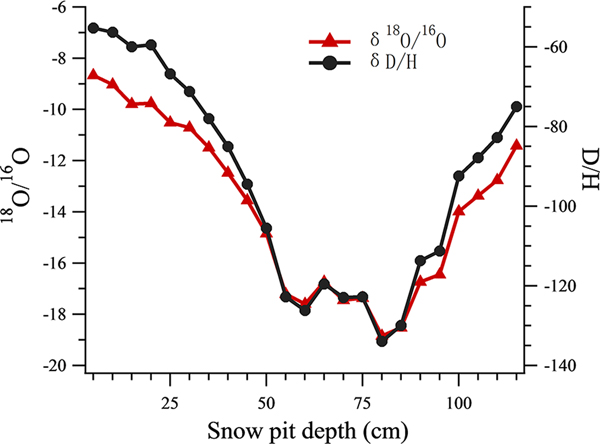
All the isotope data of snow pit samples were analyzed using a Picarro-2130i liquid water isotope analyzer (Picarro Inc., Santa Clara, CA) with an analytical precision of ±0.1‰ for δ18O, and ±0.4‰ for δD. The oxygen isotopic ratio (δ18O) was then used as an air temperature index (Tian and others, Reference Tian, Masson-Delmotte, Stievenard, Yao and Jouzel2001; Cui and others, Reference Cui2014) (Fig. 2), such that snow samples in the snow pit were classified into warm or cold periods using a threshold δ18O value of −14. 13 samples were grouped into the warm period and 10 samples were grouped into the cold period.
The δ18O record and δD record at different depths of the snow pit.
Three-dimensional fluorescence measurement
The excitation–emission matrix (EEM) fluorescence of samples was determined using a Hitachi F-7000 fluorescence spectrometer (Hitachi High-Technologies, Tokyo, Japan) equipped with a 150 W xenon arc lamp as the light source. Fluorescence scans were performed at 5 nm intervals from 250 to 450 nm excitation and monitored at 1 nm intervals from 250 to 600 nm emission. The spectra were recorded at a scan rate of 2400 nm min−1 using excitation and emission slit bandwidths of 5 nm.
All scans were Raman-corrected by subtracting the spectrum for Milli-Q water scanned under identical conditions. Rayleigh scatter effects were eliminated by replacing the EEM triangular regions of emission wavelength (wavelengths ⩽ excitation wavelength + 15 nm), and (wavelengths ⩾2 × excitation wavelength − 20 nm), with zeros (Zhang and others, Reference Zhang2010; Zhou and others, Reference Zhou2015). The EEMs were corrected for inner filter effects with absorption spectra obtained on a Shimadzu UV-2700 spectrophotometer with a 5 cm quartz cuvette and with Milli-Q water as a reference (Zhou and others, Reference Zhou2015). The fluorescence was finally calibrated to the water Raman signal at an excitation wavelength of 350 nm (Lawaetz and Stedmon, Reference Lawaetz and Stedmon2009), and the fluorescent results are given in Raman units (RUs). Excitation wavelengths at 200–225 nm and emission wavelengths at 250–299 and 550–600 nm were deleted in order to further eliminate unreliable instrumental measurements in these regions.
Parallel factor analysis (PARAFAC) modeling
PARAFAC, a three-way method, is applied to divide the CDOM fluorescence into separate fluorescent signals (Stedmon and Bro, Reference Stedmon and Bro2008). This analysis was carried out with MATLAB 2015b software using the DOMFluor toolbox. PARAFAC was applied to our EEM dataset (35 samples × 250 emissions × 45 excitations), with some analytical and statistical assumptions as reported by Stedmon and Bro (Reference Stedmon and Bro2008).
The characteristic parameters of EEM fluorescence spectroscopy, such as biological index (BIX) and humification index (HIX), were critical in determining the DOM sources (Fellman and others, Reference Fellman, Hood and Spencer2010). The BIX, which measures the proportion of biogenic and exogenous organic matter, is the ratio of emission intensity at 380 nm divided by the emission intensity maximum observed between 420 and 435 nm, obtained at excitation 310 nm (Parlanti and others, Reference Parlanti, Wörz, Geoffroy and Lamotte2000; Fellman and others, Reference Fellman, Hood and Spencer2010). Values of BIX < 0.6 show fewer authigenic components, while BIX ranging from 0.8 to 1.0 indicates that biological or microbial origin mainly contributes to DOM (Birdwell and Engel, Reference Birdwell and Engel2010). The HIX demonstrates the humification or degree of maturity of organic matter. HIX is obtained from the ratio of the fluorescence peak value within emission wavelength 435–480 and 300–345 nm, at the excitation wavelength 254 nm (Ohno, Reference Ohno2002).
Electrospray ionization (ESI)-Fourier transform ion cyclotron resonance mass spectrometry (FT-ICR MS) analysis
Prior to ESI-FT-ICR MS analysis, the samples were preconcentrated using PPL (Agilent Bond Elut-PPL cartridges, 500 mg, 6 mL) solid phase extraction (SPE) cartridges and followed a protocol that has already been described (Dittmar and others, Reference Dittmar, Koch, Hertkorn and Kattner2008; Feng and others, Reference Feng2016). Generally, three column volumes of acidified ultrapure water (pH = 2, LC-MS grade HCl) and 20 mL LC-MS grade methanol were used to prime the PPL cartridges. Using 0.1 M LC-MS grade HCl, ~150 mL of each sample was brought to pH = 2, and then passed through the PPL cartridges at 1 mL min−1. When the cartridges were dried, ~10 mL of methanol was applied to elute all samples, which were then concentrated to ~1 mL using N2 and promptly stored at 4 °C. Following the same manner, Milli-Q water was processed as a procedural blank.
The samples were analyzed using a solariX XR FT-ICR MS (Bruker Daltonik GmbH of Bremen, Germany) equipped with a 9.4 T superconducting magnet (Bruker Biospin, Wissembourg, France) and the Paracell analyzer cell. The samples were ionized in positive ion modes using the ESI ion source (Bruker Daltonik GmbH, Bremen, Germany). Ions were accumulated in a hexapole ion trap for 1.0 s before being transferred to the ICR cell. Data of 4 M word size were recorded to acquire the time-domain signal. The detection mass spectrum ranged from m/z 150 to m/z 800. The signal-to-noise ratio (S/N) and dynamic range were strengthened according to 100 continuous FI-ICR transients. Procedural blanks were also obtained in accordance with the same procedure to check potential contamination. A typical mass-resolving power (m/Δm 50%, in which Δm 50% is the magnitude of the mass spectral peak full width at half-maximum peak height) was calculated to be over 400 000 at m/z, with the absolute mass error <0.5 ppm. It is important to note that the mass spectra of different characteristic molecules may be affected by different SPE, ionization mechanism, parameters and data acquisitions. For using PPL SPE cartridge, the most hydrophilic compounds such as inorganic ions, and low-molecular-weight organic molecules such as organic acids and sugars were removed, whereas the relatively hydrophobic fraction was retained.
Molecular formula assignment
Molecular formula assignments for all ions were acquired based on a S/N of mass peak >10 with a mass tolerance of ±1.5 ppm using a customized software. Molecular formulae with the maximum number of atoms were set to: 30 12C, 60 1H, 20 16O, 3 14N, 1 32S, 1 13C, 1 18O and 1 34S. Identified formulas containing isotopomers (i.e. 13C, 18O or 34S) were not considered. Double bond equivalence (DBE) = (2c + 2 − h + n)/2 was adopted to calculate the number of double bonds and rings in regard to the chemical formula CcHhOoNnSS (McLafferty and Turecek, Reference McLafferty and Turecek1993). The van Krevelen diagram was then employed as a graphical method for qualitatively analyzing the major classes of compounds (such as lipids, aliphatic/proteins, carbohydrates, etc.) within the complicated spectrum. This diagram represents an element–ratio plot, in which each point represents the molar ratio of hydrogen to carbon (H/C) on the y-axis and molar ratio of oxygen to carbon (O/C) on the x-axis for a specific molecule (Grannas and others, Reference Grannas, Hockaday, Hatcher, Thompson and Ellen2006; Hockaday and others, Reference Hockaday, Purcell, Marshall, Baldock and Hatcher2009; Ide and others, Reference Ide2017). We also combined the modified aromaticity index (AImod) (Koch and Dittmar, Reference Koch and Dittmar2006, Reference Koch and Dittmar2016) to identify the biomolecular class. AImod is a measure of the probable aromaticity for a given molecular formula assuming that half of the oxygen atoms are doubly bound and half are present as σ bonds and was calculated as:
 $$\eqalign{\hbox{A}\hbox{I}_{{\rm mod\;}}& = (1 + \hbox{C} - 0.5\hbox{O} - \hbox{S} - 0.5[\hbox{N} + \hbox{P} + \hbox{H}])/\cr&\quad(\hbox{C} - 0.5\hbox{O} - \hbox{N} - \hbox{S} - \hbox{P})$$
Formulas with AImod ⩾ 0.5 and <0.67 were assigned as aromatics, while formulas with AImod ⩾ 0.67 were assigned as condensed aromatics (Koch and Dittmar, Reference Koch and Dittmar2006). Seven biomolecular classes in the molecular compound were partitioned on account of the values of O/C and H/C (Hockaday and others, Reference Hockaday, Purcell, Marshall, Baldock and Hatcher2009; Antony and others, Reference Antony2014; Lu and others, Reference Lu2015). The seven classes were (1) lipids (0 ⩽ O/C < 0.3, 1.5 < H/C < 2.4), (2) aliphatic/proteins (0.3 ⩽ O/C ⩽ 0.67, 1.5 < H/C < 2.4), (3) carbohydrates/amino sugars (0.67 < O/C < 1.2, 1.5 < H/C < 2.4), (4) unsaturated hydrocarbons (0 < O/C < 0.1, 0.7 ⩽ H/C ⩽ 1.5), (5) lignins/carboxyl-rich alicyclic acids (0.1 ⩽ O/C ⩽ 0.67, 0.7 ⩽ H/C ⩽ 1.5, AI < 0.67), (6) tannins (0.67 < O/C < 1.2, 0.5 ⩽ H/C ⩽ 1.5, AI < 0.67) and (7) condensed aromatics (0 < O/C ⩽ 0.67, 0.2 ⩽ H/C < 0.7, AI ⩾ 0.67).
RESULTS AND DISCUSSION
DOC concentrations and UV-Vis properties of the DOM
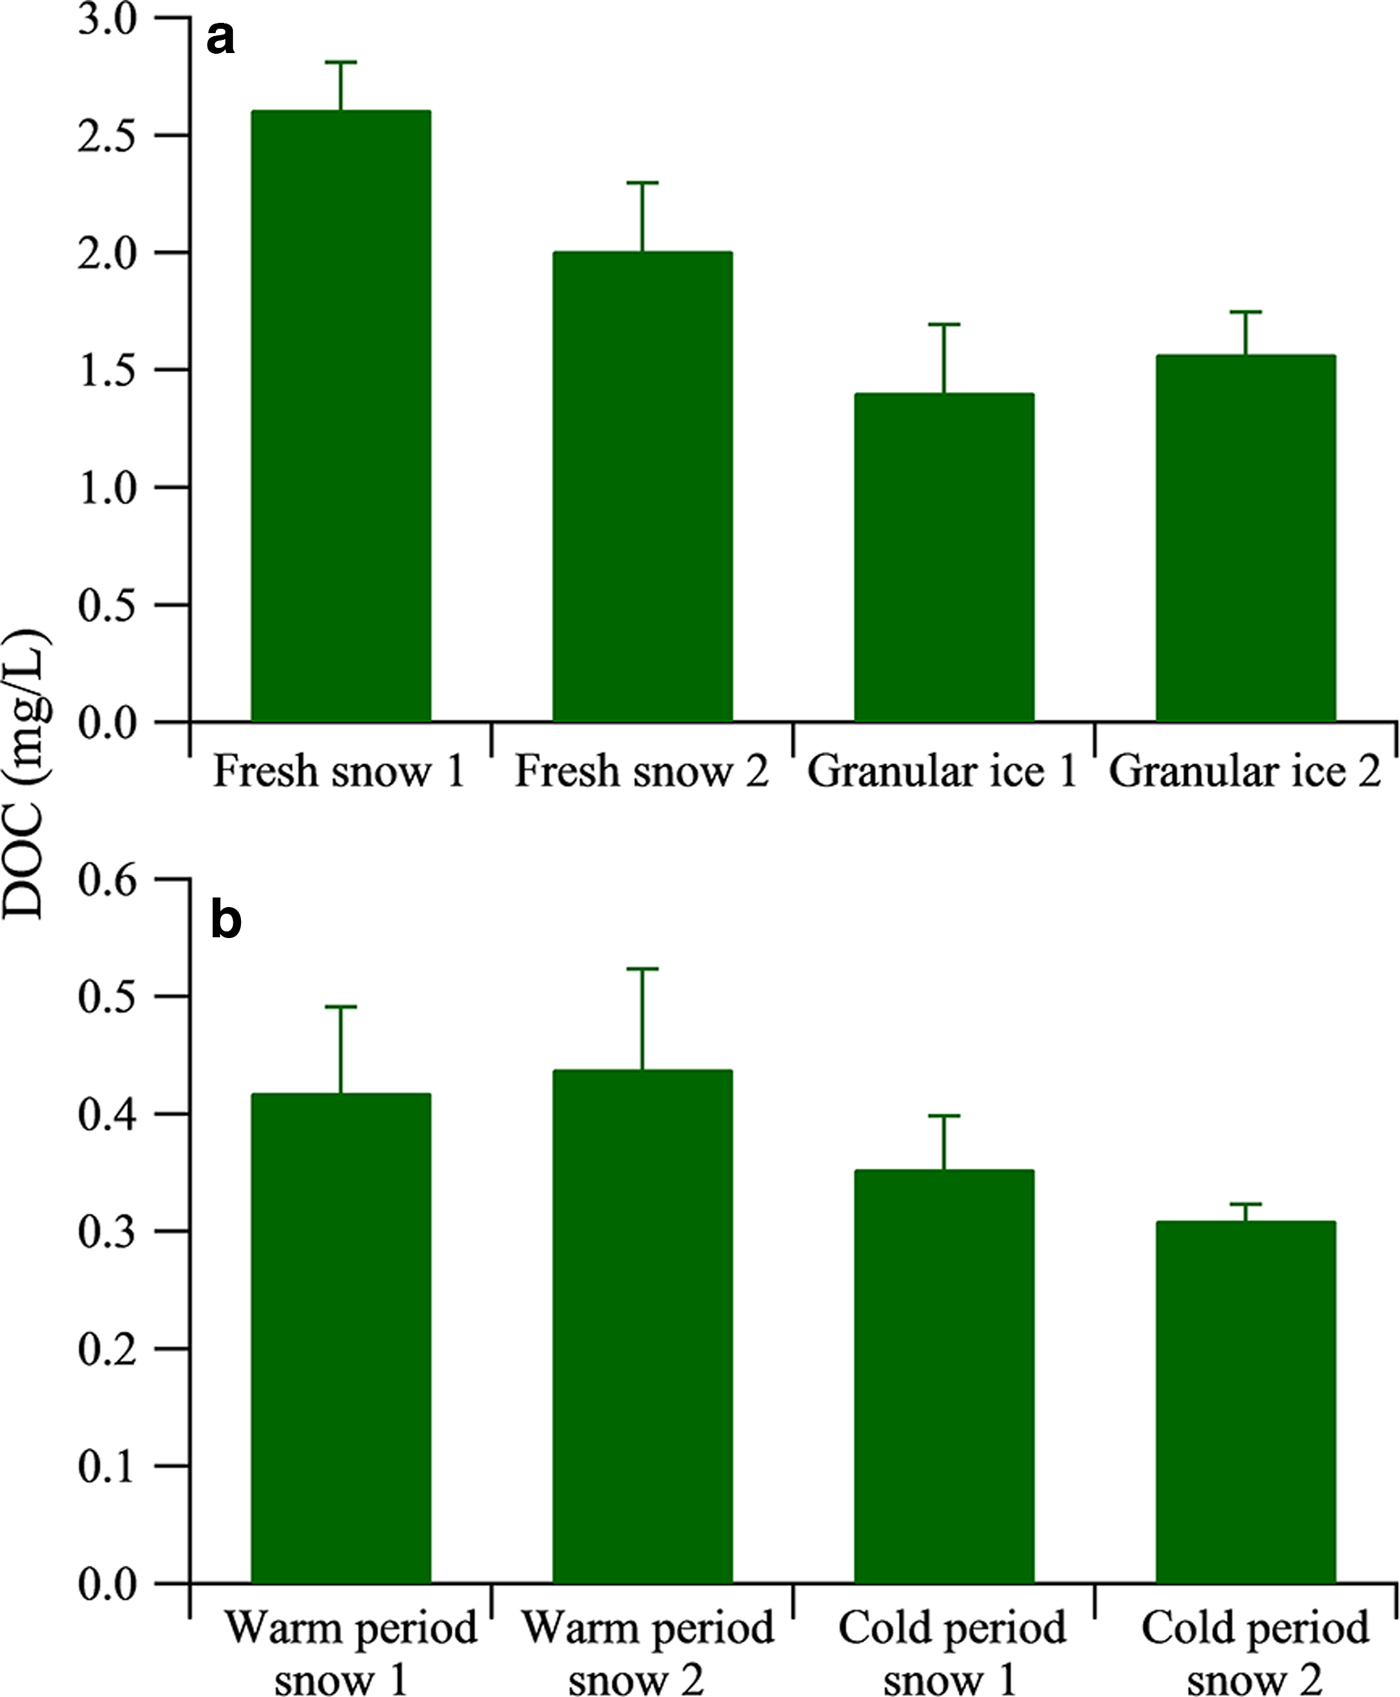
DOC concentrations in the fresh snow ranged from 2.00 to 2.61 mg L−1 (Fig. 3a), which is comparable with the values reported from Mount Yulong (2.03 mg L−1) (Niu and others, Reference Niu2016) but higher than those from Dongkemadi Glacier on Mount Tanggula (0.32 mg L−1) in the central TP, collected during summer 2015 (Feng and others, Reference Feng2017). Granular ice samples had DOC concentrations ranging from 1.40 to 1.57 mg L−1, lower than those of the fresh snow samples, likely due to photolysis of DOC and/or loss during the snowmelt–freezing process. DOC concentration in the snow pit samples had higher values during the warm period, ranging from 0.42 to 0.44 mg L−1, and lower values during the cold period, ranging from 0.35 to 0.31 mg L−1 (Fig. 3b) (Yan and others, Reference Yan2016). The occurrence of higher values during the warm period is due to the development of mountain-valley wind circulation from planetary boundary layer to free troposphere (Xu and others, Reference Xu2013). In addition, the higher DOC concentration in the warm period could also be from microbial activity during the melting process as illustrated by our FT-ICR MS analysis below.
Average mass concentrations of DOC in fresh snow, granular ice (a) and snow pit samples (b). The data of DOC concentration of snow pit samples are adopted from Yan and others (Reference Yan2016). The error bars indicate the Std dev. (1σ).
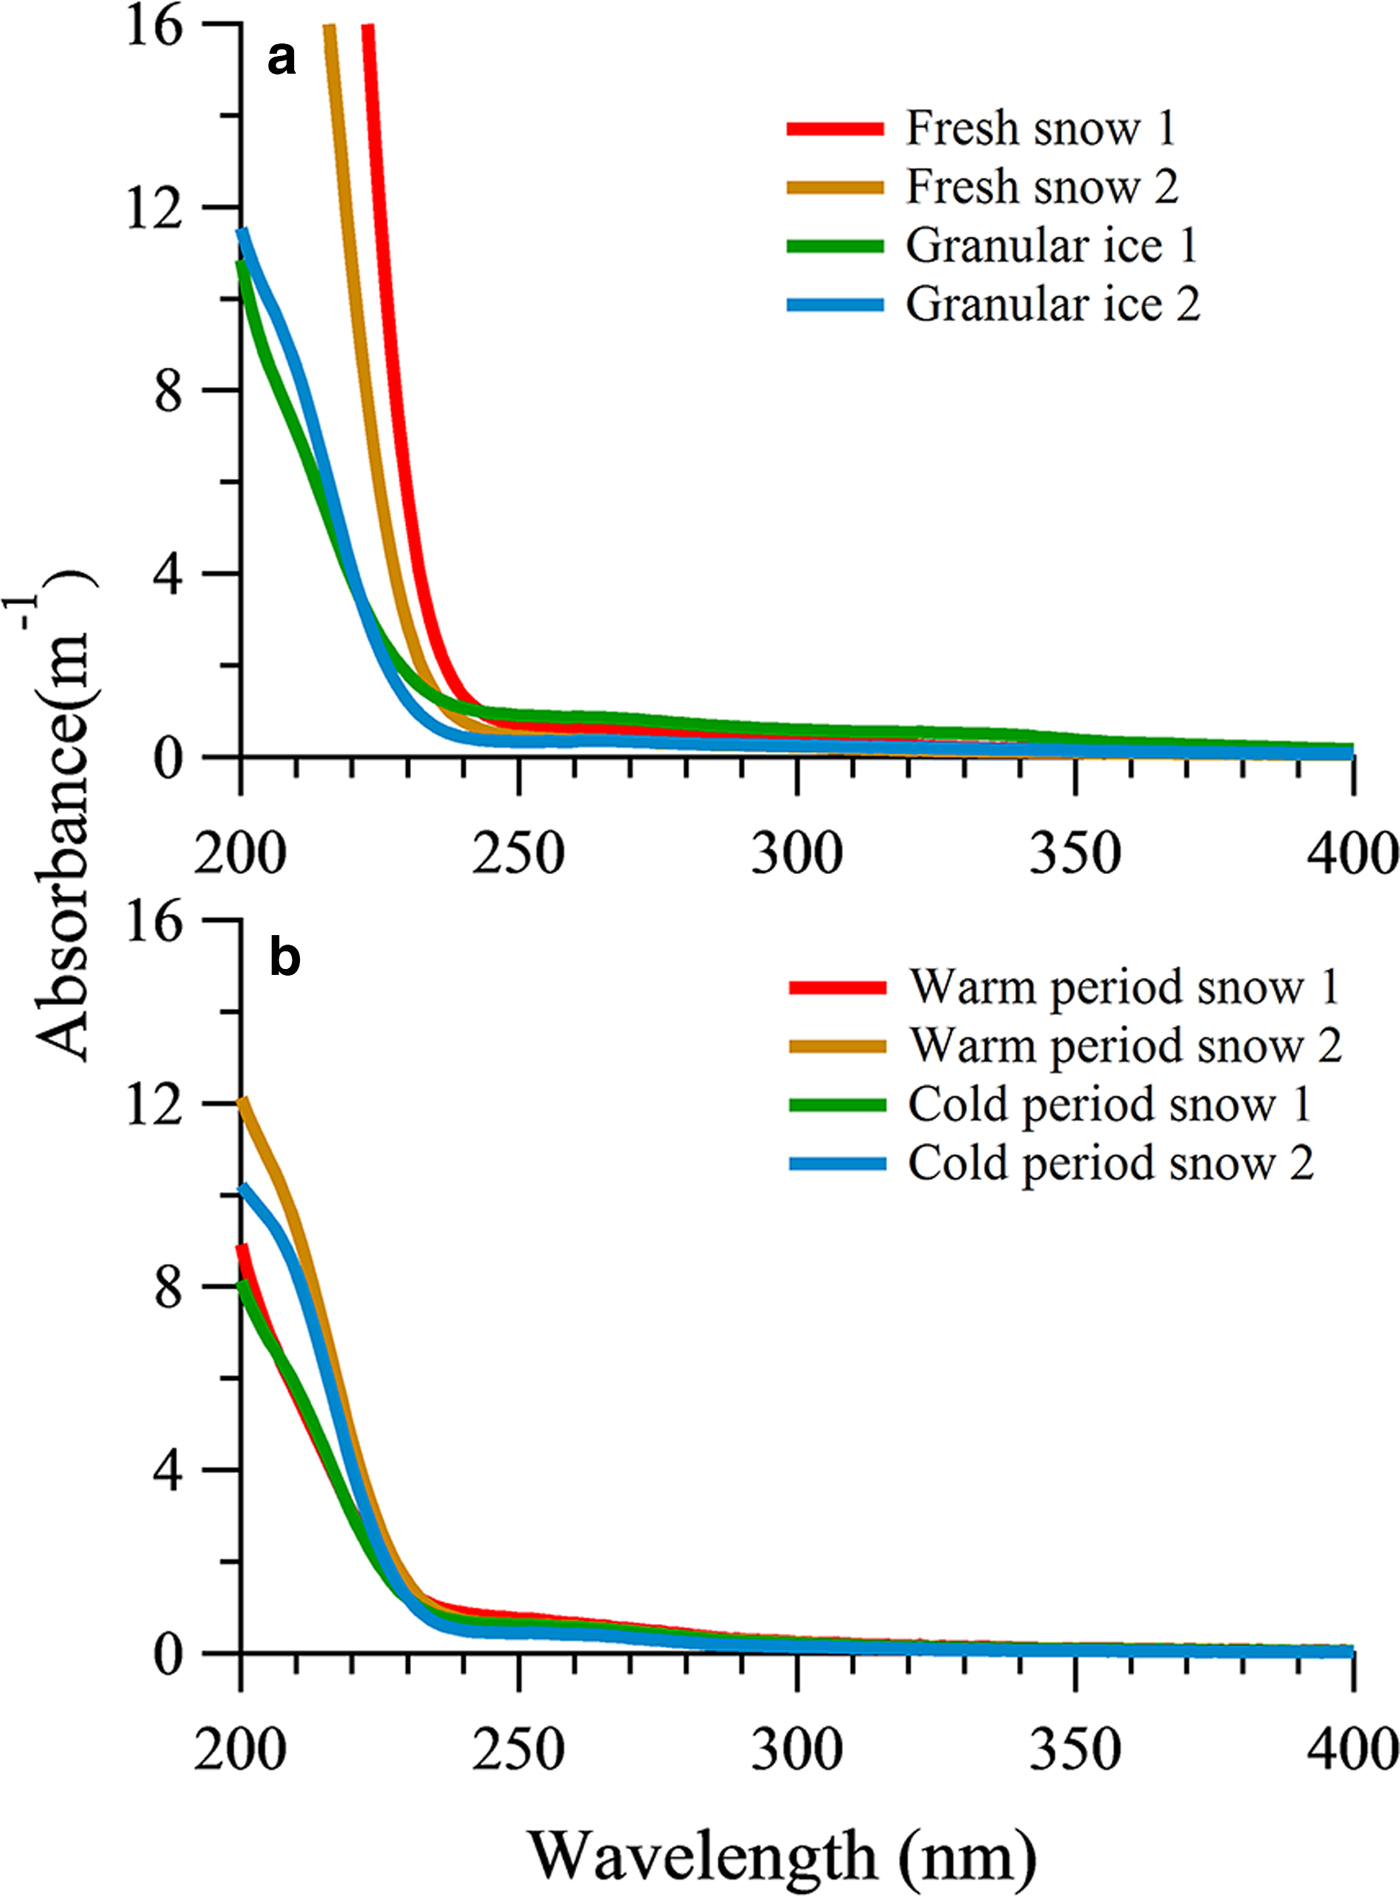
The average absorption coefficient of fresh snow samples and granular ice samples had higher values for short wavelengths and decreased sharply above 240 nm (Fig. 4a). The fresh snow showed stronger absorption characteristics within the range of 200–240 nm than that of the granular ice, suggesting that there were more chromophores in fresh snow samples. These chromophores could be double-bond olefin compounds (Zhao, Reference Zhao2012) and/or the amide group of the polypeptide backbone (Mundi, Reference Mundi2012). The absorption was lower in the snow pit samples than in the fresh snow and granular ice, consistent with their different DOC concentrations. The sum of absorption between 200 and 400 nm showed a significant correlation with DOC concentration in all snow category samples (R 2 = 0.69, P < 0.05). But the average absorption from snow samples deposited in the snow pit during the cold period and those deposited during the warm period did not differ markedly (Fig. 4b). In addition, absorption was weak for snow pit and granular ice samples within the range of 250–320 nm compared with fresh snow, indicating different chromophores.
UV-Vis absorbance spectra of DOM in fresh snow, granular ice samples (a) and snow pit samples (b).
Fluorescent components identified by EEM-PARAFAC and fluorescence indices of DOM
The fluorescence results from a total of 35 samples (comprising 23 snow pit samples, six fresh snow and six granular ice samples) were used to perform PARAFAC analysis, and four fluorescent components were identified with unique spectra in each component (Fig. 5). Table 2 summarizes the excitation and emission characteristics of each fluorescent component in our study and the characteristics of components defined by other studies. Two of the four components we identified can be described as humic-like, or derived from humic substances (components 1 and 4), whereas components 2 and 3 are protein-like. Component 1 (C1) had two excitation maxima at 240 and 305 nm and an emission maximum at 392 nm. The spectral features of C1 were similar to the humic-like components, which were likely associated with biological activity (Coble, Reference Coble1996; Fellman and others, Reference Fellman, Hood and Spencer2010). Murphy and others (Reference Murphy2011) described a similar peak to microbial humic-like fluorescence in water samples from recycled-water treatment plants. Two excitation maxima at 270 and 345 nm and an emission maximum at 452 nm were observed for component 4 (C4), which represents older substances derived from terrestrial plant or soil organic matter (Coble and others, Reference Coble, Del Castillo and Avril1998; Fellman and others, Reference Fellman, Hood and Spencer2010).
EEMs for the four-component PARAFAC model.
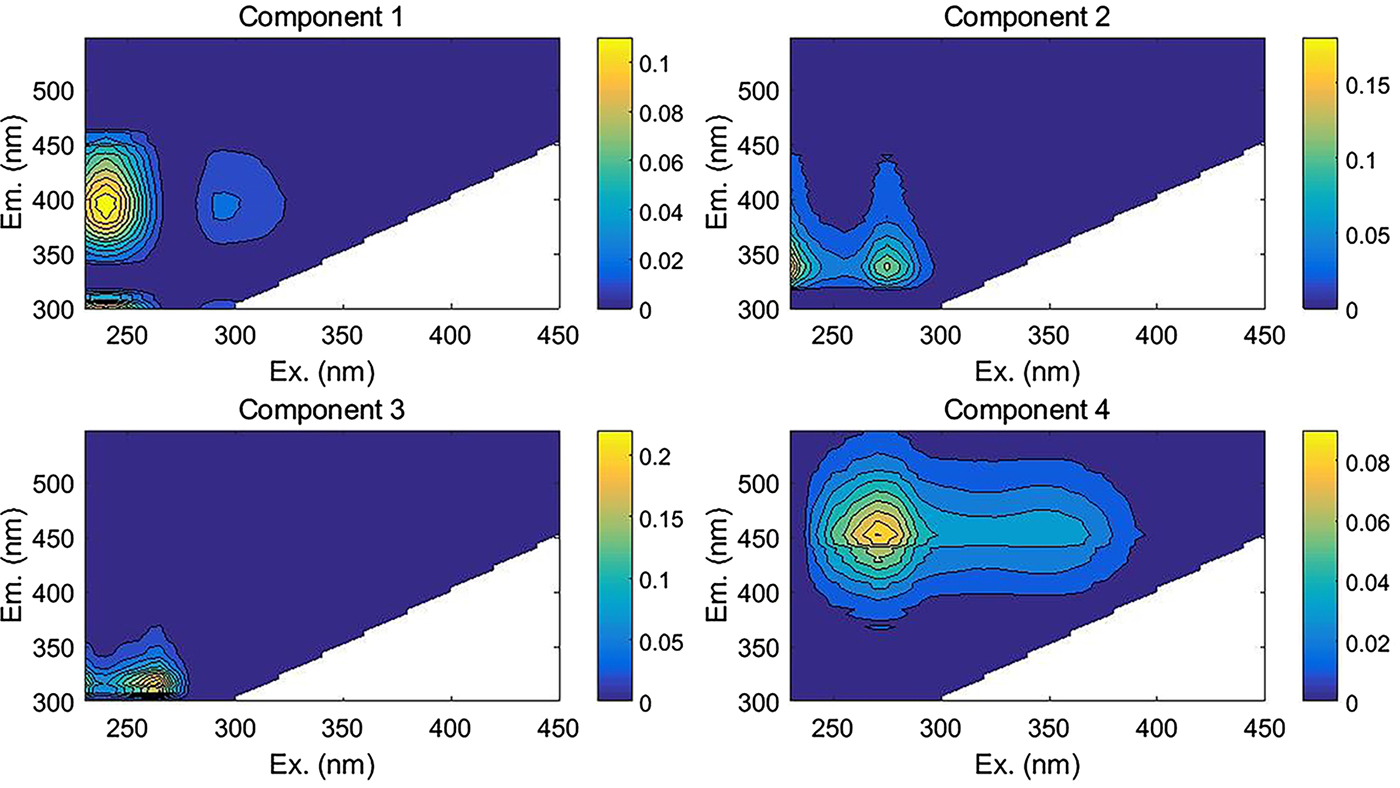
The four components identified by the PARAFAC model, with maximum excitation/emission wavelengths and description (Coble, Reference Coble1996; Coble and others, Reference Coble, Del Castillo and Avril1998; And and Mcknight, Reference And and Mcknight2005; Fellman and others, Reference Fellman, Hood and Spencer2010)
Component 2 (C2) showed two excitation maxima at <240 and 275 nm and an emission maximum at 340 nm, which closely resembles those of tryptophan-like fluorophores. Fellman and others (Reference Fellman, Hood and Spencer2010) found this spectrum could come from free amino acids or amino acids bound in protein molecular structure, which are intact proteins or less degraded peptide material. Typically, tryptophan is associated with autochthonous productions of DOM through biological degradation (Dubnick and others, Reference Dubnick2010). Component 3 (C3) was found in the EEM region corresponding to protein-like fluorophores with excitation maximum at 265 nm and emission maximum at 316 nm. The spectral pattern of C3 resembles the tyrosine-like fluorophore and may indicate more degraded peptide material from autochthonous production of DOM (Fellman and others, Reference Fellman, Hood and Spencer2010).
The two protein-like components (C2 and C3) accounted for more than 60% (range from 60.87 to 67.93% in all samples) of the modeled fluorescence, which suggests a significant microbial source of DOM in these samples (Table 3). This is consistent with many previous results showing that DOM in a glacier environment comes predominantly from microbial sources and has a high ratio of protein-like to humic-like components (Lafrenière and Sharp, Reference Lafrenière and Sharp2004; Barker and others, Reference Barker, Sharp and Turner2009, Reference Barker, Dubnick, Lyons and Chin2013; Feng and others, Reference Feng2016). The relative contribution of protein-like components (C2 and C3) in snow pit samples (64.41–67.93%) was higher than that of fresh snow and granular ice (60.87–65.86%), whereas the proportion of humic-like components (C1 and C4) was lower in the snow pit (32.06–35.59%) than in fresh snow and granular ice (34.49–39.13%). In addition, the snow samples during the cold period contained higher protein-like components (C2 and C3) (67.74–69.93%) and lower humic-like components (C1 and C4) (32.06–32.26%) compared with the snow samples during the warm period (64.41–67.58% for C2 and C3 and 32.42–35.59% for C1 and C4). Note that the relative contribution of protein-like components and humic-like components showed no significant difference between different samples likely due to the small number of samples.
HIX and BIX for DOM extracted from the samples in this study, and the average relative contributions of the four components identified by the PARAFAC model

The indexes BIX and HIX were proposed to assess the relative contribution of autochthonous DOM and humification of DOM in the natural aquatic environment (Huguet and others, Reference Huguet2009; Birdwell and Engel, Reference Birdwell and Engel2010). The DOM in fresh snow, granular ice, and snow pit samples have low values of BIX (<1.0) and HIX (<1.2), which indicate a fresh DOM source derived predominantly from microbes (Birdwell and Engel, Reference Birdwell and Engel2010).
BIX values were lower, whereas HIX values were higher, in fresh snow than in granular ice. These results suggest that DOM in granular ice contained a higher fraction from autochthonous than fresh snow, and that fresh snow contained more humic material which was likely from the ambient aerosol (Voisin and others, Reference Voisin2012). BIX and HIX values in snow pit samples showed a similar situation to granular ice, with higher BIX values (0.81–0.90) and lower HIX values (0.54–0.61) (Table 3). Specifically, the snow samples during the cold period showed higher BIX values and lower HIX values compared with the warm period, which suggest relatively higher contribution of autochthonous DOM in the samples during the cold period and higher humification DOM in the samples during the warm period.
Molecular composition of DOM from ultra-high-resolution FT-ICR MS
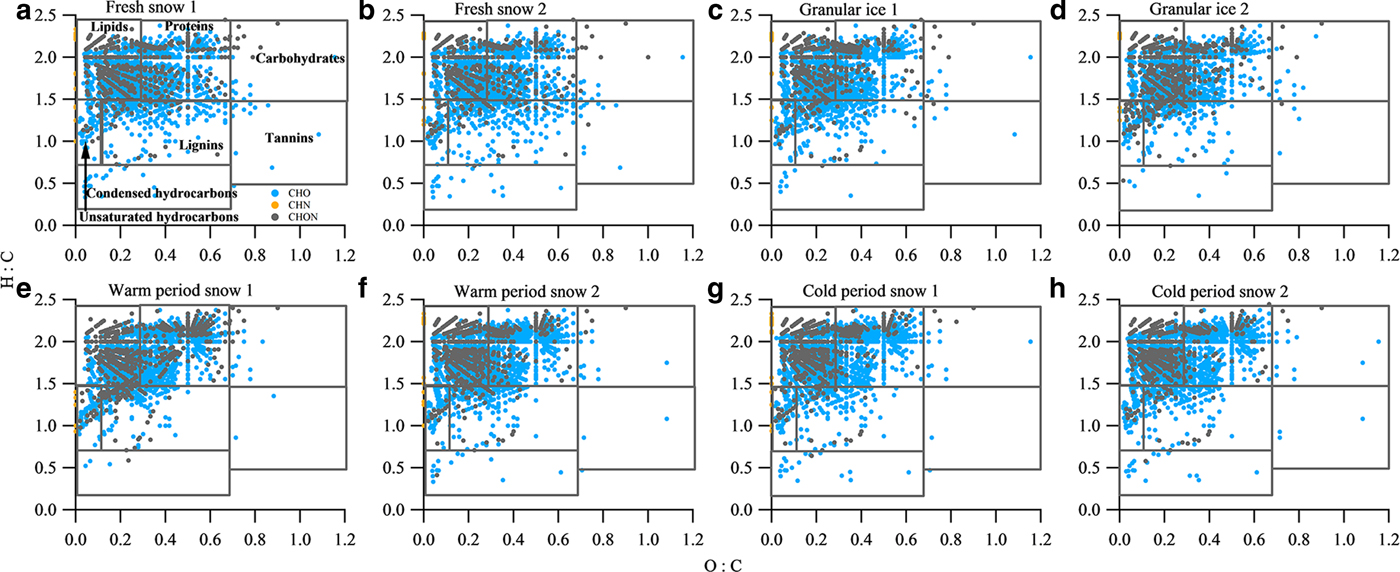
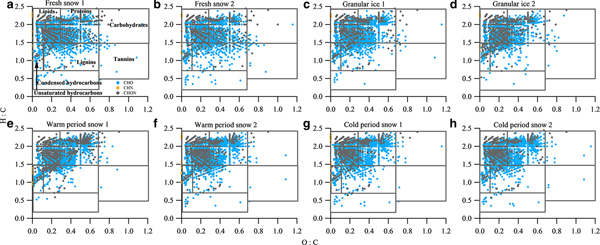
The van Krevelen diagram shows that all samples were dominated by lipid- and aliphatic/protein-type components (Fig. 6), which account for more than 70% of the assigned peaks (Table 4). This phenomenon is similar to those found in surface snow samples from the East Antarctic ice sheet and the cryoconites in LHG (Antony and others, Reference Antony2014; Feng and others, Reference Feng2016). Previous studies have suggested that the predominant lipid- and aliphatic/protein-like components were produced by a diverse assemblage of bacteria, archaea and eukarya which could degrade and produce DOM in the Antarctic snowpack (Antony and others, Reference Antony2016, Reference Antony2017). In addition to the predominantly autochthonous microbial material, terrestrial components were also found in each type of sample, as shown by the presence of tannin and lignin/CRAM molecules (12.4–20.6%) in the van Krevelen diagrams (Fig. 6). These components could be supplied by long-range atmospheric transport of terrestrial organic matter (Li and others, Reference Li2016) and local surrounding debris. It is interesting to note that the fresh snow samples have a similar composition to other samples, i.e. more microbially derived DOM, suggesting that the aerosols in this remote area of the TP mostly originated from natural sources. Primary biological aerosol particles (PBAPs) including bacteria, spores and pollen, could be more abundant during summer due to more favorable air temperature and humidity conditions (Toprak and Schnaiter, Reference Toprak and Schnaiter2013), which could be the source of the microbially derived components (including lipids and aliphatic/proteins) in fresh snow.
van Krevelen diagrams for the mass spectra of samples of (a) fresh snow 1, (b) fresh snow 2, (c) granular ice 1, (d) granular ice 2, (e) warm period snow 1, (f) warm period snow 2, (g) cold period snow 1 and (h) cold period snow 2. The black lines in the van Krevelen diagram correspond to major classes of compounds that can be expected in DOM.
The number of molecular formulas identified, and % of molecular formulas assigned to each defined compound class as revealed by FT-ICR MS for DOM samples isolated from the fresh snow, granular ice and snow pit samples in LHG

The van Krevelen plots were also classified by the molecular class, i.e. CHO, CHN and CHON (Fig. 6). The contributions of these classes for each category sample are shown in Table 5. CHO-only molecules dominated the compounds (69.7–78.3%), followed by CHON compounds (21–29.7%) and CHN-only molecules (0.3–0.9%). We performed an intercomparison of DOM components in different category samples and found slight differences in some assigned compounds. DOM in fresh snow and granular ice contained fewer lipid- and protein-type components and more lignin- and tannin-type components than the snow pit (Table 4). N-containing molecules (CHN and CHON) were also fewer in fresh snow and granular ice than in the snow pit (Table 5), implying that DOM in fresh snow and granular ice was more affected by terrestrial sources, while DOM in the snow pit was mainly affected by microbial activity in situ. The higher DBE values in fresh snow and granular ice samples than in snow pit samples (Table 5) also suggest that allochthonous sources such as terrestrial materials (Lawson and others, Reference Lawson, Bhatia, Wadham and Kujawinski2014) may be the major contributor of DOM in fresh snow and granular ice.
The average molecular weight, the average of DBE, and the number and % containing of CHO, CHON, CHN classes as revealed by FT-ICR MS for DOM samples isolated from the fresh snow, granular ice and snow pit samples in LHG

Snow samples during the warm period had more terrestrially derived DOM (lignin- and tannin-type components) but less microbially derived originated DOM (lipid- and aliphatic/protein-type components) than the cold period (Table 4), which was consistent with results from the EEMs. This may result from more precipitation events occurring during the warm season in this region, so that more terrestrial-originated DOM could be transported and deposited with snowfall. The proportion of lipid- and aliphatic/protein-type components was lower in fresh snow than in granular ice, while that of lignin- and tannin-type components was higher than in granular ice (Table 4). The proportion of lipid- and aliphatic/protein-type components did not vary significantly between fresh snow and granular ice likely due to the small number of samples, yet they still showed obvious changes during the melting–freezing process (from fresh snow to granular ice). This trend was consistent with the variation of HIX, which showed a significant correlation between them (Table 3) (R 2 = 0.55, P < 0.05). N-containing molecules (CHN and CHON) in fresh snow were fewer than in granular ice (Table 5). These results again suggest that fresh snow contained more terrestrial sources of DOM, and granular ice contained more DOM of microbial origin.
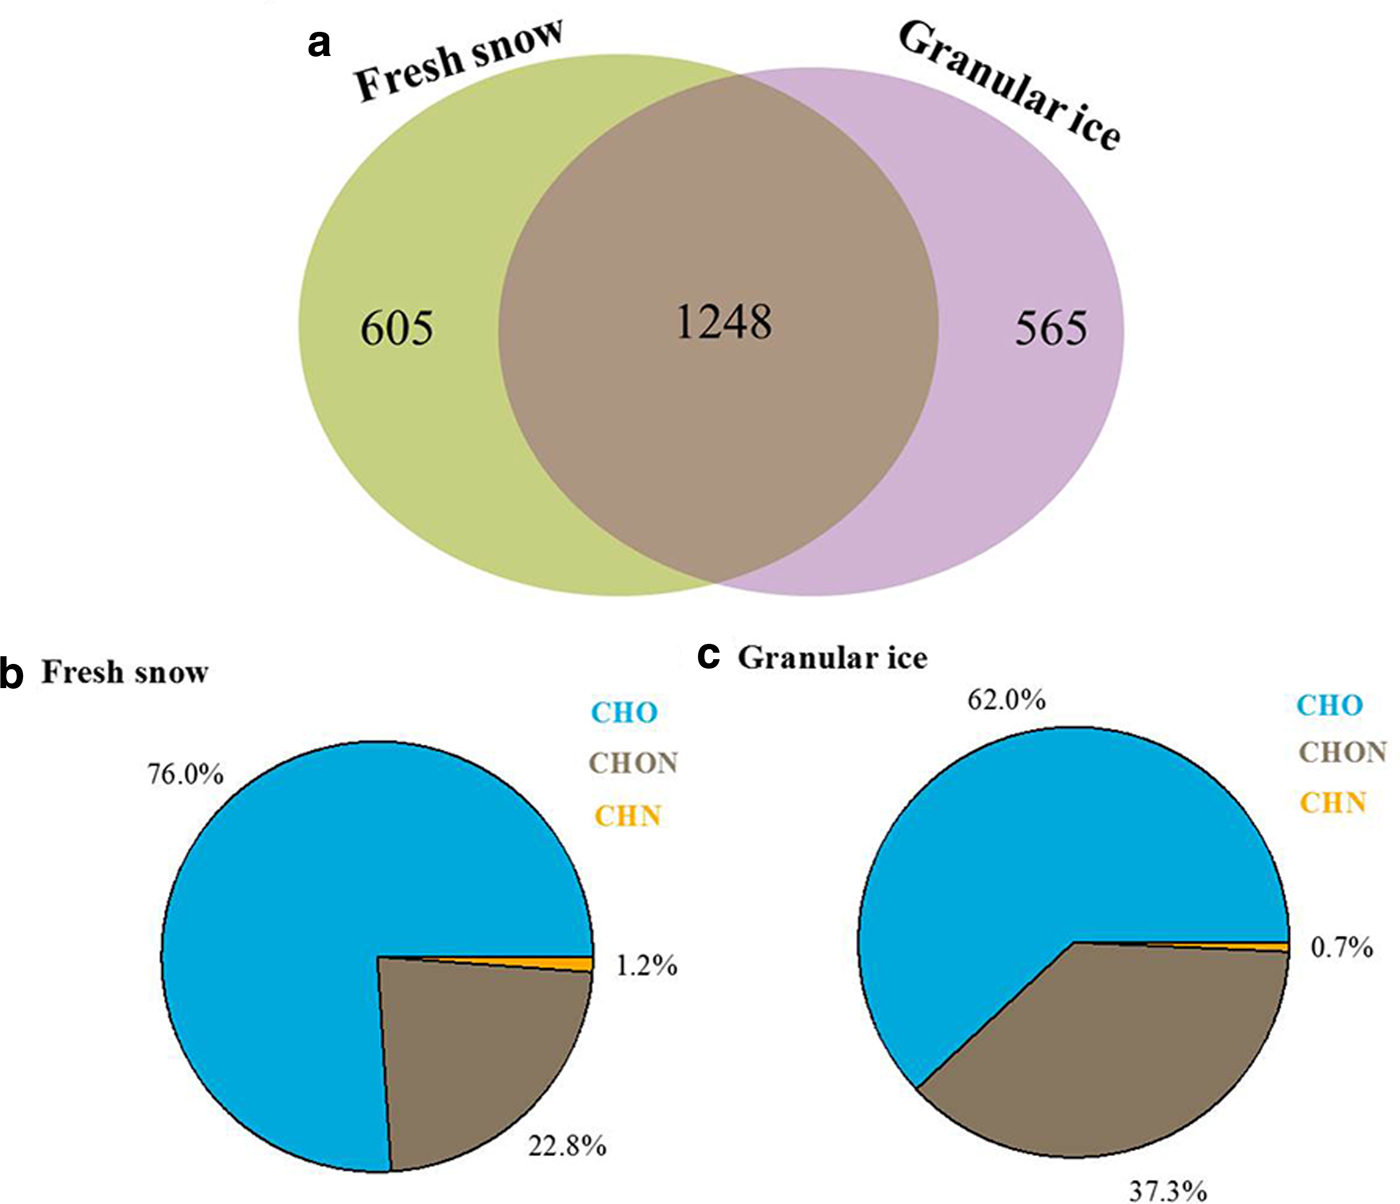
We also analyzed the effects of snowmelting on DOM compositions by directly comparing the unique and overlapping assigned molecular compounds in the fresh snow and granular ice samples using a simple Venn diagram (Fig. 7). About 40% (1248) of the identified molecular components overlapped, indicating that DOM in fresh snow and DOM in granular ice have a high degree of similarity. However, the unique molecular components in granular ice (565, accounting for 23.4% of total assigned molecules) contain more CHON molecules (37.3%) and suggest a higher bioavailability than those in fresh snow (22.8%), suggesting microbial modification of DOM during the snowmelting process.
(a) Two-way Venn diagram for molecular formulas between fresh snow and granular ice. The numbers in the diagram are the percentage of the common and unique formulas to each type of sample. (b) and (c) Mean contributions of different molecules identified from the FT-ICR mass spectra for the unique components in fresh snow and granular ice.
CONCLUSIONS
Our study has presented the DOC concentration, UV-Vis properties, fluorescent components and molecular information of the DOM in different samples and seasons in LHG. In summary, the DOC concentration showed higher values in fresh snow and snow samples during the warm period compared respectively with granular ice and snow samples during the cold period. The UV-Vis properties of all types of samples followed the same pattern as DOC concentration. EEMs combined with PARAFAC identified four fluorescent components of DOM in all samples, two protein-like components (C2 and C3), one microbial humic-like component (C1) and one humic-like component (C4), indicating an obvious microbial origin of DOM in this glacier. Based on the ESI-FT-ICR-MS results, DOM in fresh snow and granular ice contained less microbially derived DOM (lipid- and protein-type components) and more terrestrially derived DOM (lignin- and tannin-type components) than that in the snow pit samples. Here, snow deposited during the warm period had more terrestrial DOM but less microbial DOM when compared with snow deposited during the cold period. This suggests that there was more bioavailable DOM in the older snow that has been stored on the glacier. More interestingly, the unique DOM components in granular ice (aged snow on the glacier) contain more CHON molecules than fresh snow, indicating that melt–refreeze and other processes could modify the DOM composition and enhance the bioavailability of DOM over time.
Acknowledgements
This research was supported by grants from the National Natural Science Foundation of China (41771079 and 41421061), the Key Laboratory of Cryospheric Sciences Scientific Research Foundation (SKLCS-ZZ-2017-01) and the Chinese Academy of Sciences Hundred Talents Program. We thank the colleagues for continuing support and discussion.


 Open access