

Introduction
Trade is one of the most important social interactions in human societies. Intuition suggests that we should find evidence of common patterns in trade activities at different periods and in different territories. Trade activities also show, however, a large degree of diversity that needs to be considered. This diversity is particularly relevant when examining past economies distinct from our own (Oka & Kusimba Reference Oka and Kusimba2008). Contrasting dynamics generate many research questions: how did trade networks change over time? What role did communication play? What factors promoted the collapse or emergence of trade routes?
These challenges are even more relevant for long-range trade requiring complex organisation. The Mediterranean is one of the most heavily studied areas to have developed intensive long-range trade. Benign climatic conditions encouraged maritime mobility, and, as a consequence, cultural exchange flourished between regions thousands of kilometres apart (Bevan Reference Bevan2014). This feedback loop between economic and political processes reached its peak during the Roman Empire (first to third centuries AD). Despite the abundance of archaeological data for this activity, some of the dynamics behind this interconnected economy are still subject to debate (e.g. Carreras & Soto Reference Carreras and Soto2013; Brughmans & Poblome Reference Brughmans and Poblome2016; Orengo & Livarda Reference Orengo and Livarda2016).
The archaeological record provides a wealth of evidence, such as the vast quantities of amphorae used to ship liquid products. Assumptions regarding the use of these containers have, however, been recently challenged. Such assumptions include the lack of re-use, or the unambiguous association between amphora types and their contents (Romanus et al. Reference Romanus, Baeten, Poblome, Accardo, Degryse, Jacobs, De Vos and Waelkens2009; Foley et al. Reference Foley, Hansson, Kourkoumelis and Theodoulou2012; Pecci et al. Reference Pecci, Clarke, Thomas, Muslin, van der Graaff, Toniolo, Miriello, Crisci, Buonincontri and Di Pasquale2017). In addition, proposed patterns of increase or decrease in trade activities based on the frequency distribution of amphorae could also be explained by the use of containers that rarely survive in the archaeological record, such as barrels and skins (Wilson Reference Wilson, Bowman and Wilson2009).
All of these uncertainties affect the field of Roman economy studies (Bowman & Wilson Reference Bowman and Wilson2009). Rome was one of the largest economies of the past, but was the Roman world really interconnected? What role did the state play? Did political unification promote economic growth? The lack of clear archaeological proxies for the structure of Roman markets sparked a long and heated debate between the initial modernist, almost-capitalistic perspective, and the opposed primitivists. A number of works have recently recognised the diversity of dynamics within Roman trade (e.g. Finley Reference Finley1999; Scheidel et al. Reference Scheidel, Morris and Saller2007; Scheidel Reference Scheidel2012). These recent works highlight the need to apply quantitative methods to study the spectrum of market structures (Bowman & Wilson Reference Bowman and Wilson2009; Scheidel Reference Scheidel2014). This is not an easy task: working hypotheses often overlap and most of them probably explain only a small part of the entire picture. It is also not clear what type of archaeological proxy is required to evaluate the hypotheses, due to the data uncertainty already mentioned. Ultimately, it seems unrealistic to assume that a traditional statistical framework would be able, from existing evidence, to reject competing hypotheses.
It is important to note that these challenges are not restricted to Roman studies, nor to study of the past. There is a growing debate concerning the need to develop research frameworks able to quantify the plausibility of different hypotheses addressing existing data (Johnson & Omland Reference Johnson and Omland2004; Towner & Luttbeg Reference Towner and Luttbeg2007; Crema et al. Reference Crema, Edinborough, Kerig and Shennan2014; Kandler & Powell Reference Kandler, Powell, Mesoudi and Aoki2015; Buck & Meson Reference Buck and Meson2015; Rubio-Campillo Reference Rubio-Campillo2016).
Bayesian inference is a statistical framework particularly well suited to confront this challenge by model selection. It is founded on the premise that knowledge of a given system with its associated uncertainty can gradually be updated through new evidence. First, competing hypotheses are transformed into a set of statistical models and parameters. The possible values for each parameter receive an initial probability (i.e. a prior), following a specific statistical distribution based on existing knowledge. A likelihood function is used to derive the probabilities of any given result by assessing the value of the input parameters. The updated knowledge (i.e. the posterior distribution) is then computed to infer a) the probability that a given model generated the existing evidence; and b) the relative explanatory power of a set of competing models.
The framework of model selection that we have developed is designed to quantify the extent to which different market structures match the evidence for long-range trade within the Roman Empire. The approach has been applied to a dataset of thousands of codes stamped in amphora handles collected from Monte Testaccio in Rome. This evidence was used to infer the market structure of the massive olive-oil trade system that supplied the capital from the production area of the Guadalquivir River, located in the Hispania Baetica province. Bayesian inference has then been applied to evaluate four previously suggested models by examining their explanatory power in relation to the dataset.
Archaeological proxies of market structures
Monte Testaccio is a 45m-high artificial mound in Rome located near to the east bank of the Tiber. It was created through the deposition of thousands of amphorae following theirshipment to the city via river transport. Most of the excavated materials are identified as Dressel 20 amphorae, similar to those depicted in Figure 1. This amphora type is typically associated with Baetican olive oil, which was widely distributed from southern Spain throughout the western Empire from the first to the third centuries AD (Remesal Rodríguez Reference Remesal Rodríguez1998).
Dressel 20 amphora with a stamp, PNN, in one of its sides (after Aguilera Martín Reference Aguilera Martín, Fuchs, Sylvestre and Heidenreich2012).

A large percentage of Dressel 20 amphorae displayed a stamp identifying an economic agent linked to the container (see Figure 2 for an example of the most frequently found code from Monte Testaccio). It has been suggested that the stamped code identifies the owner of the land where the olives were harvested and the oil was produced (Garlan Reference Garlan, Garnsey, Hopkins and Whittaker1983; Remesal Rodríguez Reference Remesal Rodríguez2013). Other authors suggest that the stamp refers to the workshop that made the amphorae (Funari Reference Funari1996; Berni Millet Reference Berni Millet2008). Whichever is the case, the actors identified in the stamps were part of a common economic activity linked to long-range trade.
Photograph and digitised version of a stamp where PNN can be read. It is the most common code found in the dataset, and its three letters probably identify the initials of a full Roman name or tria nomina.

The number of stamps displaying the same code was chosen as the archaeological proxy of the actor's weight within the market. This proxy is relative, as it does not define the absolute production of each actor. A code displayed in 100 stamps will, however, naturally identify an individual with higher economic weight than another represented by a code found in 5 stamps. The aggregated frequency distribution of the codes is used as the proxy for the entire market structure (i.e. the number of agents displaying the same frequency value).
Our analysis used a dataset of 7520 stamps collected from 10 different excavations at Monte Testaccio, from 1990–2014 (Blázquez et al. Reference Blázquez, Remesal Rodríguez and Rodríguez Almeida1994; Blázquez & Remesal Rodríguez Reference Blázquez and Remesal Rodríguez1999, Reference Blázquez and Remesal Rodríguez2001, Reference Blázquez and Remesal Rodríguez2003, Reference Blázquez and Remesal Rodríguez2007, Reference Blázquez and Remesal Rodríguez2010, Reference Blázquez and Remesal Rodríguez2014). The chronological span of these remains covers 117 years (from AD 143–260). A quarter of these stamps were incomplete due to fragmentation or erosion, and a probabilistic model was created to integrate this uncertainty into theanalysis by assigning complete codes to incomplete stamps. The method then used Monte Carlo simulation to generate a dataset ready to be analysed (the complete process is described in the online supplementary material (OSM), section 1). Figure 3 shows the frequency distribution of the codes found in the amphora dataset. It can be observed that the shape is dominated by a heavy tail, but further analysis is required to assess the validity of each competing hypothesis.
Empirical frequency distribution of codes in stamps. The plot shows the number of codes (y-axis) appearing in a given number of stamps (x-axis). The red dot depicts the code PNN, which has the largest number of repetitions (253). Both axes are transformed to logarithmic scale.

Model selection framework
Four market structures were evaluated against this archaeological proxy. The competing models were chosen from previously published studies that could be linked to olive-oil trade within the Roman Empire.
H1: balanced model
Demand is fulfilled by the aggregation of small-scale production units (Poblome et al. Reference Poblome, Bes, Willet and Keay2013). This would translate into several agents of similar capacity.
H2: balanced model with large actors
Political connections alter the previous dynamic by creating large-scale producers linked to the state (e.g. Erdkamp Reference Erdkamp2005: 109, for grain trade).
H3: concentration dynamics
Farming activities are often characterised by a minimum threshold, below which production is not sustainable. As a consequence, small agents are absorbed by larger agents and land ownership is gradually concentrated (Allanson Reference Allanson1992).
H4: Pareto principle
A self-organised and interconnected economic system follows the Pareto principle: 80 per cent of the market is controlled by 20 per cent of its agents (Axtell Reference Axtell2001). This structure would generate a small number of large-scale producers complemented by a large number of small-scale producers.
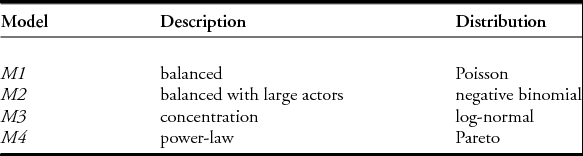
The focus on the code frequency distributions allowed us to translate the hypotheses above into statistical models (as summarised in Table 1). This approach captured the properties of each suggested structure while accepting a certain degree of stochasticity:
-
• M1 transformed H1 into a Poisson distribution where parameter λ defines the average size for the entire set of producers.
-
• M2 used a negative binomial distribution to generate a heavy tail composed of a few large-scale producers, according to H2.
-
• M3 represented the concentration process of H3 as a log-normal distribution. The shape of this model is able to represent: a) a lack of small producers; b) the predominance of mid-sized producers; and c) a heavy tail of large-scale producers.
-
• M4 implemented H4 as a Pareto distribution, displaying a large number of small producers complemented by a small number of large producers.
Each hypothesis has been translated into a statistical model based on expected frequency distributions.
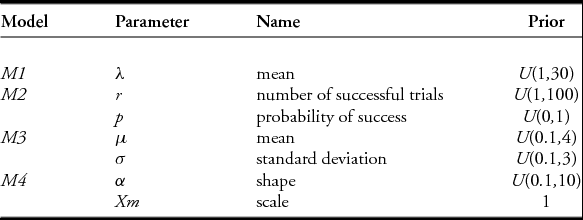
The analytical framework chosen for model selection was based on Bayesian inference. The translation of the hypotheses into statistical models allowed us to compute the posterior distributions easily using Markov chain Monte Carlo (MCMC). Uninformed prior beliefs were chosen for all the models, as summarised in Table 2. The OSM, section 2, lists the parameters used in the MCMC execution. The entire framework was implemented using R, Jags and R2Jags (Plummer Reference Plummer, Hornik, Leisch and Zeileis2003; Su & Yajima Reference Su and Yajima2015; R Core Team 2016).
Parameters for the four examined models.
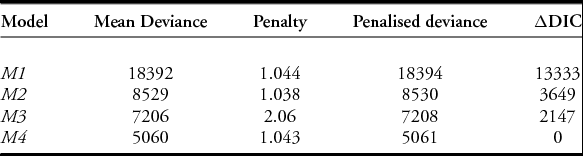
The final step of the method was to quantify the plausibility of the four competing models, taking into account a) the goodness of fit to the evidence; and b) their degree of parsimony. The Deviance Information Criterion (DIC) was chosen for this task, as it is an intuitive information-based measure equivalent to popular indices, such as the Akaike Information Criterion (Spiegelhalter et al. Reference Spiegelhalter, Best, Carlin and van der Linde2002, Reference Spiegelhalter, Best, Carlin and van der Linde2014). Despite some limitations, DIC is a method commonly used in Bayesian inference when the posterior distributions are approximately multivariate-normal. This measure allows the researcher to take into account both the complexity and the deviance from the model's outcome to existing evidence, thereby quantifying parsimony and goodness of fit within a Bayesian framework.
Results
All posterior distributions follow unimodal shapes, thus suggesting that the signal in the dataset is strong enough to overcome noise and generate consistent results (as can be seen in the OSM, section 3). The goodness of fit of the models can first be explored by comparing the evidence against simulated data obtained from each model. Figure 4 shows the results generated by each model using the mean of each posterior distribution as parameter values. The two balanced models (M1 and M2) generate patterns substantially different from the observations. Models M3 and M4 are closer to the frequency distribution of the collected stamps. The fitness of M3 and M4 suggests the presence of some producers of significantly larger size than the average value of the sample. This could have resulted from a concentration process generated by the market. The huge demand for olive oil generated by the city of Rome must surely have put a lot of pressure on the production of this commodity. Consequently, Baetican producers could have generated economies of scale in order to maximise the efficiency of the existing infrastructures.
Comparison between evidence and models. Grey dots display the frequency distributions of codes in stamps, while coloured points show random deviates generated with the mean values obtained from the posterior distributions.

DIC values for the four models are summarised in Table 3. Comparison of these measures suggests that the best fit for this sample is a power-law distribution, in which most olive-oil producers identified by stamps were very small, while concentration processes created a significant quantity of middle-sized agents and a very small number of large-scale producers. Even though it is not usually possible to identify these large actors, they were probably linked to the Roman political system (i.e. members of the Senate or the imperial family).
DIC measurements for each model. The following measures are provided: a) goodness of fit; b) complexity penalty; c) penalised deviance; and d) distance to best candidate (i.e. M4). Better models have lower values, and differences beyond 100 are typically defined as significant.
Discussion
The identification of a power-law distribution requires consideration of the mechanism causing this distinct signal in the evidence (Stumpf & Porter Reference Stumpf and Porter2012). This statistical distribution has received considerable attention since its creation, owing to its unique properties. One of the most distinctive characteristics is that power-laws exhibit scale invariance (i.e. the features of the distribution remain constant over the entire range). If both axes of the power-law are transformed to a logarithmic scale, the sample will follow a straight line (this can be observed in Figure 4).
Power-laws have been identified in disciplines as varied as physics, ecology, sociology and linguistics (Clauset et al. Reference Clauset, Shalizi and Newman2009). Their transdisciplinary relevance is explained by the fact that power-laws are proxies for self-organised optimal systems with some degree of hierarchy (Newman Reference Newman2005). It would be very difficult to generate a power-law by external causes on account of scale invariance, but a power-law emerges when evolutionary dynamics enforce optimality by selection.
Free markets are complex systems fulfilling both self-organisation and optimality, and could therefore be the underlying process generating the shape of our dataset. This prediction has been proved elsewhere in contemporary case studies (Axtell Reference Axtell2001). Although we cannot disregard the possibility that the pattern detected here was generated by a different structure, the simplest interpretation for our results is that the Roman olive-oil trade was organised as a free market. This is the outcome that would be expected by researchers who have documented the existence of private enterprise (e.g. Temin Reference Temin2001, Reference Temin2013). It is difficult to conceive how a state-organised market could generate a power-law. It would require a structure with thousands of small-sized producers complemented by a few large-sized agents. The creation of this organisation, if at all possible, would have required the investment of a large amount of resources and fine control over the system. Finally, the nature of the dataset also supports the existence of a densely interconnected free market, as the amphora stamps that follow the power-law were made 2000km from Rome.
The work presented here has its limitations, as does any other model. Our analysis, for example, cannot confirm whether the stamps identify olive-oil producers or pottery makers. The first option seems more plausible, as it could generate the economies of scale needed to produce a power-law; it is feasible that an olive-oil producer owned an area much larger than the competitors, while a pottery workshop could not be hundreds of times bigger than its competitors due to physical constraints. Neither hypothesis can, however, be discarded, unless new data are discovered. This uncertainty does not invalidate our results, as the analysis indicates long-range trade activity exhibiting free market properties independently of the agents identified by the stamps (olive-oil producers or amphora producers).
Power-law distributions are ubiquitous to datasets deriving from contemporary activities, but they are less commonly observed in archaeological datasets (Bentley & Maschner Reference Bentley and Maschner2003; Bentley & Shennan Reference Bentley and Shennan2003; Grove Reference Grove2011; Haas et al. Reference Haas, Klink, Maggard and Aldenderfer2015). Several studies show how their dataset's shape follows a power-law only in the heavy tail, while the left segment does not match the log-log straight line. These partial fits could, however, also be explained by log-normal distributions, as in our model M3 (for discussion within archaeology, see Bentley Reference Bentley, Bentley and Maschner2003; beyond archaeology, see Allen et al. Reference Allen, Li and Charnov2001; Eeckhout Reference Eeckhout2004; Levy Reference Levy2009). This distinction is important, as the two shapes are generated by critically different social phenomena. Log-normal distributions are essentially produced by additive processes, while power-laws emerge from complex self-organised systems and indicate a higher degree of inequality and interaction amongst their components. Additionally, log-normal distributions display an arithmetic mean value (i.e. there is an average size of producers), while power-laws do not.
The analysis presented here has revealed one of the first examples of an archaeological dataset that follows a complete power-law distribution. There are probably very few contexts that meet the conditions required for the development of a large-scale integrated market. The subset of these scenarios, where the structure of the market can be found in the archaeological record, is even lower, due to a diversity of taphonomic processes (i.e. survivorship bias). We have identified a power-law distribution within an economy quite different from contemporary systems, thus suggesting that the same pattern could be identified in other case studies. Additional research is needed to understand whether this power-law is an isolated scenario specific to the Roman Empire, or a general pattern within the trade networks of past societies.
Acknowledgements
XRC and MCS were funded by the European Research Council Advanced Grant EPNet (340828). We would like to thank the two anonymous reviewers for their comments on previous versions of the manuscript. We would also like to thank Enrico Crema, Albert Díaz-Guilera, Luce Prignano, Ignacio Morer, Jean-Marc Montanier, Simon Carrignon, Joan Rodríguez, Víctor Revilla, Maria Yubero, Jonàs Alcaina, Pau Valdés, Alessandra Pecci and Tom Brughmans for advice on the analysis, access to unpublished data and productive discussions on the methods and results of this work.
The dataset is distributed under the terms of a Creative Commons Attribution-Share Alike 4.0 International Licence. The source code of the model is licensed under a GNU General Public Licence; both can be downloaded from https://github.com/xrubio/bayesRome (accessed 9 June 2017).
Supplementary material
To view supplementary material for this article, please visit https://doi.org/10.15184/aqy.2017.131


 Open access

