

Introduction
Rural settlements serve as complex structural elements in societies across different temporal and geographical scales, offering a rich tapestry of insights with substantial implications for further scholarly pursuits. Despite this potential, specific regions of the Roman province of Noricum have not been adequately explored in this context. Especially for Noricum’s northeastern part, this underrepresentation primarily stems from an overwhelming focus on military installations along the ripa Norica (“Danube limes”). Since 2021, the ripa Norica has been part of the serial transnational UNESCO World Heritage site “Frontiers of the Roman Empire – The Danube Limes (Western Segment).” Consequently, the military sites (including those within the study area presented in this paper) are receiving ongoing evaluation. A “no-man’s land” perception is evident in the cursory analysis of northeastern Noricum’s archaeological data, due to scarce publications on rural settlement. Most studies, principally in German, have favored specific projects and “hotspots” like Favianis/city of Mautern an der Donau (ID15) and Aelium Cetium/city of Sankt Pölten (ID2) while mostly neglecting rural settlement – this has culminated in a situation where “some sites are more equal than others.”Footnote 1
As early as 1994, Kurt Genser underscored the inadequate state of archaeological research on rural settlements in this region. His views were reinforced by Ronald Risy, who observed in 2004 that scholarly understanding of Roman rural settlements in northeastern Noricum remained limited. Notably, 20 years after Risy’s assessment, academic knowledge in the study area has remained relatively static; however, recent research efforts focusing on Roman rural settlements in provinces thematically related to Noricum, such as Raetia and Britain, have yielded significant findings. These findings shed light on various matters, including economic activities, societal structures, infrastructural developments, and cultural exchanges. In comparison, it becomes increasingly evident that there is a relative lack of comprehensive research on northeastern Noricum. This underscores the need for intensified study in this specific geographical and thematic area. Intriguingly, the dearth of research in northeastern Noricum is not due to a lack of available data. Extensive archaeological information, diverse in structure and provenance, has been accessible for a considerable period. However, these valuable resources have been largely neglected, seldom undergoing rigorous analysis or detailed publication. Consequently, the existing body of knowledge concerning rural settlements in northeastern Noricum remains insufficient. This paper seeks to address this gap by embarking on a comprehensive examination of digital settlement and landscape archaeology.Footnote 2
Materials and methods
Located in the geographical heart of the European continent, Noricum, both as an ancient geographical region and as a political entity, covered an area in Roman Antiquity that largely corresponds to modern-day Austria but also included, according to current studies, parts of Slovenia, Italy, and Germany. Noricum’s northern part, henceforth called “Northern Noricum,” occupies a unique position as a peripheral zone within the Roman Empire. Geographically, Northern Noricum is roughly bounded to the north by the river Danube, to the east by the Vienna Woods, to the south by the Alps, and to the west by the river Inn. It was, de facto, equal to Noricum ripense in Late Antiquity. The geographic designation “Northern Noricum” allows for making general reference to this area, regardless of its Roman-era chronology. Although the area is further subdivided into northwestern and northeastern parts, the exact boundary between these subareas is not precisely defined and has only been vaguely delineated in research history. To develop new understandings of rural settlement during the Roman era, the author conducted a digital-archaeological diachronic analysis of the existing archaeological site inventory within a predefined Area of Interest (AOI). Hence, this AOI is a geographic subregion of Northern Noricum, representing the central part of the northeastern section, in contrast to the significantly better-studied northwestern region.Footnote 3
Utilizing a historical framework for the interpretation of the digital data, it seems possible that the AOI originally constituted a peripheral zone or “wasteland” at the far edge of a region known as deserta Boiorum in Roman historiography, which likely covered present-day eastern Austria and western Hungary. Following the traditional interpretation of the Boii tribe’s decline around 40 BCE due to conflicts with the Daci, the AOI may have come under the limited influence of the “regnum Noricum,” if it came under any influence at all. However, this “regnum,” as a political entity, is scarcely known, possibly representing an economically driven tribal coalition led by Noric chieftains based in the present-day Austrian state of Carinthia. Ancient writers might have referred to this political conglomerate as a “regnum,” with its reach potentially extending from the Bavarian Chiemgau (DEU) to the southeastern Alpine edge.Footnote 4
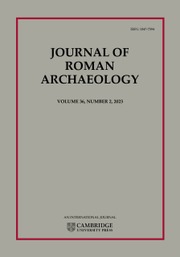
The AOI, today located within the central and southwestern sections of the state of Lower Austria (AUT), was strategically demarcated by the author within its geographical, social, and scientific contexts. Geographically, it is circumscribed to the north by the Danube River, referred to in Antiquity as Danuvius flumen, serving as the Empire’s final frontier, the “Danube limes.” The AOI is flanked on its eastern and western peripheries by the watersheds of the Traisen and Erlauf Rivers, known in Antiquity as Tragisa[mus] flumen and Ar[e]lapa flumen, respectively. To the south, the AOI is delineated by the foothills of the Alpine mountain range. Consequently, the AOI spans a total geographical extent of 1,161 km2. Socially, within this spatial ambit, the AOI encompasses the environs of the ancient municipium Aelium Cetium, as well as the adjacent territories of auxiliary forts (castella), namely Arelape (city of Pöchlarn, ID1), Favianis, and Augustianis (city of Traismauer, ID9). Scientifically, despite its archaeological potential, extensive data, and long research history, general knowledge about the AOI’s rural settlement is paradoxically lacking, making it especially suitable for the study presented here (Figs. 1–2).Footnote 5
The study’s chronological scope primarily targets Roman Antiquity but also includes the preceding Late Latène phase (Lt D, 150–16/15 BCE) and the subsequent Early Middle Ages (post-488 CE). According to the traditional chronology for Roman Noricum, which spans from 16/15 BCE to 488 CE, the temporal framework for Roman Northern Noricum is defined as 50 CE to 488 CE, based on archaeological and written records. This framework is divided into periods based on historical developments:Footnote 6
-
1. Early Period (50 CE to 117 CE)
-
2. Middle Imperial Period (117 CE to 284 CE)
-
3. Late Antique Period (284 CE to 488 CE)
The study’s methodological framework employs a comprehensive digital-archaeological approach with a strong emphasis on geospatial analyses, using a Geographic Information System (GIS) for all essential tasks. Integrating all available archaeological artifacts as primary source material, and examining them at micro-level, meso-level, and macro-level scales, allows for precisely defining concepts for formally identifying archaeological phenomena. This ensures clarity, consistency, and accuracy in interpreting and analyzing data, leading to a more integrated and formalized understanding of the archaeological landscape. The holistic approach contrasts sharply with traditional archaeological investigations, which often focus narrowly on distinct elements of material culture. However, there are limitations, such as the potential for data overload and the challenge of integrating various types of data into a coherent analytical framework. Additionally, reliance on digital and geospatial methods requires robust data quality and is sensitive to errors or gaps in the dataset.Footnote 7
The essential archaeological dataset for this study was obtained from a query of the official Austrian archaeological sites database provided by the Austrian Federal Monuments Office (Bundesdenkmalamt [BDA]), known as the “Fundstellendatenbank” (BDA-FSDB), and then significantly updated and revised by the author. This database documents nearly all publicly disclosed archaeological activities in Austria, encompassing both invasive methods, such as excavations, and non-invasive methods, including geophysical and field-walking surveys. It also includes information from extensive, unsystematic field surveys, chance finds, and similar occurrences. Simultaneously, the dataset provides information from primary research contributions published in the Fundberichte aus Österreich (FÖ), a periodical anthology of mostly field reports that has been in circulation since 1920 and is maintained by the BDA. Consequently, the BDA-FSDB primarily comprises qualitative-descriptive and quantitative-technical information on georeferenced finds and archaeological sites, in addition to context-free objects, ranging from individual artifacts, such as coin finds, to complex structures like a fort’s principia. Originally, the BDA-FSDB query listed a total of 5,010 “BDA-sites” for the AOI; for GIS-based analysis, these “BDA sites” were broken down into newly defined archaeological objects (“features”). Features of various types, identified by their qualitative attributes, were located at distinct “find spots” with definitive coordinates. Due to heterogeneous data, qualitative weighting of individual features was not performed.Footnote 8
The Density-Based Spatial Clustering of Applications with Noise (DBSCAN) algorithm, a Euclidean-distance-based clustering method, grouped individual features into sites using an empirically determined 740 m threshold, equivalent to half a Roman mile. Both features and find spots were clustered, and the center of mass for each cluster was visualized as a point on the map. In this framework, a “site” is defined as a spatially conditioned conglomerate of diverse archaeological features located near each other. It represents a holistic find zone through the center of mass, rather than a definitive area with rigid boundaries. This includes all potential overlapping material culture types at the site. Thus, a “site” may or may not correspond to one or more settlements, such as non-villa/vicus settlements, as the recorded archaeological features collectively determine the site’s nature. This method also serves as geomasking, intentionally distorting find spot coordinates to prevent illegal ground disturbances.Footnote 9
Results
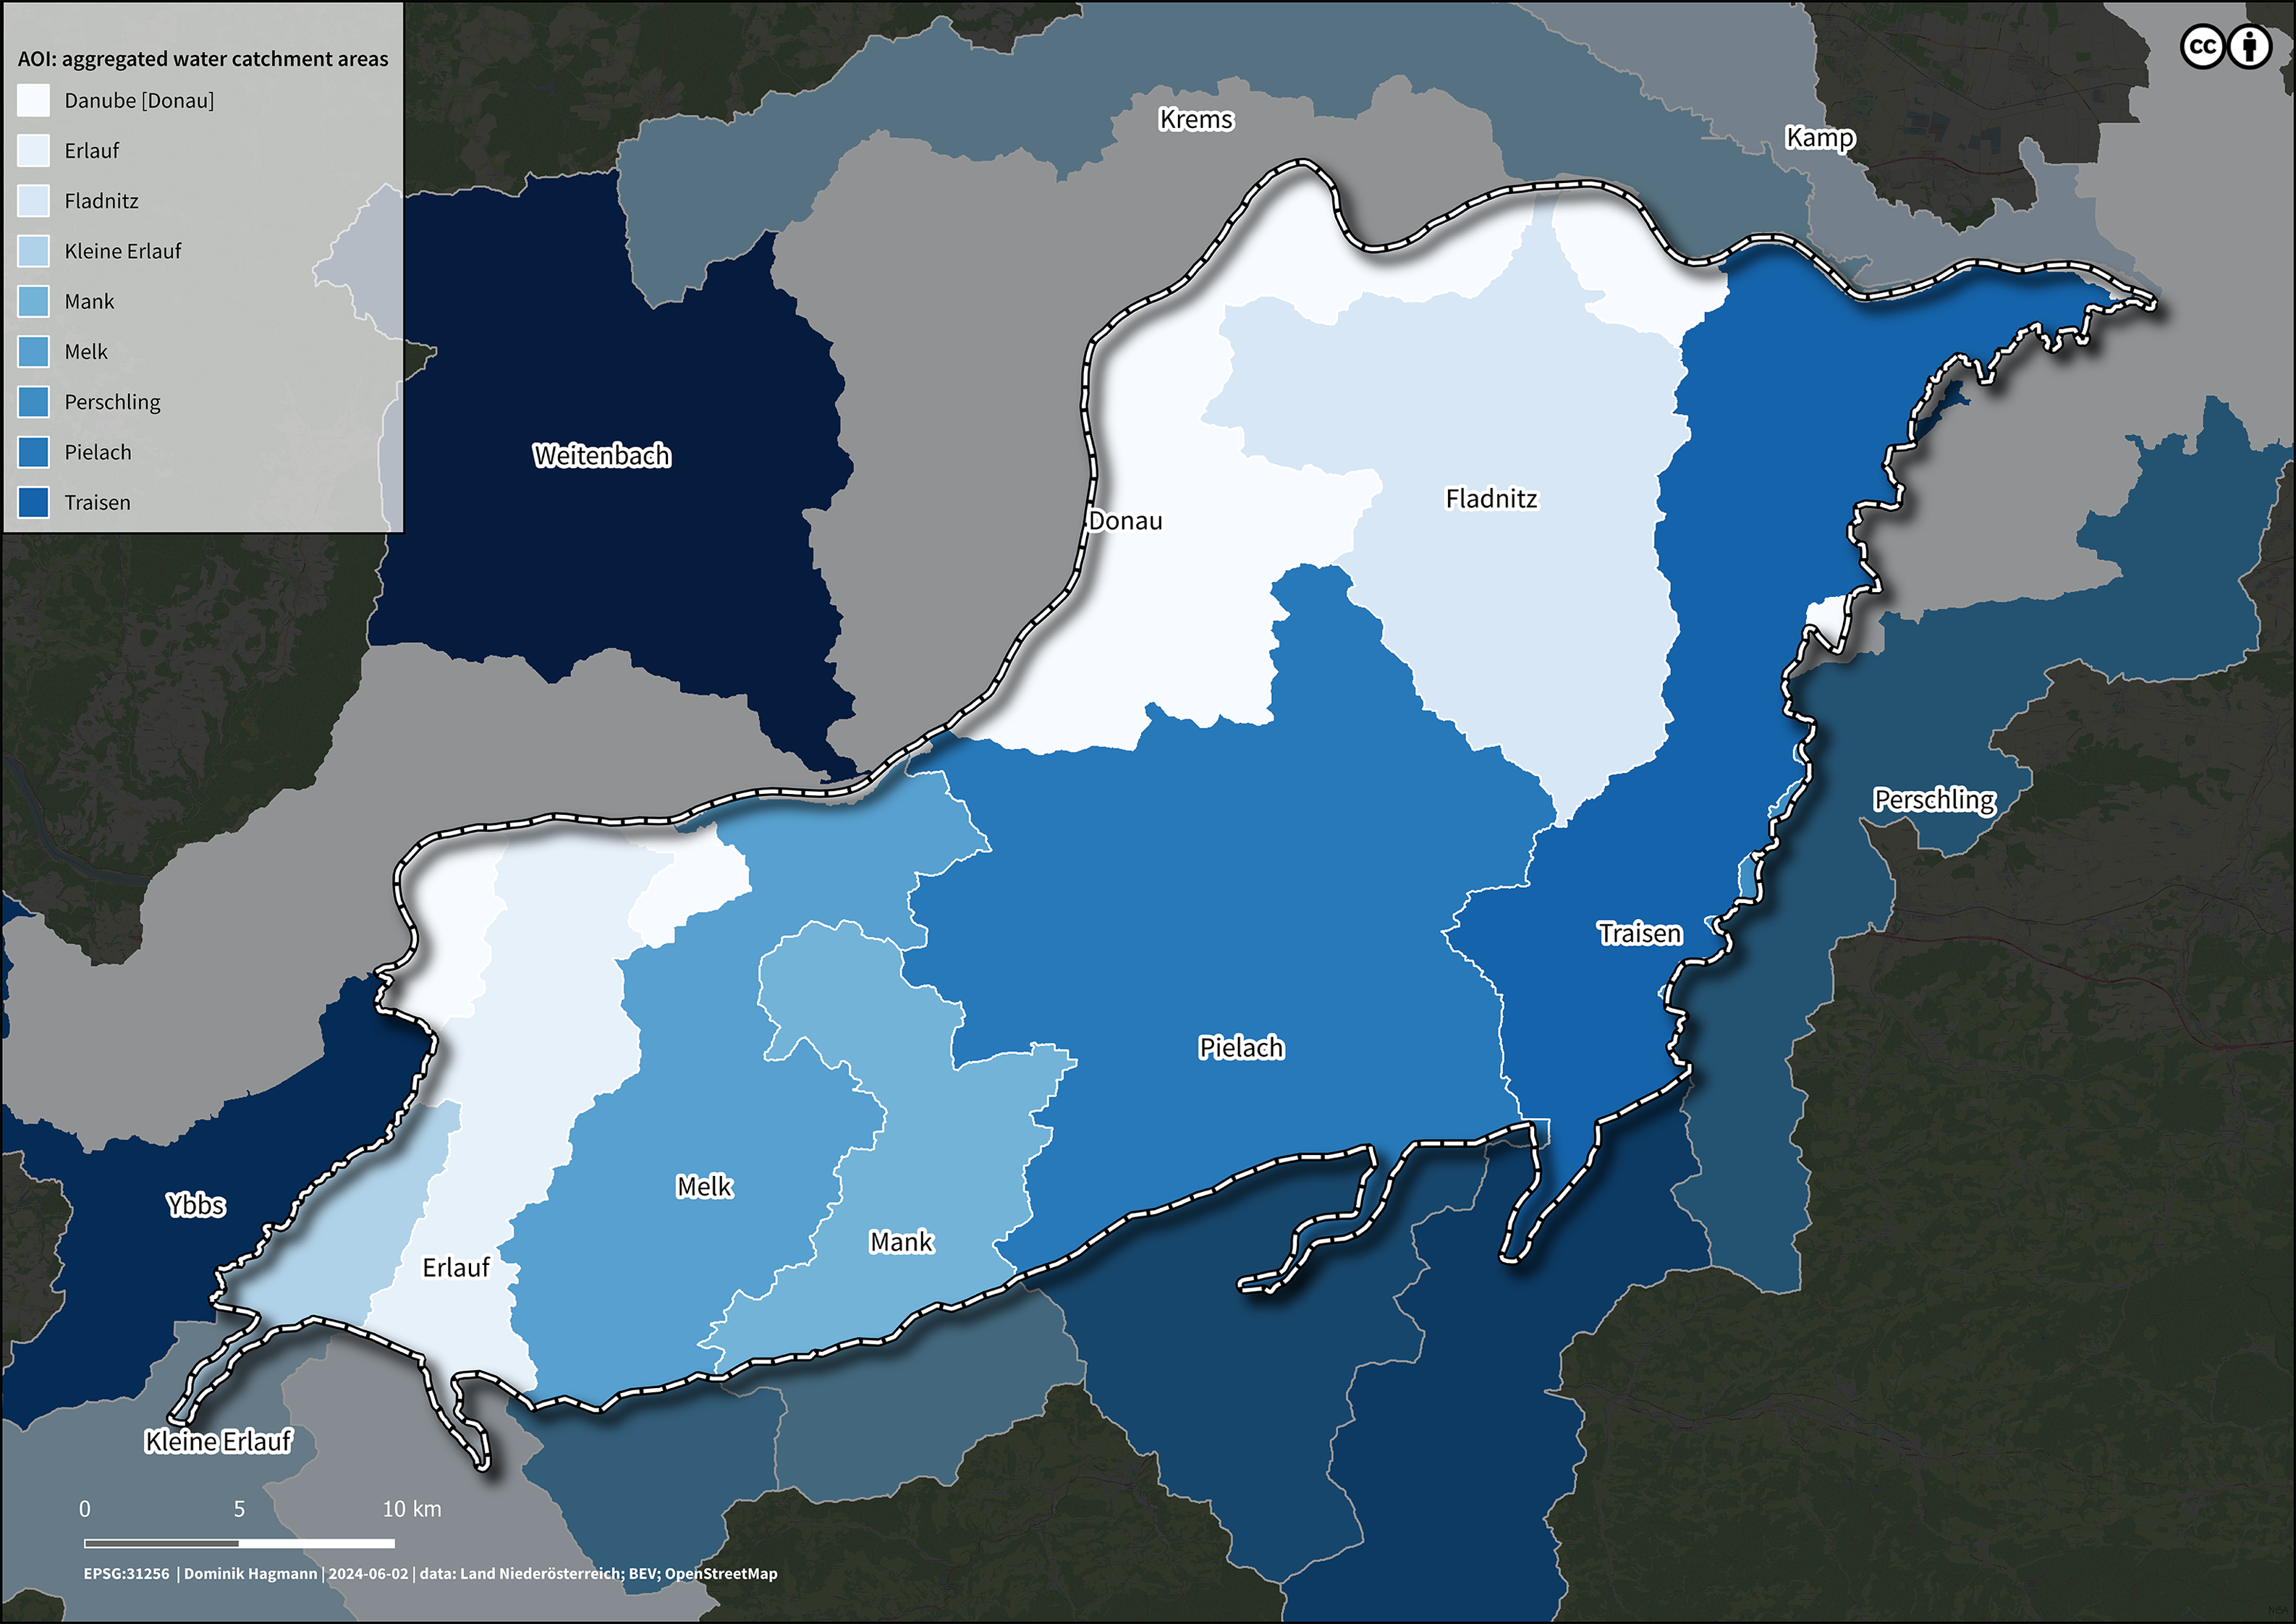
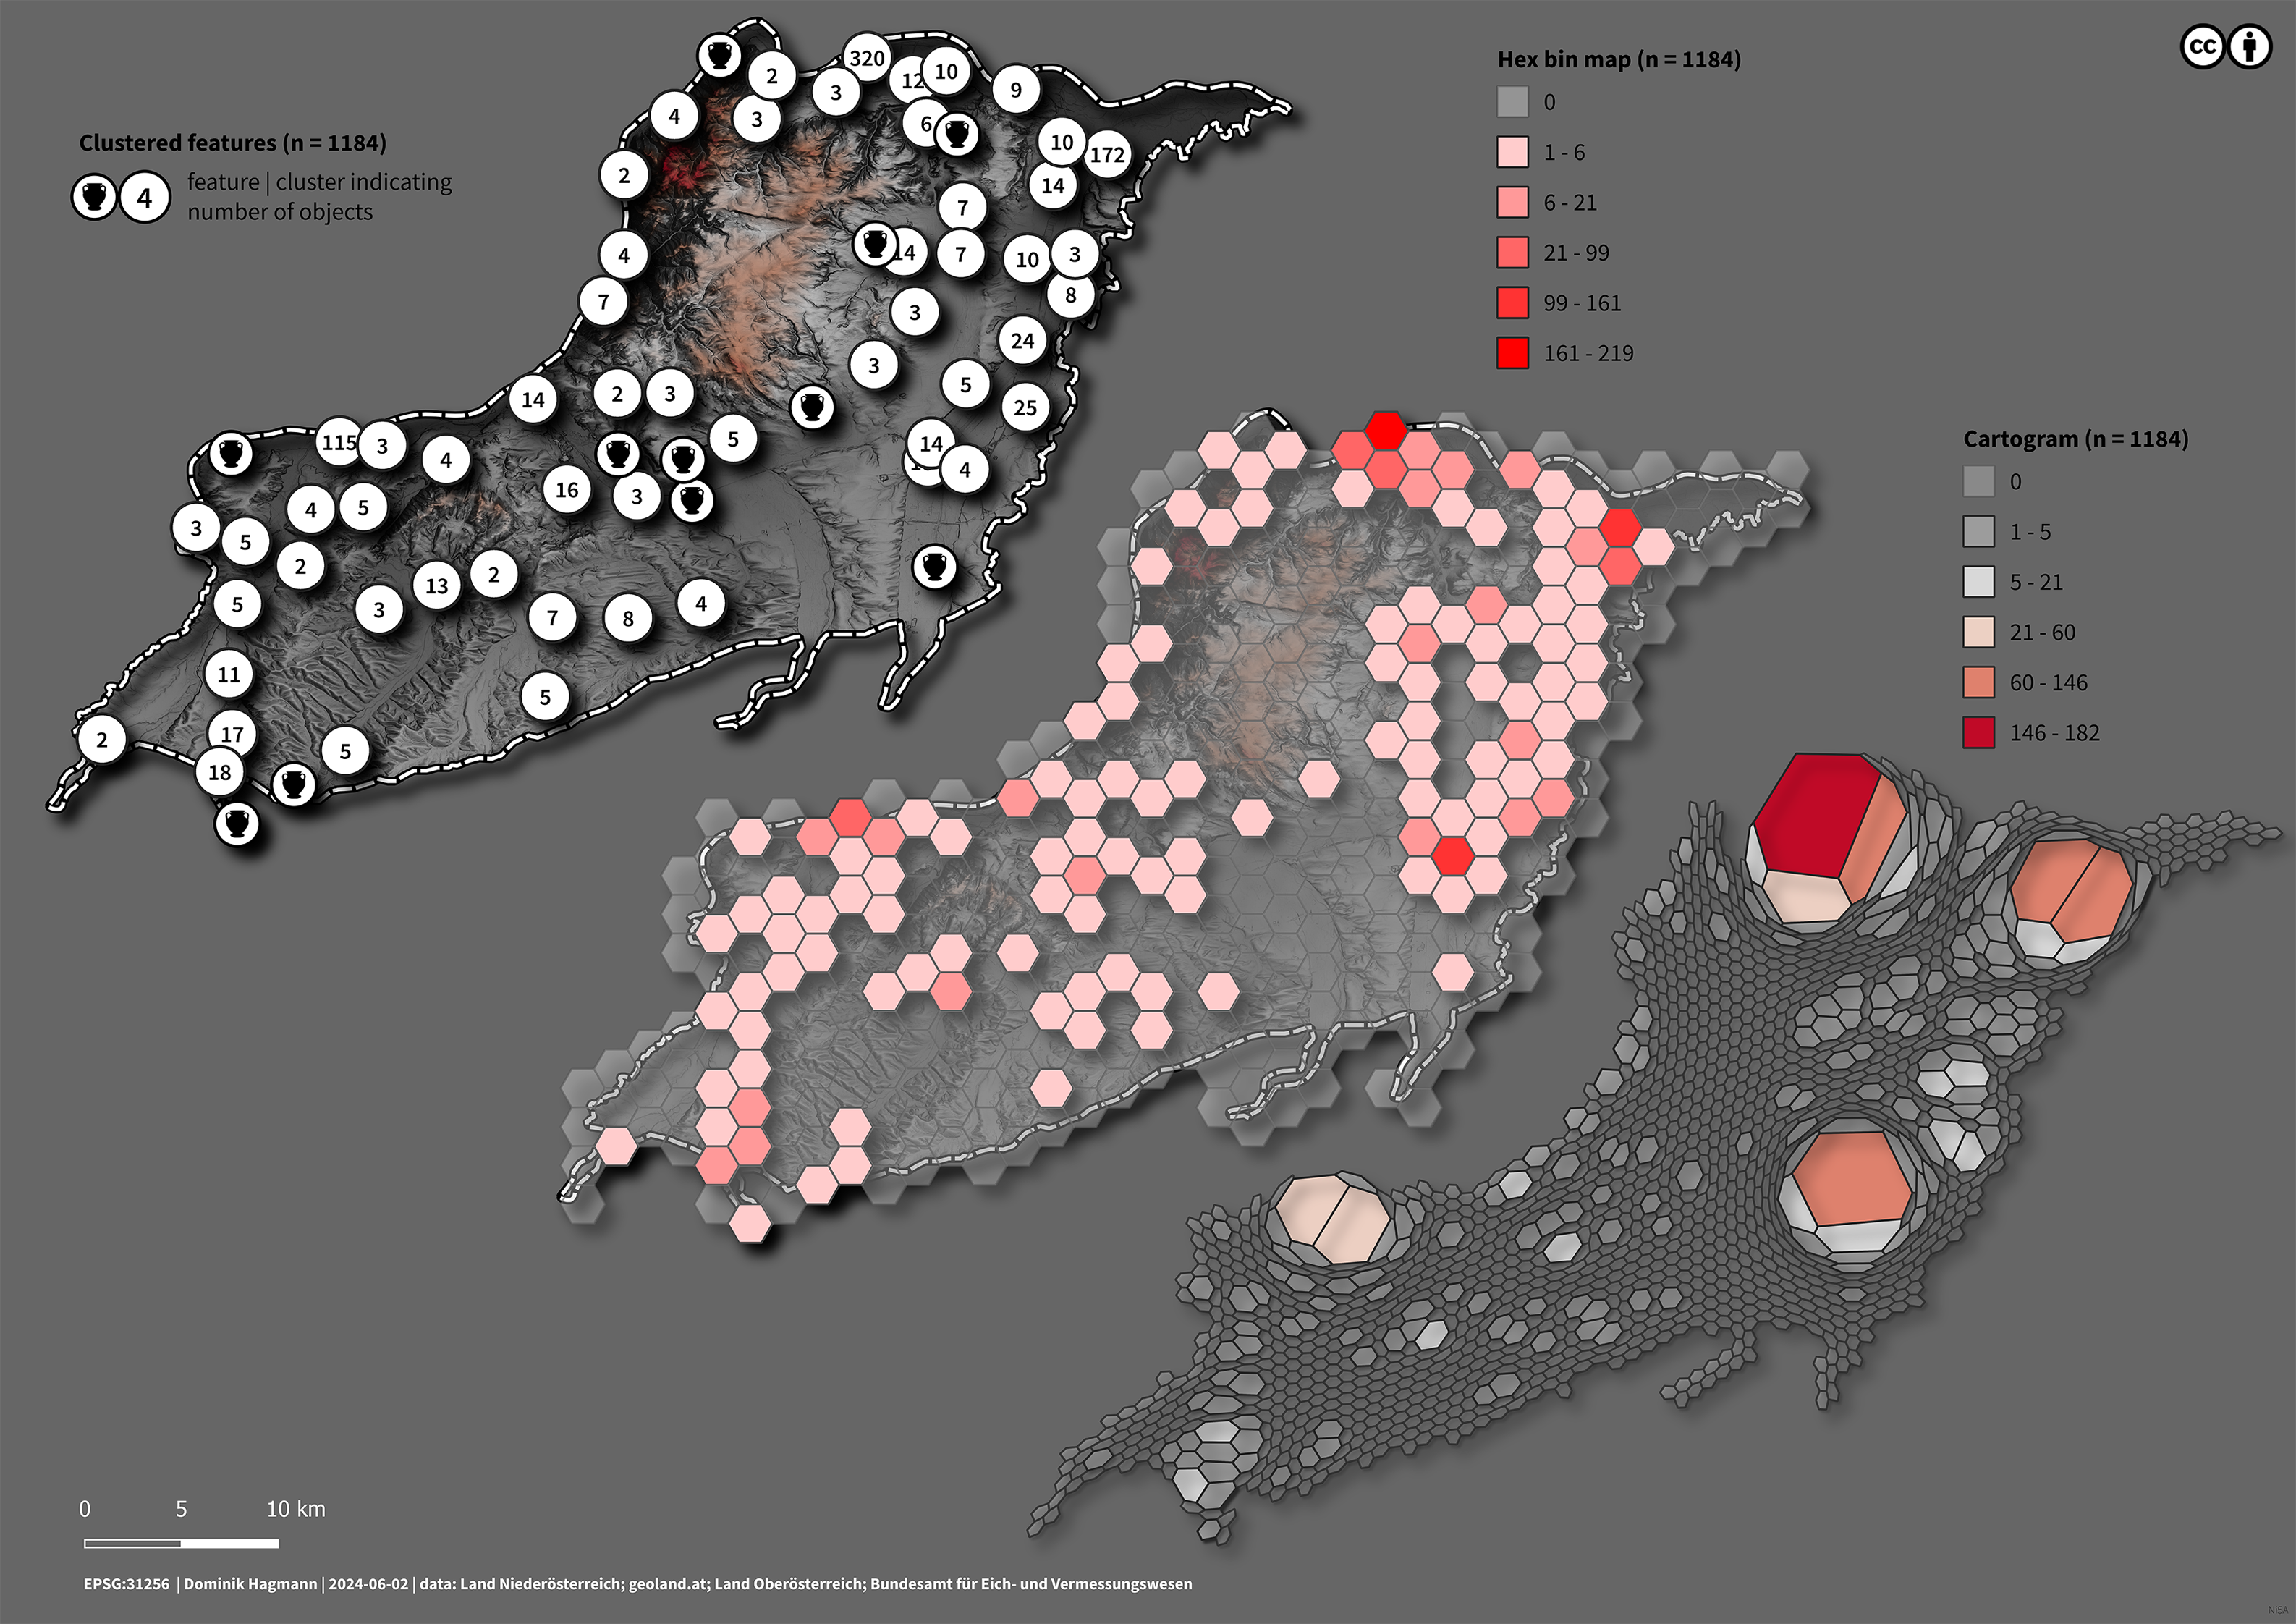
The reworked dataset comprises a total of 7,694 features spanning thousands of years of human activities, also including features without precise geographical coordinates. For GIS-based evaluation, 6,924 geographically located features from the Stone Age to Modern Times were considered. Of these, 5,030 features are located within the AOI, with 28.19% of the features represented by single and other finds (n = 1,418). Specifically, 1,184 of the features pertain to Roman Antiquity, with 29.81% of the features represented by single and other finds (n = 353). The features of Roman Antiquity are distributed across 551 spatially locatable findspots, resulting in a density of 0.48 findspots/km². These findspots are clustered into 129 sites, yielding a density of 0.11 sites/km² (Fig. 3).
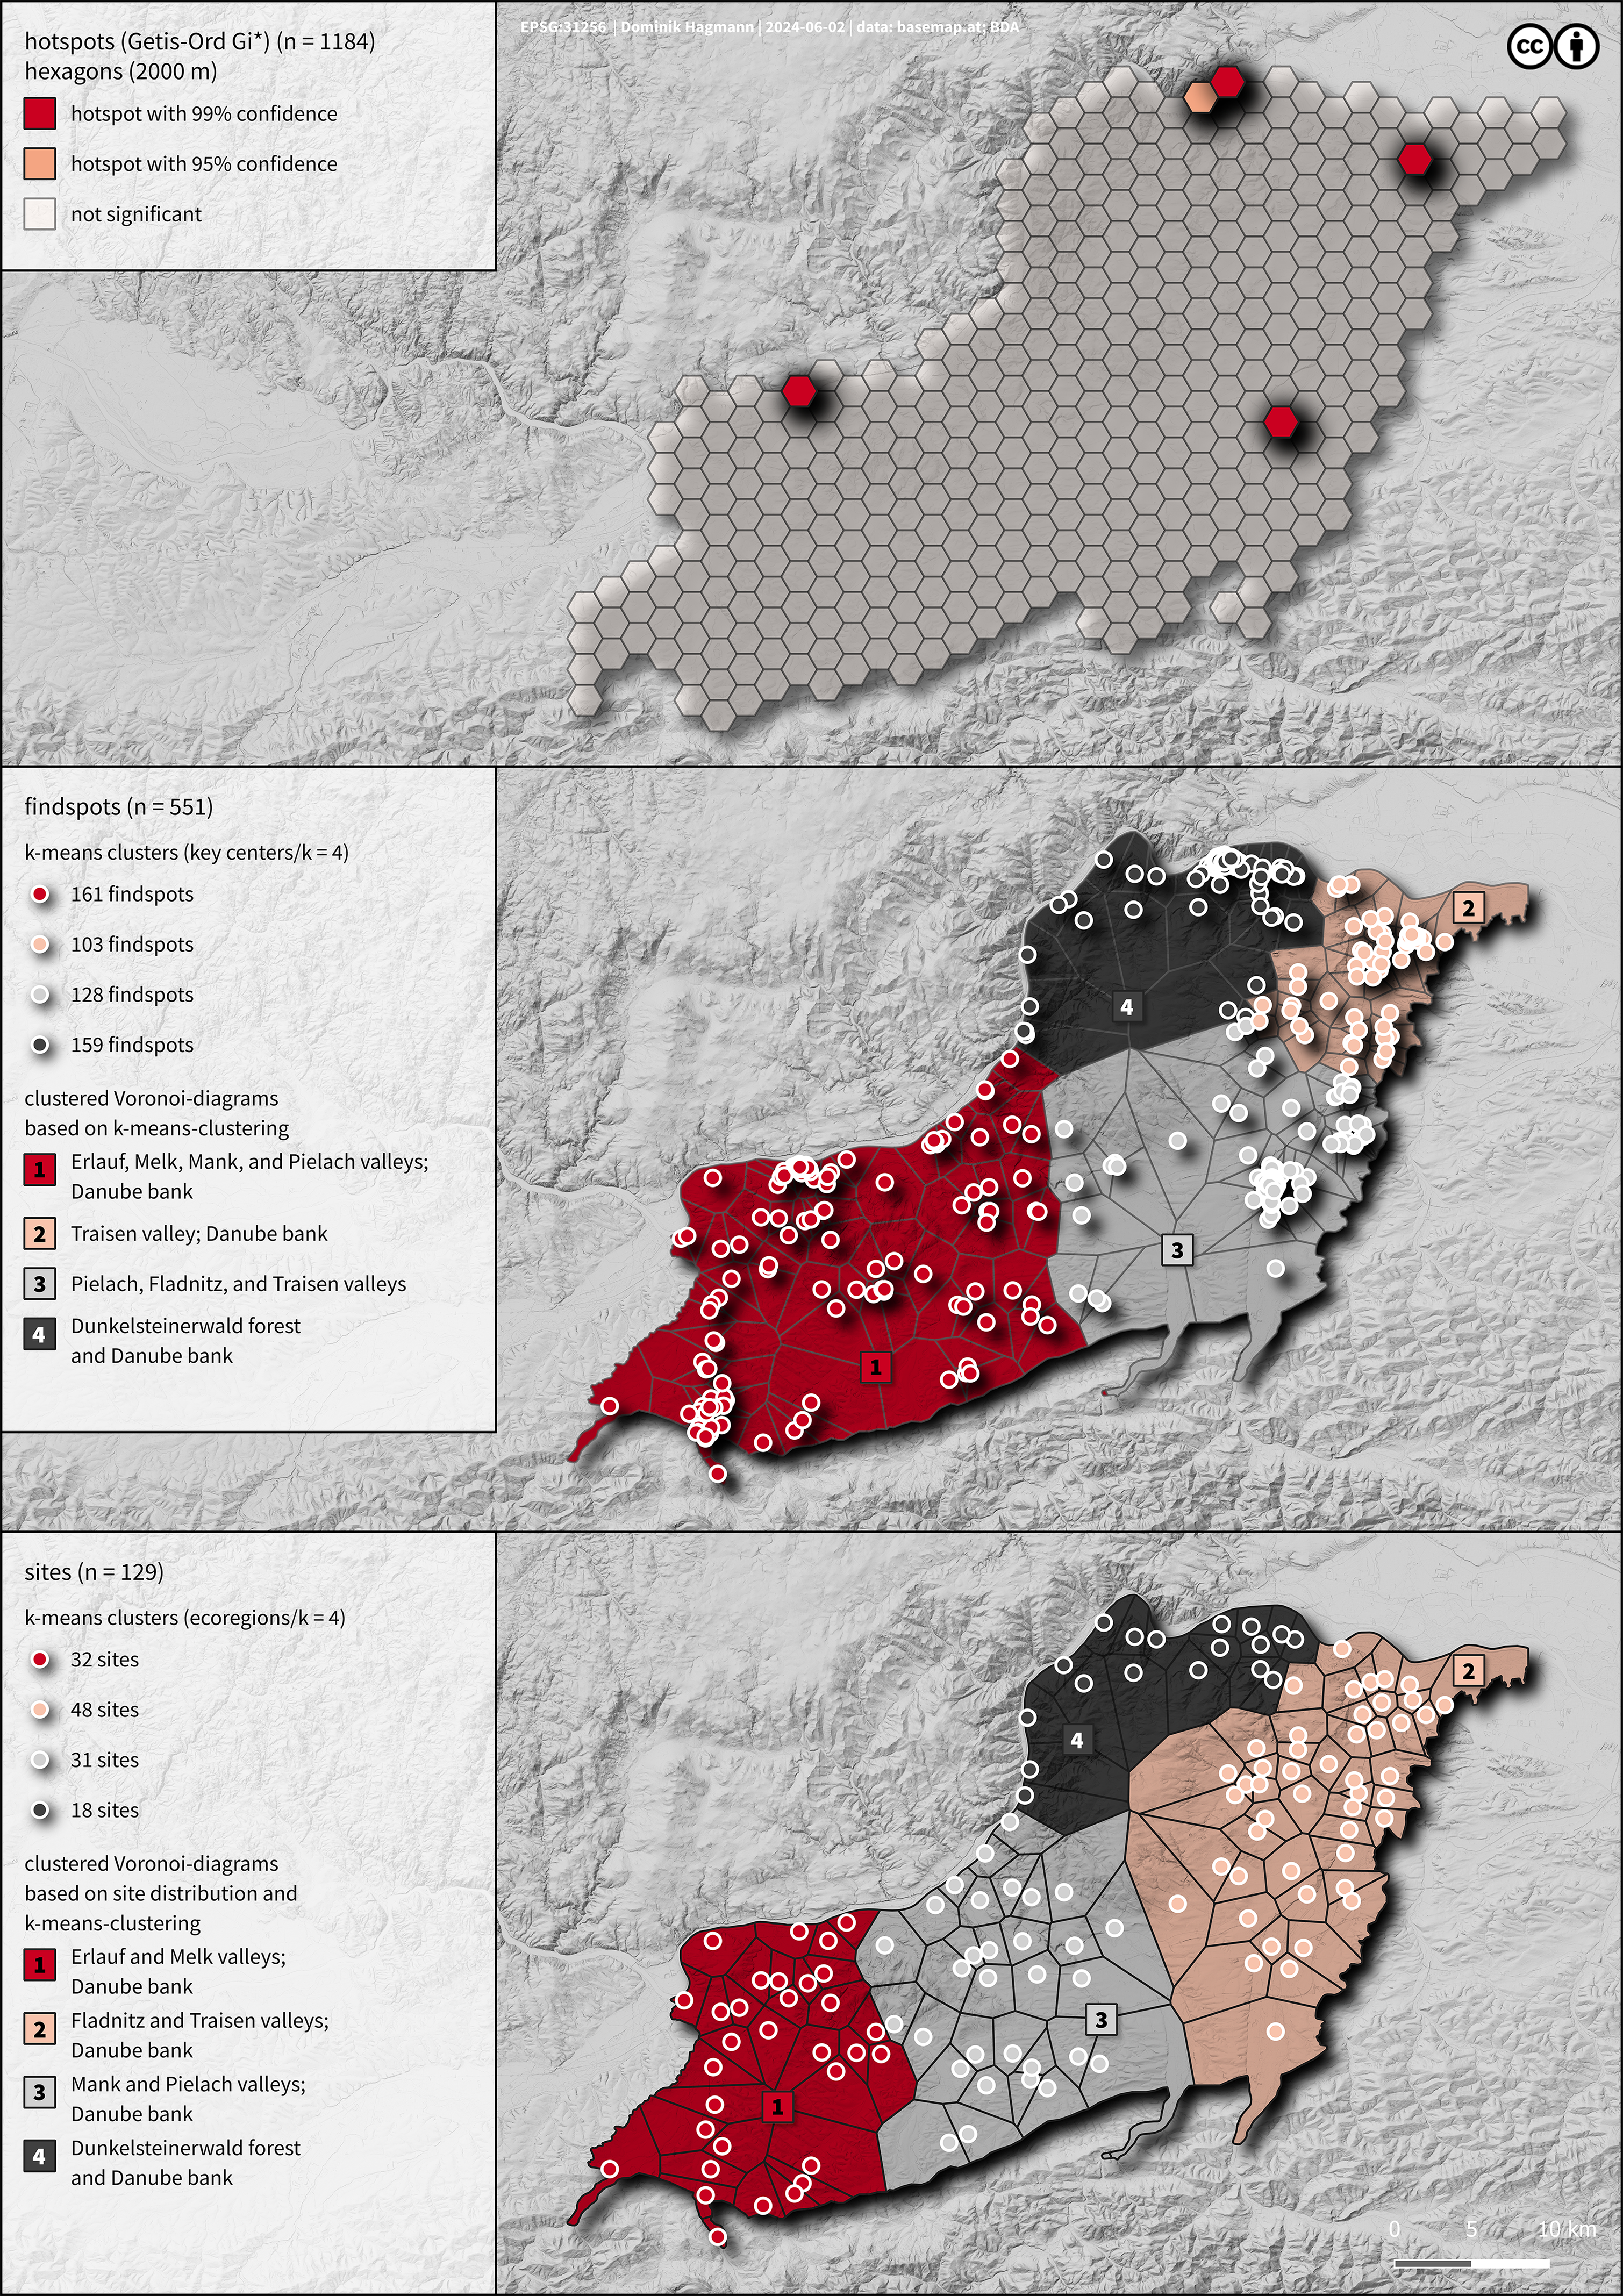
Further GIS evaluation identified four zones using k-means clustering with k=4, determined by a Getis-Ord* hotspot analysis. Roman-period features are concentrated around the four key regional settlement centers within the AOI: Arelape, Favianis, Augustianis, and Cetium, representing “Zentralorte” in Central Place Theory (CPT). The remaining 125 rural sites are dispersed around these central hubs, with clusters evident in major river valleys and plains (infra). Consequently, GIS-based analysis revealed that the AOI has favorable climatic conditions, fertile soils, and an abundant water supply, as these factors are eco-deterministically reflected in the dataset (Figs. 4–5).Footnote 10
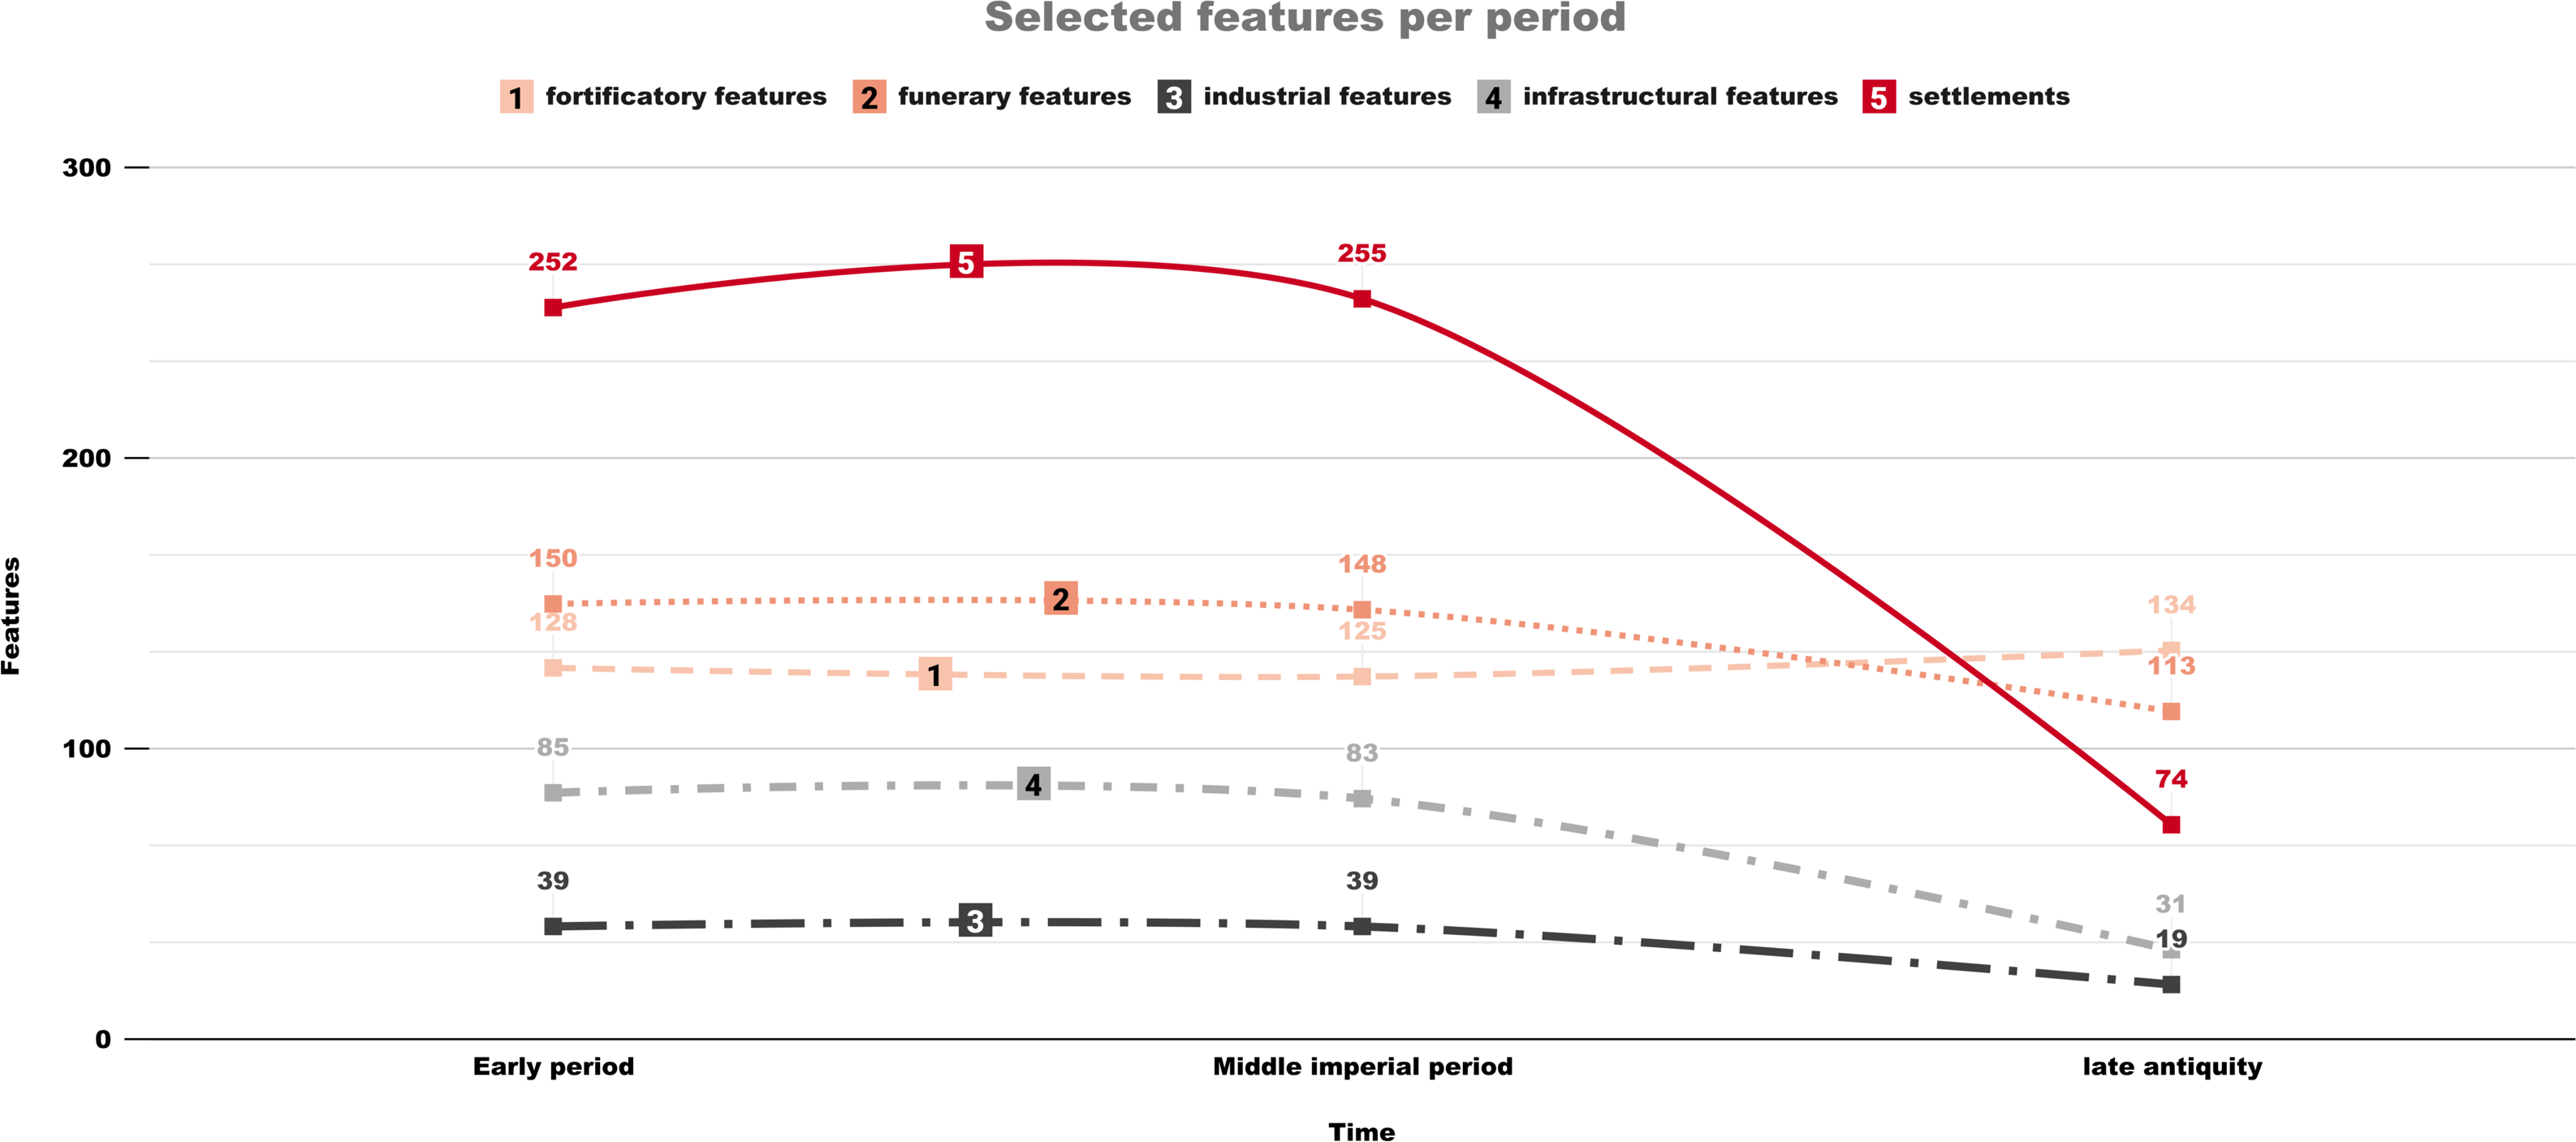
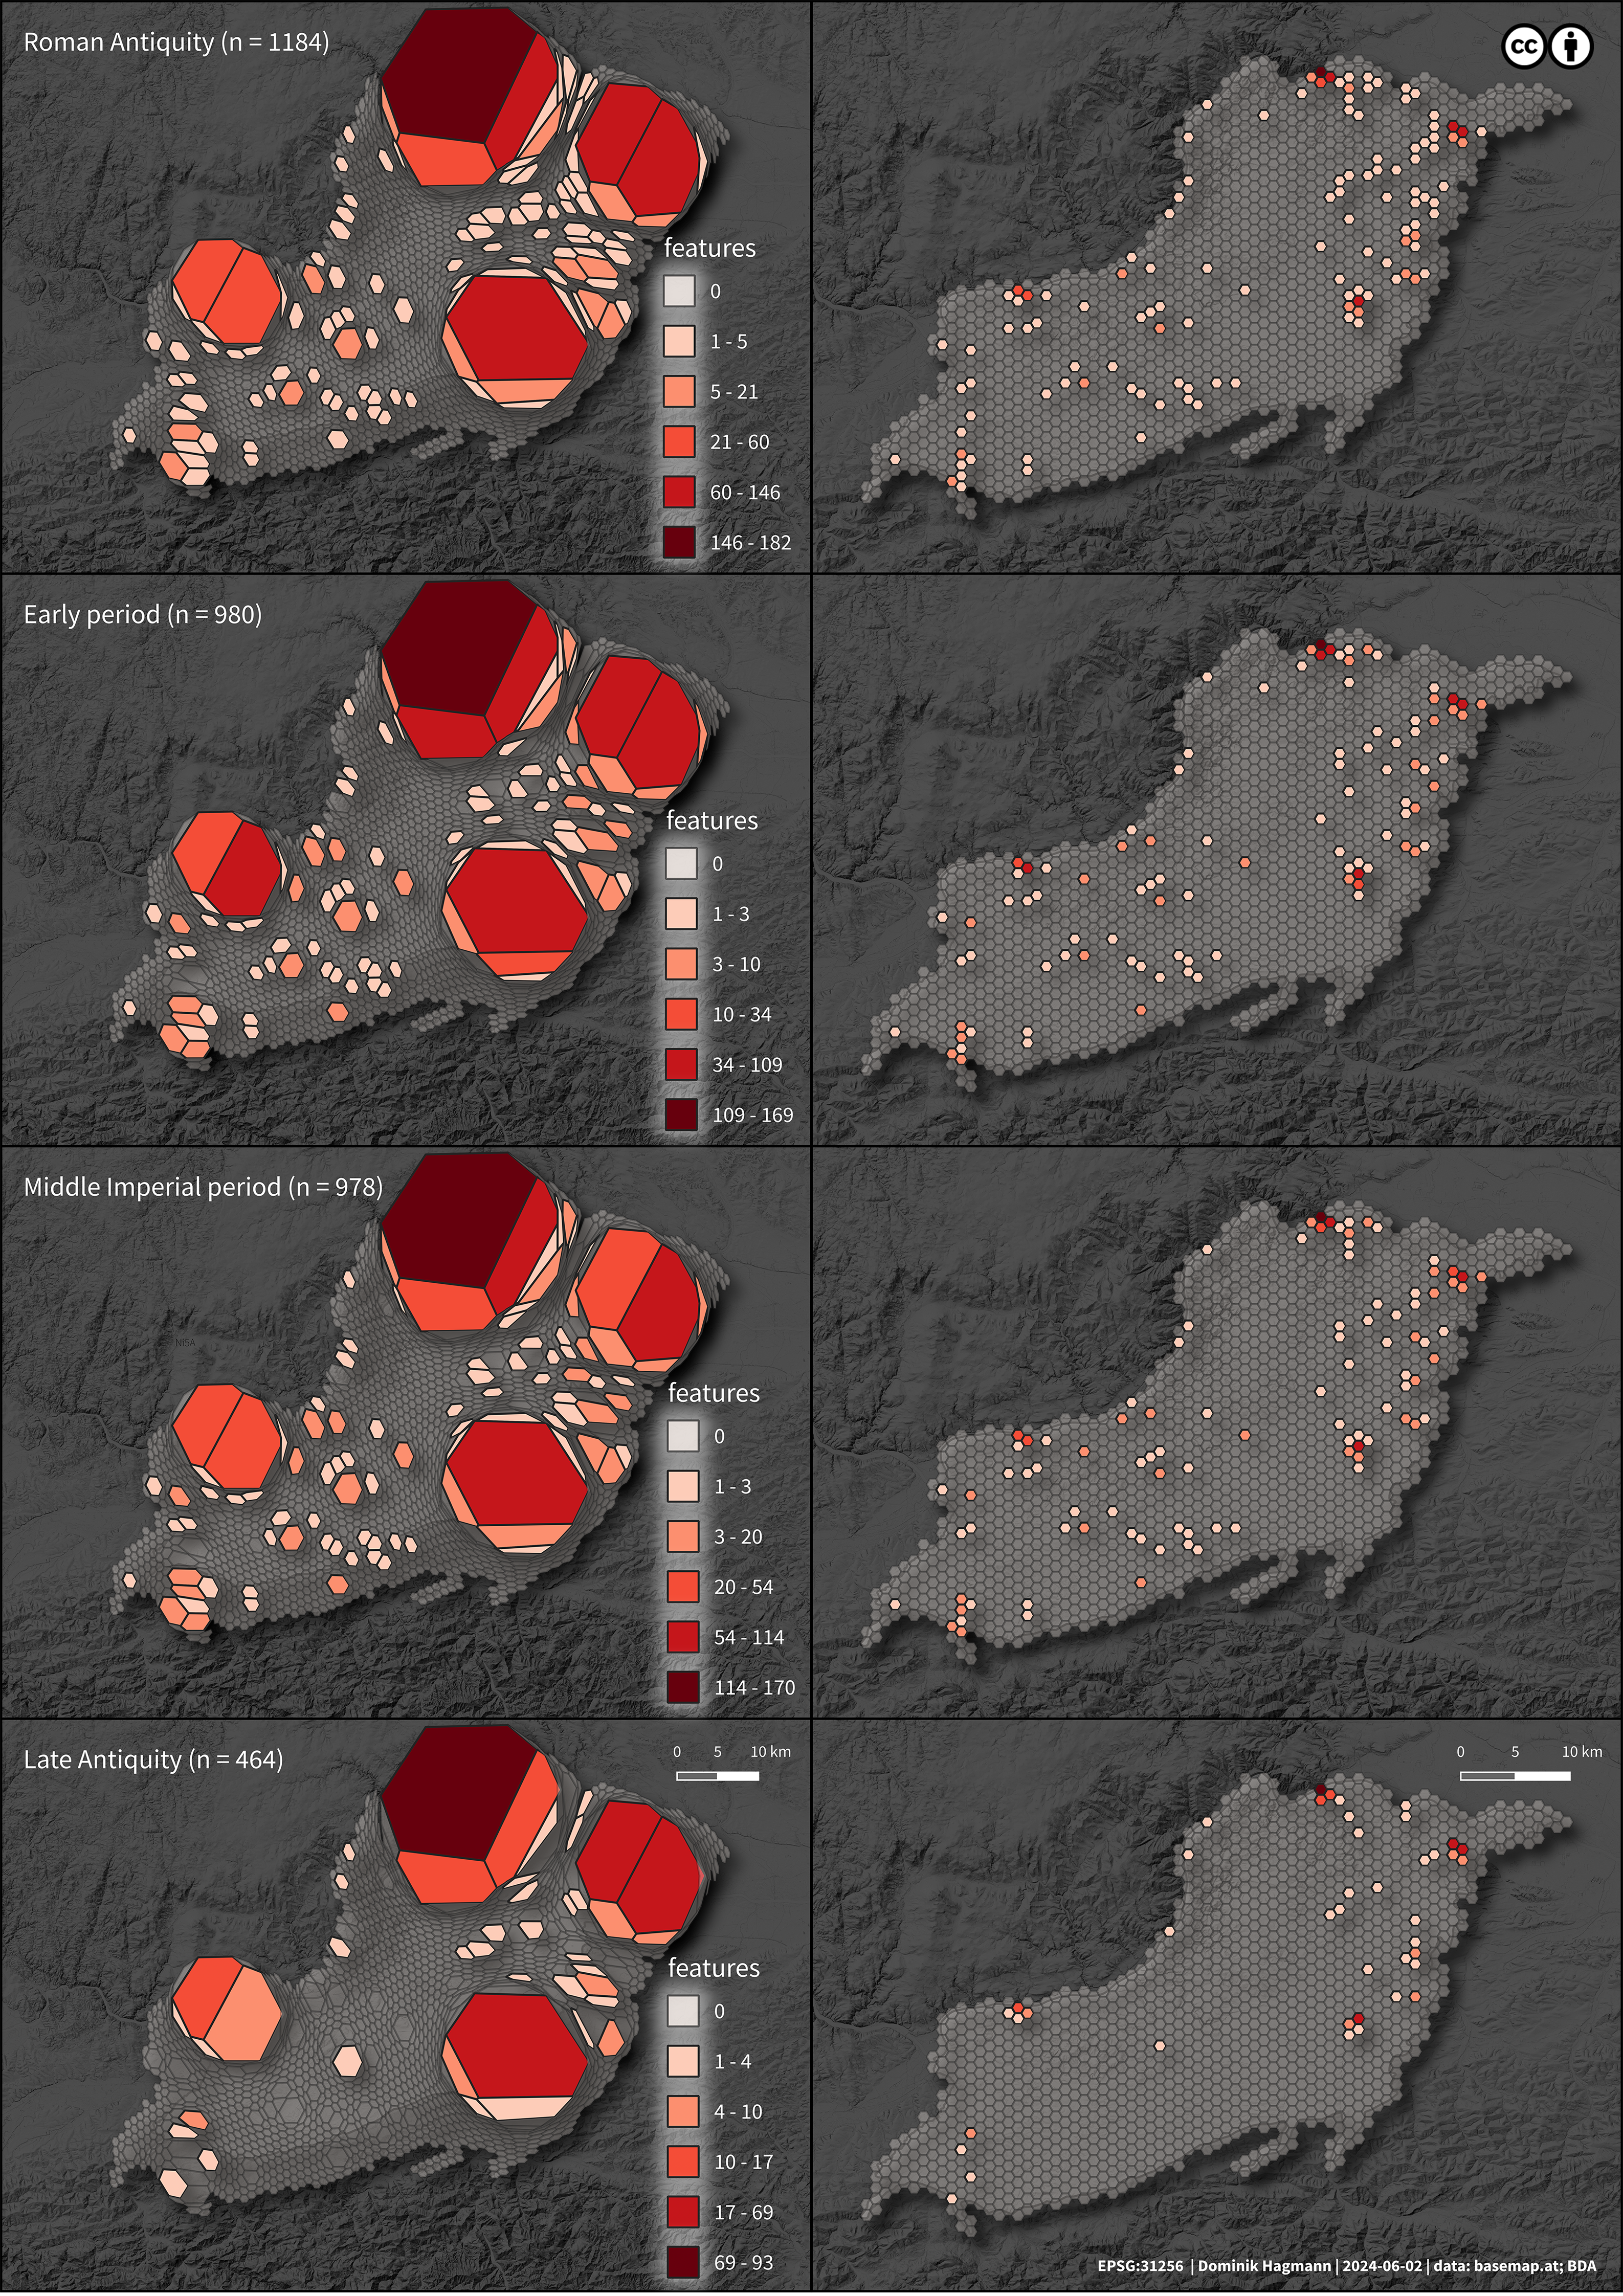
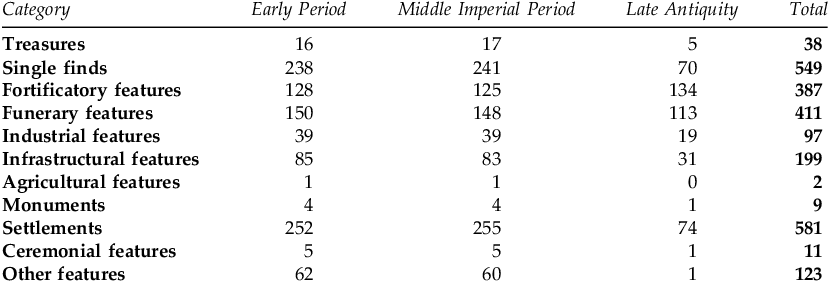
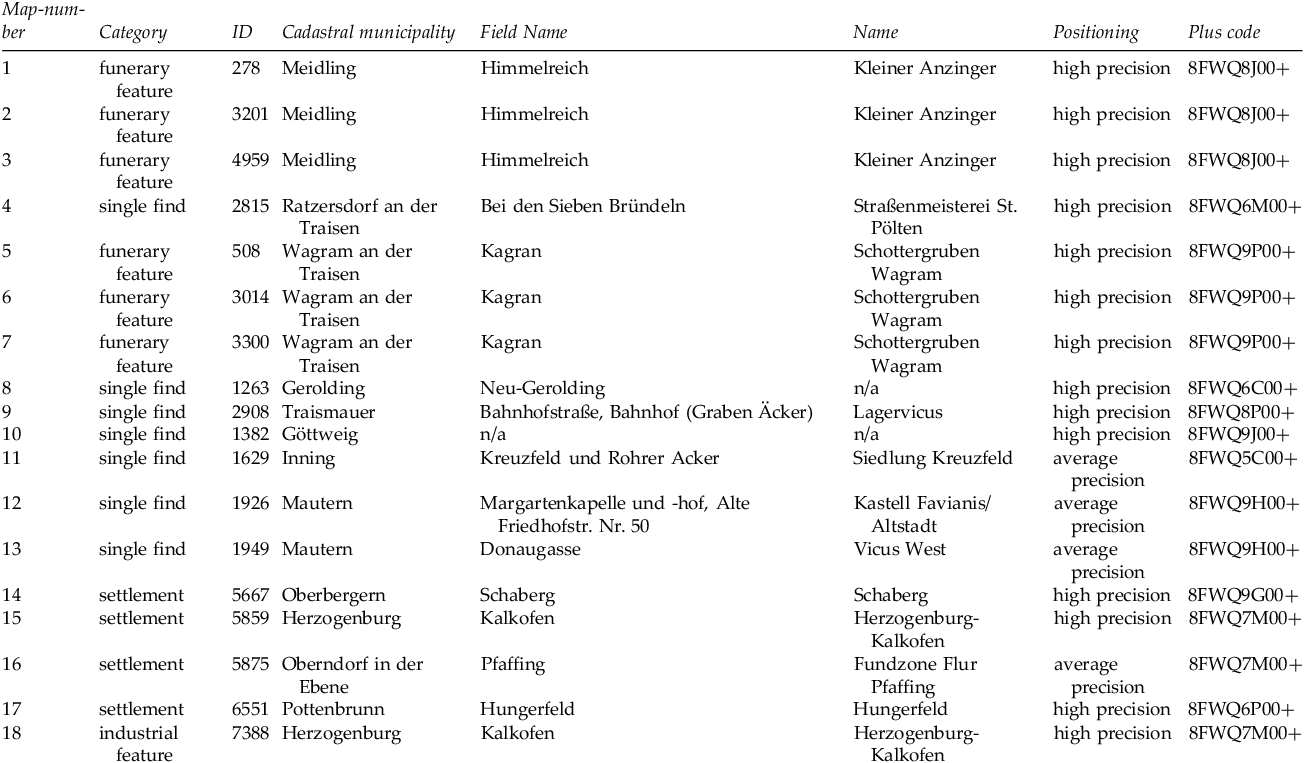
A clear pattern unfolds when spatially examining the chronology of settlement. During the Early and Middle Imperial periods, the GIS-based analysis shows that the rural settlement was relatively consistent, with 112 and 110 sites respectively. Yet, the Late Antique period witnessed a sharp decline to 53 sites. This represents a reduction of approximately 52.68% from the Early and 51.82% from the Middle Imperial period. This downturn predominantly affected the rural settlement – crucially, it is essential to recognize that not all sites existed concurrently during each period (Fig. 6, Table 1).Footnote 11
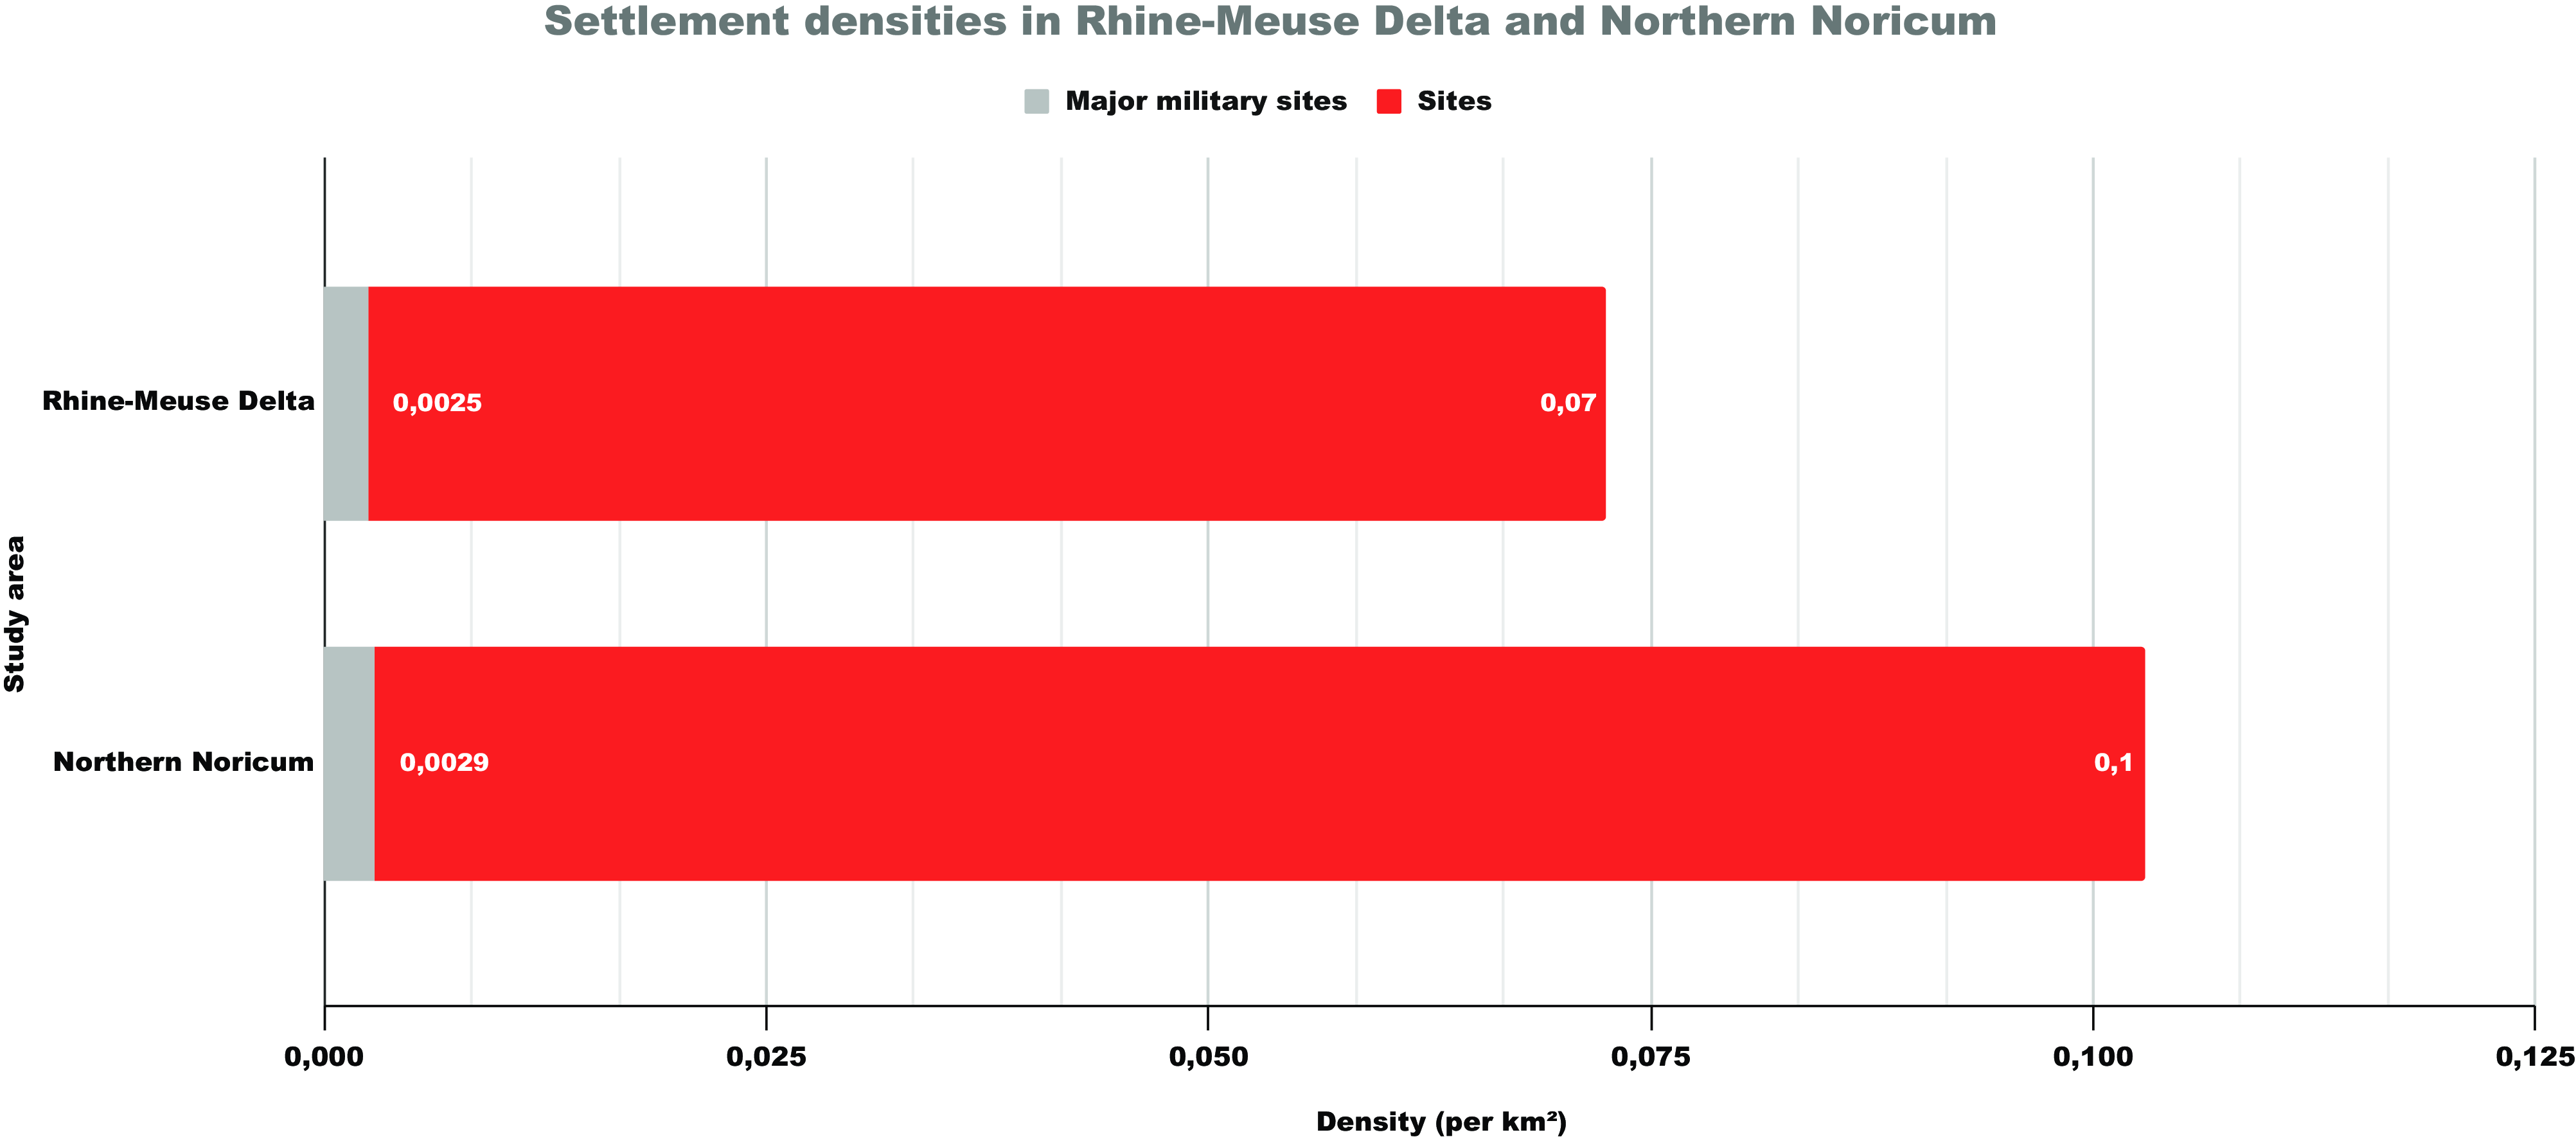
Settlement densities across the Roman Empire are generally not directly comparable due to the lack of international standardization in various (supra-)regional, private, state, and institutional site databases. However, a well-suited study from the Netherlands on the Roman transport networks of the Rhine-Meuse delta can serve as a relevant example. In that case, 502 selected rural settlements and 22 military sites are counted within an area of 7,500 km² in the delta. This translates to a density of 0.07 sites per km² compared to 0.11 sites per km² in the AOI. For military sites, there are 0.0025 forts and legionary camps per km² in the delta, as opposed to 0.0029 forts per km² in the AOI. Overall, the values are relatively similar and do not differ significantly, with slightly higher figures in Noricum due to a less stringent site selection than applied for the Rhine-Meuse Delta. This comparison suggests that the regions exhibit a relatively equal settlement density per km², indicative in both cases of a “typical” border region. This implies that Noricum was not an exceptionally sparsely populated area but rather a “standard” border zone in terms of settlement density (Fig. 7).Footnote 12
Discussion
During this study, an interpretive model for the AOI was formulated, albeit with several limitations. The model, derived from unstructured data collected since the late 19th c., may suffer from methodological shortcomings, particularly due to broad chronological categories that hinder precise “time slice” analyses. Further research and reassessment of older finds is crucial for chronological refinement, as the dataset’s uniform temporal attributes render aoristic calculations ineffective. Despite these challenges in studying the long-term development of ancient rural settlements, applying Fernand Braudel’s concept of the longue durée allows us to discern changes in the AOI over time and describe the underlying dynamics using an archaeological explanatory model.Footnote 13 This model specifically aims to explain the sharp decline of settlement findings in Late Antiquity.Footnote 14
A significant challenge in the AOI is the lack of concrete evidence for many sites. We are often limited instead to indirect evidence like stray finds or features only partially excavated during rescue archaeological activities. This makes it particularly difficult to definitively classify each site as a specific settlement type. However, it is vital to acknowledge the diversity of the settlement landscape, including nuanced distinctions between not only “villa” and “non-villa” but also “vicus” and “non-vicus” landscapes. Assuming that all non-military sites in the AOI are villae risks overlooking other crucial settlement types, potentially leading to biased interpretations. Instead, adopting a holistic approach may more accurately reflect the diversity and complexity of rural Roman life.
Recent studies in Britannia have revealed the presence of possibly autochthonous, non-elite settlements, like farmsteads and roadside settlements, in addition to villae and vici. The emergence of new, production-focused middle-class villae, exemplified by Gries in the Melk Valley (ID104), and hamlet-style settlements like Großpriel (ID80) may have resulted from veteran families relocating after military service and peregrini settling in rural areas. The Roman rural settlement landscape is thus a mosaic of “integrated Roman rural complexes,” encompassing villages or small towns (vici), Roman rural farmsteads (villae), and other non-villa/vicus settlements such as watchtowers, hamlets, simple farmsteads, and agricultural facilities, along with their land-use patterns. This concept allows for describing both uniform settlement types and diverse mixtures, such as a villa with an attached vicus. Understanding the “system of ups and downs” of these complexes requires a nuanced framework integrating chronological phases and ecological, economic, socio-political, and cultural factors. This approach challenges simplistic narratives attributing decline solely to external military threats or internal decay, recognizing these as only partial explanations.Footnote 15
Pre-Roman settlement (pre-50 CE)
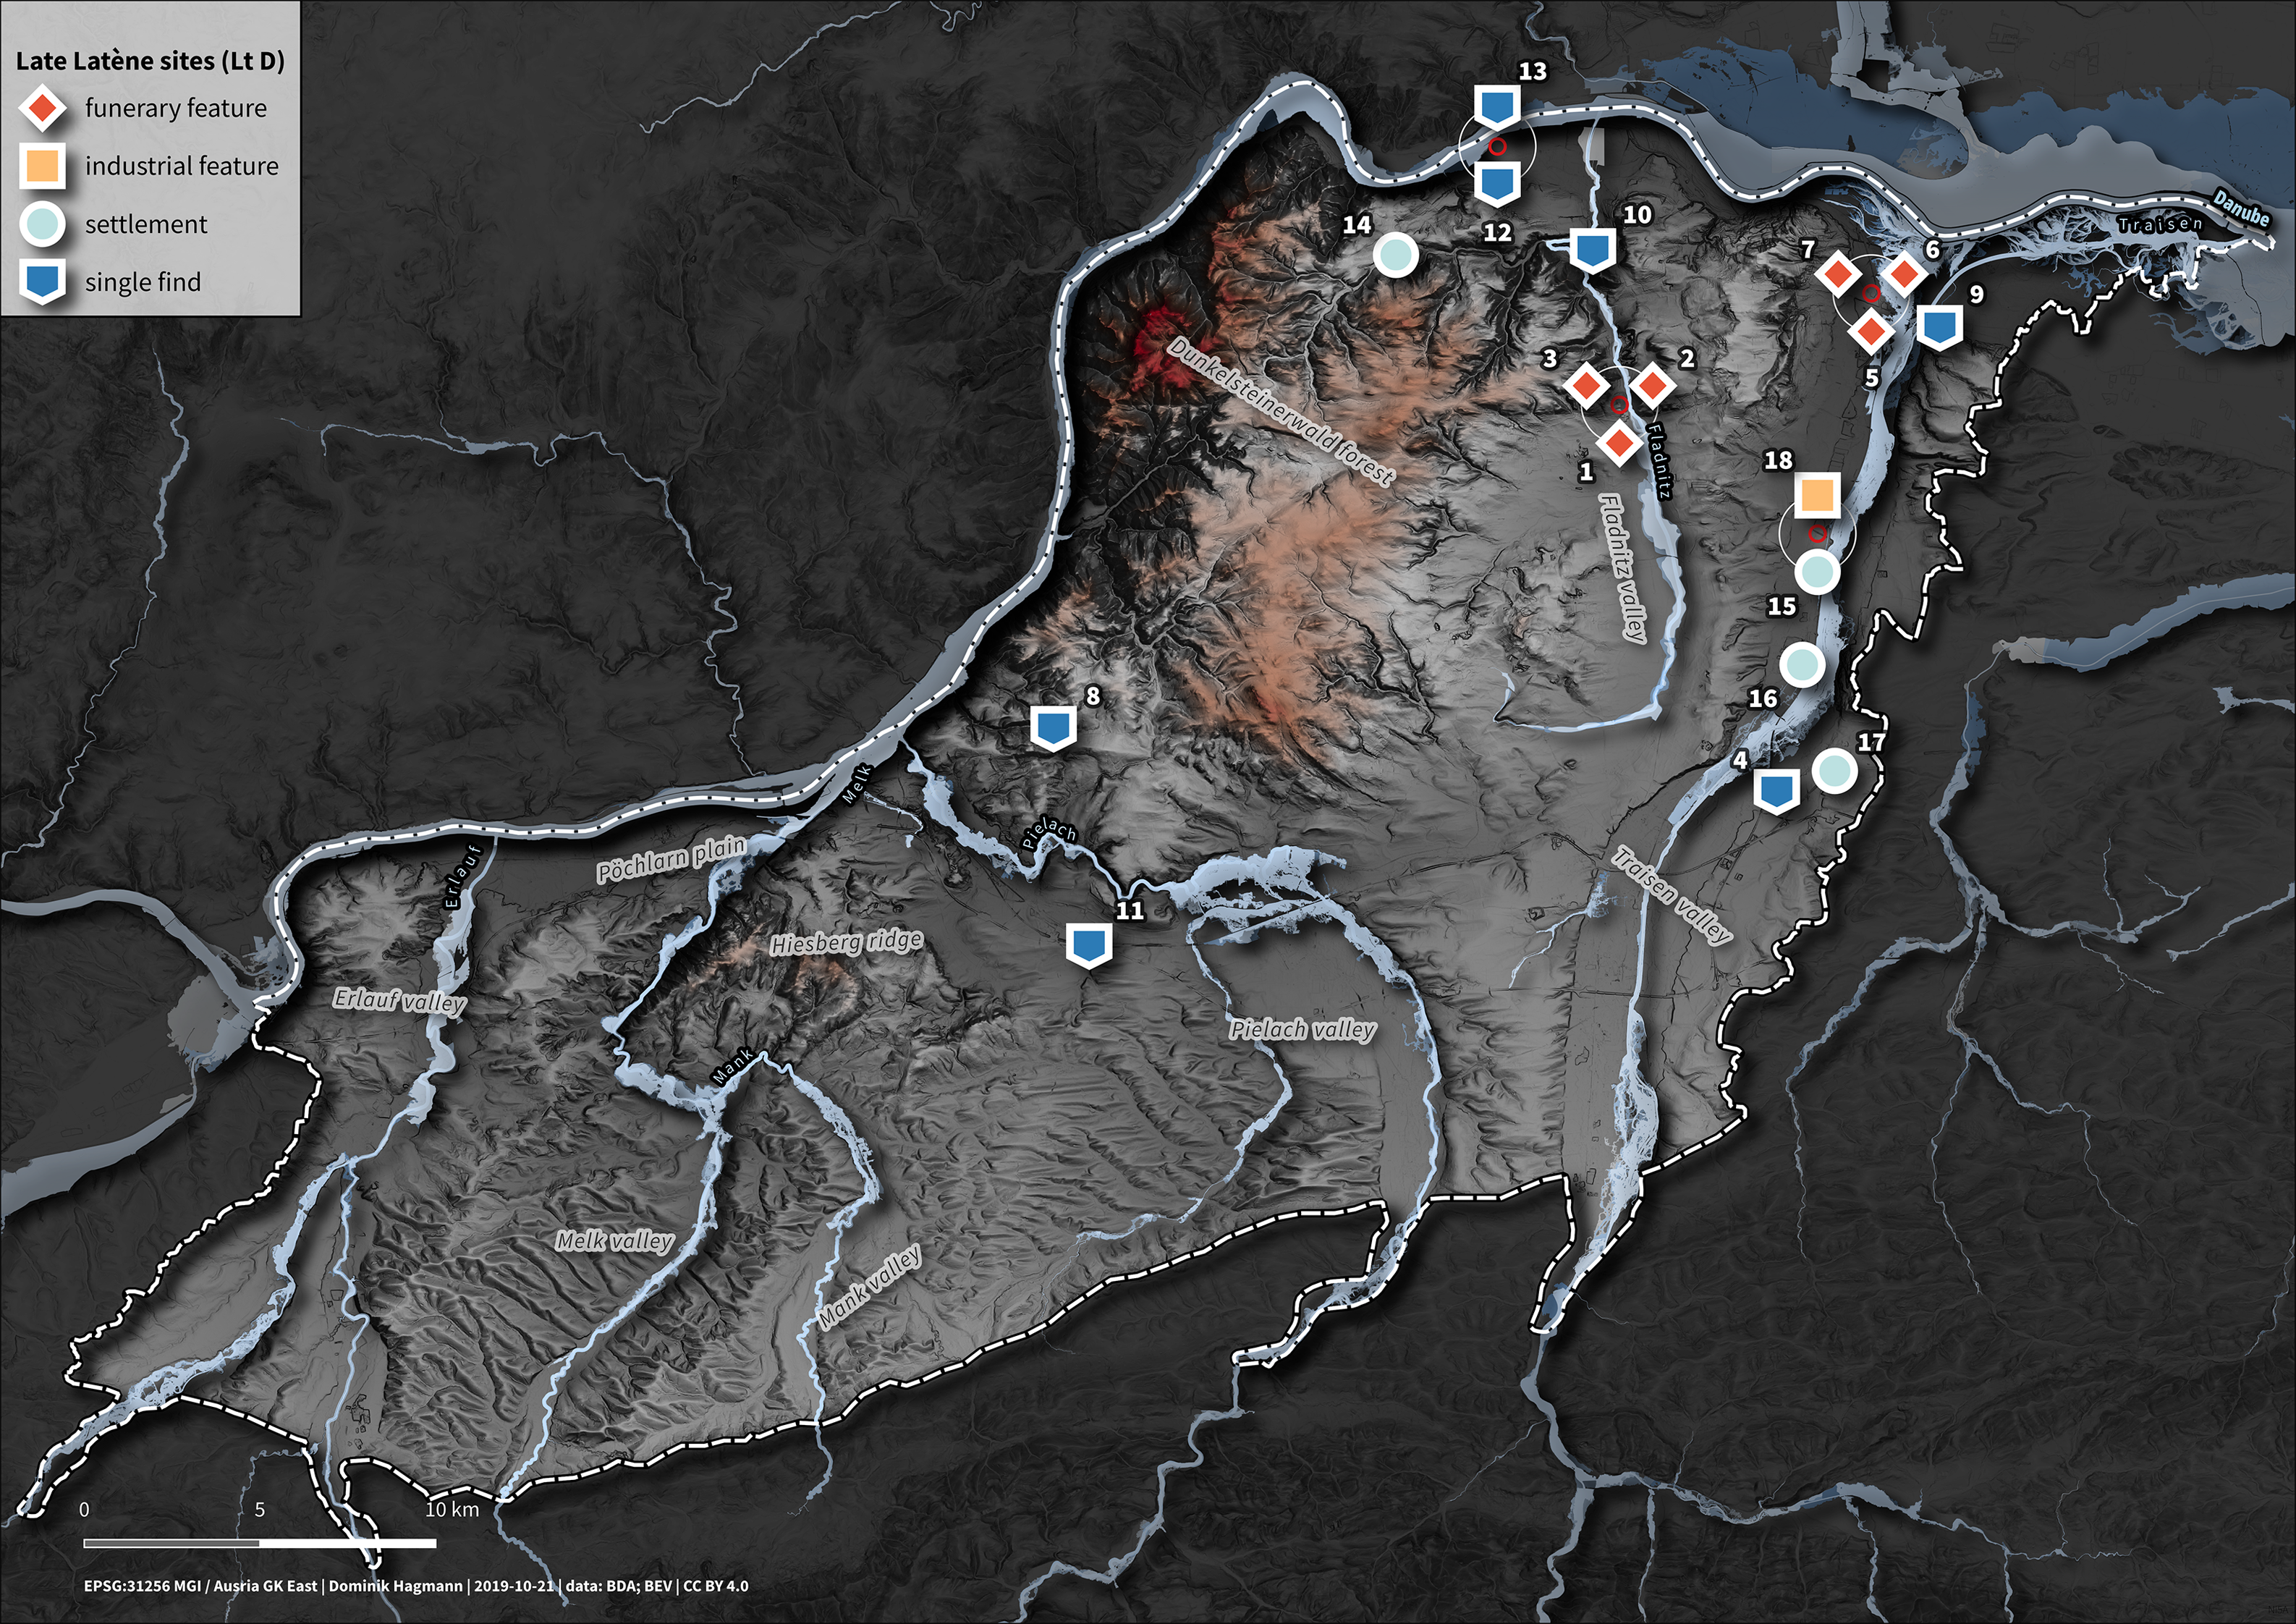
The GIS-based analysis revealed that Lt D period sites are scarce within the AOI, indicating varying settlement densities, with higher concentrations in the Fladnitz and Traisen valleys, as well as the southwestern Tulln basin, compared to sparse habitation in the Dunkelsteinerwald forest and the Pielach valley. Notably, some sites, especially in the broader Traisen valley, suggest an organized settlement pattern that surpasses mere hamlets.Footnote 16 Since the earliest Roman records can be assigned to the Flavian period, it may be plausible to suggest a generational settlement hiatus between the late Lt D period and the Early Roman era for most locations within the AOI. Continuity of settlement is evidenced only at specific sites, where favorable environmental conditions are possibly the determining factor. These locations, where artifacts from both the Lt D and the Early Roman periods are contextually linked, may have served as crucial supply points for the population before and during the Early Period. In this context, the major site at Unterradlberg (ID4), probably dating back to the 1st c. CE, could represent one of the rare examples of settlement continuity from the Late Iron Age into Roman Antiquity. However, the reasons for the sparse settlement in the late Lt D period and the transitional phase to Roman Antiquity remain unclear.Footnote 17 Limitation partly stems from the broad time span covered – approximately 135 years or four generations – making precise dating challenging. Significant research gaps further complicate the matter, particularly concerning the latest Lt D2b phase (45 to 16/15 BCE). Nevertheless, the scarcity of confidently dated sites from this phase raises questions about whether this reflects incomplete research or actual historical conditions. This uncertainty presents a significant opportunity for future research (Fig. 8, Table 2).Footnote 18
Early period (50 CE to 117 CE – Figure 9)
The Area of Interest (AOI) within today’s Lower Austria/AUT (map a). The AOI’s location within the region of Northern Noricum is shown in inset map b. The province of Noricum was under Imperial Roman rule from 16/15 BCE until ca. 284 CE. In Late Antiquity (ca. 284 CE until ca. 488 CE), it was divided into Noricum ripense in the north – essentially corresponding to Northern Noricum – and Noricum mediterraneum in the south. Inset map c illustrates Noricum’s location within the Roman Empire around 200 CE. For the decoding of Site-IDs, refer to Appendix – Table 1 in Appendix 4/11 in the Supplementary Materials. (Map by D. Hagmann Reference Hagmann2023; data: Land Niederösterreich [NÖ]; geoland.at; Land Oberösterreich; Bundesamt für Eich- und Vermessungswesen [BEV]; Bundesdenkmalamt [BDA]; Digital Atlas of the Roman Empire; vici.org; Pelagios, Polygons for Pleiades Regions; Gassner – Pülz [Reference Gassner and Pülz2015]; Ancient World Mapping Center, Barrington Atlas; Olshausen [2011].)

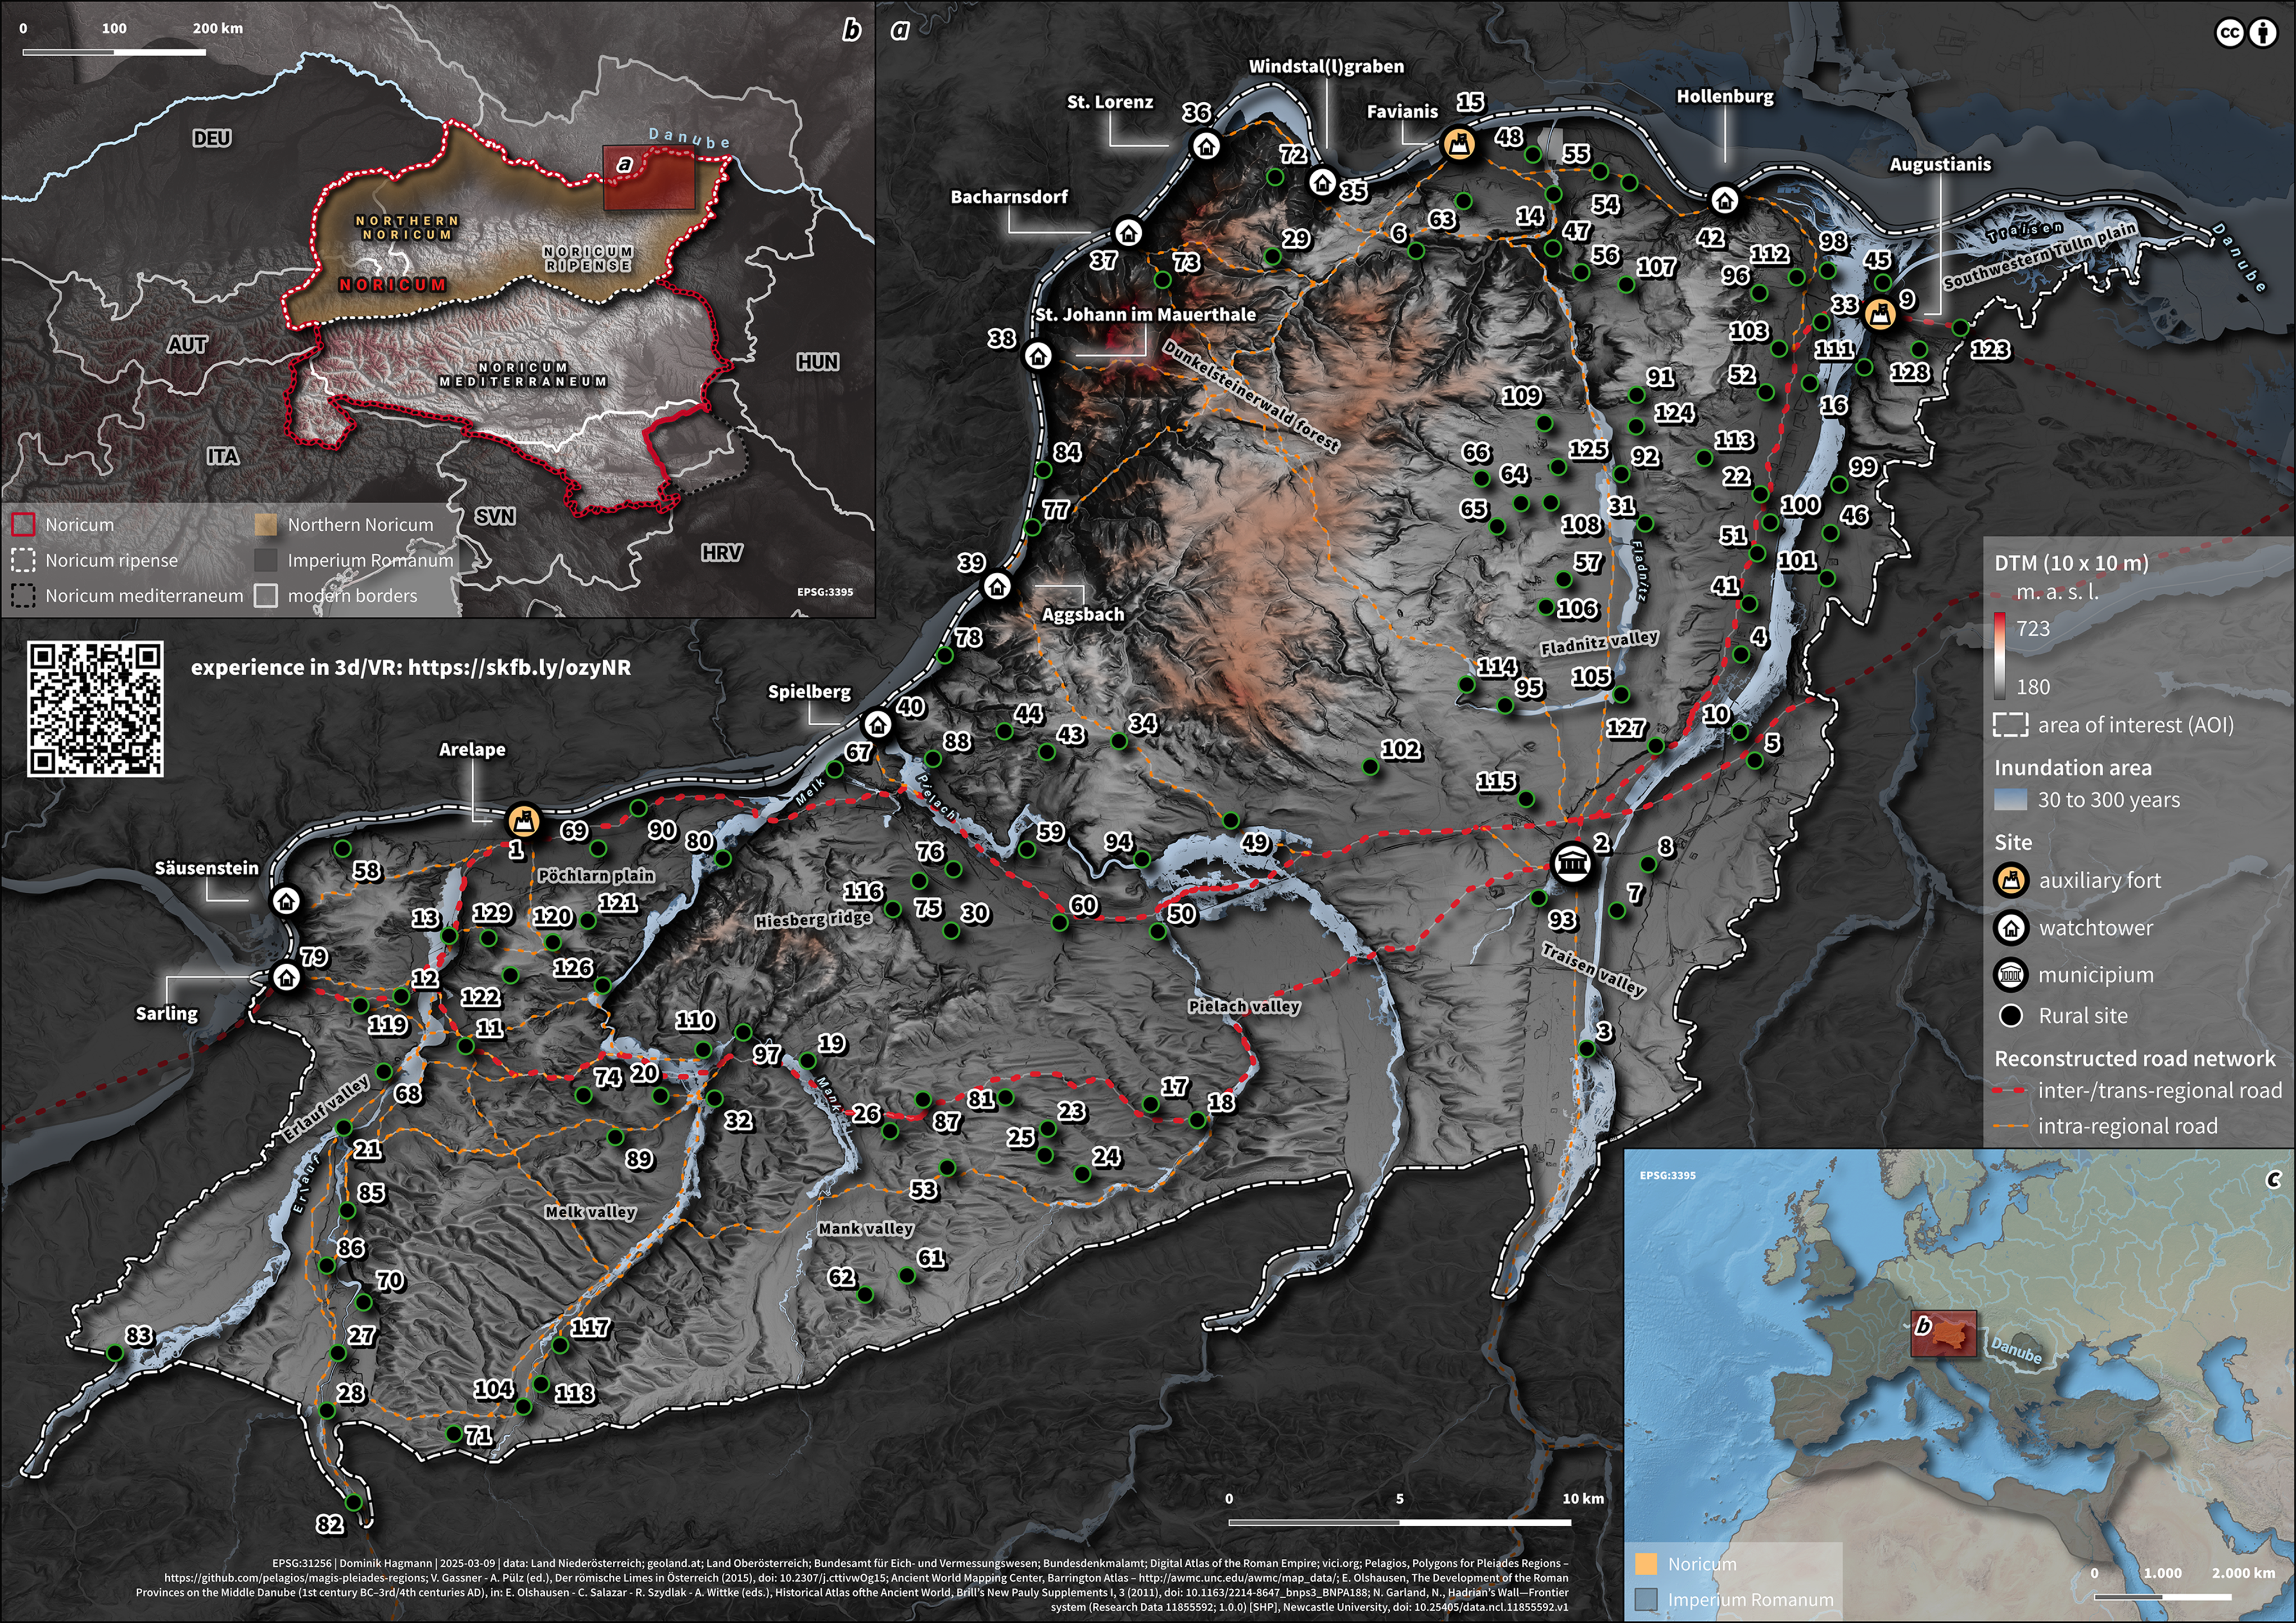
Aggregated water catchment areas across the AOI. (Map by D. Hagmann Reference Hagmann2023; data: Land NÖ; BEV; OpenStreetMap.)

Spatial distribution of ancient Roman site features through multiple data visualization techniques in the AOI (n = 1,184): These include a clustered representation of site features (left) and a hexagonal data bin-based representation (center). A cartogram (right) further accentuates the spatial disparity between find densities within the AOI and the urban centers of contemporary Lower Austrian cities. For the methods used, refer to Appendix 2 in the Supplementary Materials. (Figure by D. Hagmann 2020; data basis: Land NÖ; BDA.)

Top: Results of Getis-Ord*-hot-spot analysis geostatistically determining Arelape, Favianis, Augustianis, and Cetium as the four regional centers of the AOI for Roman Antiquity. Center and bottom: functional regions within the AOI as determined by k-means clustering (k=4) applied to Voronoi diagrams generated from 551 findspots (center) and 129 sites (bottom). The regions correspond to the four ecoregions of Central Europe, subdividing the AOI into functional regions from west to east. Each region is linked to one or two centers, with overlapping boundaries of hinterlands and umlands, depending on whether the analysis is based on findspots or sites. For a detailed description, refer to Table 3; for the methods used, refer to Appendix 2 in the Supplementary Materials. (Map by D. Hagmann Reference Hagmann2023; data: basemap.at; BDA.)

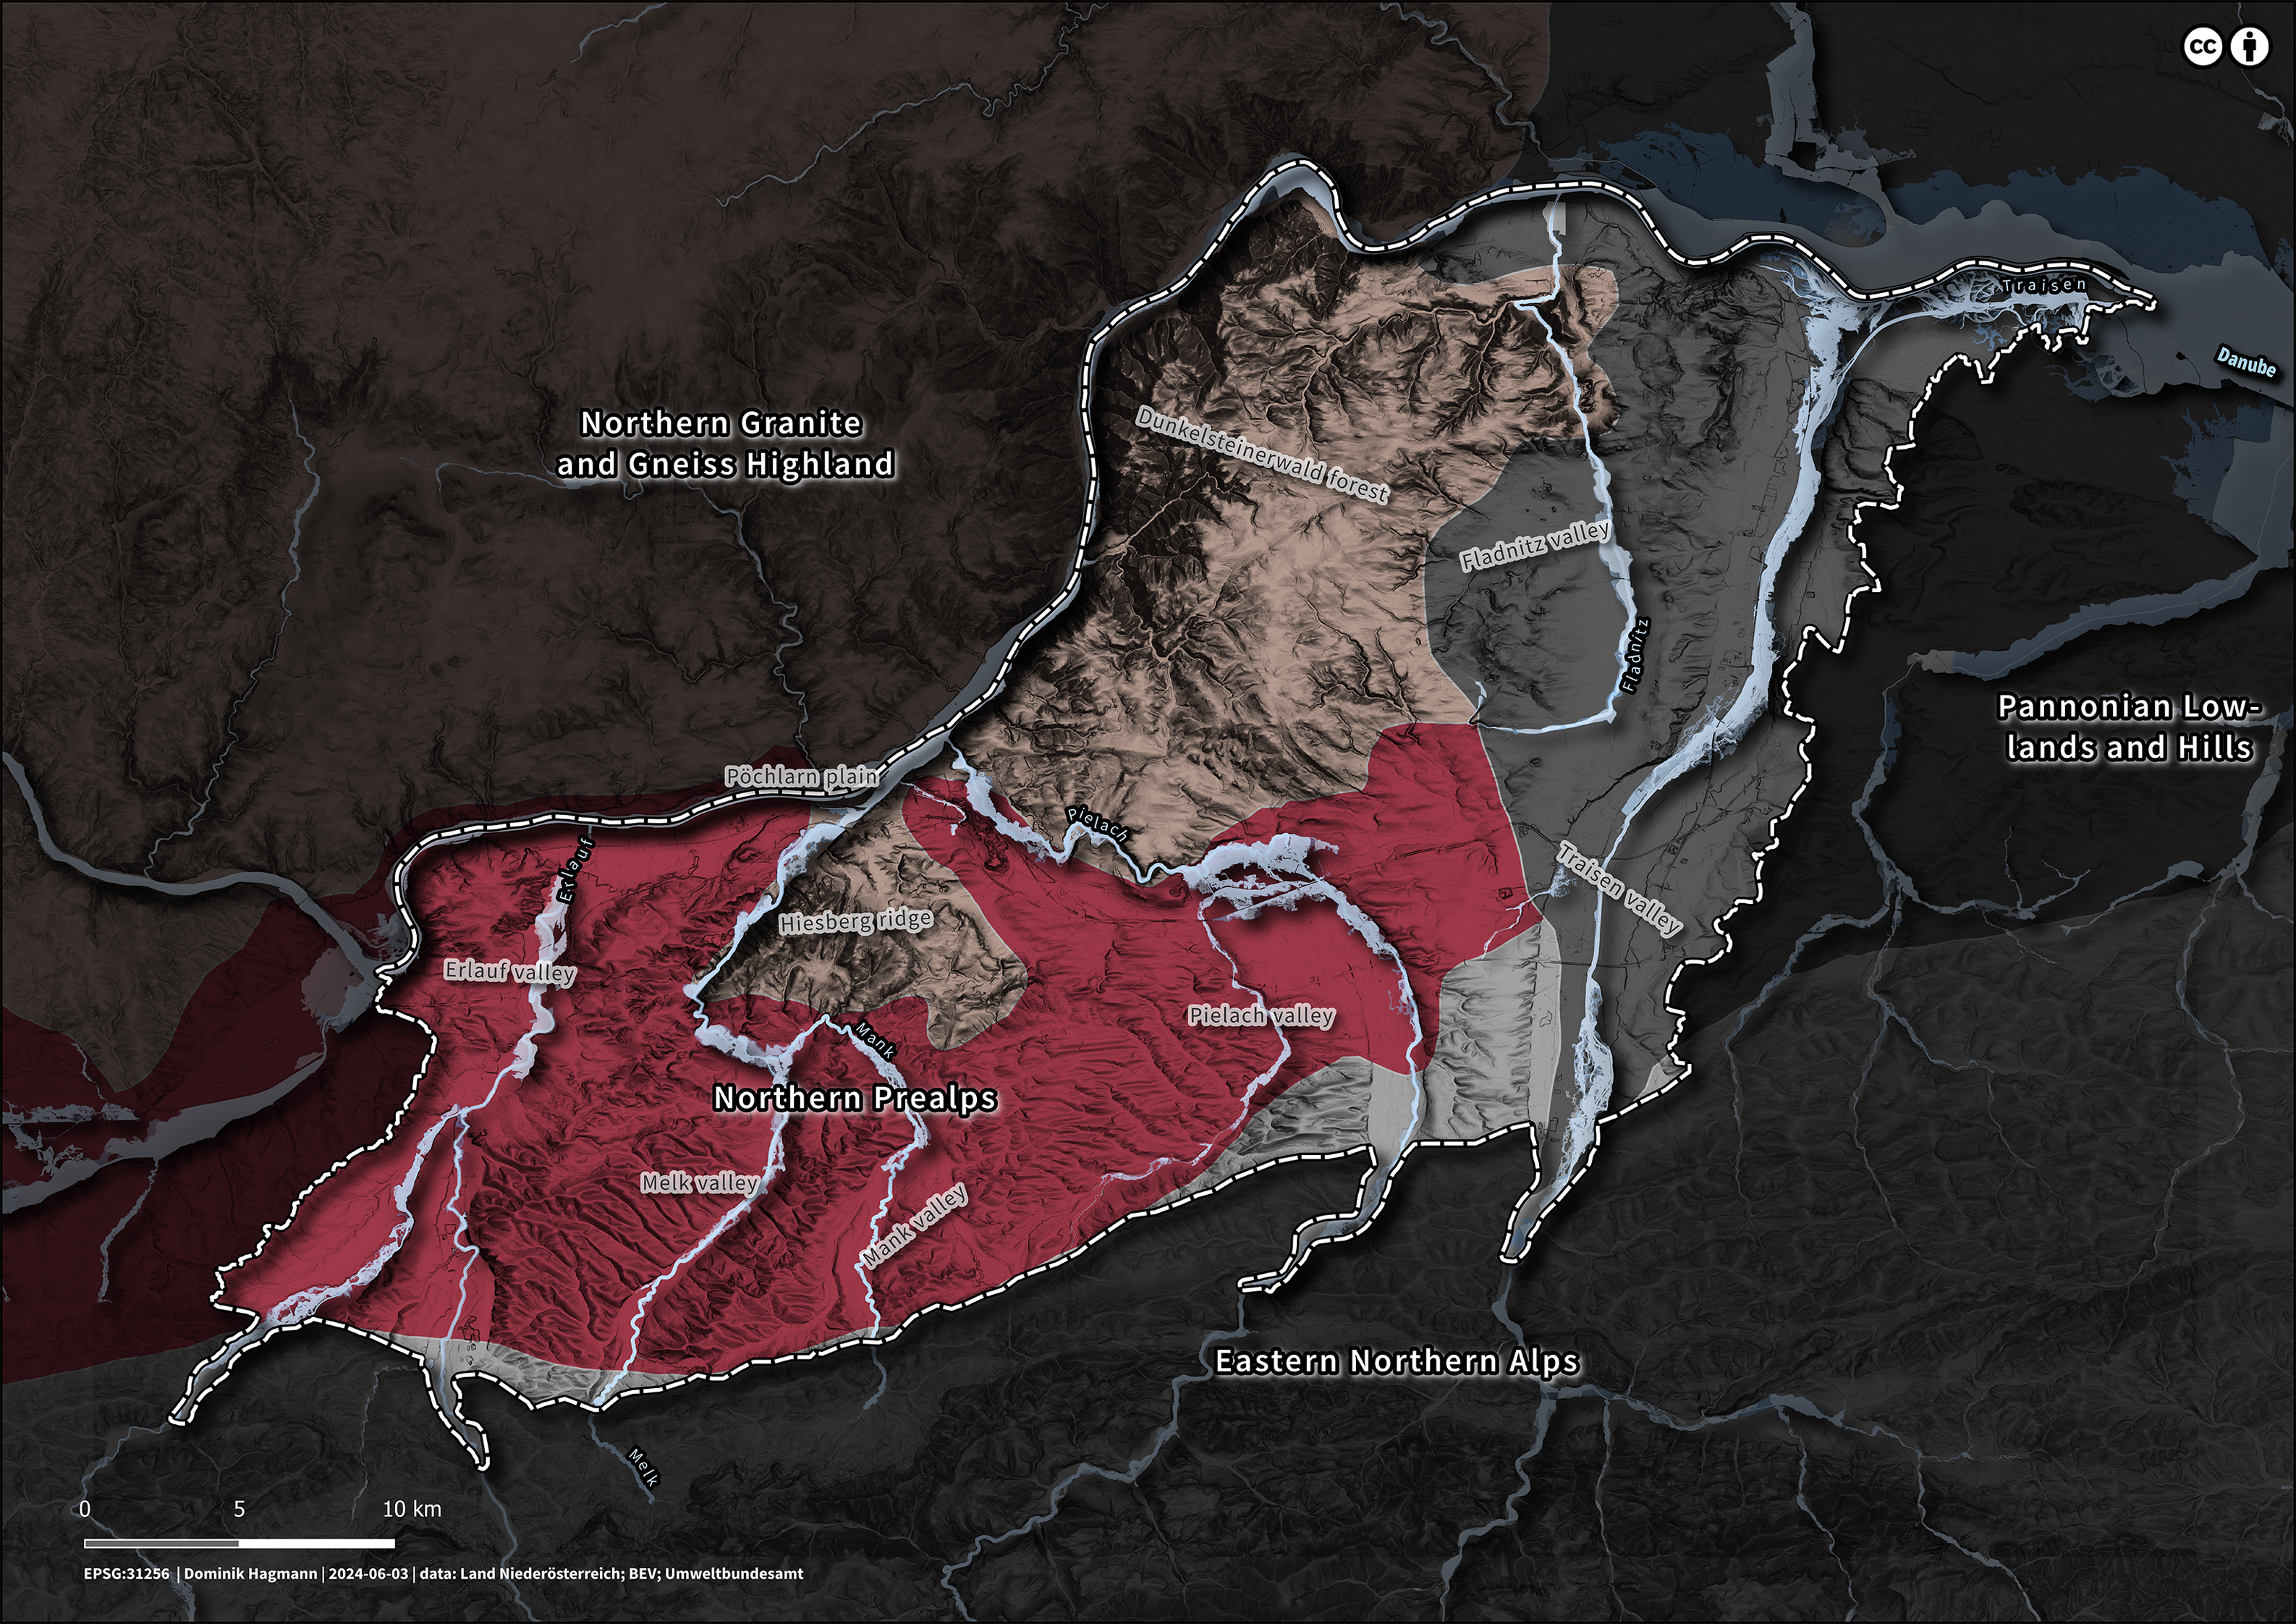
Overarching ecoregions and topographic sub-regions – based on modern data – across the AOI. (Map by D. Hagmann Reference Hagmann2023; data: Land NÖ; BEV; Umweltbundesamt.)

Diagrammatic visualization of temporal and qualitative rural landscape development for Roman Antiquity based on fortificatory, funerary, industrial, infrastructural, and settlement features in the AOI – for the respective data, refer to Table 1. (Diagram by D. Hagmann Reference Hagmann2023; data: BDA.)

Diagrammatic comparison of settlement densities in the Rhine-Meuse Delta and Northern Noricum. (Diagram by D. Hagmann Reference Hagmann2023; data: BDA; Groenhuijzen and Verhagen Reference Groenhuijzen and Verhagen2017, 237.)

Late Latène (Lt D) objects (funerary, industrial, and settlement features, as well as single finds) in the AOI – for the respective data, refer to Table 2. (Map by D. Hagmann Reference Hagmann2023; data: BDA; BEV.)

Cartographic visualization of temporal rural landscape development in the AOI for Roman Antiquity: in the left column, cartograms serve representation as the visual medium, accentuating the pronounced concentration of sites within regional centers; in the right column, hex bin maps serve as an alternative. Notable is the alteration in the settlement pattern that arises from the extensive chronological categorization of the underlying data. This change is most discernible in the context of Late Antiquity. The temporal progression is to be read from top to bottom according to the time periods utilized within each column. For the respective data, refer to Appendix 4/11 and 4/12 in the Supplementary Materials. (Figure by D. Hagmann Reference Hagmann2023; data: Land Niederösterreich; BDA.)

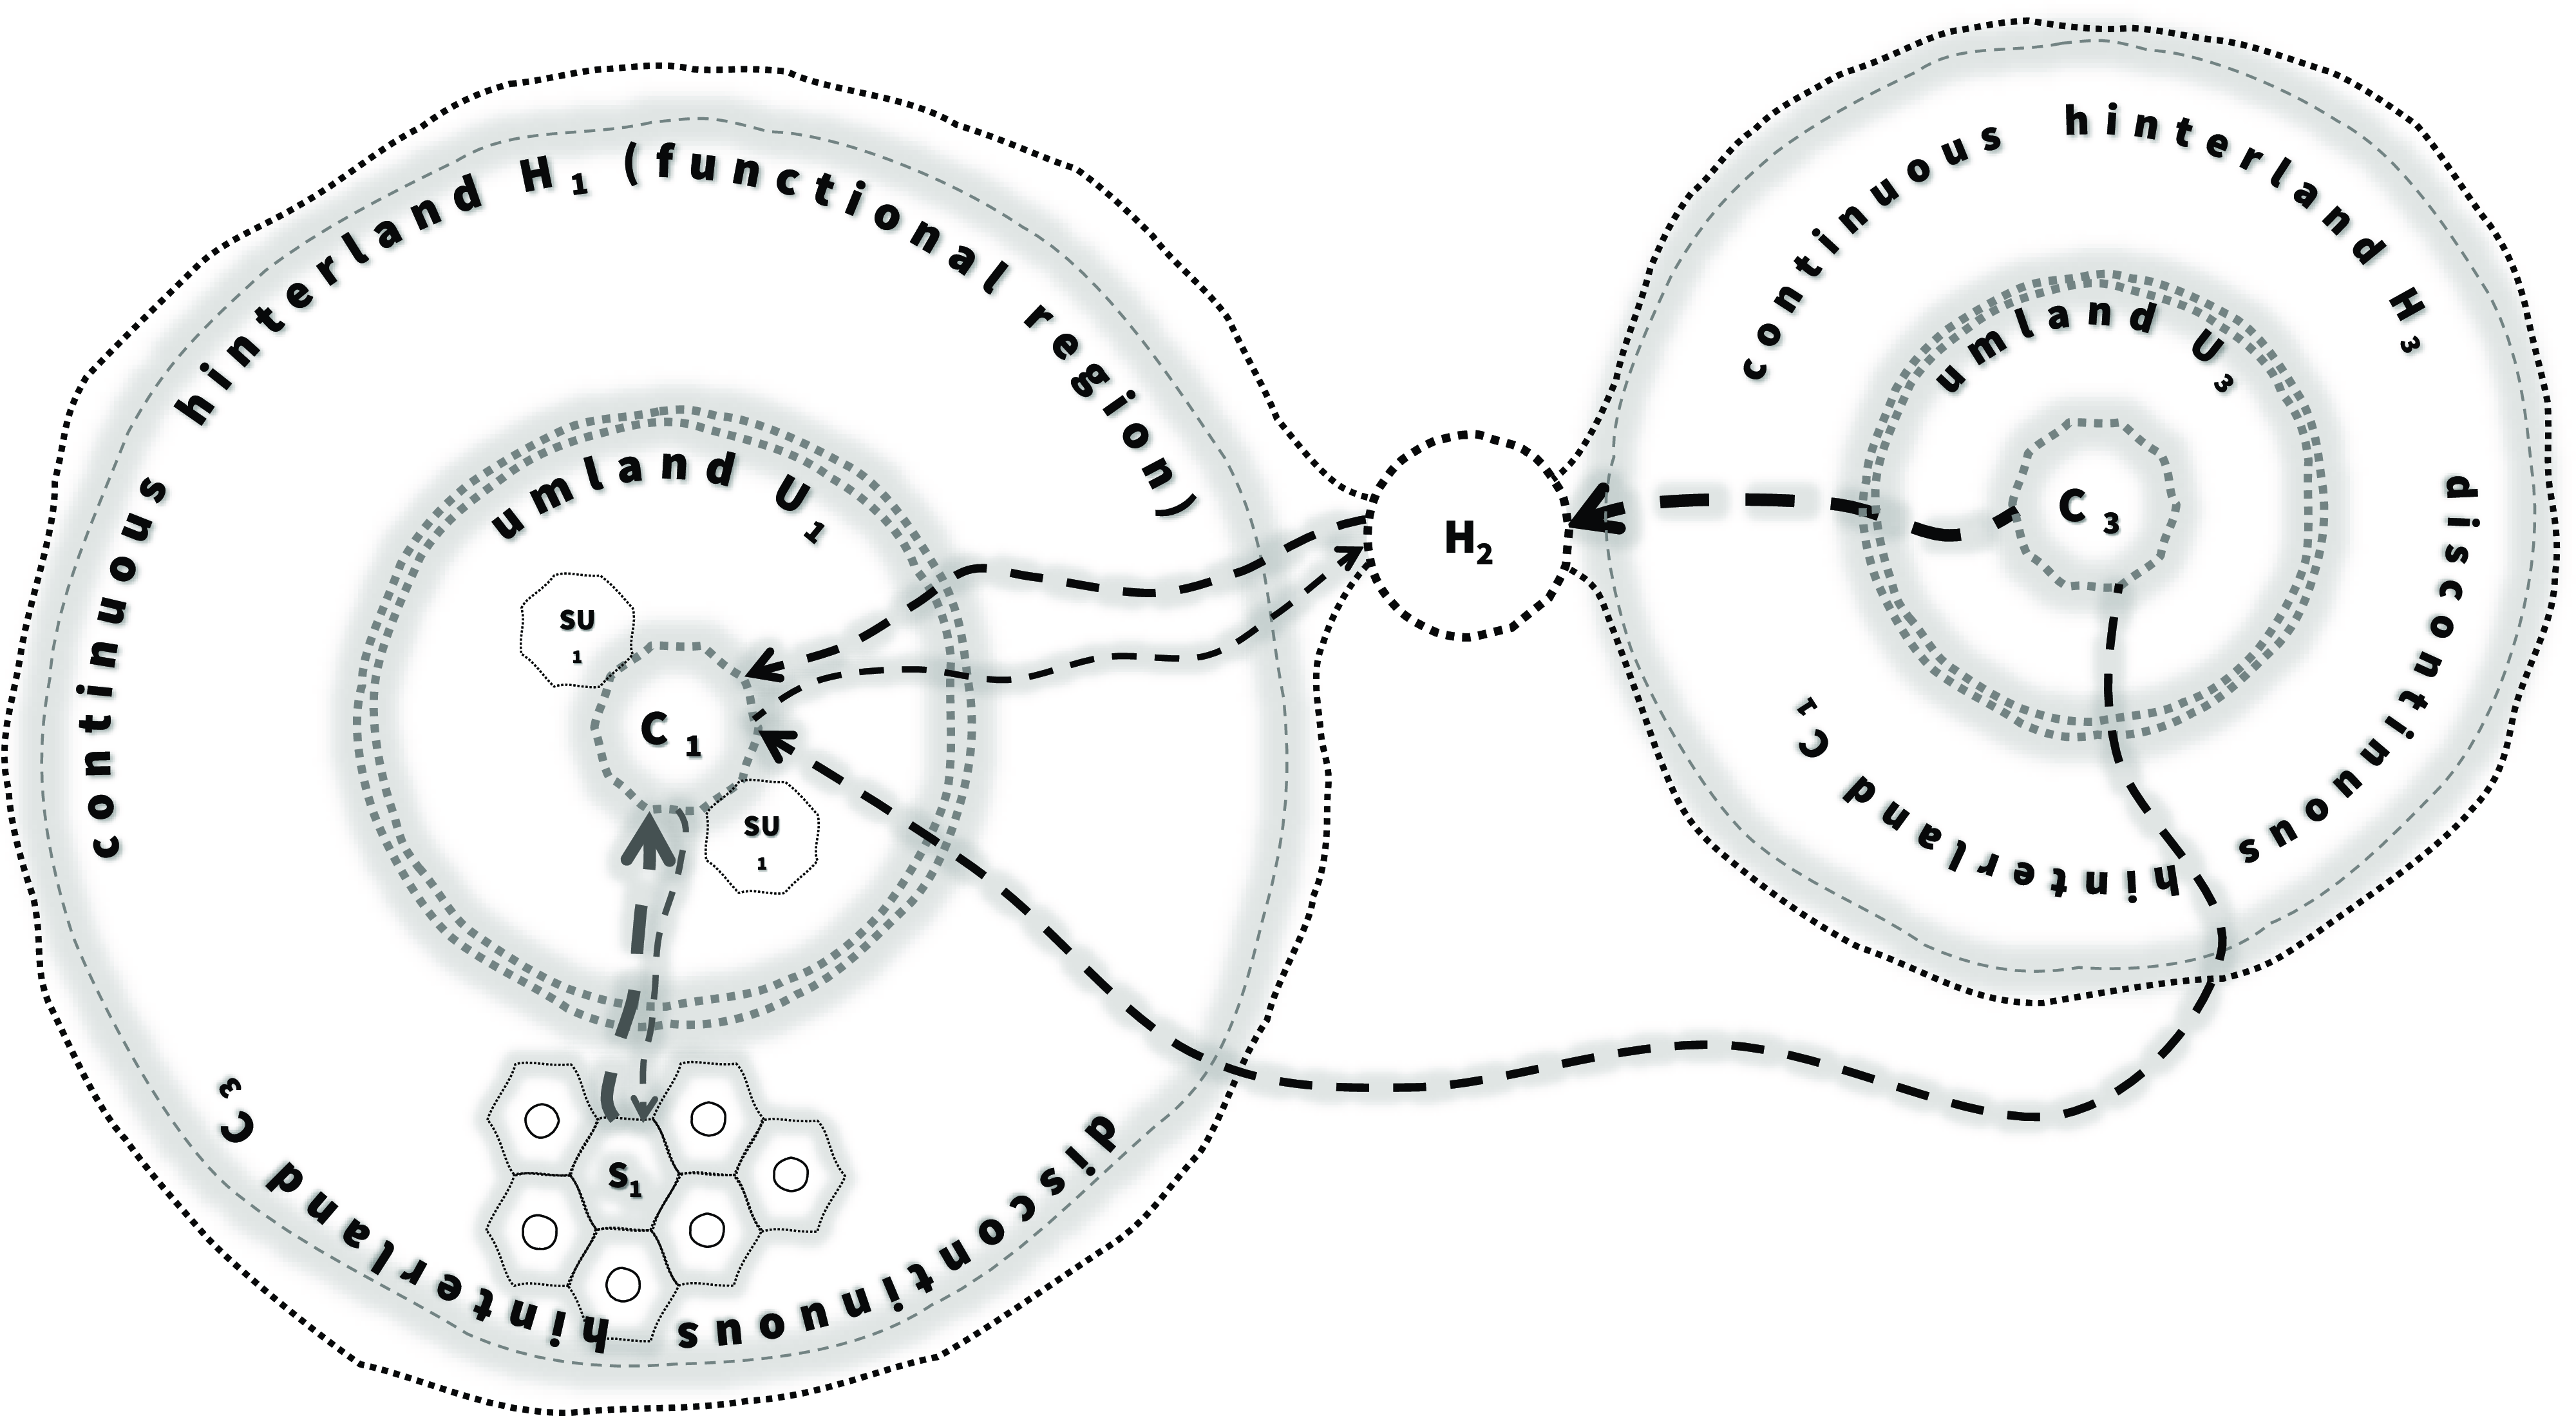
Visualization of the model of hinterland, continuous hinterland, and discontinuous hinterland: If a center (C1) with its continuous hinterland (H1) obtains goods from another center (C3) with its continuous hinterland (H3), then H3 becomes C1’s discontinuous hinterland. Conversely, if C3 procures goods from C1, then H1 becomes C3’s discontinuous hinterland. (Sketch by D. Hagmann Reference Hagmann2023; based on van Cleef 1941, 311 fig. 1.)

Following the annexation of Noricum by the Roman Empire around 16/15 BCE, the AOI was more likely subjected to nominal Roman claims to power than to effective governance. The transformation into a province during this “formative period” of early (Northern) Noricum is as unclear as it was during the Late Iron Age. Although there is uncertainty around political developments, organized Roman habitation in the “Northern Noric wasteland” possibly commenced in the latter half of the 1st c. CE. This is primarily suggested for the AOI by the occupation of camps like Arelape, Favianis, and Augustianis by Roman troops; for example, for Arelape, a military presence can be dated to between 70 and 90 CE. Footnote 19 Castella like Favianis likely served as attractors for groups of camp followers, lured by the opportunities associated with proximity to military installations – these can be categorized as “pull factors.” From 70 to 100 CE (approximately the Flavian era), these groups possibly migrated interregionally from the northwestern provinces or southwestern Pannonia but also came intra-regionally from southeastern Noricum to the AOI, settling next to the forts in adjacent military vici as “camptowns” (“Lagervici”), effectively contributing to a form of colonization within the AOI. The extent to which these migrants encountered autochthonous people in the AOI, and whether this influx was systematically orchestrated by the military or occurred through independent actions, remains an open question. However, a parallel structural development can be observed, for example, regarding the Batavi in the Dutch Rhine delta. Footnote 20 Notably, settlement development in the AOI was not uniform, as evidenced by the eastern vicus of Favianis: around 100 CE, this settlement experienced a brief but significant collapse, manifesting in particular in the deterioration and subsequent demolition of a large portion of its structures, which then remained unused for a time.Footnote 21 Importantly, settlement extended beyond military vici. Indirect evidence for rural habitation may come, for example, from 1st-c. CE rock tombs and funerary inscriptions at Koth (ID89), mentioning various “Celtic” names like “Cemeia.” Such finds suggest an adoption of a “Roman way of life” by possibly indigenous but also immigrant groups. Furthermore, the longstanding military presence influenced the establishment of “integrated Roman rural complexes,” likely leading veterans to populate areas near their former camps. These communities probably engaged in subsistence farming and supplied essential resources like wood and hay to central hubs.Footnote 22
Middle Imperial period (117 CE to 284 CE – Figure 9)
The post-Flavian era was a prosperous time for the region, facilitating rural intensification and boosting sectors from agriculture and livestock to mining and local art. Current research suggests Arelape expanded in the first half of the 2nd c. CE, and Cetium experienced significant growth around the same period, culminating in its eventual city rights. Originally constructed from wood, the town suffered extensive fire damage, likely during the Marcomannic Wars around 170 CE, and was subsequently rebuilt using stone. The settlement probably reached its zenith during the Severan era. However, Cetium faced further devastation during the chaotic 3rd c. CE. Consequently, parts of the city seemingly remained uninhabited for an extended period.Footnote 23
The phase of growth may have continued up to the disruptions caused by the Marcomannic Wars (the first from 166/170 to 177 CE; the second, from 177 to 180 CE). The relocation of the legio II Italica to Albing in Lower Austria, and subsequently to Lauriacum/Enns in Upper Austria, both located in northwestern Noricum, alongside limes enhancements in the late 2nd and early 3rd c. CE, likely spurred settlement growth in the region. The strong military presence seems to have had a favorable impact on the hinterland, possibly invigorating ongoing activities within an already established system. In Favianis, the presence of goods and/or settlers from southeastern Noricum, southeastern Pannonia, and western Moesia suggests the establishment of a supra-regional sphere of influence, extending to the Balkans. Such influence could have been a result of goods importation, interregional migration, or both. Regardless, the AOI appears to have experienced sporadic, small-scale immigration from adjacent provinces, reflecting relatively high population mobility. The 2nd and 3rd c. CE also witnessed considerable interregional migration towards limes forts in Germania Superior and Raetia, propelled by significant infrastructure investments and the army’s enduring purchasing power, and culminating in the emergence of new economic hubs. This status quo likely persisted until rising threats increasingly compromised rural life. The “integrated Roman rural complexes” always contributed considerably to strengthening the Roman Empire’s frontier in a mutual interaction. Such persistent Roman structures in the AOI thereby underscore the inhabitants’ resilience, though apparently more in the sense of “languishing” than “perseverance” in Northern Noricum.Footnote 24
Internal security took on increasing importance in emerging Roman rural landscapes, particularly after the Marcomannic Wars disrupted stability in Northern Noricum. During the reign of Marcus Aurelius, the military’s substantial needs underscored the vital role of resilient “integrated Roman rural complexes” in the border zone’s hinterland, in terms of facilitating all forms of supplies. The establishment of Cetium suggests the presence of a pre-existing rural supply network in the area, engaged in the trade of agricultural and forestry products. In Roman Antiquity, this network likely went beyond mere subsistence farming to meet broader supply chain requirements, and the “integrated Roman rural complexes” as its nodes functioned as micro-level centers, disseminating commodities, innovations, and information to their local communities. Furthermore, centers like Cetium held cultural, religious, and socio-political significance, potentially encouraging settlement growth in the hinterland. These dynamics resulted in not just a “villa landscape” but a multifaceted “productionscape” of “integrated Roman rural complexes,” enriching the area’s economic and social fabric. Comparable patterns are evident around Ovilava, Cetium’s northwestern counterpart in modern-day Wels, Upper Austria. In the hinterland of Carnuntum, too, villae predominantly appeared in the 2nd c. CE.Footnote 25
In defining such a “productionscape,” the northern periphery of the Noric limes in the AOI can be viewed as a “conglomerate” of different “umlands” and “hinterlands,” all serving as catchment areas for their corresponding centers. However, while central places and hinterlands are intrinsically linked and CPT is regularly discussed in archaeological research, precise definitions, particularly of “hinterlands,” within this context are seldom provided – it seems that the term’s meaning is often assumed to be self-evident (Fig. 4).Footnote 26
Consequently, formalized theories on “center,” “(discontinuous) hinterland,” and “umland” are vital for this study: on the one hand, CPT is particularly relevant for offering a framework for economic geography and site-specific questions; on the other hand, the hinterland is generally considered a spatially extensive area peripheral to a center, to which it is subordinate. These three entities – “center,” “umland,” and “hinterland” – usually represent integrated spatial entities.Footnote 27
In economic geography, these entities function as interactive and interdependent economic areas. To conceptually explain the workings of a “hinterland,” one can refer to it as a “functional region,” following the framework set by Mehzahbeen et al.Footnote 28 This concept is well suited for the qualitative definition of an economic-geographical (sub-)region and has an extensive history in research:Footnote 29 a functional region is a geographically bounded system characterized by specific functions and unique attributes – within functional regions, activities, akin to vectors, manifest as interactions between a core (or center) and its periphery (or hinterland).
While functional regions in the AOI inherently involve center-hinterland interactions, they can also engage with other functional regions. The concept of a “discontinuous hinterland,” influenced by Eugene van Cleef’s theory, describes goods procurement from distant regions through hubs like ports, explaining the interaction between such functional regions. Hinterlands are therefore categorized as “continuous” or “discontinuous,” with the “umland” serving as a transitional zone. Multiple independent centers with their own hinterlands can exist, and these hinterlands may contain subsidiary centers or “satellites” (Fig. 10).
However, it is essential to recognize that, depending on the nature of goods and demand, various conditions might come into play. As a result, one should anticipate the presence of multidimensional and dynamically overlapping continuous and discontinuous hinterlands as distinct functional regions; for instance, there could be notable differences when considering supply and demand from forestry versus agriculture.Footnote 30
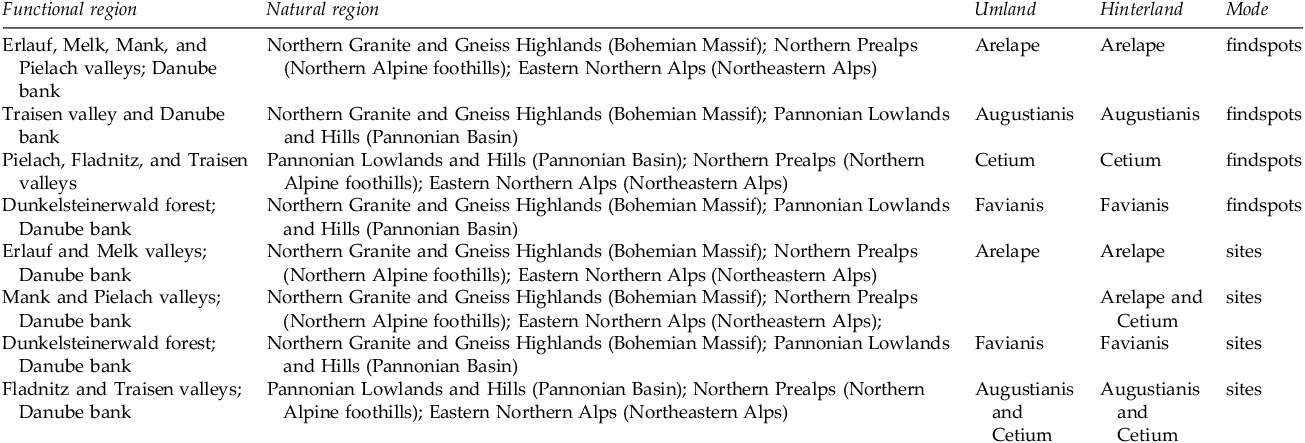
In the AOI, distinct functional regions can be spatially defined as umlands and hinterlands. However, GIS-based analysis using k-means clustering showed that sites tend to align more closely with the overall environment than with findspots, underscoring the importance of the chosen mode of analysis. Different conceptually valid outcomes emerge when considering, for determining the functional regions, sites as centroids of spatially defined feature clusters versus a higher number of non-clustered findspots representing the actual spatial locations of all features within a parcel. It is not possible to determine which mode should be preferred, as it is sensible to analyze both the distribution of overarching sites as more abstract and idealized settlement locations and the actual, largely unaltered spatial distribution of features. Nonetheless, results from both modes of analysis generally correspond to the four ecoregions or geographical regions of Central Europe. Consequently, the AOI can be subdivided into four functional regions from west to east, each associated with one or two of the four centers. The delineation of each hinterland and umland is not clear-cut and they partially overlap, depending on whether the analysis is based on findspots or sites (Table 3, Figs. 4–5, 9).
The conclusions drawn from this multimodal result are multifaceted. Cetium served as a socio-economic hub, node, or port, acting as a supra-regional center where goods were distributed to local buyers or military camps, which functioned as regional trading centers. The hinterlands of these central places not only supplied their respective hubs but also operated as discontinuous hinterlands for other centers, facilitating a complex exchange of supply and demand. Consumer demand, initially triggered by military needs in the 1st c. and later influenced by civilian demands, drove the system of farmsteads, hamlets, villae, vici, castella, and Cetium, both within the AOI and beyond provincial boundaries. Grain supplies via the river Danube, sourced from Germania for troops in Pannonia during the Marcomannic Wars, are indicated by epigraphic evidence about M. Valerius Maximianus. Additionally, the Vita Sancti Severini, particularly its account of Favianis, provides insights into the port functions of strategically located sites along the Danube in Late Antiquity. Even in the chaotic later 5th c. CE, supply mechanisms appear to have been centrally coordinated, although it remains speculative whether they were managed locally in Favianis or by a broader authority, with goods potentially originating from distant regions like Raetia.
Igitur non multo post rates plurimae de partibus Raetiarum mercibus onustae quam plurimis insperate videntur in litore Danuvii, quae multis diebus crassa Eni fluminis glacie fuerant colligatae: quae dei imperio mox solutae ciborum copias fame laborantibus detulerunt.
Not long after, one could see on the shore of the Danube many boats from Raetia, full of goods, which had been held up for many days by the heavy ice of the river Inn. Now […] the ice had broken and the boats brought lots of food to the people who were suffering from famine (Eugippius, Vita Sancti Severini 3.3, ed. Sauppe Reference Sauppe1877, 8; transl. Bieler and Krestan Reference Bieler and Krestan1965, 59–60).
Notably, the Notitia Dignitatum from Late Antiquity mentions a Danube flotilla, the classis Arelapensis et Maginensis, which may have provided security for these deliveries, though this is speculative for the 1st to 3rd c. CE.Footnote 31
These inquiries raise the question of whether hinterland supply to centers like Arelape was solely organized by nearby settlements in the Erlauf and Melk valleys, complicating the AOI’s economic model beyond simple direct supply theories. For large villae, there is a suggested correlation between production and revenue, indicating that sales often covered operating costs. However, the applicability of this model to smaller villae and farmsteads is uncertain, with unclear levels of systematic overproduction versus subsistence farming. Even with adequate land, it is debatable whether overproduction was maximized in the AOI, with motives potentially including financial gain, mandatory army contributions, or other factors. Recent studies indicate that supply from discontinuous hinterlands was common across the Roman Empire, challenging the idea that only continuous hinterlands supplied goods. Typically, goods were transported to the nearest centers before reaching broader markets, with civilian suppliers playing a key role in peacetime supply chains. These civilians not only thrived but were also integrated into local communities, blurring the lines between civilian and military identities and between global and local concepts. The concept of glocalization – adapting global products, services, or practices to local contexts – explains these economic dynamics within the Roman-period border region’s settlement structure. Neville Morley’s “dendritic system of central places” elucidates the intra- and interregional market networks mirrored in the functional regions that underpin this glocalization.Footnote 32 This framework sheds light on a complex market system linking various locales through regionalization. Initially, regionalization may have started from centralization within a nested, dendritic network of consumers and suppliers, embodying a “Roman way of life” in Northern Noricum.Footnote 33
Tabular representation of temporal settlement development based on selected features in the AOI. For the respective diagram, refer to fig. 6. (Data: BDA.)

Tabular representation of Lt D objects (funerary and industrial features, settlements, and single finds) in the AOI. For the respective visualization, refer to fig. 8. (Data: BDA.)

Tabular illustration of the functional regions within the AOI, defined as umlands and hinterlands, based on natural regions and GIS-based k-means clustering. The analysis, which considers both sites and findspots, highlights different modes of discovery. The regions correspond to the four ecoregions of Central Europe, subdividing the AOI into functional regions from west to east. Each region is linked to one or two centers, with overlapping boundaries of hinterlands and umlands, depending on whether the analysis is based on findspots or sites. For the respective visualization, refer to fig. 4. (Data: BDA.)

However, from the late 2nd c. CE onwards, the Roman Empire faced multifaceted challenges that altered its course. Various political conflicts destabilized the Empire, a situation worsened by pandemics like the Antonine Plague and other factors.Footnote 34 This pivotal period witnessed the decline of a once-functional system due to internal power struggles and external pressures affecting the entire Roman domain. Rather than showing a linear development, this era exhibited fluctuations with an overall negative trend. The late 2nd and early 3rd c. CE saw a revival after the Marcomannic Wars, but the 3rd c. faced renewed crises. Frequent leadership changes, including barracks emperors, resulted in unstable and overlapping regimes. These rulers were often overthrown shortly after ascending to power through brute force. To maintain troop loyalty amid this instability, leaders increased pay and distributed essential supplies, which strained the Empire’s resources through forced extraction from citizens. Notably, both the fort of Arelape and the vicus of Favianis show destruction layers from the 3rd c. CE.Footnote 35
Late Antiquity (284 CE to 488 CE – Figure 9)
Late Antiquity was characterized by significant transformations, many initiated by the Marcomannic Wars. From the late 3rd c., signs of decline became apparent, despite intermittent recoveries, indicating limitations in utilizing existing expertise. Terms such as “recovery” and “upswing” denote temporary improvements, but these did not restore the vitality of the 2nd c. CE.Footnote 36
Increased and targeted investments during the 3rd and 4th c. CE in military infrastructure led to enhanced militarization of the border, positively impacting the “integrated Roman rural complexes” as well. However, despite such upswings, the diversity of “integrated Roman rural complexes” tended to decline in the long run. The northwestern Noric hinterlands also experienced significant settlement decline from the 3rd c. CE. The traditional narrative suggests that structural changes, such as troop reductions and the construction of heavily fortified reduction forts (“Lagerburgi”), led to the repurposing of now-ruined former castella for non-military uses within the fortification walls (including intra-mural burials), resulting in the abandonment of the associated vici. Ongoing crises acted as “push factors,” driving rural populations into military centers, which offered security as a “pull factor,” further transforming them into fortified “townships” or “oppida.” Excavations at sites such as Arelape, Favianis, and Augustianis have provided insights into such central places from the 5th c. CE. In Augustianis, discoveries provide evidence of continued settlement in the vicus but also simple structures built within the remains of the former principia, suggesting ongoing habitation. Recent excavations at Favianis indicate that settlement activity in the “camptown” persisted until the 5th c. CE. This challenges traditional scholarly views that focused on intra-camp areas as central activity hubs and presumed a decline in settlement size, with the abandonment of the vicus and civilian relocation into the fortified camp along with a reduction of the military. Instead, the evidence suggests vibrant life both inside and outside the camp walls, with the “camptown” maintaining notable structures. The evolving framework suggests that the settlements were an integrated mix of decaying former civilian and military structures and transformed spaces. The term “oppidum” would thus apply not only to the settlement within the old camp walls but also to areas of activity outside these walls, indicating a polycentric “urbanscape.”Footnote 37
In the countryside, most middle-class villae, like the site at Gries (ID104) or the recently excavated pars rustica of a villa at Breiteneich, were active from the mid-2nd to the later 4th c. CE, then their density decreased significantly, especially in the umland and hinterland of Cetium, which persisted until the late 5th c. CE. Settlement decline was likely due to structural abandonment and property forfeiture, causing the disintegration of these complexes. Land ownership possibly consolidated into large latifundia, resulting in Late Antique “super-villae” and subordinated settlements like vici occupying favored areas and adjacent cemeteries post-“3rd-c. crisis”; notably, the Vita Sancti Severini highlights extensive agricultural depots owned by high-ranking individuals during the 5th c. CE. The cemeteries at Unterradlberg and Pottenbrunn (ID5) in the Traisen valley, and the 5th-c. hamlet at Trasdorf (slightly outside the AOI next to ID123), further reflect this trend. These “super-villae” and their associated settlements may have transformed into “pseudo-oppida” in the 5th c. CE, serving as supplementary centers of economic and social activity, as exemplified by the villa in Bruckneudorf near Carnuntum. Foederati settlements possibly succeeded or complemented these, with sites like Unterradlberg, integral to regional supply chains since the 1st c. CE, indicating continuous settlement by autochthonous groups – a topic needing further research.Footnote 38
Nevertheless, the precise timing of the full transformation from former camps to oppida is uncertain, as the possibly gradual decline of the hinterland remains elusive, falling within a 250-year window between the reign of Maximinus Thrax and the province’s “abandonment” in 488 CE. By at least the 5th c. CE, the oppida in Northern Noricum were probably subject to tribute payments to external Germanic groups or (former) foederati. Such groups included the Germanic Rugians, who likely settled in a short-lived regnum in transdanubian “Rugiland” in the northern Tulln basin. They may have served as an ambivalent “protective power” in the AOI, filling the power vacuum created by the collapse of the Western Roman Empire after 476 CE; however, this also led to the abduction of populations across the Danube and ransom demands, as well as the establishment of markets under the Rugian king’s patronage. It is also possible that the oppida were entirely occupied by these groups, as in the case of Comagenis/Tulln an der Donau, located approximately 23 km east of Augustianis and outside the AOI. Due to rural exodus and the weakened bargaining power of migrants in emerging oppida, a dependency on local elites probably arose. The internal organizational structure of these oppida – whether involving the segregation or the integration of civilians and soldiers – remains ambiguous.Footnote 39
The digital analysis of archaeological data suggests that the decline of the Roman Empire requires reevaluation as a complex, multi-faceted “permacrisis” or “polycrisis,” involving external pressures, climate changes, civil wars, and pandemics. It is crucial to differentiate between “transformative-disintegrative” development driven by crises and the outdated narrative of a “decadent” Late Antiquity marked by “excessive barbarization” and “effeminacy.” The view that the Roman system deteriorated after the 3rd-c. crisis, with the integration of “barbarian” foederati leading to an assumed decline in military discipline and “classical” martial arts, seems outdated. The integration of Germanic peoples as foederati was a longstanding practice, dating back to Augustus’s Germani corporis custodes. It allowed for the deployment of specialists in areas where the regular army could not or would not operate, conceptually similar to modern private military and security companies (PMCs/PSCs). Since the 2nd c. CE, the Roman army had undergone adaptive transformations, with significant updates to military frameworks and equipment. Gallienus initiated reforms by enhancing the cavalry and elevating knights to high-ranking officers, often sidelining senators. Diocletian expanded these reforms by increasing the number of provinces and legions, though with smaller troop sizes, establishing a new strategic alignment, evidenced by the re-stationing of legio I Noricorum at Favianis. Further significant transformations in Late Antiquity included the division of Noricum into Noricum mediterraneum and Noricum ripense. The military organization was divided into limitanei, often dismissed as a “peasant militia” more engaged in agriculture than warfare, and comitatenses, a mobile army reliant on cavalry established by Constantine. The last significant fortification of the Noric Danube border occurred in the late 4th c. CE under Valentinian I. Despite challenges such as unbalanced and eventually halted salary payments, the military presence in the AOI persisted until the end of Roman rule (Fig. 9).Footnote 40
The transition into the so-called Dark Ages, particularly the “abandonment” of Noricum ripense in 488 CE, ostensibly on the orders of the Germanic king of Italy, Odoacer, and executed by his brother Onoulf, marks a critical endpoint to “original” Roman settlement in the AOI, over a decade after the Western Roman Empire’s fall in 476 CE. Yet, the completeness of this evacuation and the fate of those who remained are uncertain. These “last Noricans” or “Post-Romans,” referred to in German scholarship as “Romanen,” might have stayed due to frailty, personal connections, or local political ties. The decision to abandon the region likely stemmed from a mix of strategic, geopolitical, economic, and environmental considerations, along with potential social and cultural tensions. While the evacuation might have conserved economic resources and reduced risks to the population, it is plausible that it primarily involved the leadership and various assets, suggesting that only key individuals and resources were relocated. This resulted in significant territorial losses, as well as potential social, psychological, and political impacts both within and beyond the region.
Post-Antiquity (post-488 CE)
A (rare) continuity of settlements in “townships” and selected rural areas is evidenced, but significant decline is recorded for centers like Arelape, too. Studies of cemeteries at sites such as Ovilava in former northwestern Noricum, however, indicate a sustained occupation from the late 5th to the 6th/7th c. CE, with evidence of cohabitation between Post-Romans and migrant Germanic groups like Baiuvarians. A similar situation may be assumed for the AOI.Footnote 41
Conclusion
The comprehensive digital analysis of the “integrated Roman rural complexes” along the northern Noric limes has revealed a dynamic mix of Roman rural landscapes marked by growth and decline. GIS-based visualizations have enabled in-depth interpretations, enhancing our understanding of the northern Noric limes’ historical development. This highlights the importance of holistic digital data analysis in archaeological research. Instead of viewing the Noric “limes hinterland” from a military-centric perspective, it is beneficial to focus on military installations as part of the Roman rural hinterland of cities like Cetium and vice versa. This approach considers a fluid continuum of diverse umlands and (dis-)continuous hinterlands of several central places, shaped by various functional regions and socio-economic push and pull factors.
From the late 1st c. CE, settlements expanded, peaking around 200 CE, forming functional regions around distinct regional centers. These functional regions are identifiable through spatially recognizable settlement clusters aligned with the surrounding natural environment. Settlement growth continued into the early 3rd c. CE, before a multifactorial decline eventually shifted the focus from the hinterland to military-civil “oppida” in Late Antiquity.
The data analyzed indicate that “integrated Roman rural complexes” declined even before the region’s overall downfall due to internal dynamics and external pressures. During the barracks emperors’ era, the Empire reached a tipping point: 23 emperors and usurpers ruled from 400 to 476 AD, followed by only two Germanic kings, Odoacer and Theoderic. This period was characterized by chronic dysfunction and relentless power struggles, leading to political paralysis exacerbated by barbarian invasions, territorial losses, civil wars, assassinations, and pandemics. This crisis, starting with the Marcomannic Wars, culminated in the fall of the Western Empire, contrary to Edward Gibbon’s Decline and Fall, which attributes the decline to decadence, Christianity, or a departure from classical values.Footnote 42
The Late Roman Empire, though advanced in military and administrative technologies, gradually disintegrated as Germanic territories rose. This strained finances and reduced central control, leading to increased provincial autonomy. The Empire’s vast size, both a strength and a vulnerability, meant disturbances could trigger a cascading collapse, challenging the notion that Rome was “too big to fail.”Footnote 43
Although continually under discussion and marked by significant regional variations, recent climate reconstruction attempts show that the Roman Climatic Optimum (RCO) provided climatic stability in the 1st and 2nd c. CE. However, increased climate volatility from the 3rd c. CE onward, aligned with crises including lower water levels (as recorded in the AOI at Augustianis) and severe winters noted in the Vita Sancti Severini, indicate climate instability before the Late Antique Little Ice Age (LALIA) in the 6th and 7th c. CE. The Antonine Plague (ca. 165–185 CE) caused widespread death, disrupting society and increasing tensions, as did the Cyprianic Plague (ca. 249–270 CE). Such processes further heightened internal fragilities, eventually leading to the end of western Roman authority.Footnote 44
The observed “system of ups and downs” offers parallels to contemporary challenges involving interconnected crises in society, health, and climate. Studying settlement in Northern Noricum provides valuable insights into the resilience and vulnerabilities of complex societies, emphasizing the importance of integrated and adaptive approaches to managing interconnected challenges. Modern-day analogs, from the late 1980s to the early 2020s, offer valuable comparative insights, illustrating that there is, at least for now, no Francis-Fukuyama-like “end of history.” Events such as the dissolution of the Soviet Union, the COVID-19 pandemic, the failed usurpation by Y. Prigozhin’s PMC Wagner Group, the ongoing war in Ukraine, and challenges related to climate change could induce system-critical vulnerabilities for various reasons. These vulnerabilities echo historical disruptions for the AOI, such as Regalianus’s revolt in 260/261 CE. Additionally, external pressures from the migration of Hunnic and Germanic groups significantly impacted society. Adverse climatic conditions and administrative neglect were further crucial factors in the region’s downfall. Understanding the AOI’s “rise and fall” may therefore provide valuable lessons for navigating today’s multi-crisis scenario.Footnote 45
Supplementary Materials
The Supplementary Materials provide a comprehensive dataset and methodological framework supporting the study of Roman rural landscapes in Northern Noricum, including a detailed classification of archaeological features, GIS-based spatial analyses, and an assessment of settlement development patterns. Additionally, the materials incorporate supplemental references to key historical research, thematic cartographic visualizations, statistical analyses, and an extended bibliography. To view the Supplementary Materials for this article, please visit https://doi.org/10.1017/S1047759425000066.
Acknowledgments
The author extends his gratitude to Clifford Ando, Michael Doneus, Martina Hinterwallner, Nisa Iduna Kirchengast, Catherine Kearns, Michaela Konrad, Martin Krenn, Alarich Langendorf, Volker Lindinger, Franz Pieler, Doris Schön, Günther Schörner, Andreas Steininger, Martin Ziegert, and Johannes Wurth for their invaluable contributions to this research.
Competing interests
The author declares that he has no competing interests.
Funding
Open access funding provided by University of Vienna. The research was conducted as a fully funded PhD thesis at the University of Vienna’s Doctoral School of Historical and Cultural Studies.


 Open access