The rapid increase in glycaemic and insulin response is associated with the ingestion of carbohydrates that are quickly digested and absorbed, such as soluble sugars and available starch, known for their high glycaemic index(1). In recent years, there has been growing concern regarding the consumption of fruit juices because of their high levels of naturally occurring sugar and low fibre content, which can rapidly elevate glycaemic responses and increase the risk of cardiometabolic diseases. However, the issue remains controversial, with no conclusive evidence from systematic reviews and meta-analyses that fruit juice consumption adversely affects cardiometabolic risk factors(Reference Li, Jin and Ji2–Reference Auerbach, Dibey and Vallila-Buchman4).
Orange juice (OJ) is commonly consumed in many countries and is particularly noted in Brazil for its contributions to higher intakes of vitamin C, minerals and bioactive compounds, aiding in achieving nutrient recommendations(Reference Carnauba, Sarti and Hassimotto5). Additionally, OJ is the primary source of flavanones, a class of polyphenols, not only in Brazil(Reference Carnauba, Sarti and Hassimotto6) but also in the Mediterranean(Reference Godos, Marventano and Mistretta7) and USA populations(Reference Huang, Braffett and Simmens8). Several studies have shown the health benefits of OJ consumption, such as improved cardiovascular and insulin resistance biomarkers, including reductions in blood pressure(Reference Fraga, Coutinho and Rozenbaum9,Reference Pla-Pagà, Valls and Pedret10) , fasting glucose, insulin levels and homeostatic model assessment for insulin resistance and HDL-cholesterol values(Reference de Santana, Tobaruela and dos Santos11–Reference Lima, Cecatti and Fidélix15).
These effects are primarily attributed to the high antioxidant capacity of citrus flavanones, which protect against oxidative stress(Reference Anacleto, Milenkovic and Kroon16,Reference Fraga, Milenkovic and Anacleto17) , exhibit anti-inflammatory effects by regulating the expression of micro-RNA and genes involved in inflammatory processes(Reference Capetini, Quintanilha and de Oliveira18,Reference Quintanilha, Chaves and Brasili19) and modulate lipid metabolism(Reference Santos, Yoshinaga and Glezer20). Moreover, studies have shown that OJ consumption does not alter postprandial glucose and insulin areas under the curve when co-ingested with a standard sandwich by overweight and obese individuals(Reference Li, Janle and Campbell21). It also does not affect glycaemic response following a high-energy meal in overweight individuals(Reference Chaves, Carvalho and Brasili22) and does not significantly differ from a placebo containing the same amount of sugar, vitamin C and citric acid(Reference Kerimi, Gauer and Crabbe23).
Over recent decades, numerous studies have shown that foods rich in polyphenols effectively inhibit salivary and pancreatic α-amylase and α-glycosidase, thereby reducing postprandial glycaemia(Reference Ćorković, Gašo-Sokač and Pichler24,Reference Coe and Ryan25) . α-Amylase breaks down α-(1,4)-D-glucose linkages in starch into oligosaccharides, which are then hydrolysed by β-glucosidase to release glucose for absorption. Citrus flavanones, like naringin, may inhibit this carbohydrate enzyme and influence starch digestion. In vitro studies have shown that naringin exhibits the most inhibitory activity against α-amylase, demonstrating competitive inhibition. Additionally, in silico studies have identified naringin and hesperidin as promising ligands to α-amylase and α-glucosidase(Reference Carmona, Alquézar and Marques26,Reference Brouns, Bjorck and Frayn27) .
The glycaemic response is influenced by the type and amount of carbohydrates in foods or meals, as well as by the presence and quantity of other nutrients, including proteins and fats, which are found in high concentrations in foods such as cheese and butter, commonly paired with bread. Therefore, this study aimed to assess the glycaemic response to OJ prepared from ‘Moro’ and ‘Pera’ orange varieties – the former containing anthocyanins rather than flavanones. Additionally, it evaluated the glycaemic and insulin responses to OJ co-consumed with various food components, including bread and bread with added cheese or butter – a typical breakfast meal in Brazil.
Material and methods
Food
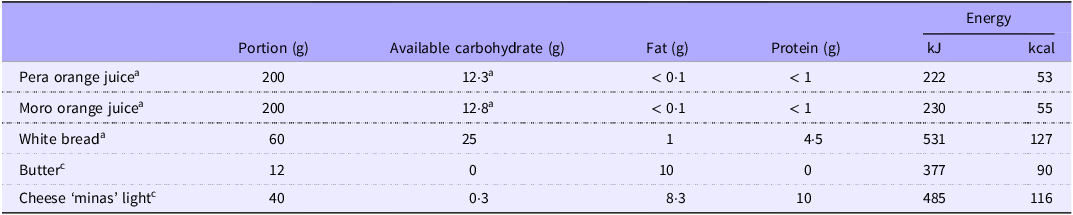
Pasteurised OJ obtained from C. sinensis (L.) Osbeck cv. Pera (POJ) and cv. Moro (MOJ) were supplied by Fundecitrus (Araraquara, Brazil). Anthocyanin production in Moro orange fruits was induced by cold storage at 9 °C for 3 weeks, as described in Carmona et al.(Reference Carmona, Alquézar and Marques26). After pasteurisation, the juices were immediately stored at –20 °C. The chemical characterisation of POJ and MOJ was previously published(Reference de Santana, Tobaruela and dos Santos11). Briefly, POJ contains 3·10 (se 0·25) g sucrose /100 ml, 1·56 (se 0·10) g fructose/100 ml, 1·50 (se 0·08) g glucose/100 ml and 0·29 % fibre. MOJ contains 2·80 (se 0·25) g sucrose/100 ml, 1·90 (se 0·15) g fructose/100 ml, 1·69 (se 0·18) g glucose/100 ml and 0·34 % fibre(Reference de Santana, Tobaruela and dos Santos11). White bread, light cheese and butter were purchased locally, and the composition of available carbohydrates, lipids and proteins is presented in Table 1.
Chemical composition of foods based on consumed portions

Sources: aBrazilian Food Composition Table (fcf.usp.br/TBCA); bde Santana AA et al. (2022)(Reference de Santana, Tobaruela and dos Santos11); clabel data.
t test was performed to compare the sugar content of two orange juices. Same letter indicates no significant differences (P < 0·05).
Study design
Volunteers
Healthy volunteers, both men and women aged 18–45 years, were recruited for this study. Exclusion criteria included kidney and gastrointestinal diseases, diabetes or insulin resistance, hyperthyroidism, being underweight or overweight/obese and a reported family history of diabetes. Female volunteers were excluded if they were pregnant, breastfeeding, in menopause or undergoing hormonal therapy. In addition, participants had not used antibiotics and medication affecting digestion and food absorption, including treatments for diarrhoea and constipation, for 3 months before and during the study period.
Firstly, volunteers were screened based on their glycaemic response to glucose (the standard reference) three times. After fasting for 8 h, they ingested a single dose of 25 g glucose in 200 ml of water. Fourteen volunteers with fasting blood glucose levels between 70 and 99 mg/100 ml and a maximum postprandial blood glucose of 140 mg/100 ml were included in the subsequent trials (Trials 1 and 2). These volunteers (10 women and 4 men) presented age 30 (se 7) years, weighing 67·43 (se 11·11) kg and standing 168·79 (se 7·43) cm tall participated in the trials (BMI = 23·53 (se 2·13) kg/m2) (Figure 1).
Flow chart of the studies, Trial 1 and Trial 2.

The number of volunteers was established according to a protocol by the FAO (FAO, 1998), later endorsed by Brouns et al. (2005) and by ISO (2010), which indicates that ten volunteers are sufficient to verify the glycaemic response of foods with considerable precision. However, we conducted two replicates of the control food and one replicate of the test meals, whereas the recommendation is three replicates for the standard (control) and two for the test meal. This represents a limitation of our study.
All volunteers signed an Informed Consent Form approved by the Research Ethics Committee of the School of Pharmaceutical Science of the University of Sao Paulo (protocol no. 2.814.784). The study was registered in the Brazilian Registry of Clinical Trials (ReBEC) under the identifier RBR-6pvj72b (https://ensaiosclinicos.gov.br/rg/RBR-6pvj72b). The trials were conducted by the Food Research Centre at the School of Pharmaceutical Sciences, University of São Paulo (FCF/USP).
Clinical trials
The participants were enrolled in two randomised crossover studies (Trials 1 and 2), where all volunteers consumed all designated meals for each trial. White bread, known for its high glycaemic response, was chosen as control food, whether eaten alone or as part of a sandwich or with OJ. Each portion of bread contained 25 grams of available carbohydrates and was consumed in each trial. Both studies aimed only to compare the intake of the usual portion of consumption in Brazil of the studied foods.
In general, the recommended portion is 50 g of available carbohydrate(Reference Brouns, Bjorck and Frayn27). However, for foods with low to moderate carbohydrate density, the available carbohydrate content of the test portion is reduced to 25 g to avoid an excessively large meal size. This adjustment was applied to the control food (white bread).
Trial 1 (n 14): after fasting for 8 h, all volunteers ingested white bread (25 g available carbohydrate) with 200 ml of MOJ or POJ or water (bread control) and also the same juices alone. A 7-day interval was done between each meal.
Trial 2 (n 10): after fasting for 8 h, volunteers ingested 200 ml of MOJ or POJ or water with white bread. In addition, they ingested MOJ or POJ with a sandwich made with white bread plus 40 g of light cheese (10 g protein) or 12 g of butter (10 g total lipid). A 7-day interval was done between each meal.
Capillary blood glucose levels (Trials 1 and 2) were measured at fasting (T0) and 15, 30, 45, 60, 90 and 120 min post-ingestion using an Accu-chek® Active digital glucometer (Roche Diabetes Care, Brazil). In addition, in Trial 2, 200 μl of capillary blood samples were collected at baseline (T0), T30, T60 and T120 in a tube containing EDTA for insulin plasma quantification. The blood samples were centrifuged at 2000 rpm at 25 °C for 15 min.
Glycaemic and insulin response
Plasma was analysed using a Human Insulin ELISA kit (Invitrogen, USA, catalogue no. KAQ1251). Absorbance was measured at 450 nm using a SynergyTM H4 microplate reader (Biotek, Vermont, USA). The AUC for glucose and insulin was calculated according to the trapezoid rule, excluding the area below the fasting line(Reference Brouns, Bjorck and Frayn27,28) .
Statistical analysis
The statistical analyses were performed using Minitab software (version 21.1). Repeated measures ANOVA followed by post hoc comparisons using Tukey’s test were performed to identify individual differences between meals, at different times and between AUC. A significance level of 5 % (P < 0·05) was applied to all statistical tests.
Results
Sugar and flavonoid contents in orange juices
The sugar content of both OJ was similar: 6·30 (se 0·59) g/100 ml and 6·15 (se 0·42) g/100 ml for MOJ and POJ, respectively. The total flavonoid content of POJ was 31·70 mg/100 ml, with hesperidin being the major flavanone (95·6 %), followed by narirutin (6·4 %). MOJ contained 35·13 mg/100 ml of total flavonoids, with hesperidin as the predominant phenolic (73·6 %), followed by didymin (24·8 %) and the anthocyanin cyanidin-3-glucoside (7·8 %) (Data previously published(Reference de Santana, Tobaruela and dos Santos11). Thus, the two OJ differ in flavonoid content, but have similar content of sugar (Table 1), as they are prepared from different orange varieties, cv. Pera and Moro. Based on portion sizes recommended by Brazilian legislation for bread and juices, the volunteers ingested a 200 ml serving of fruit juice and a 50 g serving of white bread, providing an average of 12 g of soluble sugars and 25 g of available carbohydrates, respectively.
Glycaemic response to orange juices (trial 1)
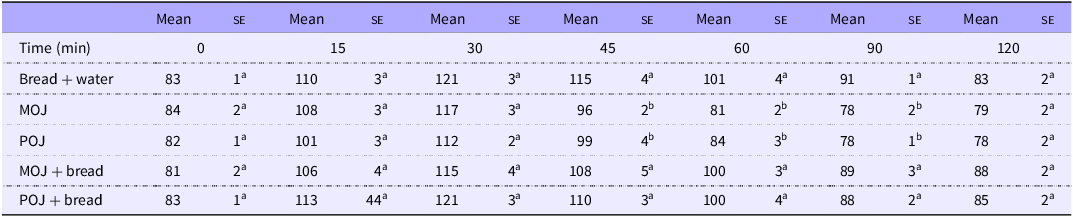
The glycaemic responses to ingestion of POJ and MOJ, with and without white bread, were assessed. The maximum concentration (C max) of blood glucose was reached at 30 min for the bread control and both juices (Table 2). Significant decreases in blood glucose were observed after ingestion of MOJ at T45, T60 and T90 (P < 0·001) compared with the bread control. For POJ, significant decreases were observed at observed T45, T60 and T90 (P < 0·01). No differences were observed between the bread control and bread consumed with either of the OJ, despite the additional sugar content from the juices. Furthermore, no differences were observed between the two juices.
Blood glucose in healthy volunteers over 120 min following the consumption of control food (white bread) and orange juices from ‘Moro’ (MOJ) and ‘Pera’ (POJ) varieties isolate or with bread, trial 1

Results are expressed as mean and standard error (mg/dl). Repeat measures ANOVA followed by Tukey’s test. Same letters in the same columns indicate no significant differences (P < 0·01) (n 14). No statistical analysis was performed in the same line.
The AUC0–2h values for both MOJ and POJ were significantly lower compared with bread control, reducing 54 % and 49 %, respectively (Figure 2(a)). No significant differences were observed in glucose AUC0–2h when both juices were ingested with white bread compared with the bread control (Figure 2(b)).
Glucose incremental area under the curve (iAUC) after ingestion of ‘Moro’ (MOJ) and ‘Pera’ (POJ) orange juices by healthy individuals. (A) 200 ml of orange juices; (B) 200 ml of orange juices (POJ or MOJ) plus white bread (25 g available carbohydrate). Results are expressed as mean (se) (n 14). Repeat measures ANOVA followed by Tukey’s test. Same letters indicate no significant differences (P < 0·05).

Glycaemic response to orange juices ingested with a sandwich with light cheese or butter (trial 2)
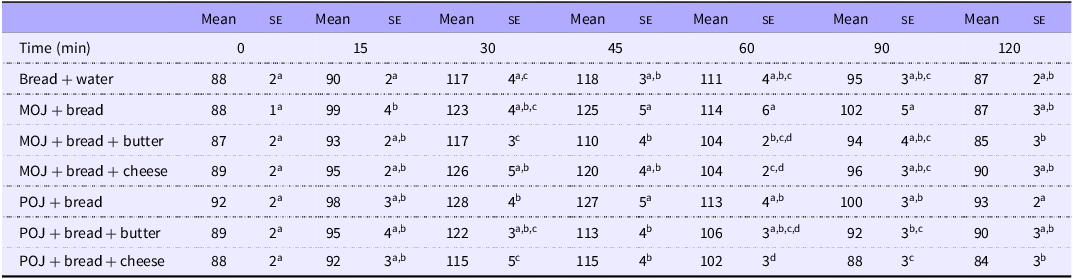
Glycaemic and insulin responses were assessed after ingestion of POJ and MOJ with white bread and also both OJ with a sandwich prepared with white bread and light cheese (10 g protein) or butter (10 g total lipid), commonly consumed at breakfast by the Brazilian population.
Few differences were observed in blood glucose levels when comparing the consumption of bread with both OJ varieties and the bread control or when additional food components (lipids or proteins) were included (Table 3).
Blood glucose in healthy volunteers over 120 min after ingestion of control food (white bread), 200 ml of ‘Moro’ (MOJ) and ‘Pera’ (POJ) orange juices with bread or a sandwich (25 g available carbohydrate) plus light cheese or butter, trial 2

Results are expressed as mean and standard error (mg/dl). Repeat measures ANOVA followed by Tukey’s test. Same letters in the same columns indicate no significant differences (P < 0·05) (n 10). No statistical analysis was performed in the same line.
The glycaemia of the bread control was lower than MOJ + bread at 15 min and POJ + bread at 30 min. At 30 min, MOJ + cheese showed higher glycaemia than MOJ + butter and POJ + cheese. Conversely, POJ + cheese resulted in lower glycaemia than POJ + bread. The glycaemia of MOJ + bread was higher than those of MOJ + butter at 45 min and 60 min and higher than that of MOJ + cheese at 60 min. At 45 min, POJ + bread showed higher glycaemia than POJ + butter and POJ + cheese. Additionally, POJ + cheese resulted in lower glycaemia than POJ + bread at 60, 90 and 120 min.
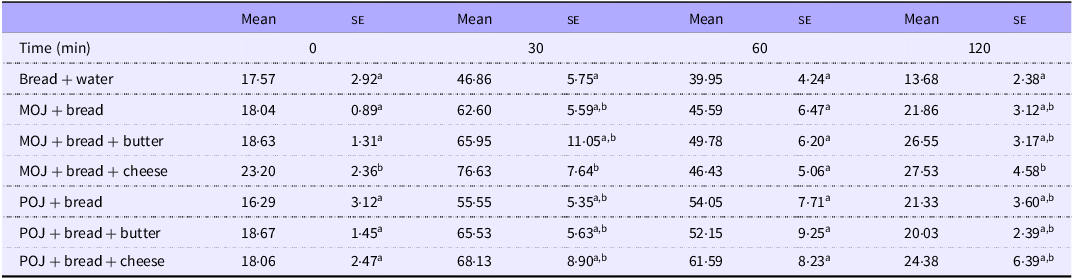
High interindividual variation was observed in insulin responses to the different foods. Only the insulin response for the bread control was lower than that of MOJ + cheese at 30 and 120 min (Table 4). No significant differences were observed at other time points.
Blood insulin levels in healthy volunteers over 120 min after ingestion of control food (white bread), 200 ml of ‘Moro’ (MOJ) and ‘Pera’ (POJ) orange juices with bread or a sandwich (25 g available carbohydrate) plus light cheese or butter, trial 2

Results are expressed as mean and standard error (mg/dl). Repeat measures ANOVA followed by Tukey’s test. Same letters in the same columns indicate no significant differences (P < 0·05) (n 10). No statistical analysis was performed in the same line.
Furthermore, no significant differences were observed in glucose AUC0–2h and insulin AUC0–2h (Figure 3(a) and (b), respectively) between all foods, except between POJ + cheese and the bread control, where the former was higher than the latter (P < 0·05).
Glycaemic and insulin incremental AUC (iAUC) after ingestion of 200 ml of ‘Moro’ (MOJ) and ‘Pera’ (POJ) orange juices with a bread or a sandwich (25 g available carbohydrate) plus light cheese or butter. (A) Glycaemic iAUC; (B) insulin iAUC. Results are expressed as mean (se) (n 10). Repeat measures ANOVA followed by Tukey’s test. Same letters indicate no significant differences (P < 0·05).

Discussion
Two separate trials (Trials 1 and 2) were conducted, with all volunteers consuming all designated foods for each trial. White bread, commonly consumed in Brazil and known for its high glycaemic response, was chosen for comparison in both trials. Each portion contained 25 g of available carbohydrates and was consumed either alone or as part of a sandwich or OJ. In both studies, the glycaemic response was measured based on portion sizes recommended by Brazilian Health Regulatory Agency (ANVISA) for fruit juice intake(29) for bread (50 g) and juices (200 ml).
Herein, we showed that OJ prepared from the ‘Pera’ and ‘Moro’ varieties do not increase glycaemic and insulin responses when ingested with foods containing starch, protein, or lipids. Furthermore, no differences were observed in glycaemic and insulin responses between POJ and MOJ.
The recommended portion of both OJ resulted in lower glycaemic response and glucose AUC compared with 25 g of available carbohydrates from white bread (control food). This result was expected since the amount of sugar contained in 200 ml of juices was around 12 g, half of that in white bread. Moreover, half of the total sugar amount in the juices consists of fructose, a monosaccharide metabolised by intestinal and hepatic cells through insulin-independent mechanisms, which has a low impact on blood insulin levels(Reference Eckstein, Brockfeld and Haupt30,Reference Lê and Tappy31) .
Contrarily, an increase in glycaemic response and glucose AUC was expected but not observed when white bread was ingested with both OJ (Trial 1). Three hypotheses could be considered: (1) the effect of OJs’ fibre content; (2) the pH of the food matrix and (3) a delay in the breakdown of glycosidic linkage of starch and absorption, by flavonoids present in OJ. In the first case, the effect of dietary fibre on controlling glucose absorption is well-documented(Reference Sarda and Giuntini32–Reference Silva, Kramer and de Almeida37), though the amount ingested from juices is lower, less than 1 g of total fibre, compared with the recommended 25 g/d(38). On the other hand, Guzman et al.(Reference Guzman, Xiao and Liska34) showed that including 5 g of citrus pomace did not alter the glucose incremental AUC compared to OJ or whole orange fruit. However, they observed an attenuated Cmax, leading to a more favourable postprandial glycaemic profile.
Additionally, the acidic conditions of some foods could inactivate salivary α-amylase earlier during the gastric phase, before its inactivation by gastric conditions, decreasing and delaying the subsequent step in the duodenum(Reference Freitas and Feunteun39). Freitas and colleagues showed that lemon juice decreased the glycaemic response and delayed the glucose Cmax after the ingestion of white bread(Reference Freitas, Boué and Benallaoua40); this effect was attributed to the inhibition of salivary α-amylase by the acidic pH 2·3 of lemon juice observed in vitro model, inhibiting starch hydrolysis in the gastric phase(Reference Freitas and Feunteun41). However, pomegranate juice (pH 3·2) also decreased the glycaemic response, but neither citric acid nor malic acid solution, at the same pH and amount found in the juice, significantly decreased this response, an effect attributed to pomegranate polyphenols(Reference Kerimi, Nyambe-Silavwe and Gauer42).
Polyphenols may also play a role in carbohydrate digestion. Some animal and human studies have shown that polyphenols and foods containing polyphenols present attenuated postprandial glycaemic responses and fasting hyperglycaemia by inhibiting carbohydrate digestion enzymes, including salivary and intestinal α-amylase and α-glucosidase, thus the starch digestion(Reference Ćorković, Gašo-Sokač and Pichler24,Reference Sun and Miao43–Reference Hanhineva, Törrönen and Bondia-Pons45) . Likewise, certain flavonoids may also inhibit glucose transport in the small intestine by inhibiting the carbohydrate transporters, SGLT1 present in the brush border of the small intestine and glucose transporter 2 (GLUT2) on the basal membrane(Reference Villa-Rodriguez, Aydin and Gauer46,Reference Williamson47) . SGLT2 could also be affected by polyphenols but predominantly in the kidney and is responsible for the reabsorption of glucose to the bloodstream(Reference Williamson48).
Few studies have assessed the postprandial glucose responses to OJ consumed with a meal. We observed no difference in glucose and insulin responses between both OJ and the water control co-consumed with a white bread, despite the additional 12 g of carbohydrate from both OJ. Similar results were also observed by Li et al.(Reference Li, Janle and Campbell21), who compared the glucose response after ingestion of a standard sandwich with six different breakfast beverages (12 g available carbohydrate). In this case, reduced-energy OJ did not alter glucose and insulin AUC0–4h compared with the control, while sugar-sweetened coffee significantly increased these responses. Previous studies have suggested that these effects may be partly due to caffeine’s potential to reduce insulin sensitivity. Similarly, Chaves et al.(Reference Chaves, Carvalho and Brasili22) found no significant change in blood glucose levels 1 h after ingesting OJ (75 g carbohydrate) alongside a higher-carbohydrate meal compared with water control among healthy individuals. Conversely, a control beverage containing sugar quantities equivalent to the juice exhibited elevated blood glucose levels.
Hesperidin and narirutin are the primary flavanones in both OJ, with cyanidin-3-glucoside being the main anthocyanin in MOJ, responsible for its purple colour. Hesperidin and eriocitrin, two flavanones found in citrus, have been shown to reversibly inhibit α-glucosidase from S. cerevisiae, resulting in tertiary structural changes(Reference Gong, Qin and Zhai49,Reference Liu, Kong and Miao50) . The glycosylation of citrus flavanones does not affect their inhibitory activity against carbohydrate digestive enzymes. The flavanone glycosides hesperitin, naringin and poncirin presented a high inhibitory effect on human pancreatic α-amylase, with naringin showing significantly higher inhibitory activity against α-glucosidase, up to 190-fold compared to hesperitin and acarbose(Reference Sahnoun, Trabelsi and Bejar51). Thus, despite the glycosidic linkage of the main citrus flavanone not being hydrolysed by endogenous glycosidases, these compounds are effective in inhibiting both enzymes in the small intestine, reducing glucose release along the intestinal tract.
Anthocyanin is another important class of flavonoid with potential inhibitory activity against carbohydrate digestive enzymes, present only in MOJ. Cyanidin-3-glucoside showed strong in vitro affinity for α-amylase at pH 7 and high inhibitory activity against the enzyme(Reference Wiese, Gärtner and Rawel52); surpassing its aglycone form, cyanidin(Reference Akkarachiyasit, Charoenlertkul and Yibchok-Anun53). However, it exhibited greater inhibitory activity for sucrase than for maltase, indicating no effect on the end-breakdown of starch(Reference Akkarachiyasit, Charoenlertkul and Yibchok-Anun53). Additionally, combined treatment with anthocyanin and metformin treatment showed synergistic effects in a diabetic mouse model, improving blood glucose and insulin resistance by regulating the PI3K/AKT/GSK3β pathway(Reference Tian, Si and Shu54).
Our study found no statistically significant difference in the glycaemic effect between MOJ (containing anthocyanins) and POJ (Figure 2). Despite the known properties of anthocyanins, they are present in small concentrations, approximately 2·8 mg per 100 ml, which is 10 times less than the concentration of flavanones (about 38 mg per 100 ml in the juices). Based on the discussion above, this underscores the need for more studies on the effect of increased anthocyanin concentrations on glycaemia.
The effect of hesperidin on glycaemic response was not concentration-dependent, since varying doses of hesperidin added to OJ did not alter the AUC in healthy humans. This study showed hesperidin’s ability to reduce glucose transport across differentiated monolayers of Caco-2/TC7 cells and inhibit the GLUT2 and GLUT5 transporters, which helps to reduce glucose absorption(Reference Kerimi, Gauer and Crabbe23). Thus, both citrus flavanones, hesperidin and naringin, along with cyanidin-3-glucoside, emerge as promising candidates for inhibiting α-amylase and/or α-glucosidase activity, thereby attenuating the postprandial glycaemic response.
The consumption of OJ has been associated with improvements in several cardiometabolic biomarkers and overall health promotion. However, in dietary contexts, various extrinsic (food matrix, dose, frequency) and intrinsic factors affecting bioavailability could modify their effects.
In Trial 2, the addition of butter and light cheese to bread consumed with OJ altered specific points of the glycaemic curve but did not affect the AUC or insulin responses. Otherwise, the glycaemic and insulin responses to white bread, with or without sources of protein and lipid, remained within the expected range for postprandial glucose (∼145 mg/dl) and insulin (∼60 μU/ml) responses(Reference Rizza, Mandarino and Gerich55).
The carbohydrates and proteins are insulin secretagogues, but postprandial insulin responses may vary depending on the type of protein ingested(Reference Wolever, Zurbau and Koecher56). Some amino acids regulate insulin secretion through their effects on β cells, with responses dependent on the type, quantity, route of administration and study population(Reference Sloun, Goossens and Erdos57,Reference Karhunen, Juvonen and Huotari58) . Milk proteins elicit greater postprandial insulin responses than cod and soya proteins(Reference Karhunen, Juvonen and Huotari58); whey protein ingested with isomaltulose stimulates a higher response to insulin than casein in diabetic patients, as whey protein is more soluble and rapidly absorbed compared with casein, which tends to coagulate in gastric juice(Reference Ang, Müller and Wagenlehner59). Furthermore, the consumption of white bread with varying amounts of soyamilk protein stimulated insulin secretion in the initial phase, even with a lower protein dose(Reference Camps, Lim and Ishikado60). Lipids, through free fatty acids, also stimulate incretin secretion and modulate insulin release through fatty acid metabolism; while short-chain free fatty acids inhibit their release, long-chain free fatty acids increase insulin secretion(Reference Röder, Wu and Liu61), as observed with butter.
Meng et al.(Reference Meng, Matthan and Ausman62) evaluated the effects of varying amounts of carbohydrates, proteins and fats added to a standard meal (50 g of carbohydrates, white bread). An increase in the glycaemic response was noted with the addition of 12, 25 and 50 g of carbohydrates, and a reduction with the addition of 50 g of protein. Insulin levels increased with the addition of both 50 g of carbohydrates and 50 g of protein; when lipids (11 g) were added to the standard diet, an increase in the insulin response was observed. The lack of difference in glycaemic response with the addition of different portions of butter was considered inexplicable by the authors(Reference Tricò and Natali63).
Otherwise, the food matrix does not affect postprandial glucose levels in young non-diabetic women, whether comparing raw oranges, 100 % fresh OJ and OJ sweetened with nectar containing 27 g of soluble sugar(Reference Papandreou, Magriplis and Abboud64). Moreover, Hägele et al.(Reference Hägele, Büsing and Nas65) demonstrated that consuming OJ over 4 weeks with three meals per day was more beneficial for energy balance than consuming it between meals. These results underscore that not only the composition of the food but also how OJ is consumed can affect health effects differently.
Thus, beyond the positive metabolic effects associated with the regular consumption of OJ on cardiometabolic risk factors(Reference Li, Jin and Ji2,Reference Becerra-Tomás, Paz-Graniel and Tresserra-Rimbau3) , consuming OJ alongside other foods does not adversely affect glycaemia.
Acknowledgments
The authors would like to thank all volunteers who contributed to the development of this project and the Citrus Production Defence Fund (FUNDECITRUS – Araraquara, São Paulo, Brazil) for supplying the pasteurised OJ.
This study was supported by the São Paulo Research Foundation (FAPESP) (grant no. 2013/07914-8) and the National Council for Scientific and Technological Development (CNPq) (grant no. 409394/2021-1). The authors are grateful to CNPq (grant no. 141878/2019-3; grant no. 314894/2021-7), and FAPESP (grant no. 2022/05463-8; 2024/03926-6) for the scholarship provided.
Conceptualisation: E. B. G., N. M. A. H., F. M. L.; Investigation: E. B. G., L. N. F., I. A. E. D.; Data curation: E. B. G., F. R. L.; N. M. A. H.; Formal analysis: E. B. G., F. R. L.; Methodology: E. B. G., N. M. A. H., L. N. F., I. A. E. D.; Resources: F. M. L.; N. M. A. H.; Supervision: F. M. L.; N. M. A. H.; Writing – original draft: E. B. G., N. M. A. H.; Writing – review and editing: E. B. G., I. A. E. D., N. M. A. H., F. M. L.
There are no conflicts of interest to declare. All authors have read and agreed to the published version of this manuscript.