


1. Introduction
Electron runaway is seen as one of the main threats to successful operation of magnetic confinement fusion devices with large plasma currents, such as ITER (Lehnen et al. Reference Lehnen, Aleynikova, Aleynikov, Campbell, Drewelow, Eidietis, Gasparyan, Granetz, Gribov and Hartmann2015; Breizman et al. Reference Breizman, Aleynikov, Hollmann and Lehnen2019). The number of e-foldings in the runaway avalanche during a plasma-terminating disruption increases drastically when a tokamak is scaled up to ITER parameters from those currently in operation (Rosenbluth & Putvinski Reference Rosenbluth and Putvinski1997). This calls for accurate models for the runaway generation and losses to ensure the design of a successful disruption mitigation system (Hollmann et al. Reference Hollmann, Aleynikov, Fülöp, Humphreys, Izzo, Lehnen, Lukash, Papp, Pautasso and Saint-Laurent2015).
There is a wealth of experimental evidence that magnetic perturbations, occurring either naturally after a disruption or induced by external magnetic coils, can prevent or reduce runaway electron beam formation. In JET, a high level of magnetic fluctuations following a disruption has been seen to correlate with the absence of runaways (Gill et al. Reference Gill, Alper, de Baar, Hender, Johnson and Riccardo2002). Broadband magnetic turbulence has been observed to lead to suppression of runaway current if the perturbation exceeds a certain level also in TEXTOR (Zeng et al. Reference Zeng, Koslowski, Liang, Lvovskiy, Lehnen, Nicolai, Pearson, Rack, Jaegers and Finken2013) and in J-TEXT (Zeng et al. Reference Zeng, Chen, Dong, Koslowski, Liang, Zhang, Zhuang, Huang and Gao2017). Kinetic instabilities driven by the runaways themselves can also induce local magnetic perturbations increasing the radial transport. Observations at DIII-D indicate that when the power in the instabilities exceeds a threshold, runaway plateau formation is absent (Lvovskiy et al. Reference Lvovskiy, Paz-Soldan, Eidietis, Molin, Du, Giacomelli, Herfindal, Hollmann and Martinelli2018). Perturbations imposed by external magnetic coils have also been shown to suppress the formation of runaway beams in several tokamaks (Yoshino & Tokuda Reference Yoshino and Tokuda2000; Lehnen et al. Reference Lehnen, Bozhenkov, Abdullaev and Jakubowski2008, Reference Lehnen, Abdullaev, Arnoux, Bozhenkov, Jakubowski, Jaspers, Plyusnin, Riccardo and Samm2009; Mlynar et al. Reference Mlynar, Ficker, Macusova, Markovic, Naydenkova, Papp, Urban, Vlainic, Vondracek and Weinzettl2018).
The avalanche generation of runaway electrons is a result of momentum transfer between an existing runaway electron and a thermal electron in a close collision. This leads to a growth of the runaway population that is proportional to the existing number of runaway electrons. Consequently, as the radial transport of runaways is also proportional to their number, it can reduce the growth rate of the exponentiation (Helander, Eriksson & Andersson Reference Helander, Eriksson and Andersson2000). Perturbations in the plasma confining magnetic field result in spatial transport and subsequent losses of runaway electrons (Rechester & Rosenbluth Reference Rechester and Rosenbluth1978). These losses reduce the number of runaway electrons participating in the avalanche mechanics and thereby have the potential to reduce the conversion of the initial plasma current to a runaway beam.
Modelling of a disrupting tokamak plasma resolved both in momentum, as needed for the runaway problem, and spatially, as needed to describe the evolution of plasma parameters, is computationally costly. Therefore, to follow the evolution of the disruption, simplified fluid models for the runaway populations are often used (Smith et al. Reference Smith, Helander, Eriksson, Anderson, Lisak and Andersson2006; Papp et al. Reference Papp, Fülöp, Fehér, de Vries, Riccardo, Reux, Lehnen, Kiptily, Plyusnin and Alper2013; Matsuyama, Aiba & Yagi Reference Matsuyama, Aiba and Yagi2017; Bandaru et al. Reference Bandaru, Hoelzl, Artola, Papp and Huijsmans2019; Fülöp et al. Reference Fülöp, Helander, Vallhagen, Embreus, Hesslow, Svensson, Creely, Howard and Rodriguez-Fernandez2020). In these, the momentum space dynamics has been captured approximately, and an effective theory only dependent on spatially varying quantities is used to describe the growth and loss of the runaway population. Such simplified disruption modelling has been used to estimate the post-disruption runaway population in the presence of massive material injection (Martín-Solís, Loarte & Lehnen Reference Martín-Solís, Loarte and Lehnen2017; Vallhagen et al. Reference Vallhagen, Embreus, Pusztai, Hesslow and Fülöp2020; Linder et al. Reference Linder, Fable, Jenko, Papp and Pautasso2020). However, these studies focused on the generation rates of the runaways and neglected the losses due to spatial transport.
The transport due to the perturbations is in general momentum dependent (Hauff & Jenko Reference Hauff and Jenko2009), preventing a straightforward fluid description of the phenomena. The goal of this paper is to present a theory describing an effective rate of generation for runaway electrons which incorporates the effects of a momentum-dependent spatial diffusion. The diffusion considered here may originate from the motion of electrons in regions of stochastic magnetic fields as well as other perturbed magnetic field structures. In § 3 we derive a self-consistent expression for the reduced avalanche growth rate of runaway electrons, including the effect of spatial transport, as well as radiation reaction forces and partially ionised impurities in a homogeneous plasma. Spatial variations in the plasma are investigated in § 4 with a perturbation approach which conserves particle number to investigate the effect of radial transport in more realistic disruption simulations.
We find that, if the timescale of the losses is comparable with that of the avalanche, spatial transport can raise the critical electric field for runaway generation significantly. The reason is that, even as runaway electrons are generated through close collisions by the avalanche dynamics, there need not be a net growth of the population if the relativistic electrons are transported out of the plasma. This may be part of the explanation of experimental observations which show strongly elevated critical electric fields (Martín-Solís, Sánchez & Esposito Reference Martín-Solís, Sánchez and Esposito2010; Hollmann et al. Reference Hollmann, Austin, Boedo, Brooks, Commaux, Eidietis, Humphreys, Izzo, James and Jernigan2013; Granetz et al. Reference Granetz, Esposito, Kim, Koslowski, Lehnen, Martín-Solís, Paz-Soldan, Rhee, Wesley and Zeng2014; Paz-Soldan et al. Reference Paz-Soldan, Eidietis, Granetz, Hollmann, Moyer, Wesley, Zhang, Austin, Crocker and Wingen2014; Popovic et al. Reference Popovic, Esposito, Martín-Solís, Bin, Buratti, Carnevale, Causa, Gospodarczyk, Marocco and Ramogida2016). The value of the critical field is also important for the dynamics in the current decay phase of disruptions, where the electric field tends to a value at which the loss and gain of runaway electrons is balanced (Breizman & Aleynikov Reference Breizman and Aleynikov2017).
We demonstrate the effect of magnetic perturbations on runaway evolution in simplified disruption simulations in § 5, taking into account the evolution and transport of runaways self-consistently with the electric field. We consider ITER-like plasmas with a combination of neon and deuterium injection and find that the runaway current can be suppressed, if the perturbations reach all the way to the plasma centre. The mixed magnetic topology common in disruptions is seen to have the potential to generate strong current sheets. Their stability may, in turn, be expected to affect the magnetic perturbation profile.
2. Radial diffusion of runaway electrons in the presence of radiation
Runaway electrons are almost collisionless and, as such, tend to follow magnetic field lines closely. Thus, in a stochastic magnetic field, the trajectories of runaway electrons generated close to one another will diverge with a rate dependent on the particle velocity along the field line and the rate of divergence of nearby field lines themselves (Rechester & Rosenbluth Reference Rechester and Rosenbluth1978). For a population of runaway electrons this leads to diffusive cross-field transport, the magnitude of which depends on the perturbation strength. However, at relativistic energies the electrons do not follow field lines closely, which causes the transport to decrease with increasing energy due to the effects associated with the finite orbit width (Myra & Catto Reference Myra and Catto1992; Hauff & Jenko Reference Hauff and Jenko2009; Särkimäki et al. Reference Särkimäki, Embreus, Nardon and Fülöp2020). Furthermore, it has been shown that modelling the transport as purely diffusive is insufficient in mixed magnetic topologies containing both islands and stochastic regions (Papp et al. Reference Papp, Drevlak, Pokol and Fülöp2015), but this can be addressed by including an advection term in the model (Särkimäki et al. Reference Särkimäki, Hirvijoki, Decker, Varje and Kurki-Suonio2016). A simplified theory to account for the momentum dependent radial diffusion in the avalanche growth rate was proposed by Helander et al. (Reference Helander, Eriksson and Andersson2000), a theory which we will build on and extend to account for radiation reaction forces and the presence of partially ionised impurities. We address a case with mixed magnetic topologies in § 5.
The momentum-space dynamics in the electron runaway problem is often described by the high-energy limit of the gyro-averaged kinetic equation with an accelerating electric field parallel to the magnetic field  $\boldsymbol {B}$ (Hesslow et al. Reference Hesslow, Embréus, Wilkie, Papp and Fülöp2018b):
 \begin{equation} \frac{\partial f}{\partial t} + \frac{ E}{\tau} \left(\xi\frac{\partial f}{\partial p} + \frac{1 - \xi^2}{p}\frac{\partial f}{\partial \xi} \right) = C\{f\}- \frac{\partial }{\partial \boldsymbol{p}}\boldsymbol{\cdot}\left( \boldsymbol{F}_{\text{rad}}f\right). \end{equation}
Here,  $f$ is the electron distribution function, $p$ is the momentum normalised to $m_e c$, $\xi = \boldsymbol {p}\boldsymbol {\cdot }\boldsymbol {B}/(pB)$ is the cosine of the pitch angle, $E$ is the electric field strength normalised to the critical electric field ${E_c = n_e e^3 \ln {\varLambda _c} / (4 {\rm \pi} \varepsilon _0^2 m_e c^2 )}$ (Connor & Hastie Reference Connor and Hastie1975), where $n_e$ is the electron density, $e$ the elementary charge, $m_e$ the electron mass, $\varepsilon _0$ the permittivity of free space, $c$ the speed of light and $\ln {\varLambda _c} \simeq 14.6 +0.5 \ln {T_\textrm {eV}/n_\textrm {e20}}$ is the relativistic Coulomb logarithm, with $T_\textrm {eV}$ being the temperature measured in electronvolts and $n_\textrm {e20}$ the electron density normalised to $10^{20}\ \textrm {m}^{-3}$. The relativistic collision time between electrons is ${\tau = m_e c / (e E_c)}$, $C\{ f \}$ is the relativistic collision operator and the last term on the right-hand side of (2.1) represents radiation reaction forces from synchrotron radiation and bremsstrahlung.
The relativistic test-particle collision operator is given by Helander & Sigmar (Reference Helander and Sigmar2005)
 \begin{equation} C\{ f \} = \nu_D \frac{1}{2}\frac{\partial }{\partial \xi}(1 - \xi^2)\frac{\partial }{\partial \xi}f + \frac{1}{p^2}\frac{\partial }{\partial p} (p^3 \nu_s f), \end{equation}
where  $\nu _s$ and $\nu _D$ are the slowing down and deflection frequencies, respectively. For relativistic electrons $\nu _s$ and $\nu _D$ take the form
 \begin{equation} \nu_D = \tau^{{-}1} \frac{\gamma}{p^3}\bar{\nu}_D, \quad \nu_s = \tau^{{-}1} \frac{\gamma^2}{p^3}\bar{\nu}_s, \end{equation}
where for the case of a fully ionised plasma  $\bar {\nu }_s = 1$ and $\bar {\nu }_D = 1 + Z_{\text {eff}}$ (Hesslow et al. Reference Hesslow, Embréus, Wilkie, Papp and Fülöp2018b). Here $\gamma =\sqrt {1+p^2}$ is the Lorentz factor, $Z_{\text {eff}} = n_e^{-1}\sum _{j} n_j Z_j^2$ is the effective charge and $j$ is an index which runs over all ion species in the plasma, each with density $n_j$ and charge $Z_j$.
In partially ionised plasmas, the slowing-down and deflection frequencies are influenced by the extent to which fast electrons can penetrate the bound electron cloud around the impurity ion, i.e. the effect of partial screening (Martín-Solís, Loarte & Lehnen Reference Martín-Solís, Loarte and Lehnen2015; Breizman & Aleynikov Reference Breizman and Aleynikov2017). The collision frequencies  $\nu _s$ and $\nu _D$ can be generalised to account for the differences in the collisional dynamics at different energy scales arising when screening effects are introduced, and in the relativistic limit take the form (Hesslow et al. Reference Hesslow, Embréus, Stahl, DuBois, Papp, Newton and Fülöp2017, Reference Hesslow, Embréus, Hoppe, DuBois, Papp, Rahm and Fülöp2018a)
 \begin{gather} \bar{\nu}_D \approx 1 + Z_{\text{eff}} + \frac{1}{\ln{\varLambda_c}}\sum_{j} \frac{n_j}{n_e}\left[(Z_j^2 - Z_{0j}^2)\ln{\bar{a}_j} - \frac{2}{3}N_{j}^2\right] + \frac{\ln{p}}{\ln{\varLambda_c}}\sum_{j}\frac{n_j}{n_e}Z_j^2, \end{gather}
 \begin{gather}\bar{\nu}_s \approx 1 + \frac{1}{\ln{\varLambda_c}}\sum_{j} \frac{n_j}{n_e}N_{j}(\ln{I_j^{{-}1}} - 1) + \frac{\ln{p}}{2\ln{\varLambda_c}}\left(1 + 3\sum_{j}\frac{n_j}{n_e}N_{j} \right), \end{gather}
which we denote as  $\bar {\nu }_D \approx \bar {\nu }_{D0} + \bar {\nu }_{D1}\ln {p}$ and $\bar {\nu }_s = \bar {\nu }_{s0} + \bar {\nu }_{s1} \ln {p}$. The collision frequencies now depend on atomic parameters of species $j$: ionisation degree $Z_{0j}$, charge number $Z_j$, number of bound electrons of the nucleus for species $j$,
$j$,  $N_j = Z_j - Z_{0j}$, mean excitation energy of the ion $I_j$ and effective ion size $\bar {a}_j$ determined from density functional theory calculations, given by Hesslow et al. (Reference Hesslow, Embréus, Stahl, DuBois, Papp, Newton and Fülöp2017). The effect of partially ionised ions in the plasma will influence the runaway generation (Hesslow et al. Reference Hesslow, Embréus, Vallhagen and Fülöp2019a,Reference Hesslow, Unnerfelt, Vallhagen, Embreus, Hoppe, Papp and Fülöpb) as well as increase the critical electric field (Hesslow et al. Reference Hesslow, Embréus, Wilkie, Papp and Fülöp2018b).
Synchrotron radiation and bremsstrahlung hinder the acceleration of runaway electrons. The effective term in the kinetic equation resulting from synchrotron radiation is (Hirvijoki et al. Reference Hirvijoki, Decker, Brizard and Embréus2015a,Reference Hirvijoki, Pusztai, Decker, Embréus, Stahl and Fülöpb; Stahl et al. Reference Stahl, Hirvijoki, Decker, Embréus and Fülöp2015)
 \begin{equation} \frac{\partial }{\partial \boldsymbol{p}}\boldsymbol{\cdot}(\boldsymbol{F}_{\text{syn}} f) ={-}\frac{1}{p^2}\frac{\partial }{\partial p}\left( \frac{p^3\gamma}{\tau_{\text{syn}}}(1 - \xi^2)f\right) + \frac{\partial }{\partial \xi}\left(\frac{\xi (1-\xi^2)}{\tau_{\text{syn}}\gamma}f\right), \end{equation}
where  $\tau _{\text {syn}}$ is the synchrotron radiation-damping timescale
 \begin{equation} \tau_{\text{syn}} = 6{\rm \pi} \varepsilon_0 m_e^3 c^3/(e^4 B^2). \end{equation}
Similarly to the treatment by Hesslow et al. (Reference Hesslow, Embréus, Stahl, DuBois, Papp, Newton and Fülöp2017), the effect of bremsstrahlung is here incorporated into the kinetic equation via a mean-force model, which has been shown to capture the mean-energy accurately (Embréus, Stahl & Fülöp Reference Embréus, Stahl and Fülöp2016),
 \begin{equation} \frac{\partial }{\partial \boldsymbol{p}}\boldsymbol{\cdot}\left( \boldsymbol{F}_{\text{br}}f\right) ={-}\frac{1}{p^2}\frac{\partial }{\partial p}(p^2 F_{\text{br}}f). \end{equation}
Here  $F_{\text {br}}$ is approximated by
 \begin{equation} F_{\text{br}} \approx \frac{p \alpha_\textrm{FS}}{\tau \ln{\varLambda_c}}\sum_j \frac{n_j}{n_e}Z_{j}^2\left( 0.35 + 0.20\ln{p} \right) \equiv \tau^{{-}1} p \left( \phi_{\text{br}0} + \phi_{\text{br}1}\ln{p}\right) \end{equation}
and  $\alpha _\textrm {FS}$ is the fine structure constant. The screening and radiation effectively increase the friction at large momenta, which will prevent runaway electrons from reaching arbitrarily large energies when given a long enough time to accelerate.
Equation (2.1) describes the momentum space dynamics of the runaway phenomena, however it does not include any terms allowing for spatial transport. Helander et al. (Reference Helander, Eriksson and Andersson2000) amended the kinetic description by adding the radial component of the diffusion operator in cylindrical geometry, characterised by the phase-space-dependent diffusion coefficient  $D$. Including this in our formulation we obtain the full kinetic equation of interest here,
 \begin{align} \frac{\partial f}{\partial t} &= \frac{1}{p^2}\frac{\partial }{\partial p} \left[\left( -\xi \frac{E}{\tau} + p\nu_s + F_{\text{br}} + \frac{p\gamma}{\tau_{\text{syn}}}(1 - \xi^2)\right) p^2 f\right]\nonumber\\ &\quad+ \frac{\partial }{\partial \xi}\left[(1 - \xi^2)\left( -\frac{E/\tau}{p}f + \frac{1}{2}\nu_D\frac{\partial f}{\partial \xi} \right) - \frac{\xi(1 - \xi^2)}{\tau_{\text{syn}}\gamma} f \right] + \frac{1}{r}\frac{\partial}{\partial r}rD \frac{\partial f}{\partial r}. \end{align}
In the next section we formulate a general expression for the change in the runaway avalanche growth rate resulting from such a finite  $D$.
$D$.
3. Reduced avalanche growth rate and effective critical electric field
The appearance of the diffusion term in the kinetic equation adds another dimension to the problem, a radial one, compared with the standard avalanche growth rate calculation (Jayakumar, Fleischmann & Zweben Reference Jayakumar, Fleischmann and Zweben1993; Rosenbluth & Putvinski Reference Rosenbluth and Putvinski1997). We develop an approximate solution by taking advantage of a separation of timescales, following the approach outlined by Helander et al. (Reference Helander, Eriksson and Andersson2000). The avalanche generates secondary electrons with momentum predominantly close to the critical momentum for the runaway process  $p_c$Footnote 1 and the electron is accelerated from this region up to relativistic momenta on the short timescale ${\tau _{\text {acc}} \sim \tau /E}$. The transport timescale represented by $D$ will typically be longer than this acceleration time, so the diffusion will not be strong enough to significantly reduce or alter the generation process. However, the timescale of the avalanche growth is significantly longer, namely ${\gamma _r^{-1} \sim 2 \ln \Lambda \tau _{\text {acc}}}$ (Jayakumar et al. Reference Jayakumar, Fleischmann and Zweben1993) and thus the spatial diffusion may be expected to have a substantial effect on the avalanche.
To this end, the momentum space is divided into a low-energy region,  $p < p_*$, where all the runaway generation occurs and the effects of radial diffusion are neglected, and a high-energy region, $p > p_*$, where all the radial transport takes place. After this division in momentum space, the high-energy region is modelled as source free and the generation of runaway electrons is modelled as a flux through the lower boundary in momentum space at $p_*$. Furthermore, the theory is reduced to only a single momentum-space coordinate in the high-energy region.
This was done neglecting the effect of radiation by Helander et al. (Reference Helander, Eriksson and Andersson2000), by recognising that runaway electrons often have small pitch angles,  $\xi \approx 1$ and so expanding the collision operator assuming $p_{\perp } \ll p_\|$, where $p_\|$ and $p_{\perp }$ are the projections of the momentum along and perpendicular to the magnetic field line, respectively. The rate of change of the distribution function integrated over perpendicular momenta ${\mathcal {F}} = \int \, \textrm {d}^2\boldsymbol {p}_{\perp }\ f = \int _0^{\infty }\,\textrm {d}p_{\perp } 2{\rm \pi} p _{\perp }\ f$ can then be obtained by integrating the kinetic equation (2.9), leading to
 \begin{equation} \frac{\partial \mathcal{F}}{\partial t} + \frac{E - 1}{\tau} \frac{\partial \mathcal{F}}{\partial p} = \frac{1}{r}\frac{\partial}{\partial r}rD(p) \frac{\partial \mathcal{F}}{\partial r}, \end{equation}
where the diffusion coefficient for particles travelling purely along the magnetic field line is used to first order. This is the kinetic description of the runaway electrons given in equation  $(12)$ of Helander et al. (Reference Helander, Eriksson and Andersson2000). The synchrotron radiation reaction force is, however, strongly dependent on the momentum perpendicular to the magnetic field line, as it is a consequence of the gyration around the field line, and a treatment of radiative effects needs to account for the pitch-angle distribution of particles.
Radiative effects are important close to the critical electric field where the acceleration from the electric field is close to being balanced by the radiation reaction forces, making the dynamics in the energy direction of momentum space comparatively slow. Therefore, as in Lehtinen, Bell & Inan (Reference Lehtinen, Bell and Inan1999), Aleynikov & Breizman (Reference Aleynikov and Breizman2015) and Hesslow et al. (Reference Hesslow, Embréus, Wilkie, Papp and Fülöp2018b), we consider the pitch-angle evolution to be a rapid process compared with the energy evolution dynamics and assume a steady state in the pitch-angle distribution for a given  $p$. This requires that the pitch-angle flux of particles vanishes, the condition following from the kinetic equation (2.9) as
 \begin{equation} 0 = (1 - \xi^2)\left(-\frac{E/\tau}{p}f + \frac{1}{2}\nu_{D} \frac{\partial f}{\partial \xi}\right) - \frac{\xi(1 - \xi^2)}{\tau_{\text{syn}}\gamma}f. \end{equation}
As  $\tau _{\text {syn}} \gg \tau$ we formally neglect the effect of the synchrotron radiation on the pitch-angle distribution, retaining only the balance between the diffusive effect of pitch-angle scattering and the collimating effect of the electric field. This can be used to solve for the pitch angle distribution and the distribution function may now be written as
 \begin{equation} 2{\rm \pi} p^2 f(r, p, \xi, t) = \frac{A(p)}{2\sinh(A(p))}\textrm{e}^{A(p)\xi} F(r, p, t), \end{equation}
where the reduced distribution function  $F$ includes the $2{\rm \pi} p^2$ of the momentum-space Jacobian, such that the radial density of runaway electrons is
 \begin{equation} n_{\text{RE}}(r, t) = \int_{p_*}^{\infty}\,\textrm{d}p\, F(r, p, t) \end{equation}
and the inverse of  $A(p) = 2E/(p\nu _D\tau )$ determines the extent of the distribution function in $\xi$. In the limit of large $p$, the pitch angle distribution is narrow in agreement with the treatment by Helander et al. (Reference Helander, Eriksson and Andersson2000), as $\nu _D \sim p^{-2}$ and therefore $A^{-1} \sim p^{-1}$.
Integrating the kinetic equation over pitch-angle, a reduced kinetic equation now accounting for radiation reaction forces and screening effects is obtained
 \begin{equation} \frac{\partial F}{\partial t} + \frac{1}{\tau}\frac{\partial }{\partial p}\left(U(p) F\right) = \frac{1}{r}\frac{\partial}{\partial r}r\langle D \rangle_{\xi} \frac{\partial F}{\partial r}, \end{equation}
where the pitch averaged force  $U(p)$ is
 \begin{equation} U(p) = E\coth{A} - \tau \left[\frac{p\nu_{D}}{2} + p\nu_s + F_{br} + \frac{p^2\gamma\nu_D}{\tau_{\text{syn}} E}\left(\coth{A} - \frac{1}{A}\right)\right], \end{equation}
and the pitch-angle averaged diffusion coefficient is
 \begin{equation} \langle D \rangle_{\xi}(p) = \int_{{-}1}^{1}\,\textrm{d}\xi\, D(p, \xi)\frac{A\,\textrm{e}^{A\xi}}{2\sinh{A}}. \end{equation}
Note that for large  $p$, neglecting screening effects, we recover the non-radiative result $U(p) \approx E\coth {A} - p \tau \nu _s \rightarrow E -1$. A qualitative difference between the models with and without radiative effects is the appearance of a momentum scale $p_{\max }$ where the pitch-angle averaged advection in momentum disappears, $U(p_{\max }) = 0$. This limits the energy of the relativistic particles and corresponds to the energy scale where radiation reaction forces balance the electric field acceleration.
As outlined by Helander et al. (Reference Helander, Eriksson and Andersson2000), we impose the boundary condition that the particle flux through  $p_*$ is given by the avalanche growth, $\gamma _r n_{\text {RE}}$, where $\gamma _r$ is the growth rate without the impact of diffusion. Given the structure of (3.5) this translates to a condition on $F$ as
 \begin{equation} F(p_*) = \frac{\tau \gamma_r}{U(p_*)}n_{\text{RE}} = \frac{\tau \gamma_r}{U(p_*)} \int_{p_*}^{\infty} \,\textrm{d}p\, F, \end{equation}
which is not a typical boundary condition as the value at the lower boundary in momentum space is dependent on the solution in the whole high-energy region. A closed-form expression for the solution can be found for the simpler problem of radially uniform plasma parameters in a quasi-steady state in terms of a Bessel mode expansion.Footnote 2 The effective strength of the diffusion experienced by each Bessel mode is scaled by the square of its inverse radial length scale  $k_i = b_i / a$, where $b_i$ is the $i$th root of the zeroth Bessel function $J_0(x)$ (Abramowitz & Stegun Reference Abramowitz and Stegun1948). The solution is
 \begin{equation} F(p, r, t) = \frac{1}{U(p)}\sum_{i = 1}^{\infty} c_i J_0(k_ir)\exp\left(\gamma_i t - \int_{p_*}^{p}\, \textrm{d}p' \frac{\tau}{U(p')}(\gamma_i + k_i^2 \langle D \rangle_{\xi}(p'))\right). \end{equation}
The coefficients  $c_i$ are determined by the initial condition, or seed profile of the avalanche process. The growth rate of the modes, $\gamma _i$, will be determined by the boundary condition (3.8).
Helander et al. (Reference Helander, Eriksson and Andersson2000) considered only the first Bessel mode,  $i = 1$. This gave a conservative estimate of the effect of diffusion as higher mode numbers have a smaller characteristic length scale so will experience a larger effect of diffusion, as noted previously. Here we choose to retain all the modes, which would allow the runaway distribution function to be propagated in time. As a consequence of the orthogonality of the Bessel modes, the boundary condition can be projected on each mode separately, which decouples them from one another. The equation for $\gamma _i$ then follows from inserting (3.9) in the boundary condition (3.8) as
 \begin{equation} 1 = \int_{p_*}^{p_{\max}}\,\textrm{d}p\, \frac{\gamma_r \tau}{U(p)}\exp\left( -\int_{p_*}^{p}\,\textrm{d}p'\, \frac{\gamma_i \tau + \tau k_i^2\langle D \rangle_{\xi}}{U(p')} \right), \end{equation}
where the upper limit of the integration is  $p_{\max }$ as no particles can gain energy larger than this.
The theory for the pitch-angle distribution described previously is valid for large  $p$, which we are mostly concerned with here, and not in general close to the critical momentum $p_c$, where $U(p_c) = 0$. If the free parameter $p_*$ is chosen close to $p_c$, the result will be sensitive to the choice. We can consistently minimise this effect of $p_*$ by expanding $U$ in large $p$, such that the theory still retains a $p_{\max }$, and safely set $p_* = p_c$ as a typical momentum scale for the onset of the runaway region. A large- $p$ expansion keeping terms of order $p^{-1}$ and larger gives
 \begin{align} U(p) &= E - \bar{\nu}_{s0} + \frac{\tau\bar{\nu}_{D0}^2}{2\tau_{\text{syn}}E^2} - \left(\bar{\nu}_{s1} - \tau\frac{ \bar{\nu}_{D0}\bar{\nu}_{D1}}{\tau_{\text{syn}} E^2}\right)\ln{p} + \frac{\tau \bar{\nu}_{D1}^{2}}{2\tau_{\text{syn}}E^2} \ln^2p\nonumber\\ &\quad - \left(\phi_{br0} + \frac{\tau\bar{\nu}_{D0}}{\tau_{\text{syn}}E}\right)p - \left(\phi_{br1} + \frac{\tau\bar{\nu}_{D1}}{\tau_{\text{syn}}E} \right)p\ln{p} - \left( \frac{1}{2} + \frac{\tau}{\tau_{\text{syn}} E}\right)\frac{\bar{\nu}_{D0} + \bar{\nu}_{D1}\ln{p}}{p}. \end{align}
 Finally, a model for the avalanche growth rate without magnetic perturbations is needed. For continuity with our collision operator we use the model by Hesslow et al. (Reference Hesslow, Embréus, Vallhagen and Fülöp2019a), which incorporates the effect of screening by the evaluation of the collision frequencies at an effective critical momentum scale  $p_c^\textrm {eff}$, implicitly given by $p_c^\textrm {eff} = \sqrt [4]{\bar {\nu }_s(p_c^\textrm {eff}) \bar {\nu }_D(p_c^\textrm {eff})} / \sqrt {E}$. Furthermore, the model has an increased threshold field for the avalanche generation, $\bar {E}_c^{\text {eff}}$, given by Hesslow et al. (Reference Hesslow, Embréus, Wilkie, Papp and Fülöp2018b). Here, the bar on $\bar {E}_c^{\text {eff}}$ indicates the critical electric field without the effect of radial diffusion, to distinguish from its value ${E}_c^{\text {eff}}$ when the radial diffusion is taken into account in § 3.2. The expression for the avalanche generation is then
 \begin{equation} \left(\frac{\partial n_{\text{RE}}}{\partial t} \right)^{\text{Aval}} = \gamma_r n_{\text{RE}} = \frac{n_e^{\text{tot}} / n_e}{\tau \ln{\varLambda} \sqrt{4 + \bar{\nu}_s(p_c^\textrm{eff}) \bar{\nu}_D(p_c^\textrm{eff})}} (E - \bar{E}_{c}^{\text{eff}}) n_{\text{RE}}, \end{equation}
where  $n_e^{\text {tot}}$ is the total number of electrons in the system ( $\text {bound} + \text {free}$). Although we will use this model for the avalanche generation in the next section in order to consider its reduction due to radial transport, our method is agnostic to this choice and can be adapted to any avalanche description.
3.1. Reduced avalanche growth rate
As the radial transport allows for runaway electrons to be lost from the system, preventing these electrons from multiplying by the avalanche mechanism, the exponential growth rate of the Bessel modes,  $\gamma _i$, will be reduced compared with the uncorrected value. The magnitude of the transport coefficients considered in the following reduces at large momentum, and in the avalanche distribution the particle density in phase space also decreases at large energies. Therefore, the problem is to a large extent determined by the dynamics at small energies. At these energies, where $p\ll p_{\max }$, the radiation reaction forces do not influence the problem significantly, and the acceleration dynamics is dominated by the electric field. For large field strength we have $U \approx E$. However, at the critical electric field for runaway generation, $\bar {E}_c^{\text {eff}}$, the runaway generation and the advection in momentum space fall to zero. A linear interpolation between these regions gives $U \approx E - \bar {E}_c^{\text {eff}}$.
The uncorrected growth rate in (3.12) scales with electric field strength as  $E - \bar {E}_{c}^{\text {eff}}$, which was just noted to be the approximate dependence of $U$ at low momentum ( $p\ll p_{\max }$), such that the prefactor of the exponent in (3.10) does not significantly vary with electric field strength at low $p$. The impact of the diffusion at low momentum is then characterised by
 \begin{equation} \alpha = \tau k_i^2 \langle D \rangle_{\xi} / (E - \bar{E}_{c}^{\text{eff}}) \end{equation}
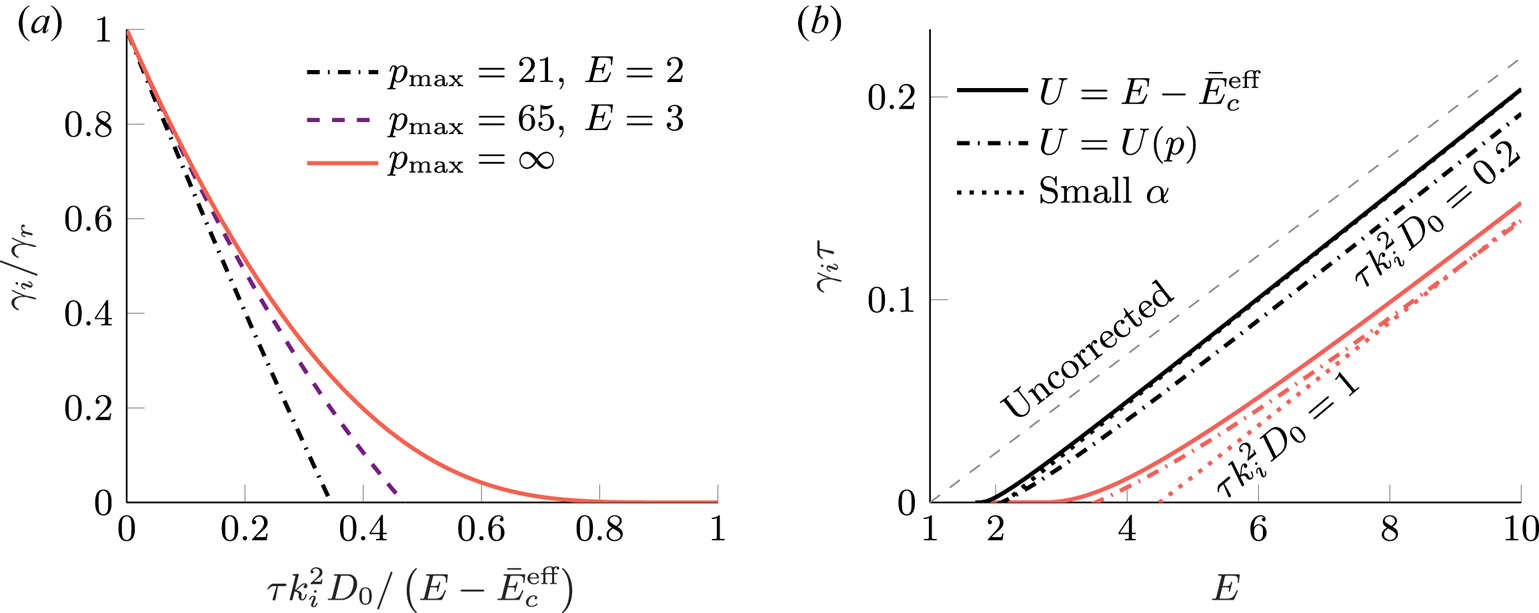
and the dependence of the corrected growth rate on this parameter is shown in figure 1(a), which is obtained by solving (3.10) numerically. In the limit of small  $\alpha$ the effect of diffusion is rather well parameterised by this normalised ratio of diffusion strength to the electric field acceleration. However, the correlation is lost when the growth rate is strongly reduced and approaches zero. Qualitatively, this can be understood as the effect of $p_{\max }$ and the high-energy particles, as a finite $p_{\max }$ limits the number of energetic particles that can contribute to the avalanche without being affected significantly by the diffusion. The effect is demonstrated in figure 1(a) by the case $U = E - \bar {E}_c^{\text {eff}}$, where $p_{\max }$ is formally infinite and the growth rate remains slightly above zero for a relatively wide range of diffusion strengths.Footnote 3 This limit is approached generally at large electric field strength.
Reduction of the avalanche growth rate in a fully ionised plasma with  $Z_{\text {eff}} = 1$, $T = 10\ \textrm {eV}$, $n_e = 10^{20}\ \text {m}^{-3}$ and $B = 3\ \textrm {T}$ based on the numerical solution of (3.10) with the functional form of the diffusion coefficient from (3.14). (a) The relative correction of the growth rate as a function of diffusion strength for different electric field strengths. The limit $p_{\max } = \infty$ corresponds to the theory with $U = E - \bar {E}_c^{\text {eff}}$. (b) The corrected growth rate as a function of electric field strength. At large electric field strength the offset of the corrected growth rate depends on the diffusion strength $\tau k_i^2 D_0$, which is expected to be around unity in an ITER-sized machine with normalised magnetic perturbation level of $\delta B/B\simeq 10^{-4}$.
In figure 1(a) a diffusion coefficient of the following form was used,
 \begin{equation} \langle D \rangle_{\xi}(p) = D_0 \frac{v}{c \gamma} = D_0 \frac{p}{1 + p^2}, \end{equation}
where  $v$ is the electron speed. The motivation for this expression is to capture the expected low-energy behaviour where the diffusion is proportional to the particle velocity along the magnetic field line (Rechester & Rosenbluth Reference Rechester and Rosenbluth1978), as well as the expected effects of orbit decorrelation at high energy, as described for example in Hauff & Jenko (Reference Hauff and Jenko2009). The latter authors made an estimate for $D_0$ in the small Kubo number limit, such that $D \simeq v_B^2 \tau _{\|}$, where the radial velocity of the particles $v_{B} = v_{\|} \delta B / B$ is due to the projection of the motion along the perturbed field line, with $\delta B$ the root mean square of the magnetic perturbation amplitude. The parallel correlation time is assumed to be set by the particle motion through the perturbed poloidal magnetic field structure, $\tau _{\|} = \lambda _{\|}/v_{\|} \simeq {\rm \pi} q R / v_{\|}$, where $\lambda _{\|}$ is the parallel connection length and $q$ is the safety factor. Therefore, the estimate of $D_0$ is
 \begin{equation} D_0 \simeq {\rm \pi} q R \left(\delta B / B \right)^2 c . \end{equation}
The strength of the diffusion is parameterised in this paper by  $\tau k_i^2 D_0$ which is thus related to the magnetic perturbation level as follows,
 \begin{equation} \tau k_i^2 D_0 \approx 3.14\, b_i^2 \frac{R[\textrm{m}] q}{a[\textrm{m}]^2 n_{e,20} \ln{\varLambda}} (10^{4} \delta B / B)^2, \end{equation}
where  $R[\textrm {m}]$ and $a[\textrm {m}]$ are the major and minor radii in metres, respectively, and $n_{e,20}$ is the electron density in units of $10^{20} \ \textrm {m}^{-3}$. Consequently, for standard ITER parameters without any material injection, $R = 6.2$ m, $a = 2$ m, $n_e = 10^{20}\ \textrm {m}^{-3}$, $\ln {\varLambda } \approx 15$ and $q \approx 1$, we have $\tau k_1^2 D_0 \approx 2 (\delta B / B)^2 \times 10^8$ for the least-suppressed mode ( $b_1 \approx 2.4$).
In absolute units, the uncorrected growth rate scales linearly with the electric field strength and in figure 1(b) we see that the corrected growth rate also shows a linear relation with the electric field strength for large fields. The corrected growth rate is offset from the uncorrected one because the inverse of the characteristic diffusion parameter  $\alpha$ and the uncorrected growth rate depend similarly on the electric field. This can be seen by expanding (3.10) in small $\alpha$ yieldingFootnote 4
 \begin{equation} \gamma_i = \gamma_r - \int_{p_*}^{p_{\max}}\,\textrm{d}p\, \gamma_r \frac{\tau k_i^2 \langle D \rangle_{\xi}}{U(p)}\exp\left(-\int_{p_*}^{p}\,\textrm{d}p'\, \frac{\gamma_r \tau }{U(p')} \right), \end{equation}
where the second term is almost independent of  $E$ if $p_{\max }$ is large, because then $U \approx E-{E}_c^{\text {eff}}$ for the values of $p$ with the largest contribution to the integral. This approximation is compared to the full numerical solution in figure 1(b) where the offset from the uncorrected result is evident for large $E$ and small $\alpha$.
3.2. Effective critical electric field
As the radial transport reduces the growth rate, the critical electric field strength for net generation of runaway electrons may increase. In the current decay phase of the disruption, the electric field stays close to the critical electric field and the current decay rate is proportional to its value (Breizman & Aleynikov Reference Breizman and Aleynikov2017; Hesslow et al. Reference Hesslow, Embréus, Wilkie, Papp and Fülöp2018b). Therefore, the critical electric field has direct relevance for disruption mitigation strategies.
The mode least suppressed by the transport is the lowest-order mode, with index  $i=1$, and therefore can be expected to dominate the runaway profile in the late stages of the disruption. We therefore choose to define the effective critical electric field $E_c^{\text {eff}}$ as the field strength at which the growth rate of the first mode vanishes, namely $\gamma _1 = 0$.
Figure 2(a) shows numerical solutions for the critical electric field, obtained from (3.10) under the constraint  $\gamma _1 = 0$ in fully ionised plasmas with different densities. For large diffusion strengths, when the effective critical electric fields are relatively large, a linear relation between diffusion strength and electric field is found. This follows naturally for large electric fields $E$ in (3.10), $U \approx E - \bar {E}_{c}^{\text {eff}}$ and $p_{\max }$ is at large enough energy scales not to be relevant, as the condition $\gamma _1 = 0$ translates to a condition on $\alpha$. Given this linear relation in diffusion coefficient, the critical electric field strength is expected to be quadratic in the magnetic perturbation level, $\delta B / B$.
(a) Critical electric field as a function of diffusion strength calculated using the momentum space dependent diffusion coefficient given in (3.14). The critical electric field for a net avalanche gain in the presence of spatial transport (solid lines) is enhanced compared with the theory without transport (dashed lines). A linear relation between effective critical field strength and diffusion strength is found for large diffusion strengths. The plasma is fully ionised with effective charge  $Z_{\text {eff}} = 1$, a temperature of $T = 10\ \textrm {eV}$ and magnetic field strength $B = 3\ \textrm {T}$. The large $p$-expansion for $U$ has been used. (b) Critical electric field as a function of temperature, in a plasma with deuterium density $n_{{D}} = 10^{21}\ \text {m}^{-3}$ (upper three curves) or $n_{{D}} = 10^{20}\ \text {m}^{-3}$ (lower three curves), and neon density $n_{\text {Ne}} = 10^{19}\ \text {m}^{-3}$ in both cases, where the respective ionisation states for all temperatures $T$ are determined assuming equilibrium based on the ADAS coefficients of ionisation and recombination. The strength of the diffusion is characterised by (3.16) with minor and major radii $a = 2$ m and $R = 6.2\ \textrm {m}$ respectively, with a safety factor $q$ of order unity.
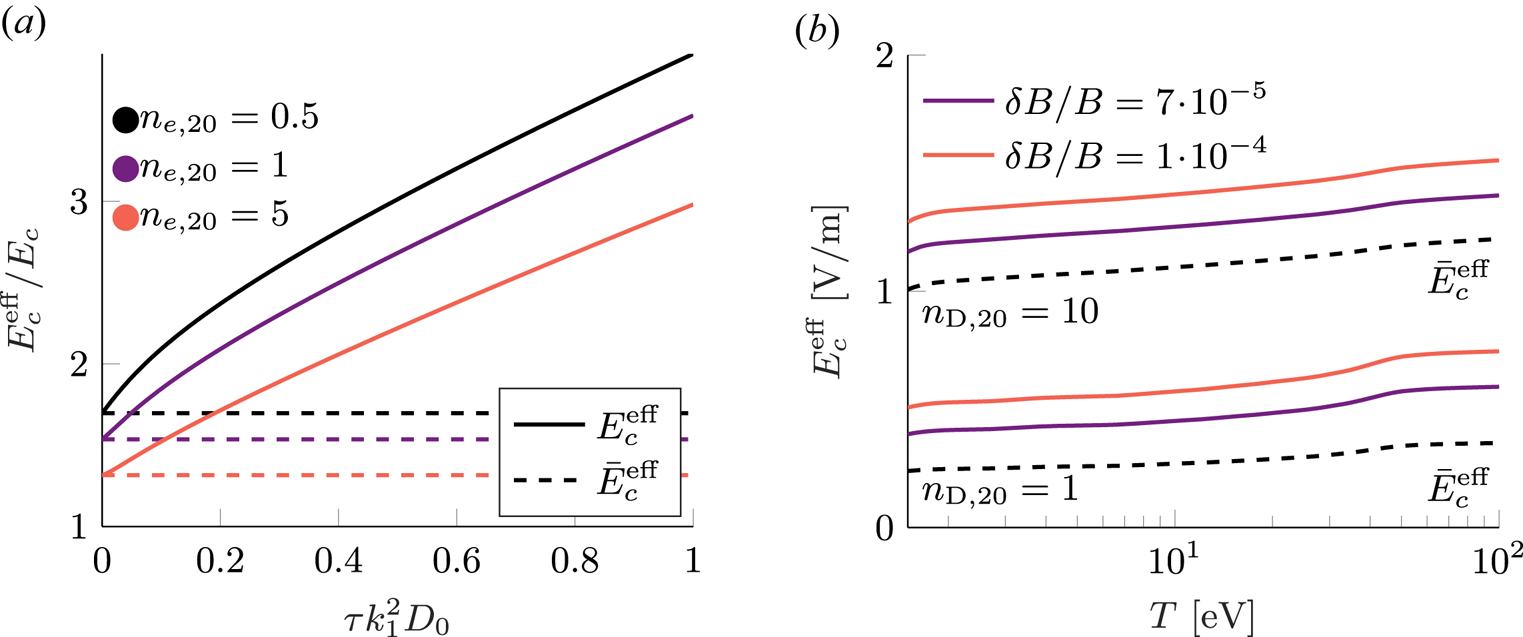
Figure 2(b) shows the critical effective field as a function of temperature, which introduces screening effects at the lowest temperatures, where some electrons remain bound to ions. The ionisation states are determined here by assuming equilibrium based on the Atomic Data and Analysis Structure (ADAS) coefficients of ionisation and recombination.Footnote 5
In absolute units, the correction to the effective critical field strength increases with temperature, primarily due to the increase in free electrons which raises  $E_c$. Massive material injection will also raise the density and so the critical electric field for runaway generation. We see from figure 2(b) that this effect can be combined with the effect of spatial diffusion to further raise $E_c^{\text {eff}}$. However unlike massive material injection, where changes to $E_c^{\text {eff}}$ are linked to changes in the electron density, the correction based on magnetic perturbations is only weakly dependent on the density (as long as perturbation strength is treated independent of plasma density), in absolute units. This weak dependence follows as $\tau \gamma _r / E$ is density independent and therefore any sensitivity originates from only $\bar {E}_c^{\text {eff}}$ and the large- $p$ dependence of $U$. Further, as was shown by Hesslow et al. (Reference Hesslow, Embréus, Wilkie, Papp and Fülöp2018b), the effect of partial screening on the critical electric field $\bar {E}_c^{\text {eff}}$ was to raise it to the order of $E_c^{\text {tot}}$, which has the same form as the usual Connor–Hastie expression $E_c$, but with the combined density of free and bound electrons instead of only the density of free electrons. Therefore, only a weak dependence of temperature is seen in figure 2(b), as the total number of electrons are kept fixed in these simulations. The two mechanisms for increasing the effective electric field (screening and magnetic perturbations) can therefore be combined. We note, however, that $\bar {E}_c^{\text {eff}}$ is only weakly dependent on the temperature and ionisation state.
The theory discussed so far, in which radial variations in the plasma have been neglected, allows for self-consistent analytic solutions to the distribution function and an understanding of the dependencies of the growth rate correction due to transport. However, in a tokamak disruption, the electric field dynamics is essential and will vary spatially through its dependence on plasma properties. Therefore, in the next section we take a perturbative approach to solving (3.5), to include effects due to radial plasma variation.
4. Transport in an inhomogeneous plasma
During the current quench of a disruption the flux surfaces are not completely stochastic. Instead, they often exhibit a mixed magnetic topology consisting of intact flux surfaces, magnetic islands and stochastic regions. In such circumstances, the transport will no longer be well described by the expression given by Rechester & Rosenbluth (Reference Rechester and Rosenbluth1978) and a more general transport model consisting of spatially dependent diffusive and advective components is often formulated, based on particle following simulations (Papp et al. Reference Papp, Drevlak, Pokol and Fülöp2015; Särkimäki et al. Reference Särkimäki, Hirvijoki, Decker, Varje and Kurki-Suonio2016). Assuming cylindrical symmetry, the transport term on the right-hand side of (3.5) becomes
 \begin{equation} \frac{1}{r} \frac{\partial }{\partial r} r \left(- \langle V \rangle_{\xi} + \langle D \rangle_{\xi} \frac{\partial }{\partial r} \right) F, \end{equation}
where  $\langle V \rangle _{\xi }$ is the pitch-angle average of the radial component of the advection coefficient defined equivalently to (3.7). Fundamentally, the above transport term conserves particle number, which is a property not guaranteed by an approximate perturbative solution. Therefore, this conservation property will be imposed on the solution to prevent anomalous losses of particles. Note, that the conservation of particle number is local, and particles can be lost at the edge.
The approach to solving the kinetic equation in the high-energy region with a momentum-space-dependent diffusion coefficient in the previous section, by means of a Bessel mode expansion, breaks down when a radial dependence is introduced in the plasma parameters. To include the effects of radially varying plasma parameters we instead perform an expansion in small radial transport compared with the electric field acceleration  $\alpha \ll 1$. The full form of $U$ gives $U=0$ in the vicinity of $p_{\max }$, so the transport would not be subdominant for such momenta. We therefore treat this with a simplified approach, taking $U = E - \bar {E}_c^{\text {eff}}$ which is similar to the advection in momentum space given by Helander et al. (Reference Helander, Eriksson and Andersson2000), modified to include the effects of an increased critical electric field due to screening. In this model, the advection in momentum space does not vanish, and in the previous section, we saw that the full $U$ approaches this in the limit of large electric field. As this model does not treat the effects of radiation correctly, it may be seen as a better approximation significantly below $p_{\max }$. As the assumed transport coefficients and particle density decrease with momentum in avalanche dominated scenarios, these lower-energy scales are anyway expected to dominate the transport here. We also demonstrate explicitly the weak sensitivity of the results to $p_*$.
Given this model for  $U$, the zeroth-order solution given by neglecting the transport, so the solutions at different radii are independent, is
 \begin{equation} F_0(p, r, t) = n_{\text{RE}}(r, t) \frac{\gamma_r \tau }{E - \bar{E}_{c}^{\text{eff}}} \exp({- \gamma_r \tau (p - p_*)/(E - \bar{E}_{c}^{\text{eff}})}), \end{equation}
which is consistent with the incoming runaway electron flux  $\gamma _r n_{\text {RE}}$ and respects the definition of $n_{\text {RE}}$ in (3.4). Under the assumption that the radial transport is small this distribution may be used to evaluate the transport term. Integrating (3.5) over $p$ then gives
 \begin{equation} \frac{\partial n_{\text{RE}}}{\partial t} + \frac{1}{r}\frac{\partial }{\partial r}\left( r \varGamma_0 \right) = \gamma_r n_{\text{RE}}, \end{equation}
where the term on the right-hand side represents the source of runaway electrons and
 \begin{equation} \varGamma_0 = \int_{p_*}^{\infty}\; \left(\langle V \rangle_{\xi} F_0 - \langle D \rangle_{\xi} \frac{\partial }{\partial r}F_0\right)\, \textrm{d}p \end{equation}
is the radial flux of the runaway electrons. Using (4.2) for  $F_0$ to evaluate $\varGamma _0$ results in a form $\varGamma _0 = \bar {\varGamma }_0 n_{\text {RE}} + \tilde {\varGamma }_0 \partial _r n_{\text {RE}}$ and (4.3) can be stably solved numerically using a method based on the Crank–Nicholson scheme. This transport model can be incorporated into any suitable runaway simulation to similarly capture the effects of transport due to magnetic perturbations. In the following subsections, the transport model is integrated with the electric field evolution, but it should be noted that the momentum space shape of the distribution function (4.2) is insensitive to the electric field strength, due to the appearance of the ratio $\gamma _r / (E - \bar {E}_c^{\text {eff}})$, which is consistent with the neglect of the temporal evolution of $E$ in its derivation.
4.1. Simplified disruption simulations including the effect of radial transport
Under normal operation of a tokamak there are radial gradients in the temperature and plasma current, both of which contribute to a radially varying electric field as the plasma is suddenly cooled in a disruption. The subsequent evolution of the electric field is described by the induction equation, which for a plasma with only radial variations is (Smith et al. Reference Smith, Helander, Eriksson, Anderson, Lisak and Andersson2006)
 \begin{equation} \frac{1}{r}\frac{\partial }{\partial r}r\frac{\partial E_{\|}}{\partial r} = \mu_0 \frac{\partial j_{\|}}{\partial t}, \end{equation}
where  $E_{\|}$ and $j_{\|}$ are the electric field strength and the current density along the plasma cylinder.
The time evolution of the electric field is dependent on its radial profile, as the current  $j_{\|}$ has both an Ohmic and a runaway component: ${j_{\|} = \sigma _{\text {sp}} E_{\|} + j_{\text {RE}}} \approx \sigma _{\text {sp}} E_{\|} + ecn_{\text {RE}}$ where $\sigma _{\text {sp}}$ is the Spitzer conductivity (Spitzer & Härm Reference Spitzer and Härm1953). Accordingly, the radial profile of runaway generation also plays a crucial part in understanding the electric field evolution. Furthermore, the avalanche growth rate is proportional to the electric field strength, for fields that are large compared with the critical one, such that the cumulative generation is highly dependent on the evolution of the electric field. Consequently, for a self-consistent treatment of both the electric field dynamics and runaway generation, it is of the utmost importance to be able to treat the runaway generation in a region of space with an electric field gradient. Such computations can be carried out within the go-framework (Smith et al. Reference Smith, Helander, Eriksson, Anderson, Lisak and Andersson2006; Fehér et al. Reference Fehér, Smith, Fülöp and Gál2011; Vallhagen et al. Reference Vallhagen, Embreus, Pusztai, Hesslow and Fülöp2020) or similar codes. Introducing the effect of transport losses into such a model, including the effects of impurities and allowing for partial screening, would allow us to quantify the reduction given by transport of the total number of runaway electrons at the end of a disruption.
To achieve this, we have extended the go-framework to solve the coupled equations (4.3) and (4.5). The runaway generation and transport are described by (4.3), whereas the runaway electron dynamics couples to the electric field evolution through the current term in (4.5). The right-hand side of the former includes primary sources of runaway electrons: Dreicer generation, tritium decay and Compton sources. When avalanching dominates, as is the case for high-current devices, the flux  $\varGamma _0$ derived using only the avalanche source should be valid as it describes the momentum space distribution of the majority of the population. Finite-aspect-ratio effects on the generation are neglected here, as recent work by McDevitt & Tang (Reference McDevitt and Tang2019) indicate that their effect is negligible at the high densities and electric fields that we consider here.
In the go-framework, the Dreicer generation is evaluated using a neural network (Hesslow et al. Reference Hesslow, Unnerfelt, Vallhagen, Embreus, Hoppe, Papp and Fülöp2019b), trained on kinetic simulations with code (Landreman, Stahl & Fülöp Reference Landreman, Stahl and Fülöp2014), using the collision operator that includes the effect of partially ionised impurities given by Hesslow et al. (Reference Hesslow, Embréus, Hoppe, DuBois, Papp, Rahm and Fülöp2018a).  $\beta$-decay of tritium will also result in a source of runaway electrons, which in the deuterium–tritium phase of operation is expected to be the dominant source of seed electrons in ITER in the absence of hot-tail electrons (Martín-Solís et al. Reference Martín-Solís, Loarte and Lehnen2017). Furthermore, neutrons produced in the fusion reactions will activate the wall which, in turn, will emit $\gamma$-photons. Through Compton scattering events between the $\gamma$-photons and the bulk electrons, runaway electrons can be generated (Martín-Solís et al. Reference Martín-Solís, Loarte and Lehnen2017; Vallhagen et al. Reference Vallhagen, Embreus, Pusztai, Hesslow and Fülöp2020). In the simulations presented here, we neglect the hot-tail generation occurring in a rapidly cooling plasma. This generation occurs during the thermal quench which is typically associated with large magnetic fluctuations and corresponding transport. By neglecting the hot-tail seed we implicitly assume that the transport during the thermal quench is large enough to lead to the prompt loss of these runaways.
The go-framework has the capability to compute the plasma temperature evolution from the energy balance between heat diffusion, Ohmic heating, line radiation, bremsstrahlung losses and ionisation, as presented by Vallhagen et al. (Reference Vallhagen, Embreus, Pusztai, Hesslow and Fülöp2020). However, in the initial phase of the disruption, the energy loss is expected to be dominated by the magnetohydrodynamic (MHD) contribution, due to its strong temperature scaling of approximately  $T^{5/2}$ (Ward & Wesson Reference Ward and Wesson1992). This phase is, for simplicity, modelled as an exponential drop in temperature until the temperature of the inner part of the plasma drops to about $100\ \textrm {eV}$, with the form
 \begin{equation} T(r, t) = T_{{f}}(r) + (T_{{i}}(r) - T_{{f}}(r)) \,\textrm{e}^{- t / t_0}, \end{equation}
where  $t_0$ is the time constant for the thermal quench and $T_{{i}}$ and $T_{{f}}$ are the initial and final temperatures, respectively. This mode of the temperature evolution uses a flat final temperature profile $T_{{f}} = 50\ \textrm {eV}$ and is used for 6 ms with a time constant of $t_0 = 1\ \textrm {ms}$. After this time the temperature is evolved based on the energy balance. The ionisation states in the background plasma are evolved in time based on the ADAS coefficients for ionisation and recombination.
4.2. Simulations of ITER-like disruptions with uniform perturbations
To investigate the large-scale effect of radial transport, in tokamak disruption scenarios where the runaway generation is expected to be dominated by the avalanche mechanism, an ITER-like case with deuterium and neon injection was simulated using the go-framework. The parameters considered are the same as those used by Martín-Solís et al. (Reference Martín-Solís, Loarte and Lehnen2017) and Vallhagen et al. (Reference Vallhagen, Embreus, Pusztai, Hesslow and Fülöp2020): initial plasma current  $I_p(t = 0) = 15\ \textrm {MA}$, minor and major radii $a = 2\ \textrm {m}$ and $R = 6.2\ \textrm {m}$, respectively, initial electron, deuterium and tritium densities $n_{e0} = 2 n_{D0} = 2 n_{T0} = 10^{20}\ \text {m}^{-3}$. The simulation was initiated with one-dimensional profiles in temperature $T_{{e}} = 20[1 - (r/a)^2]\ \textrm {keV}$ and current density $j_{\|}(t = 0) = j_0 [1 - ( r / a )^2]^{0.41}$, where $j_0$ is chosen so that the current integrates to 15 MA.
At the start of the simulations we assume a rapid injection of deuterium and neon, with respective densities  $n_{{D}}$ and $n_{\text {Ne}}$, where the impurity is distributed uniformly throughout the plasma in the neutral state. The current evolution for three such scenarios with different combinations of injected neon and deuterium is demonstrated in figure 3, for a set of radially constant magnetic perturbation levels and a momentum-space-dependent diffusion coefficient of the form (3.14). The three cases considered are the same as those investigated in Vallhagen et al. (Reference Vallhagen, Embreus, Pusztai, Hesslow and Fülöp2020) and denoted both here and there as Case 1, Case 3 and Case 4.Footnote 6 In each of these cases the injected material is large enough to induce a complete thermal quench: Case 1 ( $n_\textrm {Ne}=1\times 10^{20}\ \textrm {m}^{-3}$, $n_{D}=0$), Case 3 ( ${n_\textrm {Ne}=8\times 10^{18}\ \textrm {m}^{-3}}$, $n_{D}=4\times 10^{21}\ \textrm {m}^{-3}$) and Case 4 ( $n_\textrm {Ne}=8\times 10^{18}\ \textrm {m}^{-3}$, $n_{D}=7\times 10^{20}\ \textrm {m}^{-3}$). In the absence of perturbations large runaway currents were obtained in all of these three cases, even without hot-tail generation.
Evolution of current carried by runaway electrons in an ITER-like disruption in the presence of magnetic perturbations. The magnitude of  $\delta B / B$ is shown by the text and colour in the figure. Three cases of injected material are considered: a pure neon injection with density $n_{\text {Ne}} / n_{e0} = 1$ (Case 1), and two cases with the same amount of injected neon $n_{\text {Ne}} / n_{e0} = 0.08$, but different amount of injected deuterium $n_{{D}} / n_{e0} = 40$ (Case 3) and $n_{{D}} / n_{e0} = 7$ (Case 4). The coloured area corresponds to $p_*$ in the range 0.1–1.

Interestingly, the maximum runaway current increases for small transport coefficients ( $\delta B / B \simeq 2\times 10^{-4}$) compared with the baseline case of no radial transport, as the runaway electron seed is radially flattened by the transport. This agrees with previous results by Fehér et al. (Reference Fehér, Smith, Fülöp and Gál2011). However, for large enough perturbations, we note a reduction of the maximal current carried by the runaway electrons. How large the reduction is depends on the particular scenario. Case 4, with a combination of moderate neon and deuterium injection, shows the largest reduction.
The effectiveness of the radial transport in modifying the runaway evolution is closely related to the timescale of the current evolution. In general, the longer the timescale of the current quench the more pronounced is the effect of transport, as particles have more time to be transported out of the plasma. Owing to this effect, Case 4 has a slower growth rate of runaway electrons than in Cases 1 and 3, diffusion therefore having a larger effect, as can be noted in figure 3.
Figure 4 shows the maximum runaway current, just before the onset of the dissipation phase where the plasma current carried by the runaway electrons decays, in the three cases as a function of  $(\delta B/B)^2$. We note that almost full suppression of the runaway current can be achieved in Case 4, for a normalised perturbation $\delta B/B \simeq 5\times 10^{-4}$. We also show the time it takes for the runaway current to rise from $10\,\%$ to $90\,\%$ of its maximum value, denoted by $t_{10\text {--}90}$, for $\delta B / B = 2\times 10^{-4}$. Clearly, Case 4 has considerably longer $t_{10\text {--}90}$ than the other two and this is the main reason for the larger suppression. The diffusion timescale can be estimated to be $t_\textrm {diff}=a^2/\langle D_0\rangle \simeq a^2/ ({\rm \pi} \langle q \rangle R c) (\delta B / B )^{-2}$, and is $17\ \textrm {ms}$ for $\langle q \rangle \simeq 1$ and $\delta B / B = 2\times 10^{-4}$. Here, $\langle \cdots \rangle$ denotes a volume average. We note that the uncertainty in $p_*$ influences the result, but the effect of the magnetic perturbation is clearly dominant.
Runaway current in ITER-like disruptions in the presence of magnetic perturbations. The maximum current carried by the runaways is shown against the square of the magnetic perturbation level, which is proportional to the transport coefficient. The upper axis label shows the diffusion timescale  $a^2/\langle D_0\rangle$. The shaded area corresponds to the range of $p_*$ shown in figure 3. The time for the runaway current to rise from $10\,\%$ to $90\,\%$ of its maximum value, $t_{10\text {--}90}$, is shown in the figure for $\delta B / B = 2\times 10^{-4}$.
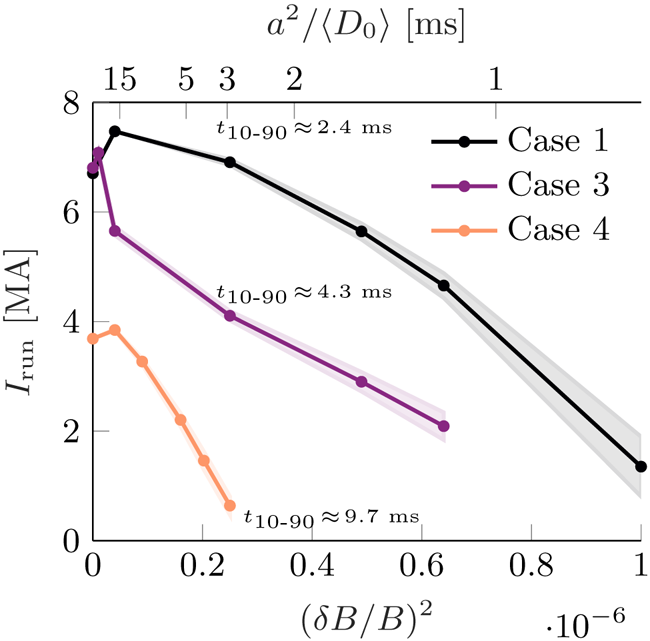
When the runaway plateau phase is reached in the final stages of the disruption the loss of plasma current is dominated by the loss of runaway electrons. If the time derivative of the Ohmic current is neglected in (4.5), combining with (4.3) yields an approximate equation for the electric field in the runaway plateau,
 \begin{equation} \frac{1}{r}\frac{\partial }{\partial r}r\frac{\partial E_{\|}}{\partial r} \approx \mu_0 c e \left( \gamma_r(E_{\|}) n_{\text{RE}} - \frac{1}{r}\frac{\partial }{\partial r}\left(r \varGamma_0\right) \right). \end{equation}
Based on this expression the decay of the plasma current is
 \begin{equation} \frac{\partial I_p}{\partial t} =\frac{2{\rm \pi} a}{\mu_0} \frac{\partial E_{\|}}{\partial r}\Big|_{r = a} \approx 2{\rm \pi} e c \left(\int_{0}^{a}dr\; r \gamma_{r}(E_{\|}) n_{\text{RE}} - a \varGamma_0(r = a)\right), \end{equation}
for a given radial profile of the runaway electron density. This approximation recovers the electric field structure in the current decay phase to a large extent, however an even simpler consideration can be made where the local growth of runaway electrons is set to zero, in (4.3), which in terms of (4.7) corresponds to neglecting the left-hand side of the equation. Using the expression for the uncorrected growth rate under consideration here (3.12) yields an explicit expression for the electric field given a profile  $n_{\text {RE}}$. Figure 5 shows the electric field obtained in the simulations corresponding to the cases shown in figure 3, together with the electric field strength which zeros the local growth of runaway electrons. The electric field profiles are seen to agree with one another in regions with small gradients in $E$ and especially in the central part of the plasma, which is related to the neglected term from (4.7). Therefore, the electric field is generally higher than the threshold field for runaway generation $\bar {E}_c^{\text {eff}}$ in the centre of the plasma, where there is a balance between the generation and transport. However, close to the edge the current density is low enough so that the prefactor on the source term in (4.7) is small enough to allow a significant deviation below $\bar {E}_c^{\text {eff}}$. Furthermore, in the cases with large transport, the electric field in the central region is not as flat as $\bar {E}_c^{\text {eff}}$. Instead, it has a similar functional form to the runaway current profile, indicating that it is the transport which dominates the electric field in the plateau phase. In these situations, the electric field is highly dependent on the profile of runaway electrons, which, in turn, depends on the full temporal evolution of the system and, in particular, the transport coefficients. This suggests that approaches where the current decay phase is described by $\bar {E}_c^{\text {eff}}$ are only valid if the transport is negligible, otherwise the coupled dynamics with the runaway electrons must be considered.

5. Runaway dynamics in the presence of artificial resonant perturbations
The magnetic field is expected to become fully stochastic at the end of the thermal quench, after which it begins to heal during the current quench. To mimic the conditions during the current quench in ITER, we choose the 15 MA/5.3 T baseline scenario (Parail et al. Reference Parail, Albanese, Ambrosino, Artaud, Besseghir, Cavinato, Corrigan, Garcia, Garzotti and Gribov2013) and introduce artificial resonant magnetic perturbations at the plasma edge to create a stochastic layer. We have chosen the pre-disruption current flat top equilibrium for this exercise as obtaining realistic current quench equilibrium would require dedicated MHD modelling. The introduced perturbations are stationary and have a helical structure,
 \begin{equation} \delta \boldsymbol{B} = \boldsymbol{\nabla}\times\sum_{n,m}\alpha_{nm}(r)\cos(n\zeta- m \theta - \phi_{nm})\boldsymbol{B}, \end{equation}
where  $(\theta , \zeta )$ are the poloidal and toroidal Boozer coordinates, respectively, $\boldsymbol {B}$ is the unperturbed field and the phase $\phi _{nm}$ is chosen to be random. This method is the same as used in Särkimäki et al. (Reference Särkimäki, Embreus, Nardon and Fülöp2020), and also here the total perturbation consists of several modes with low mode numbers $(n,m \lesssim 20)$. The mode eigenfunctions are Gaussians,
 \begin{equation} \alpha_{nm} = \exp\left(\frac{(r-r_{nm})^2}{2\sigma^2}\right), \end{equation}
that peak at the corresponding resonance  $r_{nm}$ and all have the same width $\sigma =0.03$ m which is large enough for the modes to overlap and create a continuous stochastic region. The perturbation level is set to $\delta B/B \approx 10^{-3}$ at which significant runaway transport is expected (Helander et al. Reference Helander, Eriksson and Andersson2000). The resulting field is illustrated in figure 6. The transport coefficients are evaluated numerically with the orbit-following code ASCOT5 (Varje et al. Reference Varje, Särkimäki, Kontula, Ollus, Kurki-Suonio, Snicker, Hirvijoki and Äkäslompolo2019). Markers representing guiding centers of collisionless electrons were traced in the perturbed field, and their radial position was recorded for each orbit. As particles with finite orbit width oscillate radially during their orbit, the radial position was always recorded at the same poloidal position (at the outer mid-plane) so that all changes in the radial position were due to the transport alone. No collisions, electric field or radiation reaction force was present in the simulation to isolate the transport due to the magnetic field perturbations and to keep momentum constant in order to calculate momentum dependent coefficients.
Magnetic field Poincaré plot at the outer mid-plane for an ITER current flat-top equilibrium perturbed with artificial resonant magnetic perturbations according to (5.1). The stochastic region begins at  $r/a\approx 0.6$ ( $q=1$ surface is at $r/a\approx 0.5$).
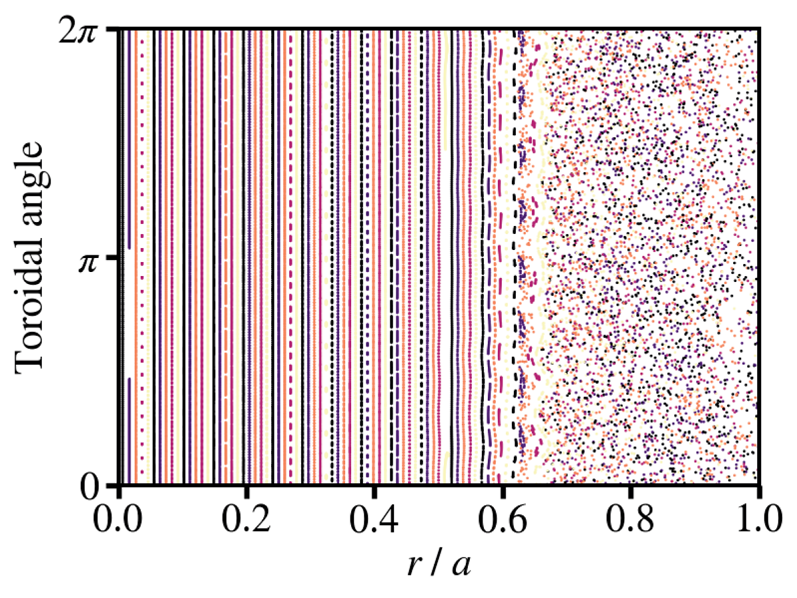
The transport coefficients are evaluated from the recorded radial positions as
 \begin{gather} V = \frac{1}{N}\sum_{i = 1}^N\left\langle\frac{\Delta r}{\Delta t}\right\rangle_i, \end{gather}
 \begin{gather}D = \frac{1}{N}\sum_{i = 1}^N\left\langle\frac{(\Delta r)^2}{\Delta t}\right\rangle_i, \end{gather}
where the brackets denote an average over all collected data points for a marker  $i$,
$i$,  $\Delta t$ is the orbit circulation time, $\Delta r$ is the change in radial position between subsequent recordings and the sum is taken over all $N$ markers that were traced. This scheme is similar to that originally presented by Boozer & Kuo-Petravic (Reference Boozer and Kuo-Petravic1981). At the edge markers are lost within a few orbits, making estimates (5.3) and (5.4) unreliable, and so the coefficients are evaluated from the loss-time distribution using the method described by Särkimäki et al. (Reference Särkimäki, Hirvijoki, Decker, Varje and Kurki-Suonio2016, Reference Särkimäki, Embreus, Nardon and Fülöp2020). This latter method is used if more than half of the markers are lost.
Markers are simulated for  $2\times 10^{-5}\ \textrm {s}$ which corresponds to approximately 100 orbit transit times. The simulation time has to be long enough as early on the particle orbits are correlated and the motion is not diffusive. However, longer simulation time decreases the radial resolution of the evaluated coefficients as $\Delta r \approx \sqrt {2Dt}$. The markers have identical radial position, pitch and momentum but a random toroidal location. The transport coefficients to be used in the go simulation are found by repeating the orbit-following simulation with different values of radius, pitch and momentum. In these simulations, the phase space is divided into 15 radial, 11 momentum and 10 pitch slots (covering the passing particle regime). For each volume element 200 markers are simulated to calculate the coefficients at that point. The resulting advection and diffusion coefficients are shown in figure 7 for a fixed pitch, as the coefficients show no strong pitch dependence as long as the particles are passing. Radially the transport is almost uniform in the region where the field is stochastic (recall figure 6) while the momentum dependence shows decreasing transport for higher energies due to the finite orbit width effects (Hauff & Jenko Reference Hauff and Jenko2009; Särkimäki et al. Reference Särkimäki, Embreus, Nardon and Fülöp2020).
Numerically evaluated (a) advection and (b) diffusion coefficients for the transport due to the stochastic field corresponding to the case shown in figure 6. The two-dimensional plots show the radial and momentum dependence of the advection and diffusion coefficients for a fixed pitch  $p_\parallel /p= 0.99$. Radial profiles at different energies are shown at the top. At the side, general momentum dependence is illustrated with a mean value calculated over each radial position.
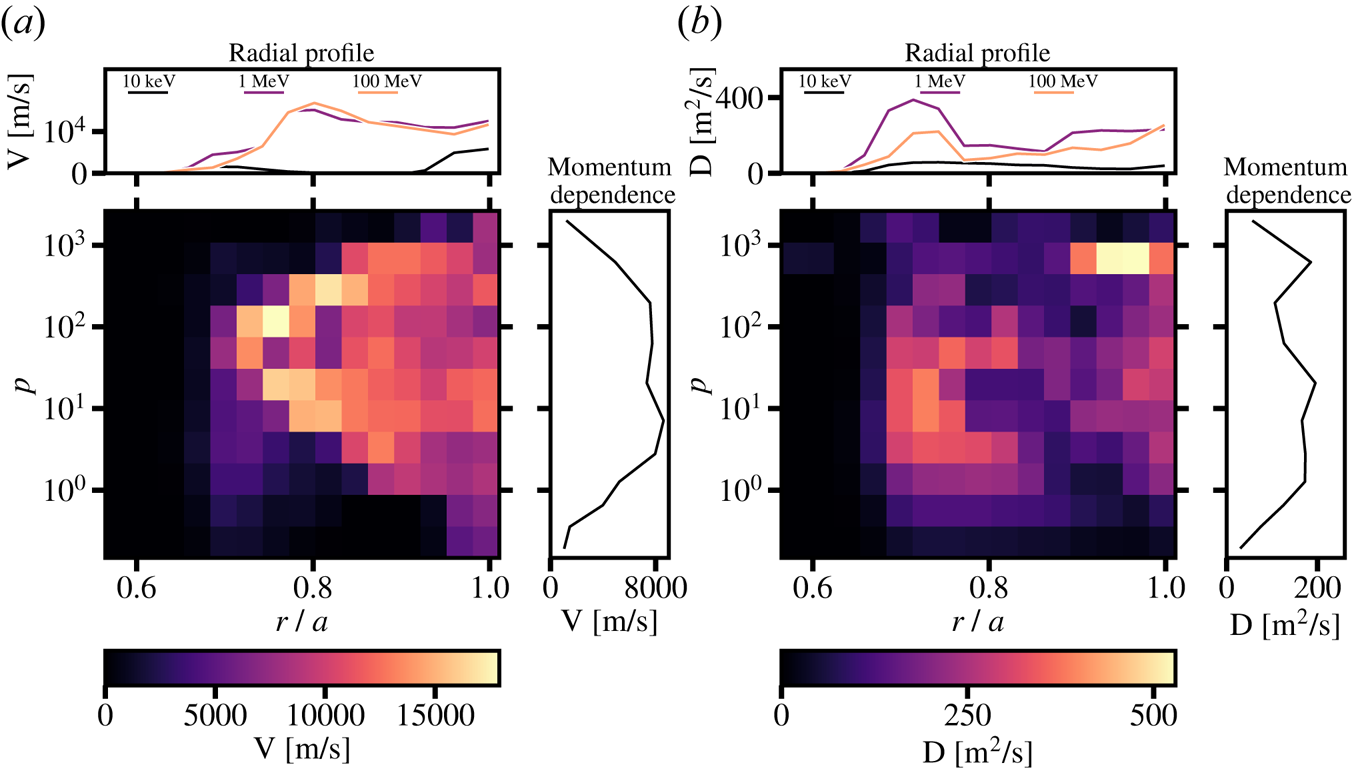
In the inner region of the plasma ( $r / a < 0.58$), the runaway electrons are not transported as the flux surfaces are intact, and markers initiated in the stochastic region will not be transported into this region. To properly capture this effect in a simulation with the go-framework, a reflective boundary condition was imposed at the first complete flux surface, and no transport could occur between the regions. However, the regions are still coupled through the electric field evolution.
In scenarios where the runaway generation is dominant in the central part (such as in Case 1 and Case 4) the stochastic plasma edge is not expected to affect the runaway dynamics significantly. By using the advection and diffusion coefficients shown in figure 7, and simulating an ITER-like scenario with material injection corresponding to Case 4, we find that the maximum runaway current is reduced only marginally, from 3.7 to 3.5 MA. To illustrate a case when the effect of a stochastic plasma edge is more pronounced, we consider Case 3, where in the absence of radial losses an off-axis final runaway profile is found. Therefore the transport should have a larger effect in this case compared with scenarios with an on-axis final current profile, where a larger part of the runaway electrons are generated in the non-transporting region.
Figure 8 shows the radial profiles of the runaway current after 45 ms in the ITER-like disruption simulation of Case 3. The maximum runaway current, just before the dissipation phase, in the absence of radial transport due to magnetic perturbations is 7 MA, with a constant  $\delta B / B$ is 5.8 MA and with the coefficients presented in figure 7 is 4.7 MA. Without magnetic perturbations, the profile of runaway electron density has an off-axis maximum. This is due to strong radiative losses, leading to significant plasma cooling, and corresponding efficient runaway generation in the outer part of the plasma, as was pointed out by Vallhagen et al. (Reference Vallhagen, Embreus, Pusztai, Hesslow and Fülöp2020). Note, that such off-axis current profiles may become MHD unstable. The resulting magnetic activity may act to mitigate the build up of runaways.
Radial profiles of the runaway current after 45 ms in the ITER-like disruption simulation of Case 3 without magnetic perturbations (dash-dotted), with radially constant magnetic perturbations  $\delta B/B=2\times 10^{-4}$ (dashed) and with the coefficients presented in figure 7 (solid). In the latter case, a strong current sheet develops at the interface to the stochastic region.
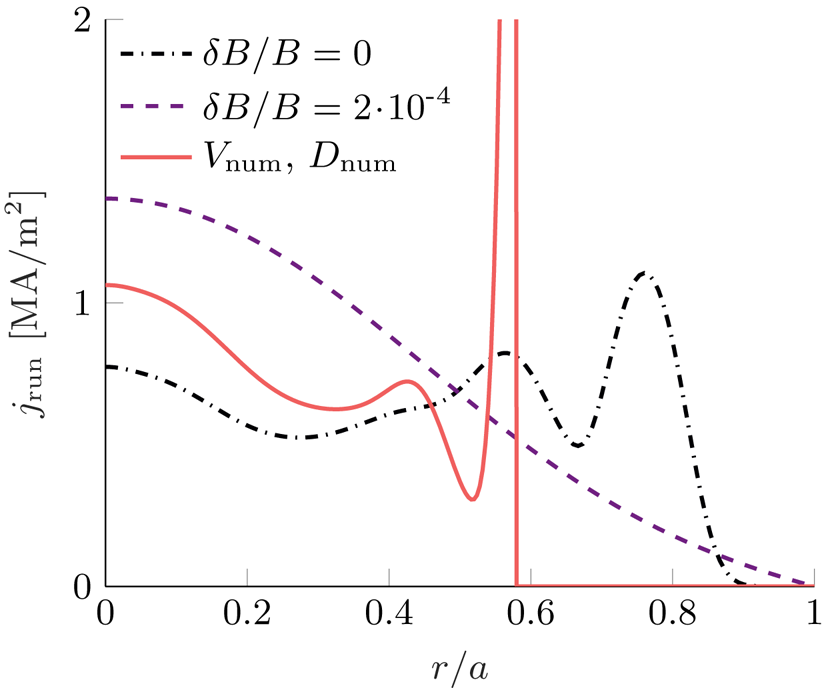
In the presence of magnetic perturbations electrons can diffuse and this results in a final runaway current profile that is peaked on-axis. However, in the case with the stochastic edge, with transport coefficients shown in figure 7, the transport in the edge region is strong enough to prevent any significant build up of runaway electrons there. The increase of the transport at the edge results in only partial reduction of the total runaway current, as the runaway population is free to build up in the centre of the plasma. In the confined inner region strong gradients in the current density can form, which is evident in the simulation. At the transition from the confined region to the stochastic one (at  $r/a=0.58$) a discontinuity is formed in the current profile (however, not in the electric field), as particles in the stochastic outer region are continuously transported away, but in the confined region they are free to build up, eventually forming a current sheet.
The radial profiles of the temperature, electric field and number of e-foldings (the time-integral of the runaway growth rate) are shown in figure 9 for Case 3, at a few time slices. The vertical dashed line denotes the radial position for the transition between confined and stochastic regions. Figure 9(a) shows that, both with and without perturbations, the plasma is divided into two regions by a cold front, with an inner region with a temperature of approximately 6 eV, and an outer region with a temperature as low as approximately 1 eV. At such low temperatures, a large fraction of the deuterium recombines, and this leads to an increased avalanche multiplication of the seed runaway electrons in the outer region, see figure 9(c), quantified by the number of e-foldings,Footnote 7
 \begin{equation} N_{\text{exp}}(r) = \int_{0}^{t}\,\textrm{d}t'\, \gamma(t', r). \end{equation}
The avalanche production continues throughout the simulation, but is counteracted by the strong radial transport in this region.
Radial profiles from the ITER-like disruption simulation in Case 3, with the transport coefficient presented in figure 7 (solid lines) and without transport of runaway electrons (dashed lines), at subsequent time slices. Radial profiles of (a) temperature, (b) electric field and (c) the number of e-foldings defined in (5.5). The time slices were chosen to highlight the formation of the current sheet in the case with transport, and are identified in (b). The dashed lines were taken at times such that the positions of the cold front were matched. The extra (gray) line in (c) gives the number of e-foldings at the start of the current decay phase. The vertical dashed line shows the onset of the stochastic region.
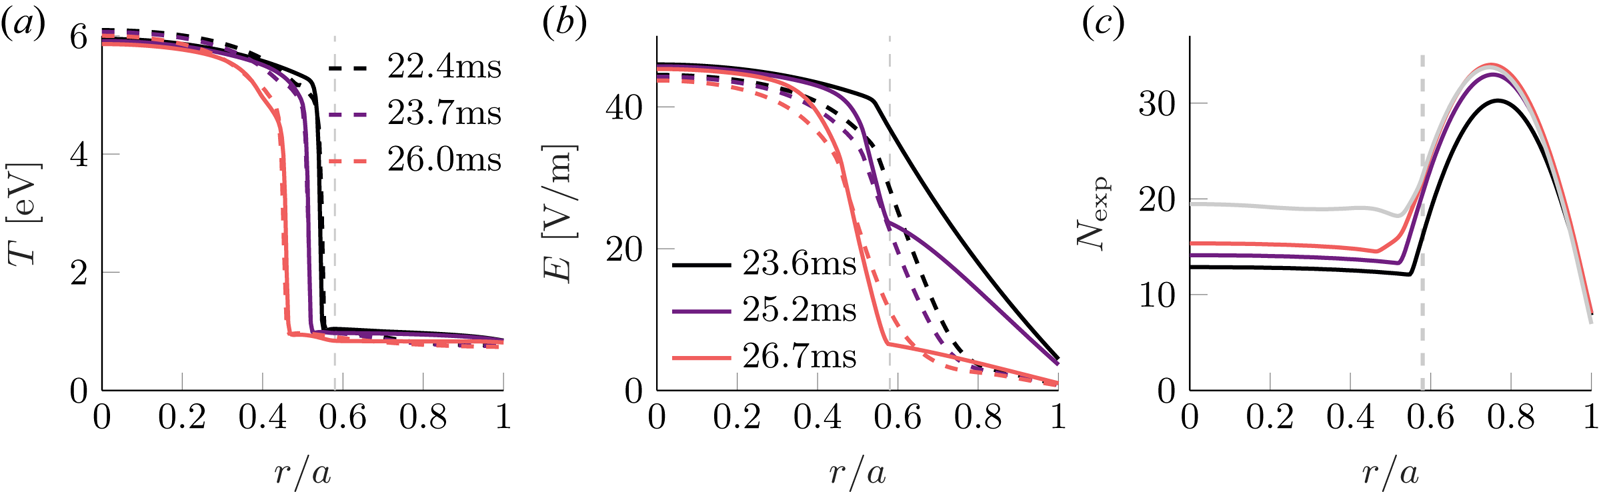
The formation and strength of the current sheet seen in figure 8 is a result of the interaction between runaway transport and strong diffusion of the electric field. The location is tightly connected to that of the cold front, which propagates in from the plasma edge in the later stages of the simulation. In the scenario without perturbations, the cold front propagates inwards faster. Figure 9 compares the evolution of the electric field in the two scenarios after the cold front has crossed out of the stochastic region, at times when the cold front has reached the same position, to highlight the dynamics behind the current sheet formation. In the case with transport there is less conversion from Ohmic to runaway current in the outer parts of the plasma, so a significantly larger electric field is maintained in the outer region, as is seen in figure 9(b). When the conversion starts in the inner regions, a sharp change in the gradient of the electric field develops at the interface to the stochastic region, which enhances the diffusion of the strong electric field in the inner region. This results in a larger avalanche multiplication of the seed runaway electrons in the boundary between the regions, which is demonstrated in figure 9(c). Despite the strong amplification in the outer region, the transport prevents a significant number of runaway electrons building up, and so the current sheet is formed.
Another way of thinking of this phenomenon is to consider the effect of the runaway electrons on the electric field evolution. As the transport in the outer region is strong enough to prevent a runaway build up, the runaways do not affect the electric field evolution, this is akin to the assumption of a trace electron population used in the estimate by Rosenbluth & Putvinski (Reference Rosenbluth and Putvinski1997), which leads to a very large amplification factor. However, the coupled dynamics must be considered in the presence of a large runaway population, and the amplification saturates as the current carried by the runaways in the inner region here approaches the Ohmic current. Then the current sheet is formed at the interface between the two regions. Such a current profile is likely to be very unstable, and this could affect the magnetic equilibrium and lead to magnetic perturbations penetrating deeper into the plasma core, giving further runaway mitigation. Such a study is beyond the scope of the current paper.
6. Conclusions
During tokamak disruptions, the magnetic field lines can be severely distorted from their usual confining structure. The magnetic topology evolves in time, being almost fully stochastic during the thermal quench, and often displaying a mixed topology of intact flux surfaces, magnetic islands and stochastic regions during the current quench. As runaway electrons travel rapidly along the tokamak magnetic field lines, their evolution during a disruption can be strongly affected by such magnetic perturbations. This introduces the possibility for radial losses of runaway electrons to offset the avalanche growth of the population, preventing the formation of a high current, potentially damaging, runaway electron beam.
In this paper, we have presented a model which generalises previous treatments of the effects of radial transport due to the interaction of runaway electrons with magnetic field perturbations on the runaway evolution. We continue to take advantage of the separation of timescales in the runaway generation dynamics, between the acceleration to relativistic energies after a knock-on collision and the characteristic avalanche population growth time. This allows us to neglect the effect of transport due to magnetic perturbations on the generation process and focus on solving the kinetic equation in the high-energy limit, which simplifies the collision operator. The extension here allows for a generalised pitch-angle distribution formed by rapid pitch-angle scattering at high energy, the effect of radiation reaction and the presence of partially ionised impurity atoms. The effect of including radiation is to introduce an upper limit in momentum space, so particles are prevented from reaching very high energies where they would be well confined.
In particular, we have determined an expression which can be used to correct the growth rate of the runaway electron population by the avalanche mechanism. This takes the form of the solution of an integral equation. The introduction of radial transport raises the effective critical electric field for avalanche generation because even though particles can be kicked into the runaway region through the avalanche mechanism, they can be lost due to spatial diffusion resulting in no net gain of runaways. The increase in  $E_c^{\text {eff}}$ is weakly dependent on the plasma density, unlike the case of massive material injection.
The derivation of the integral equation for the growth rate corrections is only valid when radial variations in the plasma are neglected. To treat non-homogeneous plasmas, a perturbation approach in small radial transport has been used to estimate the radial flux of runaway electrons. By computing the radial fluxes instead of an effective (local) growth rate the formulation is particle conserving. This flux can be included in general runaway simulation frameworks. The formulation was used here in a simplified disruption simulation for ITER-like plasmas, where an induction equation was used to give the self-consistent time evolution of the electric field in the presence of the runaways.
We find that in scenarios with a moderate amount of impurity and deuterium injection, the runaway current can be suppressed for perturbation levels of the order of  ${\delta B/B\sim 5\times 10^{-4}}$, which is about an order of magnitude higher than the perturbation level measured in fixed magnetic field experiments where the current was scanned (Gill et al. Reference Gill, Alper, de Baar, Hender, Johnson and Riccardo2002). Furthermore, it is difficult to fully dissipate the runaway electrons without significant transport in the centre where most of the runaway electrons are generated. Earlier results investigating the potential of employing edge-localised mode (ELM) coils for runaway suppression show that perturbations created at the plasma edge are generally not sufficient for runaway suppression in ITER (Papp et al. Reference Papp, Drevlak, Fülöp, Helander and Pokol2011). Perturbations at the edge might have an effect on scenarios with an off-axis runaway current profile, which can arise in the case of massive material injection (Vallhagen et al. Reference Vallhagen, Embreus, Pusztai, Hesslow and Fülöp2020). We have investigated such a scenario, using orbit-following simulations with ASCOT5 (Särkimäki et al. Reference Särkimäki, Embreus, Nardon and Fülöp2020) to determine the diffusion coefficients for energetic electrons in an ITER-like plasma with a stochastic region at the plasma edge. Disruption simulations with these diffusion coefficients show that the final runaway current can be reduced, but not suppressed completely, in agreement with the conclusions of earlier work.
The analysis presented in this paper is valid when the distribution function is in quasi-steady state, i.e. the runaway generation is balanced by transport, and the transport can be described by an advection–diffusion model. This assumption is not valid during the thermal quench phase in the disruption or in the presence of major magnetic islands in which a fraction of runaways could remain confined. Furthermore, a kinetic effect lacking in the model is the impact of diffusion on the avalanche generation dynamics at momentum scales close to the critical one. We anticipate that this effect could be small compared with the effects investigated so far, as the runaway electrons spend a comparatively short amount of time close to the critical momentum. Analytical progress in this direction would require the addition of a radial dimension in the full kinetic calculation with a source term to treat the dynamics close to the critical momentum, then the development of a solution to the kinetic equation valid for large momenta in the same calculation. Numerical progress, on the other hand, could be made directly by implementing the radial transport in kinetic frameworks. This would have the added benefit of capturing the pitch-angle dynamics in the presence of pitch-angle-dependent transport coefficients, an effect which has not been considered in the present work.
Acknowledgements
The authors are grateful to I. Pusztai, G. Papp, L. Hesslow, M. Hoppe and A. Tinguely for fruitful discussions. This work was supported by the European Research Council (ERC) under the European Union's Horizon 2020 research and innovation programme (ERC-2014-CoG grant 647121) and the Swedish Research Council (Dnr. 2018-03911).
Editor Per Helander thanks the referees for their advice in evaluating this article.
Declaration of interests
The authors report no conflict of interest.


 Open access