


1. Introduction
A precessing body is a rotating object whose axis of rotation undergoes a periodic change of its orientation. In case of a precessing container filled with a liquid, the force caused by precession directly acts on the liquid, thus driving a complex three-dimensional flow that is unstable and usually ends in a turbulent state (McEwan Reference McEwan1970; Vanyo & Likins Reference Vanyo and Likins1971; Vanyo Reference Vanyo1973, Reference Vanyo1991; Goto et al. Reference Goto, Ishii, Kida and Nishioka2007, Reference Goto, Matsunaga, Fujiwara, Nishioka, Kida, Yamato and Tsuda2014; Le Bars, Cébron & Le Gal Reference Le Bars, Cébron and Le Gal2015; Barker Reference Barker2016; Le Bars Reference Le Bars2016). Precessing flows are applied in technical devices because of their efficiency in mixing aimed at the homogenization of viscous fluids (Meunier Reference Meunier2020). Mixing inside a liquid goes along with a redistribution of the internal angular momentum and/or torque, which in the case of freely precessing bodies can lead to surprising changes in the orientation of the inertial axes so that, in turn, the stability of trajectories of flying and rotating bodies with liquid payload can be impacted (Vanyo & Likins Reference Vanyo and Likins1973; Rogers, Costello & Cooper Reference Rogers, Costello and Cooper2013). On a larger scale, precession also affects the stability of vortices in the atmosphere, for example the formation and decay of hurricanes (Reasor, Montgomery & Grasso Reference Reasor, Montgomery and Grasso2004) or the fluid flow in the liquid interior of planets, moons or asteroids (Le Bars Reference Le Bars2016). Indeed, precessional forcing is a promising additional source to explain the strong magnetic field of the ancient moon three to four billion years ago with a field strength comparable to that of the Earth's magnetic field today (Dwyer, Stevenson & Nimmo Reference Dwyer, Stevenson and Nimmo2011; Noir & Cébron Reference Noir and Cébron2013; Weiss & Tikoo Reference Weiss and Tikoo2014; Tikoo et al. Reference Tikoo, Weiss, Shuster, Suavet, Wang and Grove2017; Cébron et al. Reference Cébron, Laguerre, Noir and Schaeffer2019; Tikoo & Evans Reference Tikoo and Evans2022). Another example is the flow in the liquid core of the Earth, for which the forcing is rather strong due to the rather fast precession time scale of  ${\sim }26\,000\,\mbox {yrs}$ (compared with other planets in the solar system) and the large angle between rotation axis and precession axis ( ${\sim }23.5^{\circ }$). For many years it has been a subject of (still ongoing) discussion as to whether precession would be suitable to impact the electrically conducting fluid in the liquid interior of the Earth in a way such that a large-scale magnetic field can be generated (Stewartson & Roberts Reference Stewartson and Roberts1963; Malkus Reference Malkus1968; Vanyo Reference Vanyo1991; Le Bars et al. Reference Le Bars, Cébron and Le Gal2015), although it is generally assumed that the forcing mechanism for the geodynamo is thermal or chemical convection. In particular, for the early geodynamo, which already functioned shortly after the formation of the Earth (Tarduno et al. Reference Tarduno2020), precession could help to overcome inconsistencies related to the available energy budget (Olson Reference Olson2013). The question of precession-driven dynamos in liquid planetary cores is intimately connected with the energy budget which would be available for (self-)sustaining of the magnetic field (Landeau et al. Reference Landeau, Fournier, Nataf, Cébron and Schaeffer2022). A rough estimate of the order of the flow amplitude that is expected to be directly driven from precessional forcing shows that the corresponding flow probably is too small to sustain the Earth's magnetic field (Loper Reference Loper1975; Rochester et al. Reference Rochester, Jacobs, Smylie and Chong1975). However, in the turbulent case, it might be possible to maintain the geomagnetic field, if the parameters involved (shear, viscosity) adopt extreme values that lie at the edge of their assumed value range (Landeau et al. Reference Landeau, Fournier, Nataf, Cébron and Schaeffer2022). Indeed, from experimental investigations of precession-driven flows with a small precession angle, it is known that the directly driven flow is unstable, giving rise to chaotic small-scale flows as well as large-scale flow patterns different from the structure of the volume force due to the precession (Manasseh Reference Manasseh1992, Reference Manasseh1994, Reference Manasseh1996), a phenomenon that has been called resonant collapse (McEwan Reference McEwan1970). In this case, precession acts as a kind of catalyst that allows a transfer of kinetic energy from the rotational movement of the liquid into a different flow pattern that may be capable of generating a magnetic field via electromagnetic induction.
In order to examine the ability of a precession-driven flow to excite and sustain a magnetohydrodynamic dynamo, an experimental facility is under construction at Helmholtz-Zentrum Dresden-Rossendorf (HZDR), which will be used to drive a flow of liquid sodium solely by precession (Giesecke et al. Reference Giesecke, Albrecht, Gerbeth, Gundrum and Stefani2015a, Reference Giesecke, Vogt, Gundrum and Stefani2018; Stefani et al. Reference Stefani, Albrecht, Gerbeth, Giesecke, Gundrum, Herault, Nore and Steglich2015). In this experiment, named DRESDYN, the forcing of a fluid flow by precession will be realized in a cylindrical container, similar to the smaller experiment conducted by Gans (Reference Gans1970, Reference Gans1971) in the 1970s, where a threefold amplification of an external magnetic field was found, indicating that dynamo action can be expected in the vicinity of the transition from a laminar flow state to vigorous turbulence if the system is sufficiently large. This was recently supported by applying a combination of hydrodynamic experiments and numerical simulations with a kinematic dynamo model (Giesecke et al. Reference Giesecke, Vogt, Gundrum and Stefani2018, Reference Giesecke, Vogt, Gundrum and Stefani2019). In these studies, it was shown that, in the planned precession experiment, dynamo action is best possible in a parameter regime where the flow structure is determined by a combination of the non-axisymmetric directly forced flow and an axisymmetric double roll, which emerges in the transitional regime of the global flow state mentioned above. This transition goes along with a significant generation of a mean azimuthal circulation (zonal flow), which is known from earlier experiments (Kobine Reference Kobine1995, Reference Kobine1996), and recent simulations indicate that this is a feature specific for the large-angle precession (Lopez & Marques Reference Lopez and Marques2016).
The present study takes up this preliminary work and aims at a comprehensive classification of the flow state of a precession-driven flow in a cylindrical cavity. We are conservative regarding a classification as ‘laminar’ or ‘turbulent’, because in all cases large-scale components dominate the flow and in particular the Reynolds number that is achievable in the simulations is too low to associate the flow state with developed turbulence. Therefore, we label the individual regimes as subcritical and supercritical states with a transitional regime separating the two states (comparable to the classification of Pizzi et al. (Reference Pizzi, Mamatsashvili, Barker, Giesecke and Stefani2022) applying a low state and a high state). We focus on the series of changes that take place at the transition regime between subcritical and supercritical states, which represents the most striking phenomenon in the case of a large precession angle.
The outline of the study is as follows: in § 2 we list the basic equations and explain the set-up of our model. Our analyses are continued in § 3, where we characterize the spatial structure of the flow and the evolution of the kinetic energy when the forcing due to precession is increased. In § 4 we compare the amplitude of the directly forced flow with the result of the nonlinear model recently presented by Gao et al. (Reference Gao, Meunier, Le Dizès and Eloy2021). The extension of the expected flow behaviour to more extreme parameters that cannot be achieved in numerical simulations is carried out in § 5 by means of experimental observations at a down-scaled water experiment hosted at HZDR. Finally, we summarize and conclude our results in § 6.
2. Problem set-up and base state
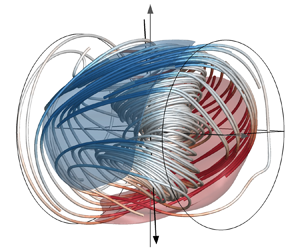
The general set-up used for the description of a precessing flow in a cylindrical cavity is sketched in figure 1. The system is determined by the height  $H$ and the radius $R$ of the cylinder. The direction of the motion of the container is described by the orientation of two rotation axes, which are given by the unit vectors ${\boldsymbol {k}}_{p}$ for the precession and ${\hat {\boldsymbol {z}}}$ for the rotation. The corresponding angular velocities are then given by $\boldsymbol {\varOmega }_{c}=\varOmega _{c}\hat {\boldsymbol {z}}$ due to the rotation of the container and $\boldsymbol {\varOmega }_{p}=\varOmega _{p}{\boldsymbol {k}}_{p}$ due to the precession of the rotation axis. The nutation angle $\alpha$ describes the relative orientation of $\boldsymbol {\varOmega }_{c}$ and $\boldsymbol {\varOmega }_{p}$ and is defined by $\cos {\alpha }=\boldsymbol {\varOmega }_{c} \boldsymbol {\cdot } \boldsymbol {\varOmega }_{p}/(\varOmega _{c}\varOmega _{p})$. In the present study we always assume $\alpha$ to be fixed at $90^{\circ }$. We further consider a fixed geometry with the aspect ratio $\varGamma =H/R=2$. In the following, we use the time scale $\varOmega _{c}^{-1}$ and the length scale $R$ so that ${\boldsymbol {u}}$ denotes the velocity in units of the rotation velocity at the outer boundary of the cylinder ( $\varOmega _{c} R$) and ${P}$ denotes the scaled pressure in units of $\varOmega _{c}^2R^2$.
Sketch of the cylindrical domain subject to precessional forcing with the illustration of the direction of rotation and precession axes. The grey grid in the meridional plane shows the distribution of the spectral elements utilized in the numerical simulations with the code SEMTEX.

In our analysis we refer to two different frames of reference. In the precession frame of reference the observer follows the rotational motion due to the precession ( $\boldsymbol {\varOmega }_{p}$) and looks at the spinning cylinder ( $\boldsymbol {\varOmega }_{c}$). Thus the observer rotates around ${\boldsymbol {k}}_{p}$ at $\varOmega _{p}$ whereas the cylinder axis (rotating along $\hat {\boldsymbol {z}}$) is fixed in this frame of reference. The fluid flow $\boldsymbol {u}$ is described by a Navier–Stokes equation that simply reads
 \begin{equation} \frac{\partial\boldsymbol{u}}{\partial t} + \boldsymbol{u} \boldsymbol{\cdot} \boldsymbol{\nabla} \boldsymbol{u} + 2{Po}\boldsymbol{k}_{p} \times \boldsymbol{u} ={-}\boldsymbol{\nabla} P + \frac{1}{Re} \nabla^2\boldsymbol{u},\end{equation}
where we introduce the Reynolds number,  $Re=\varOmega _{c}R^2/\nu$, defined with the rotation velocity of the outer wall, the kinematic viscosity $\nu$ and the Poincaré number $Po=\varOmega _{p}/\varOmega _{c}$. The boundary conditions applied in our models reflect the rotation of the container, i.e. $\boldsymbol {u}_{bc}={\boldsymbol {\varOmega }}_{c}\times \boldsymbol {r}$. Explicitly, this gives $u_{r,z}=0$ at $R=1$ and $z=\pm H/2=\pm 1$ and $u_{\varphi }=\varOmega _{c}r$ at $z=\pm 1$. Since it allows a simple numerical implementation which only requires appropriate boundary conditions for the description of the rotation of the cylinder, all numerical simulations are carried out in this reference system. This has the additional advantage that the flow structure, which in this reference frame is essentially dominated by a standing wave that goes along with a stationary geometric structure of the flow, allows a simple calculation of a mean flow.
In order to compute the time evolution of a precession-driven flow in a cylindrical container we use the code SEMTEX, which provides numerical solutions of the incompressible Navier–Stokes equations applying a coupled continuous-Galerkin nodal spectral element Fourier spatial discretization with semi-implicit temporal integration via a time-splitting scheme in Cartesian as well as in cylindrical coordinates. The algorithm is described in detail in Blackburn & Sherwin (Reference Blackburn and Sherwin2004) and Blackburn et al. (Reference Blackburn, Lee, Albrecht and Singh2019), including various test problems that demonstrate the robustness and accuracy of the scheme. Precessional forcing has been analysed with SEMTEX and shows a good agreement between flow data from simulations and experiments (Albrecht et al. Reference Albrecht, Blackburn, Lopez, Manasseh and Meunier2015a,Reference Albrecht, Blackburn, Meunier, Manasseh and Lopezb, Reference Albrecht, Blackburn, Meunier, Manasseh and Lopez2016; Giesecke et al. Reference Giesecke, Vogt, Gundrum and Stefani2018, Reference Giesecke, Vogt, Gundrum and Stefani2019). The code uses a standard Fourier decomposition in the azimuthal direction ( $\varphi$) and quadrilateral spectral elements with standard nodal Gauss–Lobatto–Legendre basis functions in the meridional plane $r,z$. Within a spectral element, the solution is approximated by a polynomial of degree eight. The maximum Reynolds number applied in our simulations is ${Re} = 10^4$. For larger values it is not possible to resolve the boundary layers while still maintaining a reasonable computation time on standard high-performance computing systems. We use a non-uniform grid with increasing resolution in the vicinity of the boundaries so that Ekman and Stewartson layers are properly resolved (see figure 1). All simulations start with a solid body rotation profile $\boldsymbol {u}(t=0)=\varOmega _{c} r {\boldsymbol {e}}_{\varphi }$ with the impact of precession being abruptly switched on at $t=0$.
For small precession ratios in the precession frame, the flow is predominantly co-rotating with the wall so that  $u \sim O(1)$. However, the usual disadvantage of the higher velocities in this reference frame, which is associated with smaller time steps in the numerical solution of the equations, turns out to be much less serious, since the typical flow velocities reach the same order of magnitude in both the precession frame of reference and the reference frame that is co-rotating with the container wall. In this reference system the precession axis is no longer stationary and the evolution of the flow is described by the incompressible Navier–Stokes equation, including the Coriolis force and a time-dependent volume force, the Poincaré force caused by the perpetual acceleration due to the periodic change of the orientation of the rotation axis. The equation reads (Tilgner Reference Tilgner1998)
 \begin{equation} \frac{\partial}{\partial t}{\boldsymbol{u}}+{\boldsymbol{u}}\boldsymbol{\cdot}\boldsymbol{\nabla}\boldsymbol{u}={-}\boldsymbol{\nabla}{P} \underbrace{-2({Po}\boldsymbol{k}_{p}+\hat{\boldsymbol{z}})\times{\boldsymbol{u}}}_{{Coriolis\ force}} \underbrace{-{Po}(\boldsymbol{k}_{p}\times\hat{\boldsymbol{z}}) \times\boldsymbol{r}}_{{Poincar{\unicode{x00E9}}\ force}\ \boldsymbol{F}_{p}}+\frac{1}{Re}{\nabla}^2{\boldsymbol{u}},\end{equation}
subject to no-slip boundary conditions  $\boldsymbol {u}_{bc}=0$ at all boundaries. The precession vector $\boldsymbol {k}_{p}(t)$ is now time dependent and executes a retrograde gyroscopic motion which causes the additional forcing term that describes the Poincaré force on the right-hand side of (2.2). The dynamically relevant part of the Poincaré force is $\boldsymbol {F}_{p}= -{Po}(\boldsymbol {k}_{p}(t)\times \hat {\boldsymbol {z}})\times \boldsymbol {r}= -r{Po} \sin \alpha \cos (t+\varphi )\hat {{\boldsymbol {z}}}$, which is responsible for the primary flow with an amplitude characterized by the Poincaré number ${Po}=\varOmega _{p}/\varOmega _{c}$. The structure of the forcing is antisymmetric with respect to the equatorial plane and proportional to $\cos \varphi$ in the azimuthal direction, which is immediately transferred to the geometric structure of the directly driven flow so that only a direct forcing of inertial modes with azimuthal wavenumber $m=1$ and with an odd axial wavenumber $k$ is possible. With an aspect ratio $\varGamma =H/R=2$ the simplest case (i.e. with the smallest possible wavenumbers) results in a characteristic flow pattern given by an axial recirculation, as shown in figure 2.
Streamlines of the directly forced flow with the simplest possible axial structure. This mode is an inertial wave that is standing in the precession frame of reference.

In the co-rotating frame of reference the directly forced flow constitutes an inertial wave that rotates opposite to the rotation of the container with the frequency of the cylinder, whereas in the precession frame of reference these modes are standing waves since the forcing has the frequency of the rotation of the cylinder. Higher inertial modes arise due to instabilities (Kerswell Reference Kerswell1999) or nonlinear (self-)interactions of the primary flow in the bulk and in the boundary layers (Meunier et al. Reference Meunier, Eloy, Lagrange and Nadal2008). However, according to Greenspan (Reference Greenspan1969), first-order nonlinear interactions are forbidden on the long time scale with an order given by the strength of the nonlinear terms. Therefore, it is usually assumed that all higher modes are predominantly generated due to interactions (linear and nonlinear) in the boundary layers. The breaking of the axial symmetry, i.e. the emergence of inertial modes with even axial wavenumber, was emphasized by Tilgner (Reference Tilgner2005), who found that the dynamo effect was more efficient (i.e. started at smaller magnetic Reynolds number or led to larger magnetic energies) if the axial symmetry of the flow was broken.
3. Dependence on the forcing by precession
3.1. Flow structure
Previously, we have described the base flow in a precessing container as a forced standing inertial wave superimposed on the solid body rotation caused by the spinning container. In a complementary approach, Busse (Reference Busse1968) assumed that the fluid flow in a precessing body obeys a uniform vorticity solution (as originally proposed by Poincaré Reference Poincaré1910) as the zeroth-order solution, and a balance of torques is responsible for maintaining a steady flow. The corresponding flow is a rotational motion around an axis which coincides neither with the rotation axis of the container nor with the precession axis. Physically, the existence of the distinguished rotation axis of the fluid is the result of a perpetual spin-up process that reflects the effort of the fluid to align the rotational motion due to the rotation of the container with the motion due to the precession, whose axis direction is permanently changing. The explicit calculation in a precessing spheroidal cavity includes the saturation due to the formation of boundary layers and yields an implicit equation for the fluid rotation axis  $\boldsymbol {\omega }_{f}$ (see also Noir et al. (Reference Noir, Cardin, Jault and Masson2003) for a calculation based on the balance of torques and the recent results from Kida (Reference Kida2020, Reference Kida2021) that include higher-order terms). The solution of Busse has the interesting property that, for fixed forcing and sufficiently large ellipticity, bistability exists in terms of two stable solutions with a possible abrupt transition between them. The transition features a hysteresis, which means that, when increasing the forcing, the transition to the supercritical state occurs at a critical Poincaré number ${Po}^{c}_{1}$ which is larger than the value ${Po}^{c}_{2}$ marking the transition from the supercritical state to the subcritical state when reducing the forcing. The theory has been confirmed in numerics (Tilgner Reference Tilgner1999; Tilgner & Busse Reference Tilgner and Busse2001) and experiments (Noir et al. Reference Noir, Cardin, Jault and Masson2003), and more recently it was adopted to the case of a precessing ellipsoid (Burmann & Noir Reference Burmann and Noir2022). However, Busse's theory cannot be straightforwardly applied to the case of the cylinder, because of the presence of corners at the end caps of the cylinder, which perform a rotational motion due to the precession and prevent the realization of a simple torque balance so that a uniform vorticity solution is not a good representation for a base state in a cylindrical geometry. This is also reflected, for example, in the emergence of wave beams originating in the corners or the emergence of turbulent injections from the sharp shear layer close to the sidewalls (Marques & Lopez Reference Marques and Lopez2015).
In the following, we examine the change in the geometry of the flow in dependence on the strength of the precession. For this we consider the time-averaged flow field defined as  $\langle \boldsymbol {u}\rangle =(\Delta t)^{-1}\int \boldsymbol {u}\,{\rm d} t$, where $\Delta t$ represents a time period in the statistical stationary regime. This representation reflects the flow behaviour rather well, which can be recognized by comparison with the time-resolved behaviour of the flow fields which is available as a supplementary movie available at https://doi.org/10.1017/jfm.2024.602. This visualization also shows that the scale of the spatial fluctuations decreases with increasing $Po$ and for large $Po$ these fluctuations form a (weak) wave pattern that rotates around the precession axis. Averaging in time, the fluctuations and the time–space periodic variations cancel out so that in all cases the overall structure is dominated by the non-axisymmetric mode with $m=1$, which is standing in the precessing system. This is illustrated in figure 3, which shows the structure of the core flow in the precessing cylinder for different precession ratios. These plots also show that, with increasing $Po$, the flow changes its azimuthal position and becomes more and more concentrated adjacent to the sidewall. The streamlines in the bulk visualize the presence and orientation of a particular fluid rotation axis whereas the iso-surfaces in the same figure denote the axial velocity $u_z$ at 50 % of the rotation velocity of the sidewall of the cylinder. For small forcing ( ${Po}=0.001$, figure 3a) it is justified to classify the internal bulk flow as a rotational motion around an own particular rotation axis, which is (slightly) different from the rotation axis of the cylinder. However, already the case ${Po}=0.01$ (figure 3b) demonstrates the impact of the end caps, which enforces the fluid rotation motion to be parallel to the end cap and thus cause a bending of the fluid rotation axis, leading to an S-shaped pattern. When the forcing is sufficiently large so that the angle between the fluid rotation axis and the rotation axis of the cylinder is large enough, the involvement of the end caps is reduced and the ‘bending’ of the fluid rotation axis decreases again.
Structure of the time-averaged flow. From (a) to (i),  ${Po}=0.001,0.01,0.05,0.075, 0.0875, 0.1,0.125,0.1375,0.2$. The streamlines represent the rotational fluid motion in the bulk. The coloured isosurfaces show the axial velocity $u_z$. The colour of the streamlines represents the axial flow as well. However, since this component is small in the region where the streamlines are calculated, the streamlines are mostly white, showing that the axial flow in this location is quite small.

We thus can identify two quasi-stationary states, one characterized by the fluid rotation axis being roughly directed parallel the rotation axis of the cylinder, and the second with the fluid rotation axis directed perpendicular to the direction of the rotation axis of the cylinder, with an abrupt transition between these states.
We emphasize that the flow in the bulk, which determines the rotational motion and hence the direction of the fluid rotation axis, is weak in comparison with the flow in the vicinity of the sidewalls, which – especially for large values of the Poincaré number in the supercritical region – is largely independent of the fluid rotation axis.
3.2. Kinetic energy
The change in the flow structure, as described in the previous section, is accompanied by a significant change in the amplitudes of the individual components of the flow. We will discuss this in the following in terms of the kinetic energy. For this discussion we switch to the co-rotating frame of reference, which better allows us to analyse the decomposition of the energy into axisymmetric and non-axisymmetric parts. This affects the axisymmetric part of the azimuthal component, since the associated transformation consists of only a rotation, leaving the other contributions unchanged.
3.2.1. Onset of the triadic instability
We start with weak forcing in figure 4, which shows the time evolution of the kinetic energy for the leading azimuthal wavenumbers  $m$ for four exemplary $Po$ with ${Po} \leq 0.0025$. Figure 4(a) represents the case ${Po}=0.001$, which is stable and time independent and only consists of the forced (resonant) mode corresponding to figure 3(a). Increasing $Po$, the $m=1$ contributions remain highly dominant in all cases (blue curves in figure 4), however, the directly driven flow is prone to a triadic resonance which adds two free inertial modes. Theoretical (Kerswell Reference Kerswell1999; Lagrange et al. Reference Lagrange, Meunier, Nadal and Eloy2011), experimental (Herault et al. Reference Herault, Giesecke, Gundrum and Stefani2019) and numerical (Albrecht et al. Reference Albrecht, Blackburn, Lopez, Manasseh and Meunier2015a; Giesecke et al. Reference Giesecke, Albrecht, Gundrum, Herault and Stefani2015b) investigations have proven the occurrence of triadic resonances in precession-driven flows and have demonstrated their characteristic properties in the form of selection rules for the wavenumbers and frequencies. These relations read $m_{f} = 1 = m_2-m_1, k_{f} = |k_2-k_1|$ and $\omega _{f} =1 = \omega _2-\omega _1$, with the triplet $\{m_{f},k_{f},\omega _{f}\}$ comprising the azimuthal wavenumber, axial wavenumber and the frequency of the directly forced mode and the triplets with the indices $1$ and $2$ describe the corresponding characteristics of two resonantly interacting free inertial modes. At aspect ratio $\varGamma =2$ the simplest possible triadic resonance that is involved with the forced mode at $m=1,k=1$ and $\omega _{f}=1$ emerges in terms of two free inertial modes with wavenumbers $m=5$, $k=1$ and $m=6$, $k=2$ (Lagrange et al. Reference Lagrange, Meunier, Nadal and Eloy2011; Marques & Lopez Reference Marques and Lopez2015; Lopez & Marques Reference Lopez and Marques2018). This instability sets in at ${Po}\approx 0.00125$ and can be identified in the temporal evolution of the kinetic energy by means of the flow contributions with $m=5$ and $m=6$, as shown in figure 4(b). The growth of these modes is accompanied by a corresponding drop in energy of the directly forced flow. The onset of the triadic instability complies with a first Hopf bifurcation from a standing wave to a rotating wave. However, the energies of the $m=5$ and $m=6$ contributions do not show any time dependency, because these modes exhibit a stationary geometric structure, which rotates with constant frequency around the axis of the cylinder.
(a–d) Kinetic energy of the flow contributions with the lowest azimuthal wavenumbers. From (a) to (d),  ${Po}=0.001,0.0015,0.002,0.0025$. Note that, for case (d), the final state is reached only after a second transition around $t=1000$ and $t=1500$. In these cases the periodic variation of the energies indicates the transition from rotating wave to a modulated rotating wave. In all cases we have ${Re}=10^4$, $H/R=2$, and $\alpha =90^{\circ }$.

If one increases the Poincaré number further, additional contributions with larger  $m$ appear (figure 4c) caused by interactions of the three initial modes among themselves. The emergence of the new modes is accompanied by a secondary transition to an oscillating energy that corresponds to the transition from a rotating wave to a modulated rotating wave. This secondary transitions occurs earlier when further increasing the forcing (see figure 4d). Furthermore, the amplitude of the oscillations increases as well as the number of involved frequencies. In figures 4(c) and 4(d) four different branches of solutions can be identified. In figure 4(c) we recognize two different behaviours: for $t \in [500,1000]$ and for $t>1000$. In the first interval, there are no oscillations so the solution looks like the solution of figure 4(b). This behaviour is unstable, since the final state ( $t>1000$) displays oscillations. Dynamically speaking, this means that the solution is approaching, for $t \in [500,1000]$, an unstable configuration with the same dynamical properties (non-oscillatory) as the solution of figure 4(b). This configuration is unstable since the final state is oscillatory, indicating a Hopf-like bifurcation, which basically consists in adding a new temporal frequency to the flow. This final state is a modulated rotating wave, so branch 2 appears to be due to a second Hopf bifurcation. However, the first part of figure 4(d) (unstable up to $t=1500$) seems to be not of the type of any final state of previous panels, so it should belong to another branch number 3, which may arise from further bifurcations on branch 2. The branch number 4 emerges for $t > 1500$ in figure 4(d) and seems to be related to branch 3 by means of period halving. All involved modes and their frequencies are still resulting from combinations of the originally occurring waves of the first instability and we do not observe the occurrence of a linearly independent (incommensurable) further triadic resonance. This is in contrast to the spherical Couette system, where the base flow is axially symmetric so that a first bifurcation is required in order to break this axisymmetry and therefore another incommensurable triad is observed (Garcia et al. Reference Garcia, Seilmayer, Giesecke and Stefani2020; Garcia, Giesecke & Stefani Reference Garcia, Giesecke and Stefani2021).
Figure 5 compares the growth rates calculated from the exponential growth of the kinetic energy of the unstable modes, as shown in figure 4, with the results calculated from the theory presented in Lagrange et al. (Reference Lagrange, Meunier, Nadal and Eloy2011) (dashed curve, calculated with their (4.17) adapted to the aspect ratio  $\varGamma =2.0$; see page 120 of Lagrange et al. Reference Lagrange, Meunier, Nadal and Eloy2011). For all $Po$ values the modes $m=5$ and $m=6$ exhibit a similar growth rate. We see a good agreement between theory and simulations, in particular the critical value of $Po$ that is required for the onset of the instability agrees nearly perfectly. However, for increasing forcing the growth rates from the simulations are systematically smaller than the theoretical predictions. This can be explained by the reduced theoretical model of Lagrange et al. (Reference Lagrange, Meunier, Nadal and Eloy2011) that only considers four different modes (namely the axisymmetric mode, the directly forced mode and the two free inertial waves with ${m=5,k=1}$ and ${m=6,k=2}$), whereas the simulations include further modes even at relatively low supercriticality (see figure 4c,d), which extract energy from the forced mode so that its amplitude decreases as soon as the free Kelvin modes appear (this can be seen explicitly in figure 10(a) later on). Another possible cause for the deviation might be that the theoretical model is only valid for the exact resonance so that detuning effects are neglected, and saturation is only caused by surface and volume viscous damping.
Growth rates calculated from numerical simulations in comparison with the weakly nonlinear theory developed in Lagrange et al. (Reference Lagrange, Meunier, Nadal and Eloy2011). The dashed vertical line at  ${Po}=0.00125$ denotes the threshold for the onset of the triadic instability.

3.2.2. Chaotic regime and transition
When further increasing the forcing parameter  $Po$, the behaviour of the flow becomes chaotic, but still results in a stationary state in the statistical sense. The time evolution of the kinetic energy for various cases with ${Po}\geq 0.01$ is shown in figure 6. Because of the coupling of the individual inertial modes, it makes less sense to consider individual $m$ so that we show the kinetic energy of the directly forced flow ( $m=1$, figure 6a) in comparison with the integrated energy of all higher non-axisymmetric modes with $m>1$ (figure 6b). As in the previous cases, we see a strong peak at the beginning, followed by a transient phase, which, depending on the precession ratio, lasts approximately ten to thirty rotation periods. Afterwards, the system is in a quasi-stationary state without regular periodic behaviour. We also see that the kinetic energy does not increase monotonically with the strength of the force. For instance, in figure 6(a), the energy at ${Po}=0.075$ is almost one order of magnitude larger than at the strongest forcing with ${Po}=0.2$. A particular case is ${Po}=0.1$ for which it takes a longer time period to reach a quasi-stable equilibrium which may indicate a bistable state, where the system needs some time to reach the final state. We also see that, for this $Po$, the proportion of contributions with $m>1$ is higher than for other parameters (see red curve in figure 6b), which indicates that the flow is more complex at ${Po}=0.1$. Finally, figure 6(c) shows the proportion of the axisymmetric contributions (red curve) in relation to the total kinetic energy (blue curve) for this case, and it is obvious that almost the entire kinetic energy of the axisymmetric contributions is contained in the azimuthal component (orange curve). Note that the energetic contributions of the poloidal component (green and violet curves) are enhanced by a factor of $10$ in order to make these contributions a little clearer.
(a) Time evolution of the kinetic energy of the flow, directly driven by precessional forcing for various values of  $Po$. (b) Higher non-axisymmetric contributions with $m>1$. (c) Time evolution of the kinetic energy for the particular case ${Po}=0.1$. The axisymmetric energy (red curve) reaches roughly 90 % of the total kinetic energy, and furthermore, is almost contained in the $\phi$ component (orange curve). Note that the curves for the energy from the $r$ and the $z$ components are enhanced by a factor of $10$. In all cases we have ${Re}=10^4$, $H/R=2$, $\alpha =90^{\circ }$ and time is denoted in terms of rotation periods.

Due to the moderate fluctuations of the kinetic energy around a mean value, it makes sense to consider the time-integrated values as a function of the forcing. Figure 7(a) shows the total kinetic energy (blue curve), and its decomposition into an axisymmetric part (red curve) and a non-axisymmetric part (green curve). For small and intermediate  $Po$, the contribution of the axisymmetric flow remains small, and the course of action is determined by the directly driven non-axisymmetric flow. This only changes around ${Po}\approx 0.075$. From this value onwards, the dominant component is the axisymmetric component. The abrupt increase around ${Po}\approx 0.094$ occurs parallel to a drop in the kinetic energy of the non-axisymmetric components whereby this drop is significantly smaller than the increase in the axially symmetric energy. The sudden increase with a maximum of roughly $E_{kin}\approx 1.5$ at ${Po}=0.2$ means that nearly all kinetic energy available from the initial rotational motion has been transferred into a fluid flow with a fairly simple structure, namely a zonal flow (in our scaled units $\varOmega _{c}=1, R=1, H=2$, the kinetic energy of the initial solid body rotation is $E_{kin}=\int \boldsymbol {u}^2/2\,{\rm d} V={\rm \pi} H\int \varOmega _{c}r^3\,{\rm d} r={\rm \pi} /2$). This strong zonal flow is oriented opposite to the direction of rotation of the cylinder and therefore corresponds to a deceleration of the purely azimuthal flow at the beginning. This zonal flow is the result of nonlinear interactions, for which nonlinear models list three different sources, namely the nonlinear interaction of the forced mode with itself and with its viscous modification and the nonlinear interactions in the end cap boundary layers (Gao et al. Reference Gao, Meunier, Le Dizès and Eloy2021).
Time-averaged kinetic energy calculated in the co-rotating frame of reference. (a) Decomposition of the total kinetic energy (blue) into axisymmetric contributions (red) and non-axisymmetric contributions (green). (b) Decomposition of the non-axisymmetric contributions (green) into directly forced flow ( $m=1$, orange) and the remainder ( $m\geq 2$, light blue). (c) Kinetic energy of individual Fourier modes beyond $m=1$. (d) Kinetic energy of the poloidal axisymmetric flow ( $u_r, u_z$, double-roll mode). In all cases we have ${Re}=10^4$, $H/R=2$, $\alpha =90^{\circ }$. The vertical dashed lines denote the transition regime as discussed in the text.

The composition of the non-axisymmetric flow is shown in more detail in figure 7(b), which presents the division of the non-axisymmetric energy (green curve) into the components with the Fourier component  $m=1$ (orange curve) and the remaining part (with $m>1$, light blue curve). After reaching the maximum shortly before ${Po}\approx 0.1$ with an amount of up to 15 % of the kinetic energy of the initially purely rotating flow, we see a sharp drop due to the collapse of the Fourier component with $m=1$. The most interesting region is the regime $0.094 \leq {Po} \leq 0.105$ that is indicated by the dashed vertical lines in all plots of figure 7. Within this interval of $Po$ we find a plateau-like behaviour for the $m=1$ contributions and, at the same time, a secondary axisymmetric flow, which is characterized by a regular large-scale pattern in the poloidal components $u_r$ and $u_z$ (figure 7d). In contrast to the previous results at smaller $Re$ presented in Pizzi et al. (Reference Pizzi, Giesecke, Šimkanin and Stefani2021a), here, the simulations are sufficiently detailed in $Po$ to illustrate the plateau-like behaviour of the forced mode and the exact correspondence of plateau and occurrence of the double-roll mode. The energy contribution of this double-roll structure is small compared with the directly driven flow or with the total axisymmetric energy which confirms the initially made statement about the dominance of a pure rotational motion ( $E^{m=0}_{tot} \approx E^{m=0}_{\varphi } \gg E^{m=0}_{{r,z}}$). The shape of the double-roll mode with $m=0$ and $k=2$ is shown in figure 8(a) together with the corresponding axial profiles of $u_z$ in figure 8(b). These curves show, on the one hand, the variation of the strength of this double roll and a reversal of the direction of the flow for ${Po}>0.125$. This particular flow structure is interesting because of the appearance and disappearance for a small range of $Po$, and because it bears a remarkable resemblance to a large-scale flow structure that is known to be beneficial for dynamo action (Dudley & James Reference Dudley and James1989).
(a) Time-averaged pattern of the poloidal axisymmetric flow components  $u_r\hat {\boldsymbol {r}}$ and $u_z\hat {\boldsymbol {z}}$ (vector arrows). The coloured contour plots show the radial flow component $u_r$. From upper left to lower right: ${Po}=0.01, 0.075, 0.1, 0.2$. (b) Axial profile of the axisymmetric part of $u_z$ for various $Po$ taken at $r=0.9$.

The energy contributions of the higher non-axisymmetric modes are shown in figure 7(c). It is particularly noticeable here that the  $m=2$ contributions increase more strongly in comparison with even higher $m$ modes, and this increase also begins before the transition described above. Increasing $Po$, in the further course, the $m=1$ component continues to fall in several stages, until finally, at ${Po} =0.2$, an almost equal distribution between the energy of the $m=1$ component and the contributions with $m>1$ is achieved. Note that the energies in figure 7 are only decomposed according to the azimuthal symmetry, and therefore all turbulent components (each with the corresponding azimuthal symmetry) are also included.
Figure 9(a) summarizes the changes in the flow state on the basis of the ratio of the energy of higher Fourier modes (i.e. with  $m>1$) to the energy of the directly driven component ( $m=1$) in a logarithmic representation of the dependence on $Po$. In that representation we can clearly see the resonant triadic instability on the left side briefly above ${{Po\approx 0.001}}$ and the multi-step transition to the supercritical state on the right-hand side characterized by an increasing contribution of the higher $m$ modes, which occurs in at least two different stages.
(a) Time-averaged values of the relation of energy of the non-axisymmetric contributions with  $m>1$ to the directly driven contributions with $m=1$. (b) Time-averaged values of the turbulent energy in relation to the energy of the axisymmetric flow showing the transition from a regime dominated by rotation to a regime dominated by non-rotating turbulence (in the precession frame of reference).

We have determined the degree of turbulence by integrating the quadratic deviations of the flow from its (temporal) average
 \begin{align} E_{tur}=\frac{1}{2}\int
U_{rms}^2\,{\rm{d}}V = \frac{1}{2{\rm \pi} H R^2 (t_1-t_0)}
\int_0^{2{\rm \pi}}{\rm{d}}\varphi\int_0^1 r\,{\rm{d}}r\int_0^H{\rm{d}}z
\int_{t_0}^{t_1}(u(\boldsymbol{r},t)-\langle
u(\boldsymbol{r})\rangle)^2\,{\rm{d}}t.
\end{align}
\begin{align} E_{tur}=\frac{1}{2}\int
U_{rms}^2\,{\rm{d}}V = \frac{1}{2{\rm \pi} H R^2 (t_1-t_0)}
\int_0^{2{\rm \pi}}{\rm{d}}\varphi\int_0^1 r\,{\rm{d}}r\int_0^H{\rm{d}}z
\int_{t_0}^{t_1}(u(\boldsymbol{r},t)-\langle
u(\boldsymbol{r})\rangle)^2\,{\rm{d}}t.
\end{align}The result in relation to the energy of the axially symmetric flow in figure 9(b) shows no, or only a moderate degree of, turbulence before the transition, i.e. in this region the flow is dominated by rotation. Within the transition region, the energy of the turbulent fluctuations increases sharply and the system transitions from a state dominated by rotation into a state dominated by turbulence (note that the steep increase is also caused by the strong deceleration of the rotational motion, as discussed in Pizzi, Giesecke & Stefani Reference Pizzi, Giesecke and Stefani2021b).
4. Nonlinear evolution of the directly forced flow
A weakly nonlinear theory for the amplitude of the directly driven mode was developed in Meunier et al. (Reference Meunier, Eloy, Lagrange and Nadal2008) and later extended to the case of the triadic instability (Lagrange et al. Reference Lagrange, Meunier, Nadal and Eloy2011). Recently, Gao et al. (Reference Gao, Meunier, Le Dizès and Eloy2021) presented an improved nonlinear model that describes the generation of the axisymmetric circulation (zonal flow) and includes nonlinear interactions of the inviscid mode with itself and its viscous correction as well as the nonlinear interactions in the boundary layers. The results show a reasonable agreement with flow structures at small-angle precession obtained from simulations (Albrecht et al. Reference Albrecht, Blackburn, Lopez, Manasseh and Meunier2021) and experiments (Meunier et al. Reference Meunier, Eloy, Lagrange and Nadal2008). Interestingly, in this model the terms that are specific to the cylinder geometry cancel out, leaving only contributions that are independent of the geometry. This may possibly be an explanation for the similarity to the behaviour in the precessing spheroid in large parts of the subcritical state, as described by Horimoto et al. (Reference Horimoto, Simonet-Davin, Katayama and Goto2018) or Komoda & Goto (Reference Komoda and Goto2019). For more complex geometries, e.g. spherical shells or for parameter ranges in which the approximation of Gao et al. (Reference Gao, Meunier, Le Dizès and Eloy2021) is no longer relevant, this should not be the case.
In the following, we use our simulation results to explore the validity range of the nonlinear model. The nonlinear model simplifies the problem by considering only the axisymmetric geostrophic flow ( $m=0, k=0$) and the directly forced mode ( $m=1,k=1$), which finally leads to a coupled system of two ordinary differential equations for the amplitudes, in the following denoted by $A_{0}$ and $A_{f}$. The system is solved using the coefficients for the aspect ratio $H/R=2$ given in Gao et al. (Reference Gao, Meunier, Le Dizès and Eloy2021) (see their (4.23) and table 1). In all cases, after a brief transient phase the solutions converge to a steady state. The corresponding amplitudes are shown in figure 10 with the directly forced mode in (a) and the axisymmetric geostrophic mode in (b) in comparison with the amplitudes derived from the simulations (blue curves) obtained by projection on the eigenfunctions of inertial waves (Pizzi et al. Reference Pizzi, Giesecke and Stefani2021b).
Comparison of amplitudes from simulations (blue curves) and the nonlinear model of Gao et al. (Reference Gao, Meunier, Le Dizès and Eloy2021) (red curves) for fixed  ${Re}=10^4$. Panel (a) shows the directly forced mode with $m=1, k=1$. The orange curve denotes the linear viscous solution of Liao & Zhang (Reference Liao and Zhang2012), which behaves ${\propto } Po$. The green lines illustrate the scaling ${\propto } Po^{{1}/{3}}$ in the subcritical regime. Panel (b) shows the axisymmetric geostrophic mode with $m=0$ and $k=0$ (i.e. the zonal flow in the co-rotating frame of reference). The green lines illustrate the scaling in $Po$ below the transition to the supercritical regime. The vertical dashed lines in both plots indicate the onset of the triadic instability, the transition to chaotic behaviour where no individual peaks for free inertial waves are discernible in the spectrum anymore, and the transition region before the supercritical regime as already marked in figures 7 and 9 (from left to right).

The numerical solutions basically exhibit three striking features, allowing for the distinction of four different regimes, whereby not all corresponding features are reflected in the nonlinear model. Initially, we see a linear evolution, where the directly driven mode scales  ${\propto } Po$. A slight deviation between the nonlinear model and numerical solutions occurs with the onset of the triadic instability just above ${Po}\approx 0.001$. Due to the coupling with the free Kelvin modes, a slight dip occurs here in the simulations, which is not captured by the nonlinear model that neglects higher-order contributions. A second transition occurs in the range of ${Po}\approx 0.006$. Here, the amplitude scaling changes, transitioning into a behaviour ${\propto }Po^{{1}/{3}}$. The transition range is relatively broad, and the behaviour is evident in both simulations and the nonlinear model. In the further course, the amplitude of the simulated flow remains below the nonlinear model, which is easy to understand, since the simulations also involve modes with higher $m$ and $k$ originating in the directly driven mode. Subsequently, we refer to these three regimes, where simulations and the nonlinear model essentially coincide (except for minor deviations caused by the triadic instability), as the subcritical state. In these regimes we have $A_0\propto A_{f}^2$, for which, in principle, three different interactions are responsible: the nonlinear self-interaction of the directly driven mode, the nonlinear interaction of the inviscid forced mode and the viscous correction and the nonlinear interactions in the boundary layers at the end caps. However, numerical simulations with free-slip boundary conditions at $z=\pm H/2$ (so that no boundary layers develop at the end caps) showed that there is nearly no change regarding the transition and the occurrence of the double-roll mode (Pizzi Reference Pizzi2023). This suggests that the main contributions are caused by the first two interaction terms. Interestingly, $A_{f}$ exhibits a slightly lower slope in the simulation data, while the behaviour for $A_0$ is reversed. We attribute this to the contribution of higher modes, which draw energy from the directly forced mode, and ultimately, through an inverse cascade, provide additional contributions to the zonal flow similar to the behaviour in the local box model by Pizzi et al. (Reference Pizzi, Mamatsashvili, Barker, Giesecke and Stefani2022). Around a Poincaré number of ${Po}\approx 0.1$, a multi-stage transition follows, culminating in the supercritical state. However, the collapse of the directly driven flow is not reflected by the nonlinear model so that its validity ceases in this regime. Furthermore, the double-roll mode that is merely perceptible in the transition region is not included in the nonlinear model, which only considers the axisymmetric azimuthal flow component, whereas the double-roll mode is related to the poloidal components $u_r\hat {\boldsymbol {r}}$ and $u_z\hat {\boldsymbol {z}}$. Therefore, the transition and the further evolution in the supercritical region must have a cause that is beyond the effects considered in Gao et al.'s model. In our very first studies, we had proposed that the transition and the emergence of the double-roll mode are associated with a centrifugal instability (Giesecke et al. Reference Giesecke, Vogt, Gundrum and Stefani2018, Reference Giesecke, Vogt, Gundrum and Stefani2019). However, recent simulations indicate that this assessment is not entirely correct, as the violation of the Rayleigh criterion necessary for the occurrence of a centrifugal instability only occurs for ${Po} \gtrsim 0.1075$ (Pizzi et al. Reference Pizzi, Giesecke, Šimkanin and Stefani2021a), which is roughly $15\,\%$ beyond the value of $Po$ at which the collapse of the directly forced mode and the appearance of the double-roll mode take place. In any case, a complete understanding would require the consideration of the influence of the entire large-scale flow including the non-axisymmetric, i.e. the directly forced, part.
Other possibilities for an instability mechanism could be the elliptical instability (Kerswell Reference Kerswell1993), enabled due to the tilt of the fluid rotation axis with respect to the rotation axis of the cylinder (see figure 3), or an instability within turbulent boundary layers. The occurrence of an elliptical instability could be supported by the evolution of the  $m=2$ mode, which, unlike the other contributions, exhibits a relatively steep increase in the pre-transition region (see figure 7c). The occurrence of a boundary layer instability, on the other hand, might be supported by the discovery of irregular turbulent bursts originating in the corners of a precessing cylinder (Marques & Lopez Reference Marques and Lopez2015). Such an instability has also been suspected in Pizzi et al. (Reference Pizzi, Giesecke and Stefani2021b), but only at a significantly larger Reynolds number than achievable in our simulations. This is also in line with the results of Buffett (Reference Buffett2021), who found that an instability for oscillating boundary layers (as generated by precession) occurs at significantly higher Reynolds numbers compared with the case of axisymmetric boundary layers in conventionally rotating flows. This must be mentioned with some restriction, because at the transition the nature of the boundary layers changes from oscillating to axially symmetric (Pizzi et al. Reference Pizzi, Giesecke and Stefani2021b), so that further investigations are required in order to disentangle the mutual relationship between boundary layers and internal flow.
5. Experimental scaling for increasing rotation
Despite the rapid development of algorithms and advances in their implementation on high performance computers in recent years and decades, it is still not possible to carry out simulations of a precession-driven flow in our set-up with a Reynolds number much larger than  ${Re}\sim 10^4$. In order to scale our models to more realistic rotation rates and thus larger Reynolds numbers we resort to experimental investigations on a water test experiment which has been in operation at HZDR for several years (Herault et al. Reference Herault, Gundrum, Giesecke and Stefani2015, Reference Herault, Giesecke, Gundrum and Stefani2019; Giesecke et al. Reference Giesecke, Vogt, Gundrum and Stefani2018; Kumar et al. Reference Kumar, Pizzi, Giesecke, Šimkanin, Gundrum, Ratajczak and Stefani2023). The experiment consists of a Plexiglas cylinder with height $H=0.326\,\mbox {m}$ and radius $R=0.163\,\mbox {m}$ so that the aspect ratio is $\varGamma =H/R=2$ (figure 11a). The cylinder is held by a frame structure that ensures the stability and tightness of the system by means of solid screw clamps that run parallel to the sidewalls. The rotation of the container is driven by a chain through a motor with a maximum power of 3600 W that is controlled by three power sources. The turntable is driven by a second motor with a maximum power of 2200 W, which is controlled individually so that the precession and the rotation frequency can be adjusted independently with the rotation frequency in the range of $0\,{\rm Hz} < f_{c} < 10\,{\rm Hz}$ and the precession frequency in the range of $0\,{\rm Hz} < f_{p} < 1\,{\rm Hz}$. Thus, Reynolds numbers ${Re}=\varOmega _{c}R^2/\nu$ with an order of magnitude up to $2\times 10^6$ are achievable with distilled water with an assumed viscosity of $\nu =10^{-6}\,\mbox {m}^2\,\mbox {s}^{-1}$. Similar to the numerical models we fix the angle between precession axis and rotation axis to $\alpha =90^{\circ }$ (other angles are discussed in Kumar et al. Reference Kumar, Pizzi, Giesecke, Šimkanin, Gundrum, Ratajczak and Stefani2023). We analyse the flow by means of velocity measurements using UDV, which provides spatially and temporally well-resolved profiles of the axial velocity along an ultrasonic beam parallel to the rotation axis (see lower right panel in figure 11a). Similar measurements allowed us to identify axisymmetric inertial waves in a rotating liquid metal driven by a Lorentz force that results from a rotating external magnetic field (Vogt, Räbiger & Eckert Reference Vogt, Räbiger and Eckert2014). In the precession experiment, spatially resolved velocity profiles can be obtained up to a Reynolds number of ${{Re=10^5}}$. A more detailed description of the measurement system can be found in Giesecke et al. (Reference Giesecke, Vogt, Gundrum and Stefani2019) and Kumar et al. (Reference Kumar, Pizzi, Giesecke, Šimkanin, Gundrum, Ratajczak and Stefani2023). Here, we show results from new measurement campaigns that resolve the radial structure of the axial velocity component as well as the behaviour of the critical Poincaré number for high rotational frequencies.
(a) Picture of the water experiment consisting of a transparent cylinder filled with water, and fastening and safety brackets to fix the end caps. The bearing for the transmission of the drive for the rotation can be seen on the right side of the device. The lower panels of (a) show the ultrasonic Doppler velocimetry (UDV) probes mounted on one endcap and a sketch that illustrates the propagation of the ultrasonic beams when performing a flow measurement with six radially mounted UDV probes. (b) Temporal evolution of the axial flow component  $u_z(z,t)$ as measured along the axis with six UDV probes mounted at $r=0, 30, 60, 90, 120$ and $150\,\mbox {mm}$ (from top to bottom) for a run at ${Re}=10^4$ and ${Po}=0.05$.

At lower Reynolds number, such as  ${Re}=10^4$, it is possible to perform (nearly) simultaneous measurements with six UDV probes with the help of a multiplexer circuit, so that a coarsely resolved radial profile of the axial velocity can be measured. A typical time series is shown in figure 11(b), which presents the axial velocity measured simultaneously at the six probes mounted at the same azimuthal angle but at different radii $r=0,30,60,90,120,150\,{\rm mm}$ (from top to bottom). For the post-processing we divide the measured time series into individual chunks, each covering exactly one rotation period and the time average of the axial component is calculated by superimposing these sections. Figure 12 shows the results in comparison with the time-averaged data from the simulations. The colour-coded contours on the left and the central column of figure 12 denote the results from the simulations while the superimposed black contour lines show the data from the measurements, with the individual colour gradations corresponding to the same values of the contour lines. For all three Poincaré numbers we see a good agreement between simulation and experiment both in structure and amplitude. This is additionally confirmed in detail by the radial profiles of $u_z$ shown in the right-hand column of figure 12, which illustrate the increasing concentration of the flow close to the outer wall for large $Po$.
$Po$.
(a,d,g,b,e,h) Structure of the time-averaged axial flow  $u_z$ in the equatorial plane (a,d,g) and in a meridional plane where the flow amplitude is maximum (b,e,h). The colour coded structures present the results of the simulations and the solid black contour lines show the results from the experiment. The black contour lines follow the same level scheme as the coloured structures. (c,f,i) Radial profile of the axial flow component $u_z$ in the equatorial plane at the angle where the axial flow is maximum. The solid line shows the results from the simulations and the stars show the results obtained from phase averaging of the UDV measurements. From top to bottom: ${Po}=0.05, 0.1, 0.2$, ${Re}=10^4$.

To determine the amplitudes of the double-roll mode (and thus to evaluate its occurrence or disappearance), we use the fact that the measurement with UDV is carried out in the co-rotating system, and thus the non-axisymmetric inertial modes do not make any contribution due to their periodicity in  $\varphi$ if a sufficiently long time averaging is applied. The time average of $u_z$ therefore corresponds directly to the axially symmetrical component provided that there is no pulsation of this contribution (which, as we know from simulations, does not exist). The corresponding amplitudes, calculated as described in Appendix B, are similar to those presented in Giesecke et al. (Reference Giesecke, Vogt, Gundrum and Stefani2018) and Giesecke et al. (Reference Giesecke, Vogt, Gundrum and Stefani2019), which are reproduced in figure 13 for the cases ${Re}=10^4,4\times 10^4$ and $10^5$ for the two most interesting modes $\tilde {\tilde {u}}_{km}$ with $(m,k)=(1,1)$ and $(m,k)=(0,2)$. Qualitatively, the curves show a similar shape as the kinetic energy in figure 7(b,d). We see an increase of the forced mode up to a critical point at which the amplitude collapses and then remains on an intermediate plateau for a small range before another, smaller collapse occurs. At the same time, we see an interim appearance of the double-roll mode in the plateau regime. Especially for the larger Reynolds numbers, the appearance of the double-roll structure is sharply delineated from the remaining part of the parameter range and when comparing the critical thresholds as indicated by the vertical dashed lines, we see that the regime of the plateau between the first and second drops of the directly driven mode correspond exactly to the appearance and disappearance of the double-roll mode.
(a) Amplitudes of the directly forced mode with  $m=1$ and $k=1$ vs forcing parameter $Po$ for various Reynolds numbers. The transitional regime is marked by the vertical dashed lines. (b) Same as (a), but for the double-roll mode with $m=0$ and $k=2$ (data taken from Giesecke et al. Reference Giesecke, Vogt, Gundrum and Stefani2018, Reference Giesecke, Vogt, Gundrum and Stefani2019).

Figure 14 supplements these results and shows the scaling of the amplitudes in the different regimes as a function of  $Re$. The amplitudes of the directly forced mode, taken within the three different regimes, are shown in figure 14(a), which compares the amplitude of the directly forced mode taken at the maximum (i.e. at the critical threshold), an average of the amplitudes obtained in the plateau regime and the average of the amplitudes in the overcritical regime (i.e. after the second collapse). We see that all three amplitudes share the same scaling behaviour, which is ${\propto }{Re}^{0.9}$, which can clearly be distinguished from a scaling linear in $Re$ indicated by the black dotted curve. Saturation by viscous damping in the bulk would be expected to result in a purely linear scaling ${\propto }{Re}$. To confirm the deviation observed by us in a robust manner, measurements at significantly larger $Re$ are therefore still required.
(a) Scaling of the (measured) amplitudes (maximum, transition region and overcritical regime) for the directly forced mode in dependence of  $Re$. (b) Same as (a), but for the double-role mode.

Figure 14(b) shows the related scaling for the double-roll mode, where we restrict the analysis to the respective maximum amplitude. It is striking that this amplitude follows a linear scaling  ${\propto }{Re}$, so that the relative weighting of the double-roll mode should become more important as $Re$ increases. Unfortunately, reliable measurements with UDV are not possible above ${Re}\sim 10^5$ due to the excessive flow velocity so that it cannot be ruled out that a change in the scaling behaviour occurs for ${Re}>10^5$. This applies in particular to the double-roll mode, the occurrence of which is associated with exceeding the critical $Po$. This threshold decreases with increasing Reynolds number, and we use the occurrence and disappearance of the double-roll mode as a proxy to identify the transition of the flow state. This feature can still be identified with the help of the UDV probes for Reynolds numbers up to ${Re}=2\times 10^6$ without relying on a spatially resolved measurement of the axial profile. Figure 15 shows that the critical threshold for the occurrence of the double-roll mode follows a scaling ${\propto }{Re}^{-({1}/{5})}$ for ${Re}\lesssim 10^5$. A similar scaling arises for the second threshold that characterizes the disappearance of the double-roll mode. Above a Reynolds number of approximately ${Re}\approx 10^5$ we see a transition of the behaviour and the critical thresholds follow an asymptotic regime with ${Po}^{c}\rightarrow 0.065$. There are two further observations that are worth emphasizing. Firstly, the width of the transition area, i.e. the regime between the emergence and disappearance of the double-roll mode, is only slightly dependent on $Re$. The second interesting fact is the similarity of the regime with ${Re}\gtrsim 10^5$ to the measurements in a spheroid with small ellipticity carried out by Horimoto et al. (Reference Horimoto, Simonet-Davin, Katayama and Goto2018). These measurements reveal a bistable system in a small range of $Po$ with the possibility of a quiescent turbulent state and a state of ‘developed turbulence’. The authors also observed that the range for the bistable state and thus the transition to a developed turbulent state only weakly depends on $Re$ but did not observe a particular scaling ${\propto }{Re}^{\beta }$ for small $Re$ as we found for the cylinder. This suggests that, for the cylinder, the scaling in the range ${Re} \lesssim 10^5$ may be caused by the Ekman layers at the end caps, for which the extrapolation of simulation data indicates the possibility of the transition to turbulent boundary layers at approximately ${Re}\approx 10^5$ (Pizzi et al. Reference Pizzi, Giesecke and Stefani2021b).
State diagram showing the critical thresholds for appearance and disappearance of the double-roll mode in dependence on the Reynolds number.

6. Summary and conclusion
We have examined the fluid flow in a precessing cylinder using numerical simulations and UDV measurements in a water experiment. We have limited our investigations to the case with maximum precession angle, since in this case the volume force caused by precession is also maximum. In contrast to earlier investigations performed at small nutation angles that show multiple dynamical features (e.g. flow breakdowns or quasi-periodic bursts, Manasseh Reference Manasseh1992, Reference Manasseh1994, Reference Manasseh1996), in our study a unique characterization of the flow state is possible using the Poincaré number  $Po$.
$Po$.
The volume force caused by the precession directly drives an inertial mode whose amplitude can be calculated from linear theory. In the present case, the configuration is resonant, and the calculation of the amplitude must take into account viscosity in the boundary layers (Gans Reference Gans1970; Meunier et al. Reference Meunier, Eloy, Lagrange and Nadal2008; Liao & Zhang Reference Liao and Zhang2012). This directly forced flow is unstable (Kerswell Reference Kerswell1993) and becomes time dependent in terms of a triadic resonance when a critical forcing is exceeded (Kerswell Reference Kerswell1999). The emergence of a triadic resonance and the transition from a laminar flow into a chaotic flow can be understood in terms of a bifurcation of a rotating wave into a modulated rotating wave (Garcia et al. Reference Garcia, Giesecke and Stefani2021). In the case of precession the symmetry of the system is already broken right from the beginning due to the non-axisymmetric forcing, which differs for example from the axisymmetric base state in the spherical Couette set-up that allows the occurrence of an additional frequency because of the need for the breaking of the axisymmetric symmetry before becoming chaotic (Garcia et al. Reference Garcia, Seilmayer, Giesecke and Stefani2019, Reference Garcia, Giesecke and Stefani2021). Despite the onset of the triadic instability we still see a rather regular behaviour when further increasing the forcing with a monotonically increasing flow amplitude up to a first threshold, which initiates the transition to the supercritical state. Before the transition the directly forced flow amplitude scales proportional to the cube root of the forcing ( ${\propto }Po^{{1}/{3}}$) and the kinetic energy reaches more than one third of the energy of the initial flow prescribed by a rotation around the axis of the cylinder with $\boldsymbol {u}=r\varOmega _{c}\hat {\boldsymbol {\varphi }}$.
There is no unified nonlinear model that describes both the triadic instability and the evolution of the two main modes (forced mode and zonal flow). However, since the energetic contribution of the free Kelvin modes and the resulting chaotic contribution remain small over a large range of parameters, this is not relevant, at least until the transition to the supercritical regime. Before this transition, a nonlinear model based on viscous effects and two modes, the directly driven Kelvin mode and the geostrophic axisymmetric circulation, is capable of describing the behaviour of the precession-driven flow (Gao et al. Reference Gao, Meunier, Le Dizès and Eloy2021). We conclude that the modifications of the flow structure in the subcritical regime are the results of the nonlinear interaction of the forced (inviscid) mode with itself and its viscous correction and/or the corresponding interactions in the boundary layers. However, since simulations with free-slip boundary conditions at the end caps show a rather similar behaviour, we believe that the contributions within the Ekman layers are less important (Pizzi Reference Pizzi2023). Interestingly, Gao's system of equations does not seem to allow two solutions, as they occur in the Busse model for sufficiently large ellipticity. The possibility of two solutions is also observed in simulations and experiments, and it is known that the abrupt change between the two states is associated with hysteresis (Herault et al. Reference Herault, Gundrum, Giesecke and Stefani2015). This transition takes place in two consecutive steps above a critical amplitude of the directly forced flow. We show that the remarkable change seen in the kinetic energy around  ${Po}\approx 0.1$ goes along with a significant modification of the structure of the flow as well as with a decrease in the forced mode's amplitude, the emergence of the double-roll mode, a sudden jump of the orientation of the fluid rotation axis, an increased level of turbulence and a sudden stop of the rotational motion of the bulk fluid, none of which are represented in the known nonlinear models. Therefore, Gao's nonlinear model still seems incomplete, either because certain interactions have not been taken into account, or because higher-order contributions are necessary. With regard to this issue, we emphasize that the emergence of the double-roll mode is not affected by Greenspan's theorem (Greenspan Reference Greenspan1969), which forbids nonlinear first-order interactions for axially symmetric, geostrophic contributions on the long time scale with an order given by the strength of the nonlinear terms. Apart from the triadic instability and the axisymmetric geostrophic mode, the double-roll mode is the only clearly noticeable regular large-scale flow pattern in the simulations with nutation angle $\alpha =90^{\circ }$ and at aspect ratio $H/R=2$.
In other configurations, however, the spontaneous formation of large-scale vortices has been observed in experiments of a precession-driven flow at a different aspect ratio (Mouhali et al. Reference Mouhali, Lehner, Léorat and Vitry2012). In a spherical geometry, such vortices were associated with the conical shear layer instability (CSI, Lin, Marti & Noir Reference Lin, Marti and Noir2015), which is known to be beneficial for dynamo action (Lin et al. Reference Lin, Marti, Noir and Jackson2016). In a sphere, the conical shear layers are spawned in the boundary layers at critical latitudes, which do not exist in a cylindrical geometry. In our simulations, there is a slight indication of the emergence of such vortices around  ${Po}\approx 0.03$. However, these vortices remain weak and short lived (less than half a rotation period). One could assume that the formation of the vortices is triggered by wave beams originating in the corners of the cylinder, as described by Marques & Lopez (Reference Marques and Lopez2015). The corners at the end caps of the cylinder would thus play a similar role as the critical latitudes for the CSI. In fact, we can identify such wave beams in the form of vectored fluctuations in the vicinity of the corners. The wave beams are clearly visible only in the supercritical regime, while we see the formation of weak vortices in the laminar region so that there is probably no connection between the two phenomena. The same applies to the scaling of the critical value of $Po$ as we observe it in the experiment. Interestingly, this particular scaling is not found in the scaling of the amplitudes (in all regimes), whose behaviour follows a rather simple law with respect to the rotation, although the observation of the deviation of the forced mode from a scaling linear in $Re$ might be surprising. However, in our measurements the data range for determining the dependence on $Re$ is limited, as it only covers one order of magnitude, partly in a regime where the critical Poincaré number for the transition is still decreasing. For more robust statements, therefore, further measurements with larger $Re$ are required, which cannot be carried out with the currently installed sensors.
Beyond the transition regime the energy of the axisymmetric flow induced by precession reaches values up to  $80\,\%{-}90\,\%$ of a rigidly rotating fluid. This large increase is essentially due to a circulation that is opposite to the rotation of the container. When transferring to the precession frame of reference, this azimuthal flow corresponds to a braking of the initial solid body rotation, giving the impression that one observes a stagnant fluid with the container rapidly rotating around it. A significant fluid flow is observed only in the vicinity of the sidewall, while being greatly weakened in the interior, which results in a strong shear effect close to the sidewall that should be helpful for dynamo action according to Landeau's criterion (Landeau et al. Reference Landeau, Fournier, Nataf, Cébron and Schaeffer2022).
Finally, we emphasize that the axially symmetric component in the form of a twofold roll as observed within this transition regime is comparable to the mean poloidal flow in the von-Kármán-sodium dynamo experiment (Monchaux et al. Reference Monchaux2007; Giesecke et al. Reference Giesecke, Nore, Stefani, Gerbeth, Léorat, Herreman, Luddens and Guermond2012a). It is well known that this type of flow drives a dynamo at comparatively low values of the magnetic Reynolds number (Dudley & James Reference Dudley and James1989; Ravelet et al. Reference Ravelet, Chiffaudel, Daviaud and Léorat2005; Giesecke, Stefani & Burguete Reference Giesecke, Stefani and Burguete2012b), which might be of high interest with respect to the precession dynamo experiment currently planned at Helmholtz-Zentrum Dresden-Rossendorf. Indeed, kinematic simulations show that, in the range of the transition, the possibility of achieving magnetic field self-excitation in the planned dynamo experiment has an optimum (Giesecke et al. Reference Giesecke, Vogt, Gundrum and Stefani2018, Reference Giesecke, Vogt, Gundrum and Stefani2019; Kumar et al. Reference Kumar, Pizzi, Giesecke, Šimkanin, Gundrum, Ratajczak and Stefani2023). So far, the kinematic models have been based on the assumption of dynamo action in the planned experiment being driven by large-scale flow. However, this does not need to be the only possibility. Recent self-consistent simulations using the full set of magnetohydrodynamic equations and a geometric set-up similar to the planned experiment showed small-scale dynamo action with the magnetic energy saturating a rather low level (Giesecke, Wilbert & Šimkanin Reference Giesecke, Wilbert, Šimkanin, Stefani and Grauer2024). In these models, the regular dynamo state is aperiodically interrupted by strong magnetic bursts (increasing the magnetic energy by a factor of 3 to 5). The related velocity field is also essentially small scale, and it might be that the randomly excited inertial waves are responsible for the generation of magnetic energy similar to the mechanism discussed by Moffatt (Reference Moffatt1970) and Soward (Reference Soward1975).
Supplementary movie
Supplementary movie is available at https://doi.org/10.1017/jfm.2024.602.
Acknowledgements
A.G. would like to thank the Isaac Newton Institute for Mathematical Sciences, Cambridge, for support and hospitality during the programme ‘Frontiers in dynamo theory: from the Earth to the stars’ where work on this paper was undertaken.
Funding
This work benefited from support through project nos. GR 967/7-1 and GI 1405/1-1 of the Deutsche Forschungsgesellschaft (DFG). This work was supported by EPSRC grant no. EP/K032208/1. F.G. gratefully acknowledges the Serra Húnter and SGR (2021-SGR-01045) programs of the Generalitat de Catalunya (Spain).
Declaration of interests
The authors report no conflict of interest.
Data availability statement
The data that support the findings of this study are available upon reasonable request.
Appendix A. Radial structure of inertial modes
We distinguish four different classes of inertial waves according to the elementary geometric properties, i.e. axisymmetry ( $m=0$) and geostrophy ( $k=0$). These classes and the corresponding representation ${\boldsymbol {u}}_{mkn}$ are listed in the following, whereby our list additionally contains the corresponding dispersion relations, which are required for the calculation of the radial wavenumbers $\lambda _{mkn}$ and the frequencies $\omega _{mkn}$. We use the indices $m, k$ and $n$, which are the azimuthal wavenumber, the axial wavenumber and the third index, $n$, that counts the solutions for the parameter $\lambda$, which results from the dispersion relation that provides a kind of a radial wavenumber.
(i) Axisymmetric geostrophic inertial modes ( $m=0, k=0$)
(A1)\begin{equation} \left.\begin{gathered} {u}^r_{00n} = 0\\ {u}^{\varphi}_{00n} = J_{1}(\lambda_{00n}r)\\ {u}^z_{00n} = 0\\ J_1(\lambda_{00n}) = 0 \\ \omega_{00n} = 0 \end{gathered}\right\}. \end{equation}
$m=0, k=0$)
(A1)\begin{equation} \left.\begin{gathered} {u}^r_{00n} = 0\\ {u}^{\varphi}_{00n} = J_{1}(\lambda_{00n}r)\\ {u}^z_{00n} = 0\\ J_1(\lambda_{00n}) = 0 \\ \omega_{00n} = 0 \end{gathered}\right\}. \end{equation}(ii) Axisymmetric non-geostrophic mode (
$m=0, k\neq 0$)
(A2)\begin{equation} \left.\begin{gathered} {u}^{r}_{0kn} ={-}i\frac{\omega_{0kn}\lambda_{0kn}\varGamma}{4-\omega_{0kn}^2}J_{1} (\lambda_{0kn}r)\sin\left(\frac{k{\rm \pi} z}{H}\right)\\ {u}^{\varphi}_{0kn} ={-}\frac{\lambda_{0kn}\varGamma}{4-\omega_{0kn}^2} J_{1}(\lambda_{0kn}r)\sin\left(\frac{k{\rm \pi} z}{H}\right)\\ {u}^{z}_{0kn} ={-}{\rm i}\frac{k{\rm \pi}}{\omega_{0kn}}J_0(\lambda_{0kn}r) \cos\left(\frac{k{\rm \pi} z}{H}\right)\\ J_1(\lambda_{0kn}) = 0 \\ \omega_{0kn} = \pm2\left[1+\left(\frac{\lambda_{0kn}H}{k{\rm \pi}}\right)\right]^{-({1}/{2})} \end{gathered}\right\}. \end{equation}(iii) Non-axisymmetric geostrophic modes (
$m\neq 0, k=0$)
(A3)\begin{equation} \left.\begin{gathered} {u}^r_{m0n} ={-}{\rm i}\frac{mH}{2r} J_{m}(\lambda_{m0n}r)\,{\rm e}^{{\rm i}m\varphi}\\ {u}^{\varphi}_{m0n} = \frac{H}{2}\left[\lambda_{m0n} J_{m-1}(\lambda_{m0n}r) -\frac{m}{r} J_{m}(\lambda_{m0n}r)\right]{\rm e}^{{\rm i}m\varphi}\\ {u}^z_{m0n} = 0\\ J_m(\lambda_{m0n}) = 0\\ \omega_{m0n} = 0 \end{gathered}\right\}. \end{equation}(iv) Non-axisymmetric non-geostrophic modes (
$m\neq 0, k\neq 0$)
(A4)\begin{equation} \left.\begin{aligned} {u}_{mkn}^r &=\frac{-{\rm i}}{4-\omega_{mkn}^2} \left[\omega_{mkn}\lambda_{mkn} J_{m-1}(\lambda_{mkn} r) \vphantom{\frac{(2-\omega_{mkn})m}{r}}\right.\\ &\quad\left.+\,\frac{(2-\omega_{mkn})m}{r}J_m(\lambda_{mkn} r)\right] \sin\left(\frac{(2k-1){\rm \pi} z}{H}\right){\rm e}^{{\rm i}m\varphi}\\ {u}^{\varphi}_{mkn} &=\frac{1}{4-\omega_{mkn}^2} \left[2\lambda_{mkn}J_{m-1}(\lambda_{mkn} r) \vphantom{\frac{(2-\omega_{mkn})m}{r}}\right.\\ &\quad\left.-\,\frac{(2-\omega_{mkn})m}{r}J_m(\lambda_{mkn} r)\right] \sin\left(\frac{(2k-1){\rm \pi} z}{H}\right){\rm e}^{{\rm i}m\varphi}\\ {u}^{z}_{mkn} &= \frac{i}{\omega_{mkn}}\frac{(2k-1){\rm \pi}}{H} J_m(\lambda_{mkn} r)\cos\left(\frac{(2k-1){\rm \pi} z}{H}\right){\rm e}^{{\rm i}m\varphi}\\ 0 &= \omega_{mkn}\lambda_{mkn}J_{m-1}(\lambda_{mkn}) + (2-\omega_{mkn})mJ_m(\lambda_{mkn}) \\ \omega_{mkn} &=\pm2\left[1+\frac{\lambda_{mkn}^2H^2}{(2k-1)^2{\rm \pi}^2}\right]^{-({1}/{2})} \end{aligned}\right\}. \end{equation}


Appendix B. Calculation of inertial mode amplitudes from axial profiles measured in the experiment
The measured velocity profiles are analysed quantitatively by the application of a reduced projection method similar to the approach that is used for the numerical data in Pizzi et al. (Reference Pizzi, Giesecke and Stefani2021b). The basis for the procedure is the time series of the axial velocity component  $u_z(r=r_s,z,t)$, where $r_s$ is one particular radius at which the UDV probes are mounted. In a first step we apply a discrete sine transformation at each time step $t_n$
$t_n$
 \begin{equation} \tilde{u}_k(r_s,t_n)=\frac{1}{N_z}\sum_{j=0}^{N_z-1} u_z(r_s,z_j,t_n) \sin\left(\frac{{\rm \pi} z_j k}{H}\right),\end{equation}
where  $z_j=jH/(N_z-1)$ is the discrete and normalized axial coordinate. The decomposition done in (B1) provides an axial mode $\tilde {u}_k$ in dependence on the axial wavenumber $k$. Up to now we have ignored the dependency on the azimuthal coordinate $\varphi$, because $\varphi$ enters the measurement analysis only implicitly, since the UDV probes cover the measuring volume once during one revolution of the cylinder. Since there is a time offset between the velocity profiles recorded at different angles during a single revolution, the measured profiles cannot be interpreted as an instantaneous snapshot of the axial velocity field, as is possible with the simulation data. However, in the precession frame of reference the essential part of kinetic energy is contained in large-scale components in terms of standing inertial waves so that, after applying a Fourier decomposition, we are able to disentangle the mixed dependency on time and on the azimuthal coordinate, because we know the frequency of the probe. Therefore, we calculate the Fourier spectrum in time for each individual $k$-mode according to
 \begin{align} \tilde{\tilde{u}}_{k\omega}(r_s) &= \frac{1}{N_t}\sum_{n=0}^{N_t-1}\tilde{u}_k(r_s,t_n) \exp({-{\rm i}\omega t_n}) \nonumber\\ &=\frac{1}{N_zN_t}\sum_{j=0}^{N_z-1}\sum_{n=0}^{N_t-1}u_z(r_s,z_j,t_n) \sin\left(\frac{{\rm \pi} z_jk}{H}\right)\exp({-{\rm i}\omega t_n}). \end{align}
The implementation of the individual steps is shown in figure 16 for the paradigmatic case  ${Re}=10^4$ and ${Po}=0.075$. Figure 16(a) shows a small section of the measurement series as recorded by a single UDV probe (the total duration covers approximately 100 rotation periods). Figure 16(b) shows the decomposition into individual axial modes (from $k=1$ to $k=6$) according to (B1). The quasiperiodic behaviour and the dominance of the first axial mode with $k \propto \sin ({\rm \pi} z/H)$ can be clearly recognized. Figure 16(c) shows the Fourier spectrum for the six axial modes from (b) and illustrates that the main contributions come from standing waves in the precession system, which appear in terms of peaks at integer multiples of the rotation frequency of the container. This multiplier is equivalent to the corresponding azimuthal wavenumber $m$ and in the following we label the peaks of the modes at integer multiples of the cylinder frequency with $m$, i.e. $\tilde {\tilde {u}}_{k\omega =1,2,3\cdots }\hat =\tilde {\tilde {u}}_{km=1,2,3\cdots }$. In order to prove that the characterization by means of the standing inertial modes provides a reasonable representation for the fluid flow, we calculated the reconstructed signal from the amplitudes of various numbers of $k$-modes. The result is shown in figure 16(d), which presents a single snapshot of an axial profile (black curve) and the decomposition into several axial $k$-modes according to (B1) with the blue curve denoting the dominant contribution for the case $k=1$. The red curve in turn presents the reconstructed axial profile when using the first $20$ axial eigenmodes and confirms that the decomposition in terms of inertial eigenmodes provides a good representation for the velocity field.
(a) Original time series as measured by an UDV probe mounted at  $r=0.9$. (b) Time series of the $k$-mode amplitude for $k=1 \ldots 6$ as obtained from the measurement run shown in (a). (c) Fourier decomposition of the time series presented in (b). The individual peaks occur at multiples of the rotation frequency of the container and represent the different azimuthal modes for $m=1,2,3,\ldots.$ (d) Original signal (black curve) in comparison with various reconstructed data curves using different numbers of axial eigenmodes (red curves). The coloured curves show the individual eigenmodes up to $k=6$ that have been used to reconstruct the original signal. Here, ${Re}=10^4, {Po}=0.075$.


 Open access