

1. Introduction
1.1. Practical background
Some called the era we are living in the Plastic Age (Reference Thompson, Swan, Moore and Vom SaalThompson et al., 2009). While plastic has many valuable uses, one of the key challenges has been increased during past decades due to consumer behaviour of the throwaway society (Reference Corazzini and AntinyanCorazzini & Antinyan, 2021; Reference Napper and ThompsonNapper & Thompson, 2019). Around the world, one million plastic drinking bottles are purchased every minute, while 5 trillion single-use plastic bags are used every year. In total, half of all plastic produced is designed to be used only once and then thrown away (United Nations Environment Programme, 2018). This creates a severe negative effect on the environment and a huge threat on human and animal health (Reference Corazzini and AntinyanCorazzini & Antinyan, 2021).
While governments hold a big role in controlling major companies in producing plastics, which is believed to be one of the most effective ways of slowing-down plastic waste, there is still room for various societal actors such as consumers to be involved in the solutions (Reference Löhr, Savelli, Beunen, Kalz, Ragas and Van BelleghemLöhr et al., 2017). To study more about how to alter consumption habits, this research is looking at the influence of perceived similarity as a nudge on plastic consumption behaviour change. It is hoped that the research could bring insights to predict and then design consumer behaviour towards a more pro-environmental behaviour in a social environment by using perceived similarity as a nudge.
1.2. Theoretical background
What triggers behaviour change? Behaviour can be influenced by various characteristics. Reference Harrison, Price and BellHarrison et al. (1998) differentiates between deep- and surface-level characteristics. Surface-level characteristics are the more observable one and measurable such as age, body size, sex, etc. On the other hand, deep-level characteristics are about values, beliefs, and attitudes. Human behaviour is complicated and changes in human behaviour are hard to predict (Reference RubinsteinRubinstein, 2018). As such, there is always a gap between intention and actual behaviour. Reference RubinsteinRubinstein (2018) suggests that getting to know about peoples’ wants and needs, their self-image, and their established behavioural patterns may help in predicting behaviour. To design new consumer behaviour there is then a need to predict how such social factors could trigger a change towards pro-environmental behaviour. Furthermore, in social cognitive theory (Reference BanduraBandura, 1986), behaviour is determined by four factors: goals, outcome expectancies, self-efficacy, and socio-structural variables. Goals are the intentions to perform the behaviour (Reference Luszczynska and SchwarzerLuszczynska & Schwarzer, 2005). Reference HargreavesHargreaves (2011) and Reference WardeWarde (2005) argued that more, or less, sustainable patterns of consumption and pro-environmental behaviour are not seen as results of individuals’ attitudes, values, and beliefs constrained by various contextual ‘barriers,’ but occur as social practices. In this research, the social cognitive theory is explored further with the addition of perceived similarity; preliminary findings indicate that catalytic behaviour change may be more likely to happen when the target and the behaviour trigger are perceived as similar in some way (Reference ThøgersenThøgersen, 2004).
The above argument invites investigating the role of perceived similarity in changing pro-environmental behaviour in this study. The impact of modelling on beliefs about one’s capabilities are greatly increased by perceived similarity to the models (Reference BanduraBandura, 1986). From social cognitive theory, they learned that when people observe a model performing a behaviour and the consequences of that behaviour, they remember the sequence of events and use this information to guide subsequent behaviours. Observing a model can also prompt the viewer to engage in behaviour they have already learned. Social cognitive theory has been applied to many areas of human functioning such as career choice, organizational behaviour (Reference Lent, Brown and HackettLent et al., 1994), public health as well as in the academic field for understanding classroom motivation, learning, and achievement. Reference Beer and WatsonBeer and Watson (2008) stated that people assume, in the absence of further information, that others are similar to themselves. Further, perceived similarity can be explained as the extent to which one person believes the other person is similar in terms of attitudes, beliefs, and values. Most importantly, as Reference Turban, Dougherty and LeeTurban et al. (2002) explained, perceived similarity is influenced by new information about individual differences and preferences revealed during team interactions, not only by the relative distribution of member characteristics. Therefore, studying perceived similarity in pro-environmental behaviour could be a positive move from the general assessment of diversity in teams. This opens the possibility to use perceived similarity in a team as a nudge to trigger pro-environmental behaviour change.
Nudging can triggers behaviour change. As explained by T. C. Reference Leonard, Thaler and SunsteinLeonard et al. (2008), nudging is an approach that helps to change people’s behaviour by influencing their choice of actions without limiting their options or applying rules and regulations. It assists and encourages people in the decision-making process based on their broad self-interest. When examinee believes they behave similarly with the model, it will generate attraction, which acts as a nudge to trigger behaviour change (Reference Condon and CranoCondon & Crano, 1988). Even though nudging has been studied in many research fields, few records are available. Reference Byerly, Balmford, Ferraro, Hammond Wagner, Palchak, Polasky, Ricketts, Schwartz and FisherByerly et al. (2018) revived the use of nudging in pro-environmental behaviour but has not investigated the available nudging approaches or how they could be adopted toward pro-environmental behaviour. Further, Reference Ferrari, Cavaliere and BanterleFerrari et al. (2019) investigated the effectiveness of nudging on sustainable food consumption behaviour. There is a huge research gap that needs to be covered by the current study to provide insights into the role of nudging in pro-environmental behaviour.
1.3. Research objective
This research is looking at the influence of perceived similarity as a nudge on plastic consumption behaviour change and altering the consumption habits among people. Thus, the following research question was raised for nudging pro-environmental behaviour: How does the perceived similarity in a model (controlled agent) affect the predictability of behaviour change? Using this hypothesis, this research then investigates the effect of nudging with perceived similarity in how it could affect predictability of behaviour change in the pro-environmental field, specifically plastic usage. Further, this study will bring insight to design new consumer behaviour towards pro-environmental behaviour in a social environment.
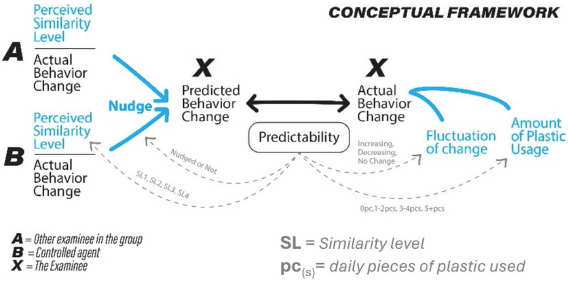
The conceptual framework below was developed to investigate a possible behaviour design for this study (Figure 1), which indicates the relationship between predictability of behaviour change (formed from the difference between actual and predicted behaviour change) and the following factors: similarity level (SL 1 to 4), the direction of the nudge (nudge or not), the fluctuation of behaviour change (Increasing, decreasing and no change), and the amount of daily plastic usage (from 0 to 5+ pieces).
Conceptual framework

2. Research method
2.1. Overview
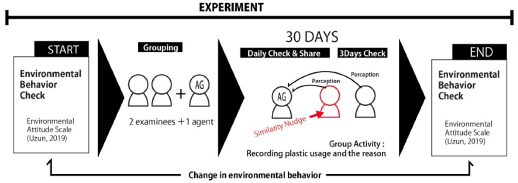
A 30-day online experiment reporting the daily plastic usage of examinees in a group was conducted. Sixty examinees were recruited and required to register by filling out an online form which asks about their demographics, method of contact, and environmental attitude. The environmental attitude was checked using the environmental attitude scale (Reference Uzun, Gilbertson, Keles and RatinenUzun et al., 2019). They were grouped into 30 groups of two people completed with a controlled agent. Out of the examinees, 31 are males and 29 are female with an age average of 29. As it was decided to study the influence of perceived similarity on the predictability of behaviour change the control condition of this experiment was checked trough the perceived similarity factor and by the design of the study as only one of two participants in a group was nudge.
As the nudge for the target examinee, the controlled agent with whom the examinees perceived similarity in behaviour participated in the group, which would nudge better a change in the examinees’ plastic consumption behaviour to match the model, i.e., consuming less plastic. Perfect similarity may cause suspicious and risked the agent being uncovered so for once every three days the agent was controlled to make the behaviour different from the target by reporting a consumption amount of one less plastic. To make it more natural, the day that the agent performs better was randomized for every set of three days. As a result, the agent appears mostly similar most of the time, but sometimes they appear to perform slightly better.
As this research was done to check the influence of perceived similarity in a team as a nudge, there was the necessity to elevate the analysis at a team level by using predictability to reduce the influence of the direction of the perceived similarity. In this research, predictability is defined as the difference between actual behaviour change (ABC) and the predicted behaviour change (PBC), or in other words, the difference between reality and prediction:
 $$Predictability = ABC - PBC$$
PBC is calculated by considering the effect on the 2 examinees divided by their perceived similarity level as a prediction of their behaviour without the effect of the direction of the perceived similarity using the formula:
 $${\rm{PBC}} = {{({\rm{SLa}} \times {\rm{BCa}}) + ({\rm{SLb}} \times {\rm{BCb}})} \over {{\rm{SLa}} + {\rm{SLb}}}}$$
-
SLx: Perceived similarity level to examinee x,
-
BCx: Behaviour change (difference from the day before) of examinee x,
-
a, b: Two other examinees in the same group.
This research looks at predictability using formula (1), and PBC was calculated with formula (2). Formula (2) was used to eliminate the direction of similarity so we could discuss the predictability of behaviour change without being affected by whom similarity was being perceived.
2.2. Experimental method
During the registration phase, examinees are asked to fill an attitude Scale to measure their attitude towards the environment. The environmental attitude Likert scale (Reference Uzun, Gilbertson, Keles and RatinenUzun et al., 2019) was used. This scale separates attitude to three sub-scales; environmental behaviour, environmental opinion, and environmental emotion. This research used a simplified version with 15 relevant questions.
As explained in the Introduction, deep level characteristics are communicated through behaviour which is why perceived similarity in this research is looking at deep-level characteristics in an online chat environment, so surface-level characteristics do not interfere. To do so, as experimental platform, LINE, was chosen as the method of communication because it enables an experiment where examinees do not have to see the physical appearance of other examinees, as surface-level characteristics (age, race, etc.) are known to influence perceived similarity. It was also important to hide appearances because one of the three examinees within each group was a controlled agent. Each LINE group had three members, consisting of two examinees and one controlled agent who was instructed to create similarity by mimicking one of the examinees. Examinees were told to not communicate at all within the group. This was done so examinees could focus on consumption behaviour by looking at shared graphs and clicking the links to the daily check-in form from inside the group.
Throughout the experiment, examinees were asked to check-in daily. Notification messages were set every day at the same time, allowing examinees to enter their daily check within the next 24 hours. Those who were late received an extra notification the next day, telling them to do the daily check for a portion of two days. An online form was used, and it asks about the amount of usage of two types of plastic: bottles and bags. They were required to enter their daily plastic usage from the day before. The answers received from Daily Check were compiled and shared as a graph inside the group on the next day. The examinees could then use the graph to perceive how similar they were with the other examinee and the agent. In addition, once every three days, examinees were given a different form, one that included questions from the daily check-in with an additional question that asked how similar they felt with each of the other members of the group. Examinees were made to comply first with a small request (daily check-in) and then 3 days later with a larger, related request (Reference Freedman and FraserFreedman & Fraser, 1966). A four-level Likert scale was used to evaluate the perceived similarity level. This was asked only once every three days to reduce the effort needed to continuously fill out the forms for thirty days, as it is known that behaviours that require more effort are less likely to be adopted (Reference Graymore, Wallis and O’TooleGraymore et al., 2010; Reference Urban and ŠčasnýUrban & Ščasný, 2016). It was important for the examinee to check the graph to perceive similarity, so a question about each examinee’s performance was also asked to add a prompt for the examinee to take one more look at the daily graph. At the end of the experiment, an evaluation phase was conducted consisting of the same environmental attitude scale as used at the start of the experiment and a question asking, “what do you notice about other examinees during the experiment?” was added to check whether they noticed the presence of the controlled agent. The overall flow of the experiment is described in the diagram below (Figure 2.)
Experiment flow

2.3. Analysis method
As stated previously, this research looks at how predictability of behaviour changes influence fours factors: similarity level, the direction of the nudge, the fluctuation of behaviour change, and the amount of daily plastic usage. The statistically significant relations between the predictability and each factor were checked using a t-test for factors with two variables and an ANOVA test for factors with three variables or more. As predictability is analysed at a team level, it was decided to focus the analysis on its range more than on its average. As smaller range would correspond to a more accurate prediction of the actual behaviour change for a more diverse distribution of change.
3. Results
The 60 healthy examinees took part in the experiment and were clustered into 30 groups. 1758 plastic bottles and bags were recorded throughout the experiment. Because one person didn’t match with the requirements, their group’s data had to be removed from the analysis, meaning the total sample was reduced from the expected total of 1800 to 1740 (1800-(2×30) = 1740). No one noticed the presence of the agent during the experiment. From there on, we will discuss the results from an overall perspective followed by a by terms (meaning by group of 10 days) analysis.
3.1. Overall analysis
Here, the data was analyzed considering the entire duration of the study (from day 1 to day 30) in general. First, the effect of similarity was removed by using the PBC formula (2), and then predictability was calculated by looking at the difference between PBC and ABC using formula (1). Predictability was calculated for every variable and from each factor, and then the difference between the predictability of the variables under the same factor was tested using the corresponding statistical test. All factors show a significant relation to the predictability of behaviour change in daily plastic usage as described below.
3.1.1. Similarity level
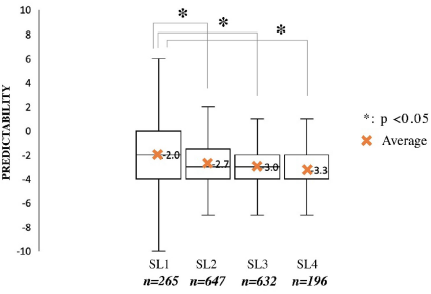
From the total of 1740 samples, similarity was divided into four levels, with the similarity level (SL) 1 being not similar and SL4 being very similar. A significant difference (p<0.001) was found. Further analysis using the Tukey method between two out of four variables was applied to test which pair of similarity levels had a significant difference. Significant difference of predictability was found between SL1 to SL2 (p =0.027), SL1 to SL3 (p =0.002), and SL1 to SL4 (p =0.003). The higher the SL levels were, the smaller the range became. This suggests a more accurate range of predictability with greater perceived similarity (Figure 3).
Relation between similarity levels to predictability (30 days)

3.1.2. Direction of the nudge
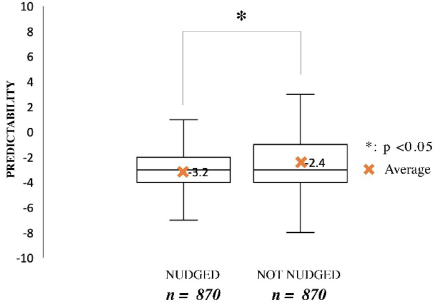
From the total of 1740 samples, nudges were divided into two parts: those who were nudged by the controlled agent and those who were not. A significant difference (p<0.001) was found between nudged or not nudged that those who were not nudged had a less accurate range of predictability than those who were nudged (Figure 4).
Relation between nudge to predictability (30 days)

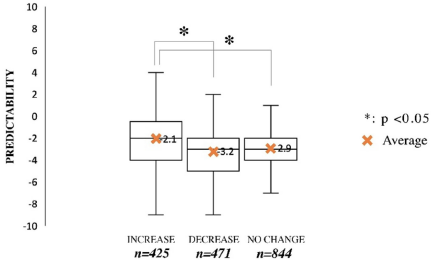
3.1.3. Fluctuation of behaviour change
Behaviour change was calculated by looking at the differences in daily plastic usage between two continuous days. From the total of 1740 samples, the fluctuation of behaviour change was divided into three levels: increasing, decreasing, and no change (compared to the previous day). A significant difference (p<0.001) was found between the fluctuation in behaviour change and predictability. Further analysis showed a significant difference of predictability between increase and decrease (p<0.001) and increase and no change (p=0.001). The range of predictability for no change was the smallest of the three, meaning it is the most accurate in the model (Figure 5).
Relation between fluctuation of BC with predictability (30 days)

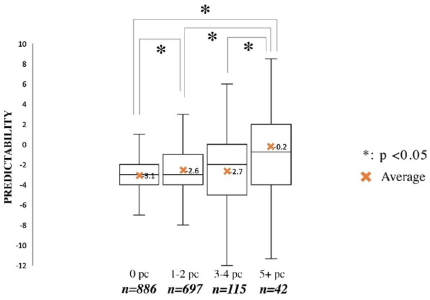
3.1.4. Amount of daily usage
From the total of 1740 samples, the amount of daily usage was divided into four levels: no usage (0pc), 1 to 2 pieces (1-2pc), 3 to 4 pieces (3-4pc), and more than five pieces (5+pc). A significant difference (p=0.001) was found. Further analysis using the Tukey method between two out of four variables was applied to test which pair of amount of usages had a significant difference. Significant difference of predictability was found between 0pc and 1-2pc (p=0.047), 0pc and 5+pc (p=0.001), 1-2pc and 5+pc (p=0.001), and 3-4pc and 5+pc (p=0.003). The less plastic used the more accurate the range of predictability was (Figure 6).
Relation between amount of usage to predictability (30days)

3.2. Results in each term
As our results suggested an influence of the timing on the experiment factors, it was decided to add a follow-up analysis by term. The span of 30 days was further divided into terms of 10 days: first term (Day 1-10), second term (Day 11-20), third term (Day 21-30). Referencing from the Fogg Behaviour Grid (Reference FoggFogg, 2009) that separates habit formation categories to time periods, we used 10 days for a period of time to know exactly on which period that change of predictability occurred. In the first term, a significant difference was found in all factors. In the second term, a significant difference was found in the factors of direction of the nudged, fluctuation of BC, and amount of usage. No significant difference was found in the factor of similarity level in the second term. In the third term, none of the factors had a significant difference.
4. Discussion
Based on the above results, the main findings of the study can be discussed. First, the perceived similarity level showed a significant relation with the predictability of behavioural change in daily plastic usage during the first term (first 10 days). Secondly, the results showed that examinees who were nudged or not nudged by the control agent showed a relation with predictability in the overall term, first term, or second term. The fluctuation of behavioural change among examinees also showed a significant relation with predictability. Examinees who showed no kind of behavioural change had the strongest relationship with predictability. Further, this study found that the amount of daily plastic usage showed a relation with predictability in the first term and second term, with no relation found in the third term. Further results from the Tukey test shows that all significant differences of predictability always relate to 5+pc. This may suggest that predictability is less accurate the more plastic is used, specifically after it goes above 5 pieces or more up until the second term. Finally, the results showed no significant relation from any factors with predictability in the third term.
These results can be put into perspective with previous research. Some studies (Reference Lemay and ClarkLemay & Clark, 2008; Reference Lemay and RyanLemay & Ryan, 2021; Reference Mills, Clark, Ford and JohnsonMills et al., 2004) have also shown that there is a significant relationship between perceived similarity and prosocial behaviour. As explained by Reference Leonard, Thaler and SunsteinLeonard et al. (2008), nudging is an approach that changes people’s behaviour by altering the decision-making environment to influence others’ decisions. When the control agent nudges the examinees, the behaviour of examinees may be expected to change toward pro-environmental behaviour and a difference between actual behaviour and predicted behaviour would appear. But this significant relationship was found only in the first and second terms. That can be explained by the study of Lemay and Ryan(2021), regarding the limited time. That study determined that a behaviour should be repeated to reach the asymptote of automaticity and may require 18–254 days on average. Many studies agree with the idea that human behaviour is very complicated and hard to predict (Reference RubinsteinRubinstein, 2018). This finding is supported by Reference BoutonBouton (2014). He stated in his study that though “behaviour change often seems easy in the short run; it can be difficult to sustain.” As stated by Reference Hasan, Harun and HockHasan et al. (2015), plastic usage is strongly correlated with environmental knowledge and attitudes. Furthermore, environmental concern and awareness acts as a predictor of pro-environmental behaviour and significantly affects attitudes toward plastic bag use (Reference Law, Zhao and LimLaw et al., 2019; Reference Vassanadumrongdee, Hoontrakool and MarksVassanadumrongdee et al., 2020; Reference Xu, Zhong, He, Shi and SongXu et al., 2022). Therefore, with a lack of awareness and environmental concerns, people tend to use more plastic. It is hard to expect pro-environmental behaviour from such people. As explained earlier, it takes a long time to observe behaviour change, which often seems easy in the short run but is difficult to sustain (Reference BoutonBouton, 2014). Hence, the necessity to be able to predict behaviour change to design nudge that would triggers pro-environmental behaviour.
5. Conclusion
5.1. Summary
This study examined how the perceived similarity affects the environmental behaviour of examinees. The experiment was conducted by using a controlled agent with whom the examinees perceived similarity in behaviour to nudge the daily plastic usage consumption of examinees. Relation in predictability of behaviour change was found in all factors in the overall term, first term, and second term, with the exception being that similarity showed no significant relation in the third term. The key findings of this research are as follow:
-
Similarity level shows a relation with predictability for all 30 days and was particularly influenced by the first term.
-
Whether examinee was nudged or not shows relation towards predictability for all 30 days and was particularly influenced by the first and second term.
-
Fluctuation of behaviour changes and the amount of usage shows relation towards predictability on only the first and second term
-
Being in a group with a controlled agent that regularly nudges to reduce plastic consumption can help to predict behaviour change in the first and second term.
This study hypothesized that, with nudges from a model (controlled agent) with whom examinees perceived similarity, predictability would lean closer to the behaviour of the model. This would then help to design new pro-environmental behaviour policies by prediction using nudge. The method and findings from this study contributes to the existing behavioural change studies by addressing a large research gap – the role of nudging as a social mechanism in pro-environmental behaviour.
5.2. Limitations and Future Research
This study is limited in how it can be generalized for several reasons. First, the data were collected in only two countries (Japan and Indonesia who showed no influence on the factors studied). To increase the general applicability of the study it would be preferable to collect data from different countries. Further, with longitudinal research rather than a cross-sectional study we could expect better results on how perceived similarity can help predict pro-environmental behaviour change. Social mechanism design need more time than engineering design to bear results. The results showed that perceived similarity levels positively relate with the predictability of behavioural change in daily plastic usage during the first term (first 10 days) but suggest that the effects of perceived similarity disappear with time. These findings can conclude that there is a time limitation in this experiment that limits the ability to examine behaviour reaching the asymptote of automaticity. Finally, examinees evaluated themselves relatively highly at the beginning and at the end in the environmental attitude tests. Therefore, in some cases, their actual behaviour does not reflect their self-evaluation. This suggests that how examinees perceive themselves does not reflect their actual behaviour, which might be interesting to investigate further by analysing relations between attitude score and actual behaviour.
Ethical statement
This study was approved by the Institutional Review Board of Kyushu University.
Acknowledgement
This work was supported by JSPS Grant-in-Aid for Scientific Research JSPS22KK0220.

 Open access