





1. Introduction
The evolving practice of co-design in information visualization (infovis) highlights the need to engage diverse stakeholders in interdisciplinary collaboration to develop shared informational artifacts that support collective understanding. By including domain experts, prospective users and designers, co-design fosters meaningful discussions across the design process, yielding solutions aligned with real needs and constraints (Dörk et al. Reference Dörk, Müller, Stange, Herseni and Dittrich2020; Morelli et al. Reference Morelli, Johansen, Pidcock, Harold, Pirani, Gomis, Lorenzoni, Haughey and Coventry2021; Chishtie et al. Reference Chishtie, Bielska, Barrera, Marchand, Imran, Tirmizi, Turcotte, Munce, Shepherd, Senthinathan, Cepoiu-Martin, Irvine, Babineau, Abudiab, Bjelica, Collins, Craven, Guilcher, Jeji and Jaglal2022). In such processes, project sustainability and acceptance improve as stakeholders gain ownership of the visualization and issues are delineated more effectively (Lamqaddam et al. Reference Lamqaddam, Vande Moere, Vanden Abeele, Brosens and Verbert2021). Evidence suggests that co-design accelerates problem definition and insight discovery and enhances engagement and user agency (Dörk et al. Reference Dörk, Müller, Stange, Herseni and Dittrich2020; Chishtie et al. Reference Chishtie, Bielska, Barrera, Marchand, Imran, Tirmizi, Turcotte, Munce, Shepherd, Senthinathan, Cepoiu-Martin, Irvine, Babineau, Abudiab, Bjelica, Collins, Craven, Guilcher, Jeji and Jaglal2022). In this context, developing team mental models (TMMs) enables teams to connect ideas, optimize information processing, adapt to changing circumstances and recognize key informational cues in complex infovis contexts, and these outcomes improve team coordination and performance (Uitdewilligen et al. Reference Uitdewilligen, Waller, Roe and Bollen2023; Abrantes et al. Reference Abrantes, Passos, Cunha and Santos2022).
Despite its benefits, co-design can be cognitively demanding for stakeholders unfamiliar with design approaches or creative problem-solving, especially in early project stages. For example, domain experts may lack confidence to fully engage in ideation or struggle to detect visualization gaps until advanced prototypes are provided (Yacoubian, Al-Thani & Aupetit Reference Yacoubian, Al-Thani and Aupetit2021). Also, the abstract nature of data in infovis projects and the complexity of informational contexts add further challenges to the team coordination (Dörk et al. Reference Dörk, Müller, Stange, Herseni and Dittrich2020; Uitdewilligen et al. Reference Uitdewilligen, Waller, Roe and Bollen2023). When stakeholders encounter dots, lines or other simplistic representations, they may experience a semantic disconnect from the qualitative contexts in which they typically operate (Lamqaddam et al. Reference Lamqaddam, Vande Moere, Vanden Abeele, Brosens and Verbert2021). Likewise, infovis designers may not fully grasp domain-specific expertise, while specialists may be unaware of advanced infovis capabilities and design methodologies (Lamqaddam et al. Reference Lamqaddam, Vande Moere, Vanden Abeele, Brosens and Verbert2021).
While the literature provides insights into knowledge construction and sharing in interdisciplinary design projects (Fernandes et al. Reference Fernandes, Henriques, Silva and Pimentel2017; Raghunath et al. Reference Raghunath, Koronis, Karthikayen, Silva and Yogiaman2023), gaps remain in understanding how infovis teams navigate creative problems and open-ended scopes, particularly when TMMs diverge and require realignment (Dong, Kleinsmann & Deken Reference Dong, Kleinsmann and Deken2013; Casakin & Badke-Schaub Reference Casakin and Badke-Schaub2017). Although co-design initiatives have been examined in collaborative design contexts (Dörk et al. Reference Dörk, Müller, Stange, Herseni and Dittrich2020; Ehkirch & Matsumae Reference Ehkirch and Matsumae2024), research offers limited insight into the concrete procedural approaches through which designers and stakeholders sustain interactive intensity and foster co-creative states over time (DeChurch, Lungeanu & Contractor Reference DeChurch, Lungeanu and Contractor2024).
In addition, prior work indicates that insufficient sharing of mental models can lead to blind spots and misunderstandings in collaborative settings (Paddeu & Lyons Reference Paddeu and Lyons2024) and that reconciling diverse perspectives often requires constructive conflict, clarification and debate (Santos, Uitdewilligen & Passos Reference Santos, Uitdewilligen and Passos2015; Andrews et al. Reference Andrews, Lilly, Srivastava and Feigh2023). Although facilitation is recognized as critical in guiding co-design infovis processes (Dörk et al. Reference Dörk, Müller, Stange, Herseni and Dittrich2020; Yacoubian et al. Reference Yacoubian, Al-Thani and Aupetit2021), how facilitation-led interventions affect the sharedness of TMMs in interdisciplinary teams operating under information-rich and cognitively demanding conditions remains insufficiently understood. In particular, there is a lack of design-oriented, formalized co-design approaches that support the emergence of TMMs sharedness during the early phases of infovis projects, where domain dependency, data abstraction and ill-defined problem spaces intensify coordination challenges.
This research investigates how systematic interventions in co-design processes within recently formed interdisciplinary infovis design teams shape group coordination by fostering TMM sharedness, particularly under conditions of high informational complexity, ill-defined problems and context-dependent scopes. To this end, our exploratory study examines the context of co-design in infovis projects, which require teams to cope with knowledge gaps, semantic barriers, continuous reframing and the creative integration of each member’s proposals (Badke-Schaub et al. Reference Badke-Schaub, Neumann, Lauche and Mohammed2007; Mohammed, Ferzandi & Hamilton Reference Mohammed, Ferzandi and Hamilton2010; Dong et al. Reference Dong, Kleinsmann and Deken2013; Santos et al. Reference Santos, Uitdewilligen and Passos2015; Dörk et al. Reference Dörk, Müller, Stange, Herseni and Dittrich2020; Uitdewilligen et al. Reference Uitdewilligen, Waller, Roe and Bollen2023).
Building on a review of design cognition, TMM research and co-design literature, four research questions were formulated and consolidated into a theoretical framework, later operationalized in two workshops with distinct volunteer groups. The workshops examined how selected co-design interventions and contextual conditions shaped TMM sharedness in collaborative infovis projects by interdisciplinary teams. As TMMs offer insight into cognitively driven interactions and communication in design collaboration (Casakin & Badke-Schaub Reference Casakin and Badke-Schaub2017), this study proposes a procedural framework from an exploratory investigation of whether co-design practices and cognitive factors foster TMM sharedness and strengthen teamwork in complex interdisciplinary contexts.
This article is structured as follows. Section 2 reviews the literature on co-design, collaborative cognition and TMMs and presents the research questions with the theoretical framework. Section 3 details the methodology, including workshop setup, data collection and the use of verbal coding and transition matrices for structuring sequential interactions. Section 4 reports the results, organized around the four interventions. Section 5 discusses the findings in relation to the literature and highlights the role of each intervention. Section 6 presents the procedural framework, translating the study’s insights into practical steps for fostering TMM sharedness. Sections 7 and 8 conclude with a summary of contributions, limitations and future research directions.
2. Theoretical background
Infovis projects are interdisciplinary as they move beyond a single disciplinary standpoint by engaging collaborators from different fields in joint research and design activities around domain-specific problems (Dörk et al. Reference Dörk, Müller, Stange, Herseni and Dittrich2020). Such interdisciplinary work commonly entails knowledge and interest gaps that must be actively negotiated during the design process (Lamqaddam et al. Reference Lamqaddam, Vande Moere, Vanden Abeele, Brosens and Verbert2021). Semantic barriers, domain-specific technical terms, jargon and specialized concepts that are not readily understood across disciplines might also hinder interdisciplinary teamwork (Carvalho Reference Carvalho2014; Lamqaddam et al. Reference Lamqaddam, Vande Moere, Vanden Abeele, Brosens and Verbert2021). From a team-cognition perspective, these gaps and barriers are consequential because interdisciplinary coordination depends on the extent to which members develop TMMs, which means a shared understanding of the task and other team-relevant aspects that support coordination and the cooperative integration of diverse perspectives (Klimoski & Mohammed Reference Klimoski and Mohammed1994; Santos et al. Reference Santos, Uitdewilligen and Passos2015).
Team mental model (TMM) theory offers an analytical lens for understanding organized mental representations of task and teamwork knowledge, which must be shared among members for effective performance (Klimoski & Mohammed Reference Klimoski and Mohammed1994; Mohammed et al. Reference Mohammed, Ferzandi and Hamilton2010). Because TMM development is context-dependent, it is shaped by requirements and constraints that influence cognitive processes (Badke-Schaub et al. Reference Badke-Schaub, Neumann, Lauche and Mohammed2007). At the same time, TMM comprises both the content and the structure of team-relevant knowledge, namely, the concepts team members use to make sense of the work and the relations that organize those concepts into an interpretable knowledge structure (e.g., causal links, sequences, or dependencies) (Klimoski & Mohammed Reference Klimoski and Mohammed1994; Mohammed et al. Reference Mohammed, Ferzandi and Hamilton2010).
In turn, TMM sharedness refers to the degree of convergence among team members’ mental models, reflected in the overlap in how relevant knowledge is organized and interpreted. Beyond this, it encompasses the team’s capacity to recognize and leverage complementary knowledge and capabilities across members in support of coordination and decision-making (Mohammed et al. Reference Mohammed, Ferzandi and Hamilton2010; Casakin & Badke-Schaub Reference Casakin and Badke-Schaub2017). When TMMs are shared, teams are more likely to generate creative ideas, aligned with task demands and group needs, enhancing creativity and overall effectiveness (Santos et al. Reference Santos, Uitdewilligen and Passos2015). Furthermore, shared TMMs particularly improve performance under demanding conditions such as task complexity, workload, or communication barriers (Badke-Schaub et al. Reference Badke-Schaub, Neumann, Lauche and Mohammed2007) while also fostering more novel, original ideas in collaborative settings (DeChurch et al. Reference DeChurch, Lungeanu and Contractor2024). Within this context, structured facilitator interventions are effective in guiding TMM development in newly formed teams (Jo Reference Jo2011; Tesler et al. Reference Tesler, Mohammed, Hamilton, Mancuso and McNeese2018).
Furthermore, TMM literature categorizes content into taskwork, teamwork and temporal dimensions, offering a structured view of knowledge shared within teams (Mohammed et al. Reference Mohammed, Hamilton, Tesler, Mancuso and McNeese2015). Taskwork models encompass the understanding of activities, action sequences, procedures, tools and resources needed for the work (Mohammed et al. Reference Mohammed, Ferzandi and Hamilton2010). Teamwork content involves communication needs, awareness of members’ skills and roles, and coordination strategies (Mohammed et al. Reference Mohammed, Ferzandi and Hamilton2010; Maynard & Gilson Reference Maynard and Gilson2014). Temporal content represents shared understanding of task sequencing, synchrony among members and associated deadlines (Mohammed et al. Reference Mohammed, Hamilton, Tesler, Mancuso and McNeese2015).
Although TMM research commonly distinguishes taskwork, teamwork and temporal mental models as core content domains (Mohammed et al. Reference Mohammed, Hamilton, Tesler, Mancuso and McNeese2015), design-cognition studies have also advanced operational categorizations developed to what is most observable and consequential in collaborative design discourse. In particular, Badke-Schaub, Neumann & Lauche (Reference Badke-Schaub, Neumann, Lauche, Boos, Kolbe, Kappeler and Ellwart2011) and Casakin & Badke-Schaub (Reference Casakin and Badke-Schaub2017) propose a triadic structure, task, process and cohesion, which preserves the cognitive focus of TMMs while aligning more directly with the kinds of knowledge exchanges that occur during design collaboration processes. The task dimension captures shared knowledge about the problem and solution space, how the problem is framed, and how solutions are generated, analyzed, explained and evaluated, thus corresponding closely to taskwork content in the broader TMM taxonomy (Mohammed et al. Reference Mohammed, Ferzandi and Hamilton2010; Casakin & Badke-Schaub Reference Casakin and Badke-Schaub2017). The process dimension concerns conjectures and agreements about how the team should proceed, including strategies, rules, procedures, planning and reflective regulation of what has been accomplished and what to do next; this category consolidates much of what TMM theory separates into teamwork coordination and temporal structuring (e.g., sequencing, synchrony and deadlines) because these elements typically appear in design talk as procedural and coordination-oriented exchanges (Mohammed et al. Reference Mohammed, Hamilton, Tesler, Mancuso and McNeese2015; Casakin & Badke-Schaub Reference Casakin and Badke-Schaub2017). Finally, cohesion addresses the team’s socio-relational functioning, appreciation, confirmation, rejection and help among members, capturing the interpersonal conditions that support shared understanding and coordinated action, and that are especially salient in interdisciplinary design settings (Casakin & Badke-Schaub Reference Casakin and Badke-Schaub2017). We adopt this design-specific operationalization to code and analyze team cognition in co-design interactions, enabling construct-valid interpretation while maintaining comparability with prior empirical work in design research (Badke-Schaub et al. Reference Badke-Schaub, Neumann, Lauche, Boos, Kolbe, Kappeler and Ellwart2011; Casakin & Badke-Schaub Reference Casakin and Badke-Schaub2017).
The following sections examine dimensions that shape collaborative cognition, drawing on team cognition literature to explore how co-design frameworks bridge cognition and practice. In doing so, we present antecedent factors that foster the sharedness of TMMs and consequences that influence creative teamwork solutions.
2.1. Integrative activities
Dialogical spaces refers to team settings in which members feel able to share divergent ideas, negotiate meanings and reframe emerging opportunities (Jo Reference Jo2011; Santos et al. Reference Santos, Uitdewilligen and Passos2015; Paddeu & Lyons Reference Paddeu and Lyons2024). In interdisciplinary teams, integrative activities, such as facilitated exercises or icebreakers, foster dialogical spaces by promoting interaction, enhancing engagement and lowering social barriers that inhibit participation (Jo Reference Jo2011; Hu, Booth & Reid Reference Hu, Booth and Reid2015). These activities are particularly relevant during early design phases, when designers and stakeholders face ambiguity and challenges in anticipating future developments (Fernandes et al. Reference Fernandes, Henriques, Silva and Pimentel2017). By supporting early team integration, these activities cultivate dialogical spaces that promote mutual understanding and provide settings conducive to discussion and reflection (Jo Reference Jo2011; Casakin & Badke-Schaub Reference Casakin and Badke-Schaub2017).
TMMs are essential for cultivating inclusive and safe environments, where members share divergent ideas, especially in contexts requiring creativity and adaptive improvisation under uncertainty (Santos et al. Reference Santos, Uitdewilligen and Passos2015; DeChurch et al. Reference DeChurch, Lungeanu and Contractor2024). To achieve such sharedness, newly formed teams often need external stimuli that foster integration and clarify roles and competencies. These mechanisms also build trust and dialogical openness (Jo Reference Jo2011; Abrantes et al. Reference Abrantes, Passos, Cunha and Santos2022). Such conditions are critical for fostering TMM sharedness and enabling members to use dialogical spaces to articulate shared objectives, strategies and collaborative dynamics (Dong et al. Reference Dong, Kleinsmann and Deken2013; Paddeu & Lyons Reference Paddeu and Lyons2024). As individuals gain confidence expressing their knowledge and beliefs, dialogical exchanges expand, allowing design teams to navigate multiple perspectives through convergent and divergent thinking (Badke-Schaub et al. Reference Badke-Schaub, Neumann, Lauche and Mohammed2007; Smulders Reference Smulders2007). Similarity in TMMs is associated with reduced unproductive conflict and increased task-focused communication (Santos et al. Reference Santos, Uitdewilligen and Passos2015).
However, sustaining creative momentum in these environments requires teams to engage in iterative exploration, a dynamic process supported by activities that strengthen both the social and cognitive dimensions of collaboration (Krishnakumar et al. Reference Krishnakumar, Letting, Johnson, Soria Zurita and Menold2023; Raghunath et al. Reference Raghunath, Koronis, Karthikayen, Silva and Yogiaman2023). While infovis projects are inherently challenging, they demand collaboration among participants from diverse disciplinary backgrounds, each contributing with specialized knowledge and often employing distinct vocabularies and communicative practices (Dörk et al. Reference Dörk, Müller, Stange, Herseni and Dittrich2020; Lamqaddam et al. Reference Lamqaddam, Vande Moere, Vanden Abeele, Brosens and Verbert2021). This highlights the importance of integrative activities in co-design, particularly in newly formed interdisciplinary teams, as such practices promote the sharedness of TMM and familiarity. These practices are tied to iterative negotiation and reframing, both essential in the design process (Dong et al. Reference Dong, Kleinsmann and Deken2013). Considering the preceding rationale, we formulate the following research question:
RQ1: How do integrative activities support the emergence of dialogical spaces in recently formed interdisciplinary design teams, understood as settings in which TMMs, particularly task- and cohesion-related content, are collectively articulated, negotiated and refined?
2.2. Evocative artifacts
The literature indicates that, in co-design activities, artifacts function as mediating objects that foster social interaction and stimulate creativity, with social and creative dimensions recognized as central to the process (Dörk et al. Reference Dörk, Müller, Stange, Herseni and Dittrich2020). These artifacts help designers and stakeholders in comprehending, analyzing and comparing existing solutions, either holistically or by focusing on specific elements (Herring et al. Reference Herring, Chang, Krantzler and Bailey2009). In team-based settings, such references facilitate the development of a shared knowledge base, which is especially valuable in interdisciplinary teams where some participants may lack familiarity with a specific domain (Dörk et al. Reference Dörk, Müller, Stange, Herseni and Dittrich2020). The integration of evocative artifacts, or “reference solutions,” extends these benefits by aiding in memory recall and clarifying key aspects of the design context (Sauder & Jin Reference Sauder and Jin2016).
Similarly, in co-design, artifacts support reinterpretation of concepts during ideation and serve as validation tools in later project stages (Herring et al. Reference Herring, Chang, Krantzler and Bailey2009; Sanders & Stappers Reference Sanders and Stappers2014). As Goldschmidt & Smolkov (Reference Goldschmidt and Smolkov2006, p. 553) observe, “designers exhibiting opportunistic behavior, take advantage of any item in the work environment that might potentially trigger ideas or initiate a more extensive memory search, motivated by a cue that appears useful.” Accordingly, examples, whether formally supplied or spontaneously retrieved, fulfill multiple functions: inspiring ideation, establishing shared evaluation criteria, reducing ambiguity and enabling collaboration (Krishnakumar et al. Reference Krishnakumar, Letting, Johnson, Soria Zurita and Menold2023; Ehkirch & Matsumae Reference Ehkirch and Matsumae2024). More broadly, prototypes, analogies and physical objects often reduce communication barriers and help articulate intentions, constraints and possibilities (Herring et al. Reference Herring, Chang, Krantzler and Bailey2009; Sanders & Stappers Reference Sanders and Stappers2014; Krishnakumar et al. Reference Krishnakumar, Letting, Johnson, Soria Zurita and Menold2023).
Dörk et al. (Reference Dörk, Müller, Stange, Herseni and Dittrich2020) argue that infovis design has traditionally been data-driven, starting from available datasets. Given the difficulty of verbalizing graphical ideas, they emphasize providing participants with visual and physical materials to facilitate design communication. These artifacts enable participants to anchor contributions in prior knowledge, reducing miscommunication and providing tangible expression mediums (Sanders & Stappers Reference Sanders and Stappers2014). This makes TMM development more fluid, as teams collaboratively assess options and engage in structured negotiation through empirical references (Fernandes et al. Reference Fernandes, Henriques, Silva and Pimentel2017; Hay, Cash & McKilligan Reference Hay, Cash and McKilligan2020). However, to our knowledge, no studies have examined these artifacts’ outcomes from a TMM perspective. Accordingly, we formulate the following research question:
RQ2: How do evocative artifacts, in recently formed interdisciplinary design teams, facilitate ideation, communication and evaluation by enabling the collective articulation and refinement of task-related TMM content and supporting team cohesion?
2.3. Framing guides
In interdisciplinary infovis projects, teams often face divergent goals, conflicting interests and heterogeneous backgrounds (Santos et al. Reference Santos, Uitdewilligen and Passos2015; Dörk et al. Reference Dörk, Müller, Stange, Herseni and Dittrich2020; Lamqaddam et al. Reference Lamqaddam, Vande Moere, Vanden Abeele, Brosens and Verbert2021). A key strategy to mitigate these challenges involves formal framing interventions that guide the group in defining objectives and priorities (Lei, Wu & Jiang Reference Lei, Wu and Jiang2024; Paddeu & Lyons Reference Paddeu and Lyons2024). For example, prompts like “I want to show…” or “I want to find out…” initiate dialogical negotiation, prompting discussion of which information and visualization types are most relevant (Dörk et al. Reference Dörk, Müller, Stange, Herseni and Dittrich2020). In newly formed interdisciplinary teams, facilitated guidance helps bridge gaps between specialties that hinder early problem definition and solution mapping (Dörk et al. Reference Dörk, Müller, Stange, Herseni and Dittrich2020; Yacoubian et al. Reference Yacoubian, Al-Thani and Aupetit2021). By fostering shared reflections, teams develop a common lens for interpreting emerging ideas, reducing misunderstandings and promoting co-creation (Andrews et al. Reference Andrews, Lilly, Srivastava and Feigh2023).
Such framing mechanisms aid in the creation of a cohesive direction for the team, as participants align their ideas and converge on collective decisions (Hay et al. Reference Hay, Duffy, McTeague, Pidgeon, Vuletic and Grealy2017; Ehkirch & Matsumae Reference Ehkirch and Matsumae2024). Furthermore, when teams adopt explicit framing strategies, they establish a type of grounding that guides each member’s cognitive processes, amplifying mutual understanding of tasks and roles (Lei et al. Reference Lei, Wu and Jiang2024). This shared understanding is instrumental in effectively distributing responsibilities and clarifying how each portion of the project ought to progress (Klimoski & Mohammed Reference Klimoski and Mohammed1994; Maynard & Gilson Reference Maynard and Gilson2014). In this sense, the complexity of mental models acts as an asset: it enables participants to integrate large volumes of information, both new and preexisting, to address complex and mutable scenarios (Uitdewilligen et al. Reference Uitdewilligen, Waller, Roe and Bollen2023).
Finally, as team members are guided to collectively agree on what they “want to show,” they develop an adaptive capacity for establishing TMMs that sustain group cohesion in decision-making (Cannon-Bowers & Salas Reference Cannon-Bowers and Salas2001; Dörk et al. Reference Dörk, Müller, Stange, Herseni and Dittrich2020). Still, it is fundamental to investigate mechanisms that foster dialogical processes in team decisions about convergent goals and strengthen the capacity to collectively adjust decisions in response to evolving requirements (Santos et al. Reference Santos, Uitdewilligen and Passos2015; Dörk et al. Reference Dörk, Müller, Stange, Herseni and Dittrich2020). From the perspectives articulated above, we formulate the following research question:
RQ3: How do framing guides enhance the team’s capacity for adaptive decision-making in recently formed interdisciplinary design teams, understood as settings in which shared TMMs, encompassing process and cohesion-related content, are collectively articulated, aligned and adaptively revised?
2.4. Guided reflexivity in teams
Guided reflexivity is a structured intervention encouraging team members to reflect on ongoing tasks, performance and anticipate future scenarios (Tesler et al. Reference Tesler, Mohammed, Hamilton, Mancuso and McNeese2018; Abrantes et al. Reference Abrantes, Passos, Cunha and Santos2022). This process is vital in newly formed teams, where members may not initiate reflexive practices (Tesler et al. Reference Tesler, Mohammed, Hamilton, Mancuso and McNeese2018). As Abrantes et al. (Reference Abrantes, Passos, Cunha and Santos2022) note, even under time pressure and adaptation demands, formally facilitating reflection, such as evaluating performance or considering alternatives, enhances efficiency by preventing misguided actions. By defining procedural strategies and identifying adjustments, teams create an environment conducive to deeper reflection and knowledge sharing. Casakin & Badke-Schaub (Reference Casakin and Badke-Schaub2017) define procedural strategies as clarifying methods and procedures necessary to complete the design, positioning them as a core design activity.
Furthermore, implementing guided reflexivity and formalizing collective reflection moments enable teams to process complex information, address ambiguities and recalibrate strategies (Fernandes et al. Reference Fernandes, Henriques, Silva and Pimentel2017; Lei et al. Reference Lei, Wu and Jiang2024). During these reflective moments, participants articulate subtasks, disclose constraints and integrate existing knowledge with emerging ideas to develop comprehensive TMMs (Lei et al. Reference Lei, Wu and Jiang2024; Paddeu & Lyons Reference Paddeu and Lyons2024). Ultimately, reflexivity in design teams supports adaptive decision-making and fosters deeper engagement at critical junctures, promoting shared task-related TMMs (Fernandes et al. Reference Fernandes, Henriques, Silva and Pimentel2017; Hay et al. Reference Hay, Cash and McKilligan2020). Within design processes, reflexivity serves as a mediating mechanism between the fluidity of conceptual alternatives and the need to define priorities, helping teams uncover interdependencies across design decisions (Fernandes et al. Reference Fernandes, Henriques, Silva and Pimentel2017).
Reflexivity offers a powerful mechanism for navigating interdependent information and coordinating diverse perspectives, particularly under high informational complexity (Tesler et al. Reference Tesler, Mohammed, Hamilton, Mancuso and McNeese2018; Uitdewilligen et al. Reference Uitdewilligen, Waller, Roe and Bollen2023; Abrantes et al. Reference Abrantes, Passos, Cunha and Santos2022). Through group reflection, participants systematically evaluate data integration and strategy alignment with evolving requirements (Uitdewilligen et al. Reference Uitdewilligen, Waller, Roe and Bollen2023). This shapes information processing and mediates between conceptual alternatives and pragmatic decision-making, aligning with procedural strategies where teams evaluate relevant data and define processes. Although reflexivity has been studied in team cognition, its operationalization in interdisciplinary design teams engaged in information-laden projects remains unclear. Therefore, we formulate the following research question:
RQ4: How does guided reflexivity enable the establishment of procedural strategies in recently formed interdisciplinary design teams by facilitating the articulation and refinement of shared process and cohesion-related TMM content?
2.5. Consolidating the conceptual foundations
Building upon the previous discussion, a theoretical framework (Figure 1) was developed to consolidate insights from the literature, orient the inquiry and enable the examination of the proposed relationships (Garvey & Jones Reference Garvey and Jones2021). In addition, explicitly foregrounding theory also helps researchers surface underlying presuppositions and their epistemological commitments, supporting a more systematic search for evidence that challenges theory-led assumptions or predictions (Collins & Stockton Reference Collins and Stockton2018).
Theoretical framework.
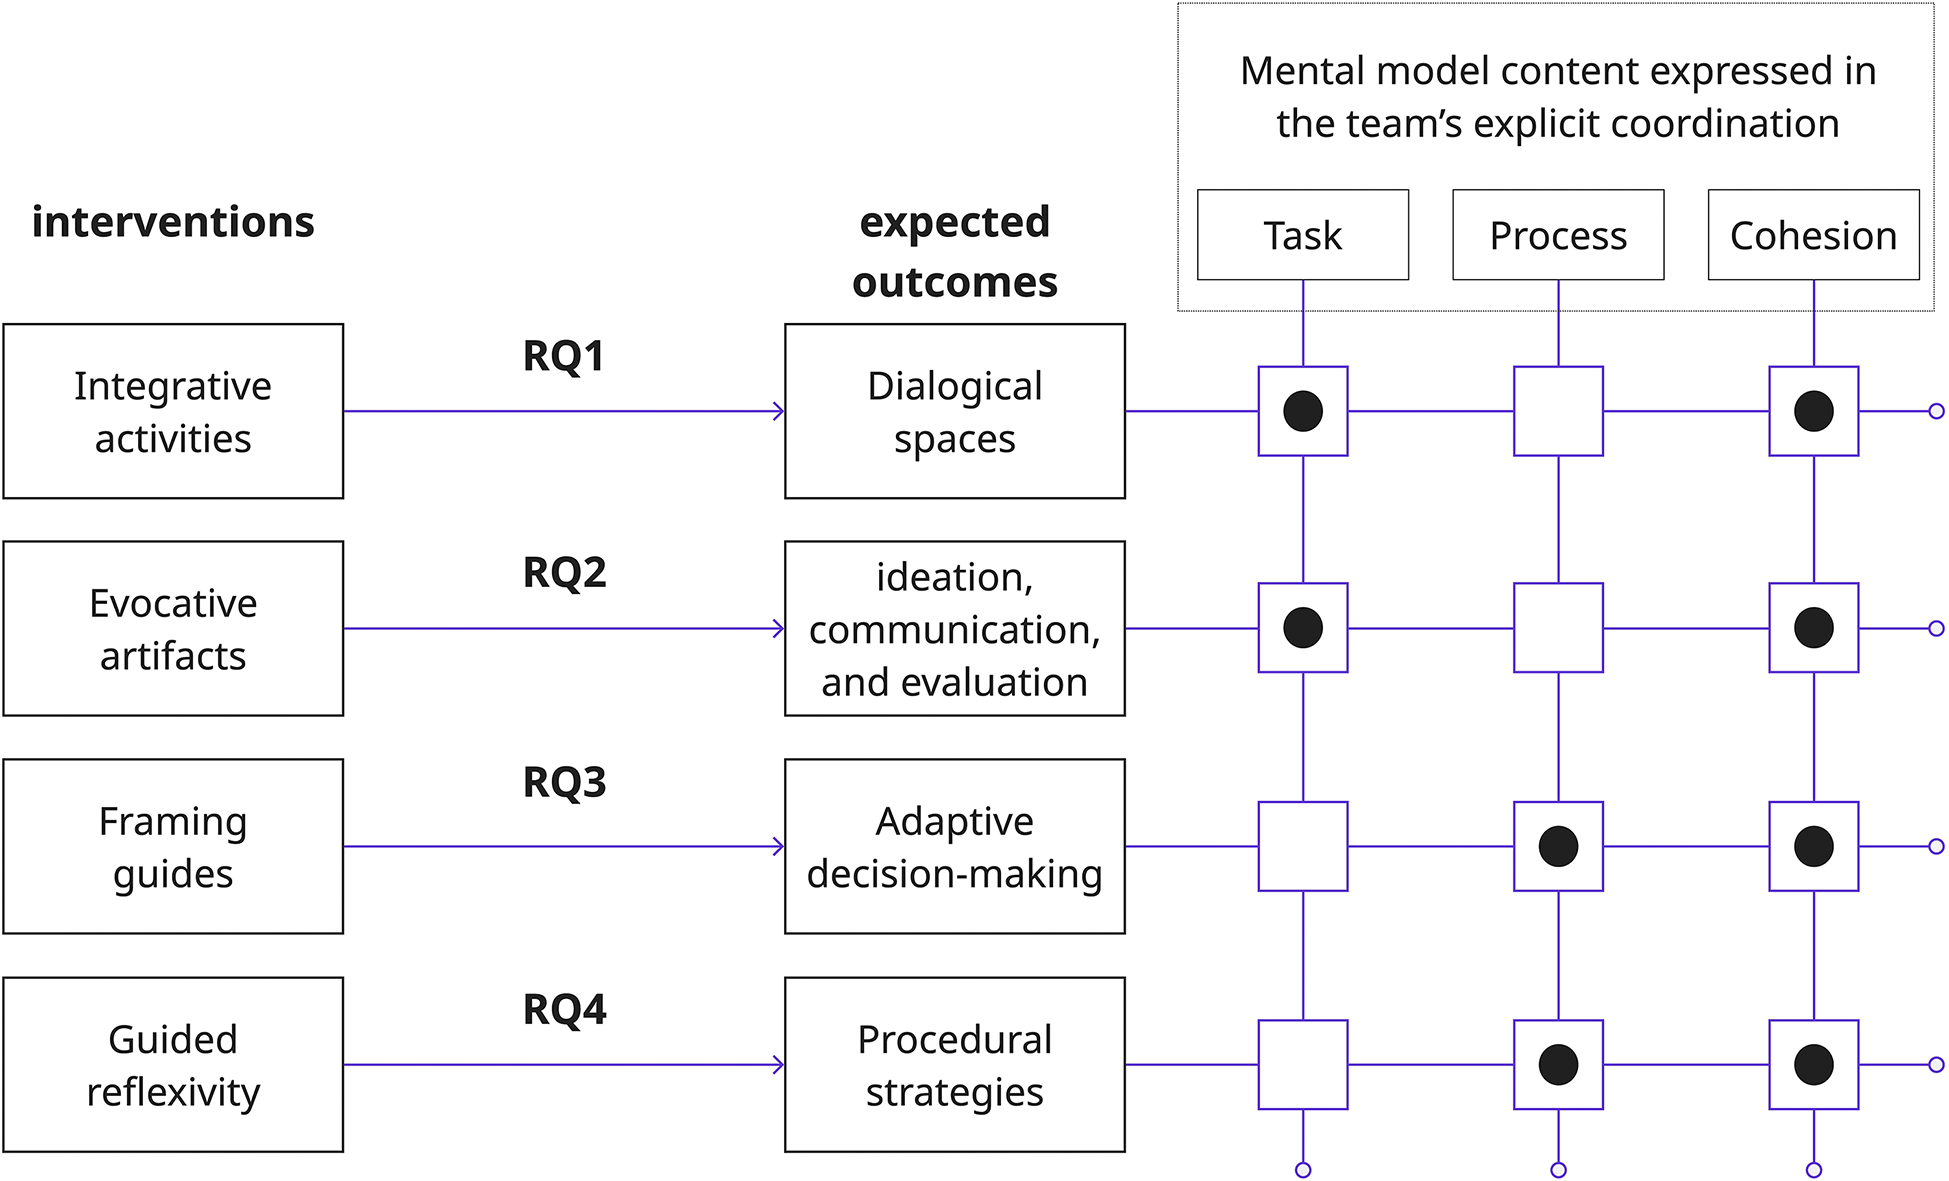
Figure 1. Long description
From left to right, the first column lists interventions: Integrative activities, Evocative artifacts, Framing guides, Guided reflexivity. Each intervention is linked by a rightward arrow to an expected outcome: Dialogical spaces, ideation communication and evaluation, Adaptive decision-making, Procedural strategies. Each outcome is aligned horizontally with three mental model content types: Task, Process, Cohesion. Filled squares indicate which content type is associated with each outcome. Dialogical spaces are linked to Task and Cohesion. Ideation communication and evaluation is linked to Task. Adaptive decision-making is linked to Process. Procedural strategies is linked to Cohesion. The top right box labels these as ‘Mental model content expressed in the team’s explicit coordination.’
This theoretical framework synthesizes conceptual links between systematic interventions, introduced by a facilitator or supported by artifacts, and the dependent dimensions underlying TMM sharedness (task, process and cohesion). Here, a parenthesis is important: because the model aims to map TMM dimensions, we acknowledge, consistent with prior research (Badke-Schaub et al. Reference Badke-Schaub, Neumann, Lauche, Boos, Kolbe, Kappeler and Ellwart2011; Casakin & Badke-Schaub Reference Casakin and Badke-Schaub2017), that the relationships among these dimensions are dynamic rather than static. Accordingly, the model specifies the most likely dimensions emerging from this process.
Finally, it provides an interpretive map that helps organize empirical material and justify analytic choices (Collins & Stockton Reference Collins and Stockton2018). Based on this, we specified sensitizing concepts and analytic categories capturing mechanisms through which collaborative activities shape team cognition and performance. The proposed framework also provided the foundation for establishing the research protocols and instruments detailed in the next section.
3. Research methods
To examine how the proposed interventions relate to the sharedness of TMMs in interdisciplinary co-design teams, this study applied a mixed-methods approach integrating qualitative and quantitative techniques to deepen interpretive insight and strengthen methodological rigor (Raghunath et al. Reference Raghunath, Koronis, Karthikayen, Silva and Yogiaman2023). An exploratory group study assessed variations in team processes between the facilitated condition (Group 1) and the unfacilitated condition (Group 2). The research began with a guiding question that oriented the literature review and the construction of a theoretical framework structured around four research questions, followed by two workshops designed to explore them. Two instruments supported analysis: the Categorization System for Verbal Activities in Design Teams, capturing explicit coordination behaviors (Badke-Schaub et al. Reference Badke-Schaub, Neumann, Lauche, Boos, Kolbe, Kappeler and Ellwart2011; Casakin & Badke-Schaub Reference Casakin and Badke-Schaub2017), and transition matrices built from coded communication data to identify patterns in code frequencies across groups (Arnarsson et al. Reference Arnarsson, Gustavsson, Jirstrand and Malmqvist2020). Figure 2 illustrates the research workflow for data collection, processing and analysis.
Research workflow of the data collection, processing and analysis process.
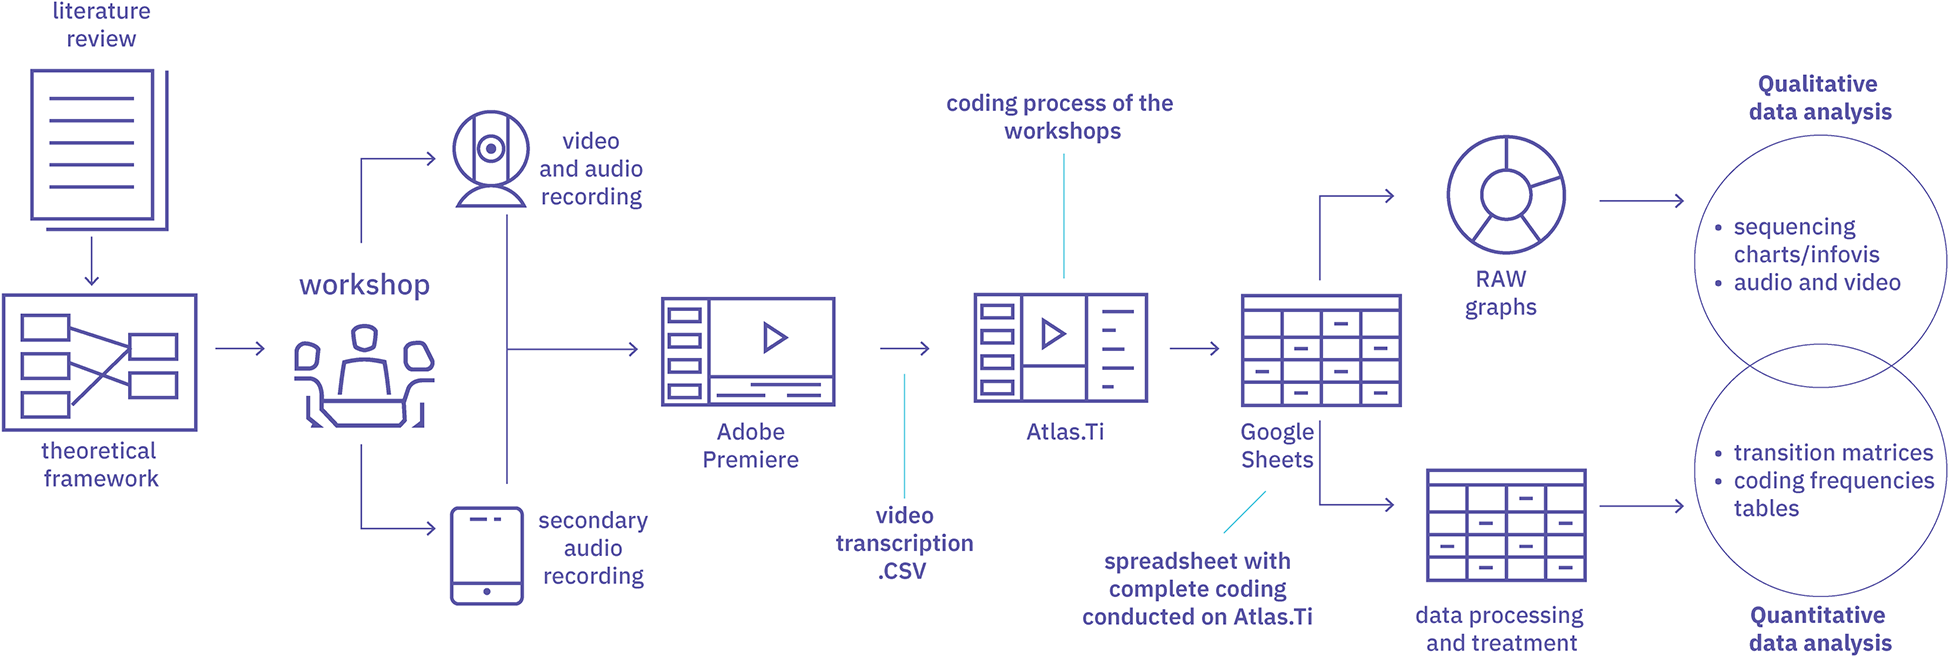
Figure 2. Long description
Starting at the far left, a document labeled literature review leads downward to a theoretical framework diagram. An arrow points right to a workshop icon, which branches into three paths: upward to video and audio recording, downward to secondary audio recording, and right to Adobe Premiere. From Adobe Premiere, an arrow points right to Atlas dot T I, labeled coding process of the workshops. From Atlas dot T I, an arrow points right to Google Sheets, with a downward arrow from Atlas dot T I labeled spreadsheet with complete coding conducted on Atlas dot T I. From Google Sheets, an arrow points right to a table labeled data processing and treatment. From data processing and treatment, two arrows branch right: the upper arrow leads to a circle labeled R A W graphs, which points to qualitative data analysis, listing sequencing charts forward slash infovis, audio and video. The lower arrow leads to quantitative data analysis, listing transition matrices and coding frequencies tables.
3.1. Brainsketching workshop operationalization
Grounded in the theoretical discussion from the previous section, specific protocols and instruments were developed. As Badke-Schaub et al. (Reference Badke-Schaub, Neumann, Lauche and Mohammed2007) argue, one way to assess how TMM content evolves during design processes is by observing team communication, either verbal exchanges or visual outputs such as sketches. Accordingly, the main instrument was the Categorization System for Verbal Activities (explicit coordination) in design teams (Casakin & Badke-Schaub Reference Casakin and Badke-Schaub2017). The group study experiment followed a brainsketching format, fostering the development of design proposals through drawings and sketches (Van Der Lugt Reference Van Der Lugt2002). Since sharedness does not depend on interaction length and a single meeting can suffice to explore TMMs in design activities (Casakin & Badke-Schaub Reference Casakin and Badke-Schaub2017), one workshop was conducted with each group.
3.1.1. Participants
Participants were recruited through an open call disseminated via the researchers’ professional networks. A questionnaire covering educational background, familiarity with infovis, participatory design experience and prior knowledge of the MHDI data was used for screening (The Municipal Human Development Index (MHDI; Portuguese: IDHM) is a 0–1 composite indicator for Brazilian municipalities that summarizes longevity, education and income and is reported in the Atlas of Human Development in Brazil. It was created as a joint institutional initiative of three organizations: the Instituto de Pesquisa Econômica Aplicada (Ipea), the United Nations Development Program (PNUD/UNDP) and the Fundação João Pinheiro (FJP) (Ipea, UNDP & FJP 2016)). Sixteen valid entries were collected, and selection was based on team composition and logistical constraints. Specifically, we reviewed each participant’s profile to identify feasible combinations for forming two teams. Ultimately, two groups of three members each were assembled, and all participants identified as female.
Team composition was balanced according to survey responses (see Table 1). Priority was given to three indicators: experience with infovis projects, experience with co-design processes and familiarity with the MHDI data. This ensured that each team had at least one member with co-design experience, one with prior knowledge of the database and one with comparable overall skills in infovis. Profession, years of experience and educational background were also considered to secure the groups’ interdisciplinary character. Based on these indicators, the teams were formed using them as control variables to balance composition. Table 1 presents the final groups, with each member represented by a unique ID (e.g., G1A), showing similar levels of infovis experience and familiarity with MHDI data, while also bringing together participants from diverse professional sectors.
Team composition
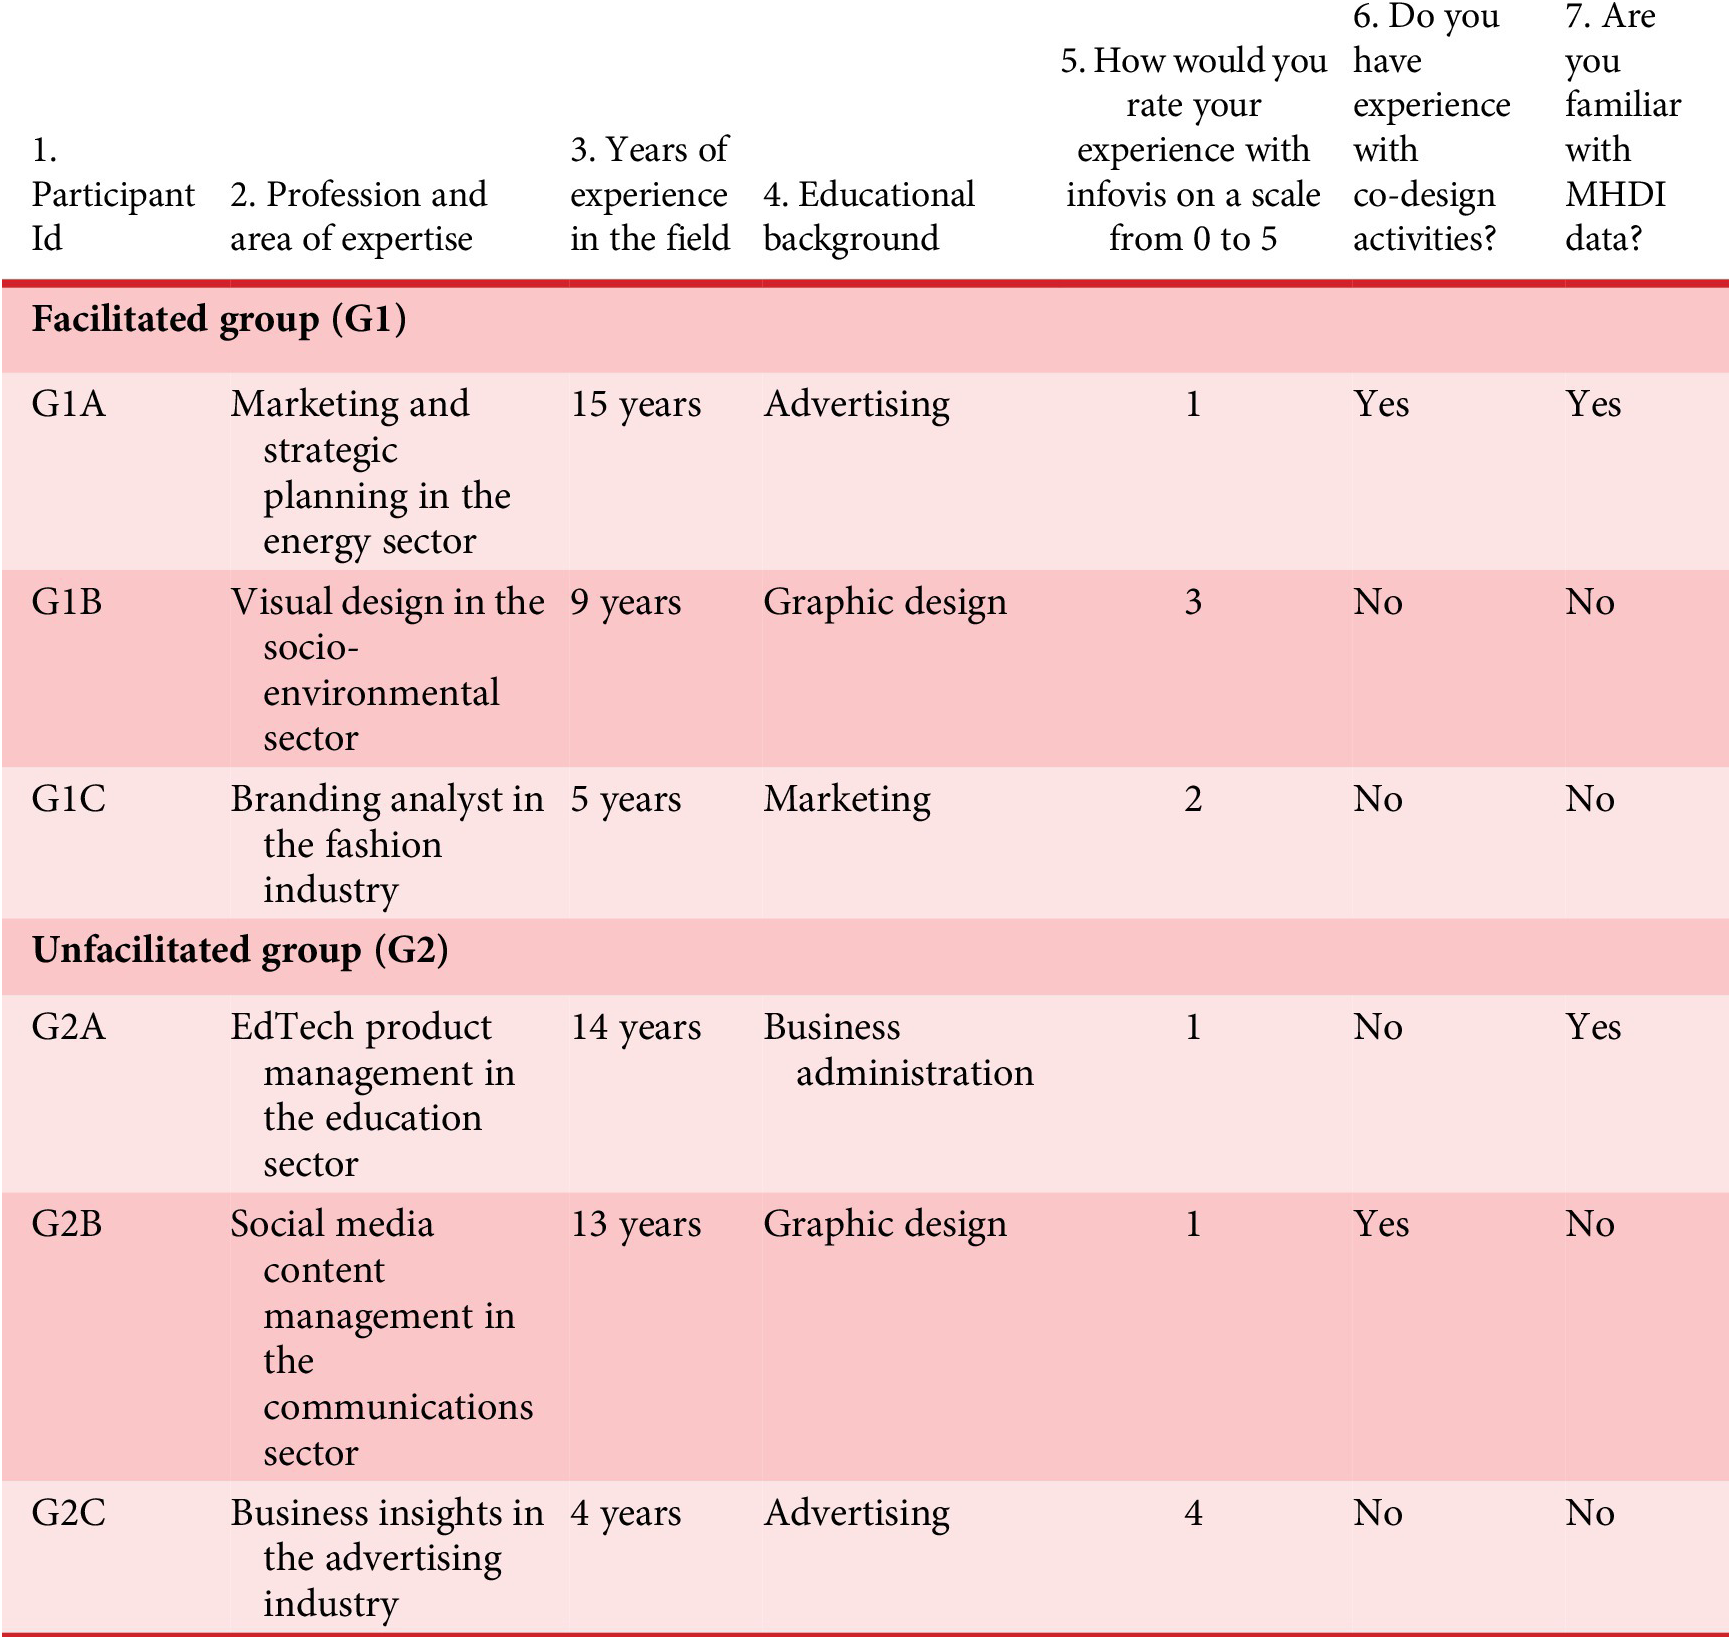
Table 1. Long description
The table header lists seven columns: 1. Participant Id, 2. Profession and area of expertise, 3. Years of experience in the field, 4. Educational background, 5. How would you rate your experience with infovis on a scale from 0 to 5, 6. Do you have experience with co-design activities, 7. Are you familiar with M H D I data. The first section is Facilitated group G1. G1A: Marketing and strategic planning in the energy sector, 15 years, Advertising, infovis experience 1, co-design Yes, M H D I Yes. G1B: Visual design in the socio-environmental sector, 9 years, Graphic design, infovis experience 3, co-design No, M H D I No. G1C: Branding analyst in the fashion industry, 5 years, Marketing, infovis experience 2, co-design No, M H D I No. The next section is Unfacilitated group G2. G2A: EdTech product management in the education sector, 14 years, Business administration, infovis experience 1, co-design No, M H D I Yes. G2B: Social media content management in the communications sector, 13 years, Graphic design, infovis experience 1, co-design Yes, M H D I No. G2C: Business insights in the advertising industry, 4 years, Advertising, infovis experience 4, co-design No, M H D I No.
More importantly, the terms “designer” and “stakeholder” are used as operational roles enacted during the co-design session rather than as fixed professional identities. This framing aligns with co-design literature that emphasizes collaborative making across designers and non-designers (Sanders & Stappers Reference Sanders and Stappers2014) and with infovis co-design research showing that participants’ responsibilities may shift across activities (Dörk et al. Reference Dörk, Müller, Stange, Herseni and Dittrich2020). Specifically, we define the designer role as the participant responsible for sketching and consolidating the group’s reasoning into a shared sketch or prototype, whereas the stakeholder role refers to contributions centered on domain interpretation, constraints and validation of the emerging artifact. Although these roles structure task execution, all participants acted as co-designers by jointly negotiating decisions through the materialized artifact.
3.1.2. Workshop structure
A workshop protocol was developed to guide the operationalization of the activities. As detailed in Appendix B, it specified the room layout, available materials, timing of the interventions for the facilitated condition and the facilitator’s role. Prior to the workshops, a pilot study was conducted to test the setup and validate the data collection and analysis procedures.
In both sessions, the second author served as the facilitator and followed the scripted protocol to ensure procedural consistency. Both groups received the same design brief (Appendix C) and worked under equivalent spatial and material conditions, using standard resources such as paper and pens. The brief outlined the objectives and tasks for an infovis project using MHDI data, provided four dataset samples and reinforced that the team should work collaboratively throughout the workshop. The facilitator also introduced the brainsketching approach and clarified that solutions should be presented as sketches that could include annotations and other visual resources to express proposals.
Then, participants were informed that they had 2 hours to develop their proposals and were encouraged to present three or more; however, the final number of solutions was left to each team’s judgment, including when they considered the proposals satisfactory in relation to the objectives stated in the brief and therefore concluded the activity. At the end of each session, participants presented their solutions to the facilitator. These solutions are presented in Appendix D (Figures D1–D4). Table 2 presents an overview of the workshops.
Synthesis of the brainsketching workshop

Table 2. Long description
The table has four columns labeled Group, Received interventions, Number of sketches presented, and Duration of the workshop. The first row lists Facilitated group, Yes, 3, and 1 hour 53 minutes 12 seconds. The second row lists Unfacilitated group, No, 3, and 1 hour 42 minutes 35 seconds. Both groups presented three sketches, but only the facilitated group received interventions and had a longer workshop duration.
As specified in the protocol (Appendix B), the facilitated group received the structured interventions described in the next section, whereas the unfacilitated group did not, establishing the main distinction between conditions. The facilitator provided introductory guidance and responded to clarification requests without shaping problem-solving strategies. The workshops were held on separate days (one per group) and documented via video recording.
3.2. Interventions and operationalization
In the facilitated group, interventions were operationalized through structured techniques and approaches designed to stimulate team dynamics. Each intervention was linked to a specific research question and implemented following the workshop script. It is important to note that, prior to the introduction of each intervention, the groups had no prior knowledge of the interventions, nor did they know that the workshop would be conducted with another group under different settings. To promote integrative behavior (RQ1), a guided warm-up used prompt cards with personal and professional questions. Participants introduced themselves, shared backgrounds and collectively discussed answers. To support evocative artifacts (RQ2), participants received nine A4 sheets with infovis examples categorized by function, including both conventional and creative cases to aid collaborative exploration during the workshop.
To implement the framing guide (RQ3), the facilitated group received worksheets with the prompt “I want to find out…,” followed by lines for open-ended responses. Their use was optional but encouraged to be collaborative. Guided reflexivity (RQ4) was introduced through two facilitator-led interventions, timed to prompt reflection on task progress and group processes: the first one hour into the activity, the second 40 min later. In each, the facilitator suggested reflection on completed work, next steps and established objectives. These interventions were designed to structure collaboration and to examine their association with TMM sharedness in the facilitated condition. Table 3 summarizes the facilitated condition.
Synthesis of how each intervention was operationalized within the facilitated group (G1) during the brainsketching workshop
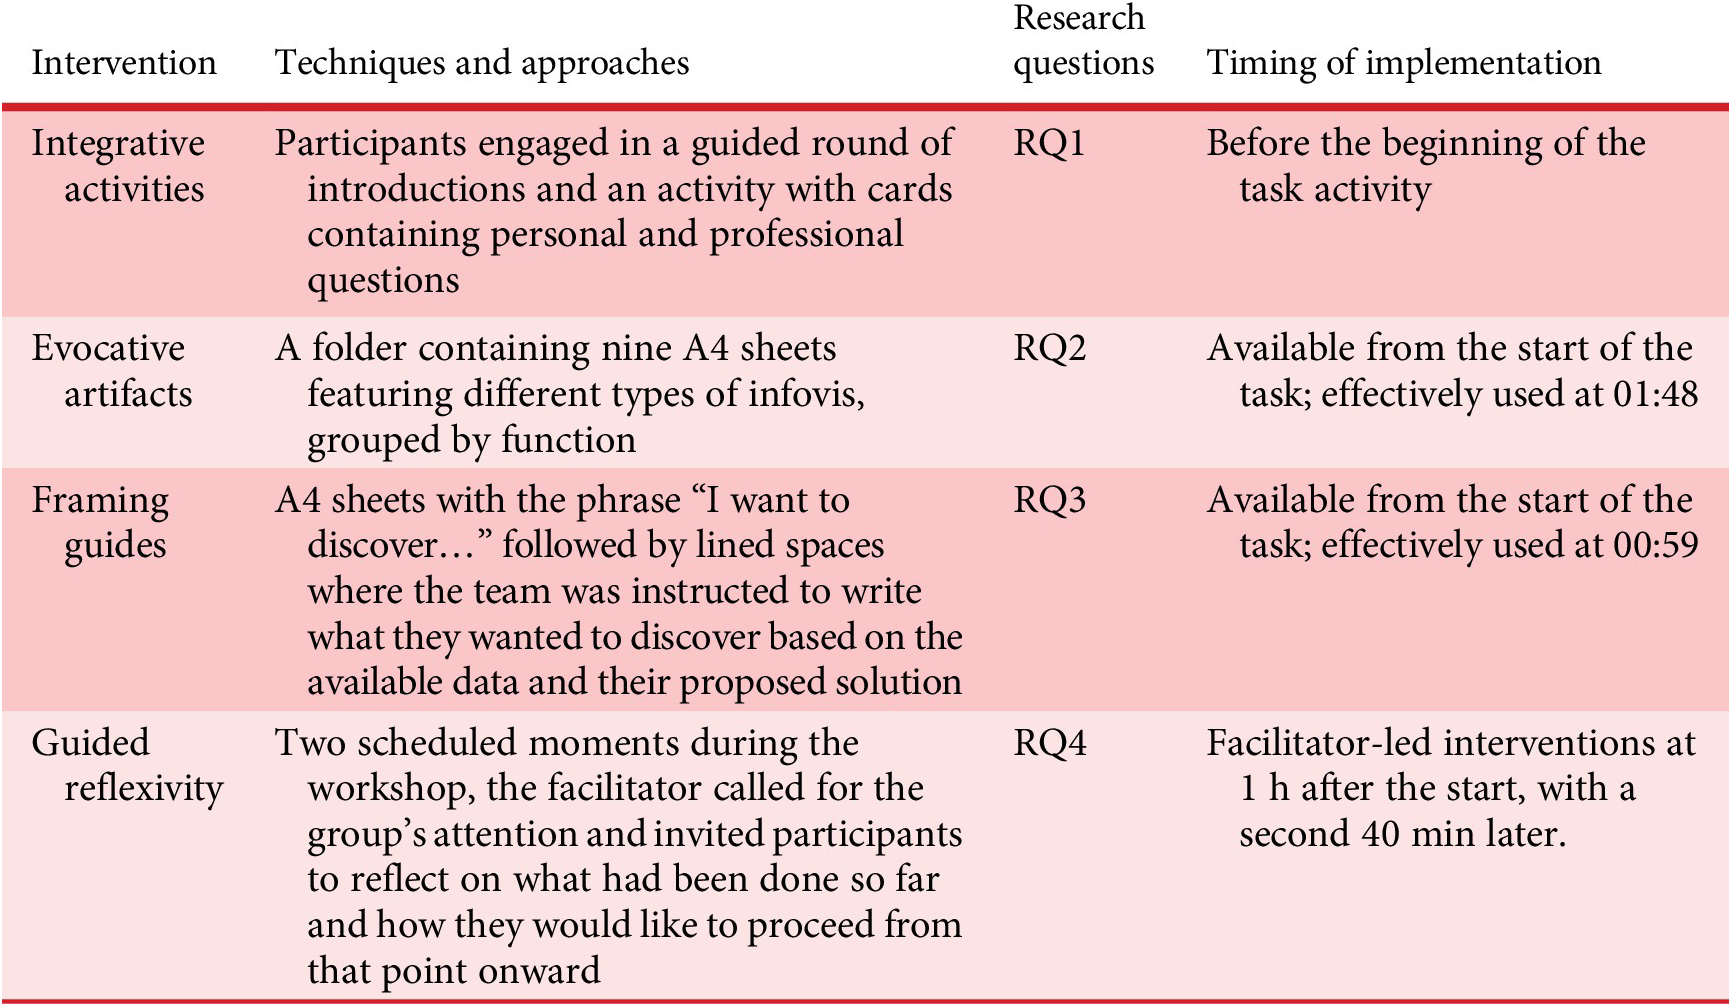
Table 3. Long description
Beginning at the top row, the table has four columns labeled Intervention, Techniques and approaches, Research questions, and Timing of implementation. The first row details Integrative activities, where participants engaged in guided introductions and card activities with personal and professional questions, linked to R Q 1 and implemented before the task activity. The second row describes Evocative artifacts, a folder with nine A 4 sheets of infovis grouped by function, associated with R Q 2, available from the start and used at 01:48. The third row covers Framing guides, A 4 sheets with ‘I want to discover’ and lined spaces for team input, tied to R Q 3, available from the start and used at 00:59. The fourth row presents Guided reflexivity, with two scheduled facilitator-led moments for group reflection, related to R Q 4, occurring at 1 hour and again 40 minutes later.
The control variables considered in the study included team size, team composition (working experience, years of experience and educational background), experience with infovis projects, experience with the co-design process and familiarity with the MHDI dataset. As proposed by Santos et al. (Reference Santos, Uitdewilligen and Passos2015), team size can affect the formation of TMMs. Working experience was measured by years in participants’ fields, while educational background and profession ensured interdisciplinary composition. The other variables guaranteed that each group had at least one professional with experience in infovis projects, co-design and the dataset used in the brief. Familiarity with MHDI data was considered essential to reduce biases and keep groups balanced.
3.3. Coding and data analysis
A detailed coding protocol was developed for analyzing verbal interactions. As outlined earlier, the procedure followed the categorization system of Casakin & Badke-Schaub (Reference Casakin and Badke-Schaub2017), which supports systematic analysis of team-based design dialogue. Coded protocols provide a foundation for identifying patterns and associations in design activities, and correspondence analysis is effective in revealing relationships between protocol categories, including design processes and participant roles (Gero & Milovanovic Reference Gero and Milovanovic2020).
Following Casakin & Badke-Schaub (Reference Casakin and Badke-Schaub2017), we analyzed TMMs across three content domains: taskwork, process and cohesion. Taskwork captures communication of knowledge, including framing and the generation, analysis, explanation and evaluation of solutions. Process refers to assumptions about how work should be approached, such as strategies, procedures, planning, execution and reflections on progress. Cohesion captures social-relational interaction, expressed through appreciation, confirmation, rejection, questioning or support. Video recordings were transcribed, segmented into discrete utterances and coded hierarchically by speaker, TMM domain and subcategory (Table 4). This structure enabled analysis of sequential design “moves,” defined as discrete actions or decision steps in problem-solving (Gero & Milovanovic Reference Gero and Milovanovic2020).
Categorization system for verbal activities (explicit coordination) in design teams
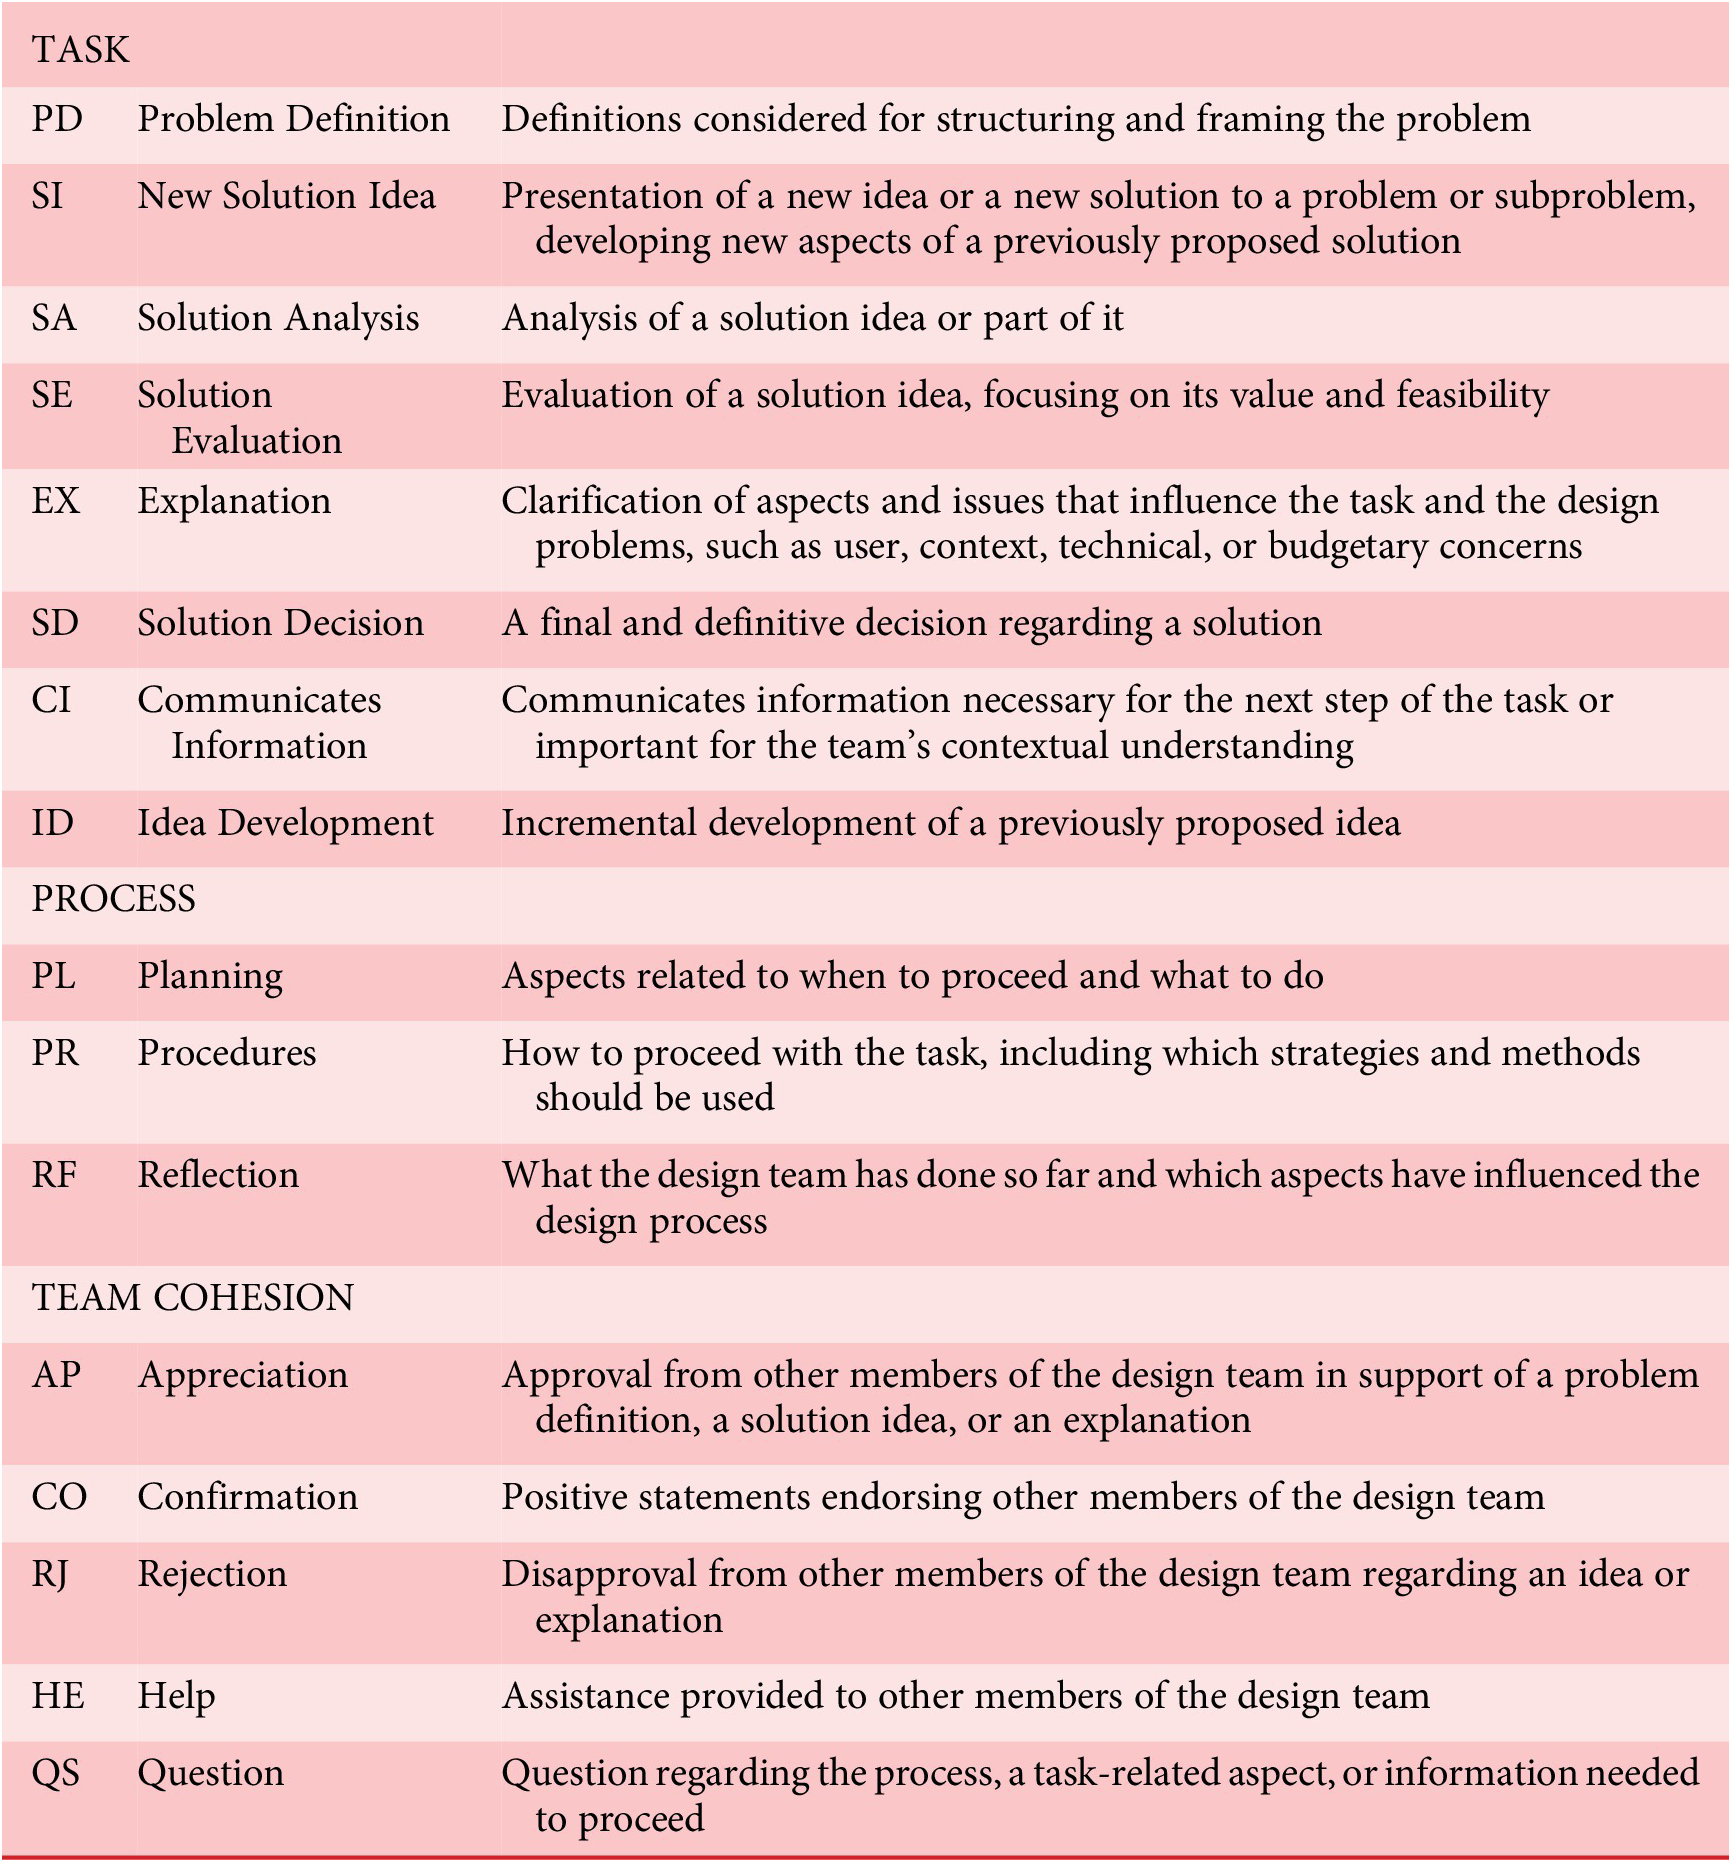
Table 4. Long description
From top to bottom, the table is divided into three main categories: TASK, PROCESS, and TEAM COHESION. Under TASK, the initialisms and their corresponding activities are: P D for Problem Definition, defined as definitions considered for structuring and framing the problem; S I for New Solution Idea, presentation of a new idea or solution to a problem or subproblem, or developing new aspects of a previously proposed solution; S A for Solution Analysis, analysis of a solution idea or part of it; S E for Solution Evaluation, evaluation of a solution idea focusing on its value and feasibility; E X for Explanation, clarification of aspects and issues influencing the task and design problems, such as user, context, technical, or budgetary concerns; S D for Solution Decision, a final and definitive decision regarding a solution; C I for Communicates Information, information necessary for the next step or important for the team’s contextual understanding; I D for Idea Development, incremental development of a previously proposed idea. The next category, PROCESS, includes: P L for Planning, aspects related to when to proceed and what to do; P R for Procedures, how to proceed with the task, including strategies and methods; R F for Reflection, what the team has done so far and which aspects have influenced the process. The final category, TEAM COHESION, includes: A P for Appreciation, approval from other members in support of a problem definition, solution idea, or explanation; C O for Confirmation, positive statements endorsing other members; R J for Rejection, disapproval regarding an idea or explanation; H E for Help, assistance provided to other members; Q S for Question, questions regarding the process, task-related aspects, or information needed to proceed. Each row lists the initialism in the first column, the activity name in the second, and the definition in the third, proceeding left to right.
Source: Adapted from Casakin & Badke-Schaub (Reference Casakin and Badke-Schaub2017).
We conducted a deductive reflexive thematic analysis (Braun & Clarke, Reference Braun and Clarke2021; Bodell et al. Reference Bodell, Pannunzio, Houwen, Lamé, Snelders and Kleinsmann2025), in which existing research and theory provide the analytic lens for interpreting participants’ talk (Braun & Clarke, Reference Braun and Clarke2021). In this approach, analytic rigor is demonstrated through transparent engagement with the data, theoretically informed interpretation and documentation of decisions, rather than through inter-coder reliability coefficients. Braun & Clarke (Reference Braun and Clarke2021) emphasize the researcher’s subjectivity as an analytic resource, requiring iterative reflection on how theoretical commitments shape coding and interpretation. Accordingly, our coding drew on established constructs to make visible patterns not always articulated explicitly, while also being contextually supported by the video recordings and remaining grounded in the transcript excerpts and the study’s conceptual commitments (Braun & Clarke Reference Braun and Clarke2021).
Procedurally, we followed Braun & Clarke’s (Reference Braun and Clarke2021) and Bodell et al. (Reference Bodell, Pannunzio, Houwen, Lamé, Snelders and Kleinsmann2025) phases of familiarization, coding, category development, review, refinement and reporting, maintaining an audit trail via analytic memos and code exports. Initial coding was completed by the first author, who recorded rationales, uncertainties and links among codes. The second and third authors then reviewed the dataset in cycles focused on code–category alignment and category coherence, consistent with collaborative reflexive TA practice (Bodell et al. Reference Bodell, Pannunzio, Houwen, Lamé, Snelders and Kleinsmann2025). During the first cycle, the authors identified the need to include three additional codes: question (QS), communicates information (CI) and idea development (ID). Subsequent cycles focused on category labeling and interpretive nuances. After three iterations, consensus was achieved, and a 24.9% modification rate was recorded, corresponding to the proportion of utterances whose code assignments changed between the initial and final versions; 75.1% remained unchanged. Coded examples appear in Appendix A.
3.3.1. Quantitative data analysis
In this research, transition matrices were used to detect patterns in explicit coordination processes of design teams. They enable analysis of immediate shifts between coded utterances, showing how teams move between activities such as discussing requirements, generating ideas or reflecting on procedures. This reveals recurrent patterns, dominant sequences and rarely observed transitions that may signal underutilized or hindered activities (Arnarsson et al. Reference Arnarsson, Gustavsson, Jirstrand and Malmqvist2020). By mapping these sequential structures, the method provides a systematic basis for interpreting team interaction dynamics during co-design tasks.
The construction of the matrices followed this process. Coded verbal data were exported from Atlas.ti, with each team’s utterances converted into discrete states defined in the coding system. Following Bakeman & Quera’s (Reference Bakeman and Quera2011) framework, raw transition tallies were organized into contingency tables where each row represented the origin and each column the destination. Observed frequencies were normalized by row totals, expressed as percentages, providing a descriptive measure of communicative behaviors. To establish a reference for interpretation, a uniform baseline assigned equal probabilities to all possible transitions from each state, consistent with expected frequencies under a null model of independence (Bakeman & Quera Reference Bakeman and Quera2011).
Given the above, deviations were calculated in percentage points by subtracting baseline values from observed proportions. As Bakeman & Quera (Reference Bakeman and Quera2011) note, deviations show the extent to which transitions occur more or less frequently than expected by chance. Combining uniform baseline expectations and deviations, the matrices provided an analytic framework for identifying salient communicative patterns while remaining sensitive to sample size constraints. To assess statistical significance, chi-square tests of independence verified whether distribution patterns differed significantly between groups (Casakin & Badke-Schaub Reference Casakin and Badke-Schaub2017). The matrices thus highlighted reliance on specific verbal activities, providing a systematic framework that guided subsequent qualitative interpretation of communicative patterns. Finally, Tables 6 and 7 report percentage-point deviations (rather than raw percentages) because deviations directly express departures from the chance baseline, making it easier to interpret which transitions are meaningfully over or under-represented in the teams’ interaction patterns independent of the overall distribution of codes.
3.3.2. Qualitative data analysis
For the qualitative coding analysis, infovis techniques were used to interpret sequential coding patterns and trace explicit team coordination over time. This approach also supported the assessment of contextual conditions related to code sequences at specific moments. The coded data were processed in spreadsheets for visual and tabular modeling, with charts generated in RAWGraphs for multidimensional cross-referencing of categories and indicators. The charts were organized by the three TMM dimensions, task, process and cohesion, which enabled visualization of how group discourse changed over time. Final visualizations integrated Atlas.ti sequence IDs, enabling direct linkage between chart elements and transcript excerpts; along with tables and matrices, these were imported into an online whiteboard for comparative analysis.
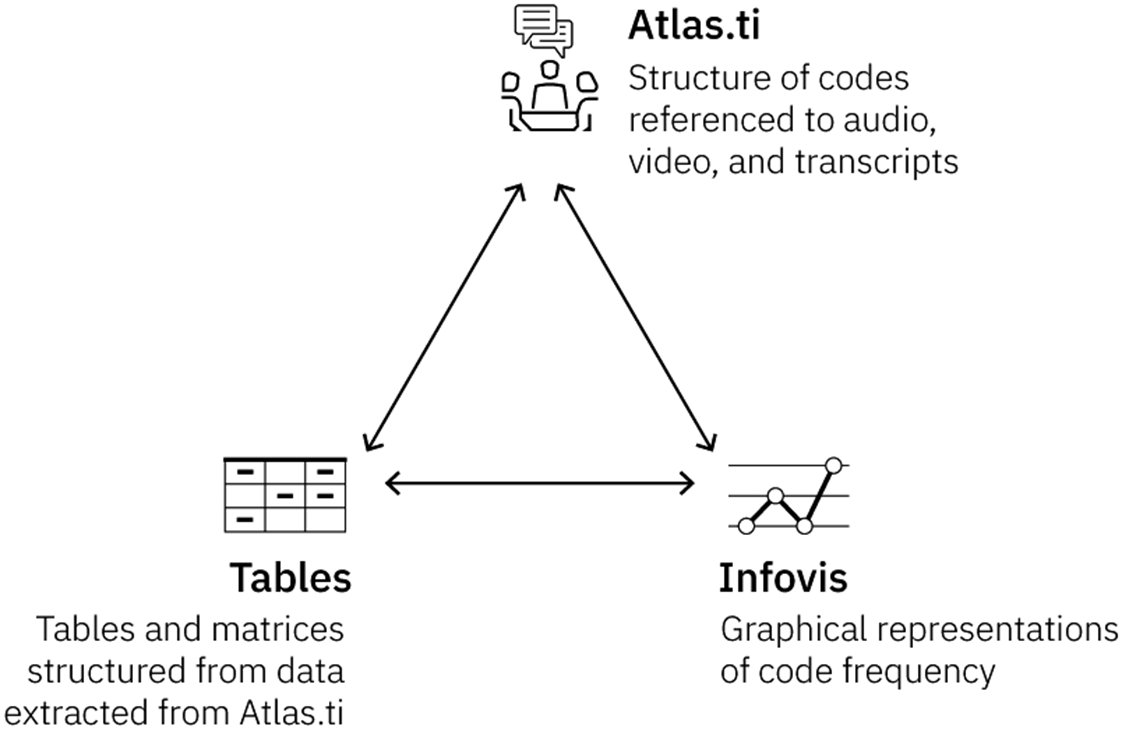
The integration of visualizations, transition matrices and video-linked excerpts enabled a dynamic, iterative analytic workflow in which team discussion became inspectable across complementary levels of abstraction (see Figure 3). Visualizations served as instruments to analyze the distributional patterns in coded talk, thereby directing attention to moments requiring closer qualitative interpretation. Next, Atlas.ti sequence IDs maintained traceability back to the underlying transcript segments and recordings, supporting interpretive lenses grounded in interactional evidence. In parallel, transition matrices indicated which transitions were over- or under-represented relative to baseline expectations. Taken together, this cyclical, cross-referenced approach functioned as a unified analytical framework, moving from granular, code-level patterns to situated excerpts and back, thereby strengthening triangulation and enhancing the explanatory depth of the findings.
Data analysis triangulation.
In addition, for RQ1, a beeswarm chart (see Figure 4) was created using the first 100 excerpts (n = 100) from each group because this intervention occurred prior to task initiation, and we wanted to observe the initial panorama of the codes. The chart provided an initial overview of each group’s verbal enactment. For RQ2, RQ3 and RQ4, we used RAWGraphs’ connected bubble chart template (see Figures 6–13). This format supported granular analysis of team utterances by tracing how each team’s discourse evolved following the intervention and in response to salient interactional moments. To systematize the analysis, these figures display 27-code windows cropped from each team’s continuous sequence. This fixed-length approach provides a standardized analytic unit, allowing us to examine local interactional moments with consistency. By using a uniform span, we can track shifts in coding relative to both the initial utterance and the focal event, enabling a comparative investigation of iterative patterns across all teams.
Sample of the first one hundred excerpts (n = 100) from each group. The beeswarm plot on the left represents codes from the facilitated group, and the plot on the right represents the unfacilitated group.
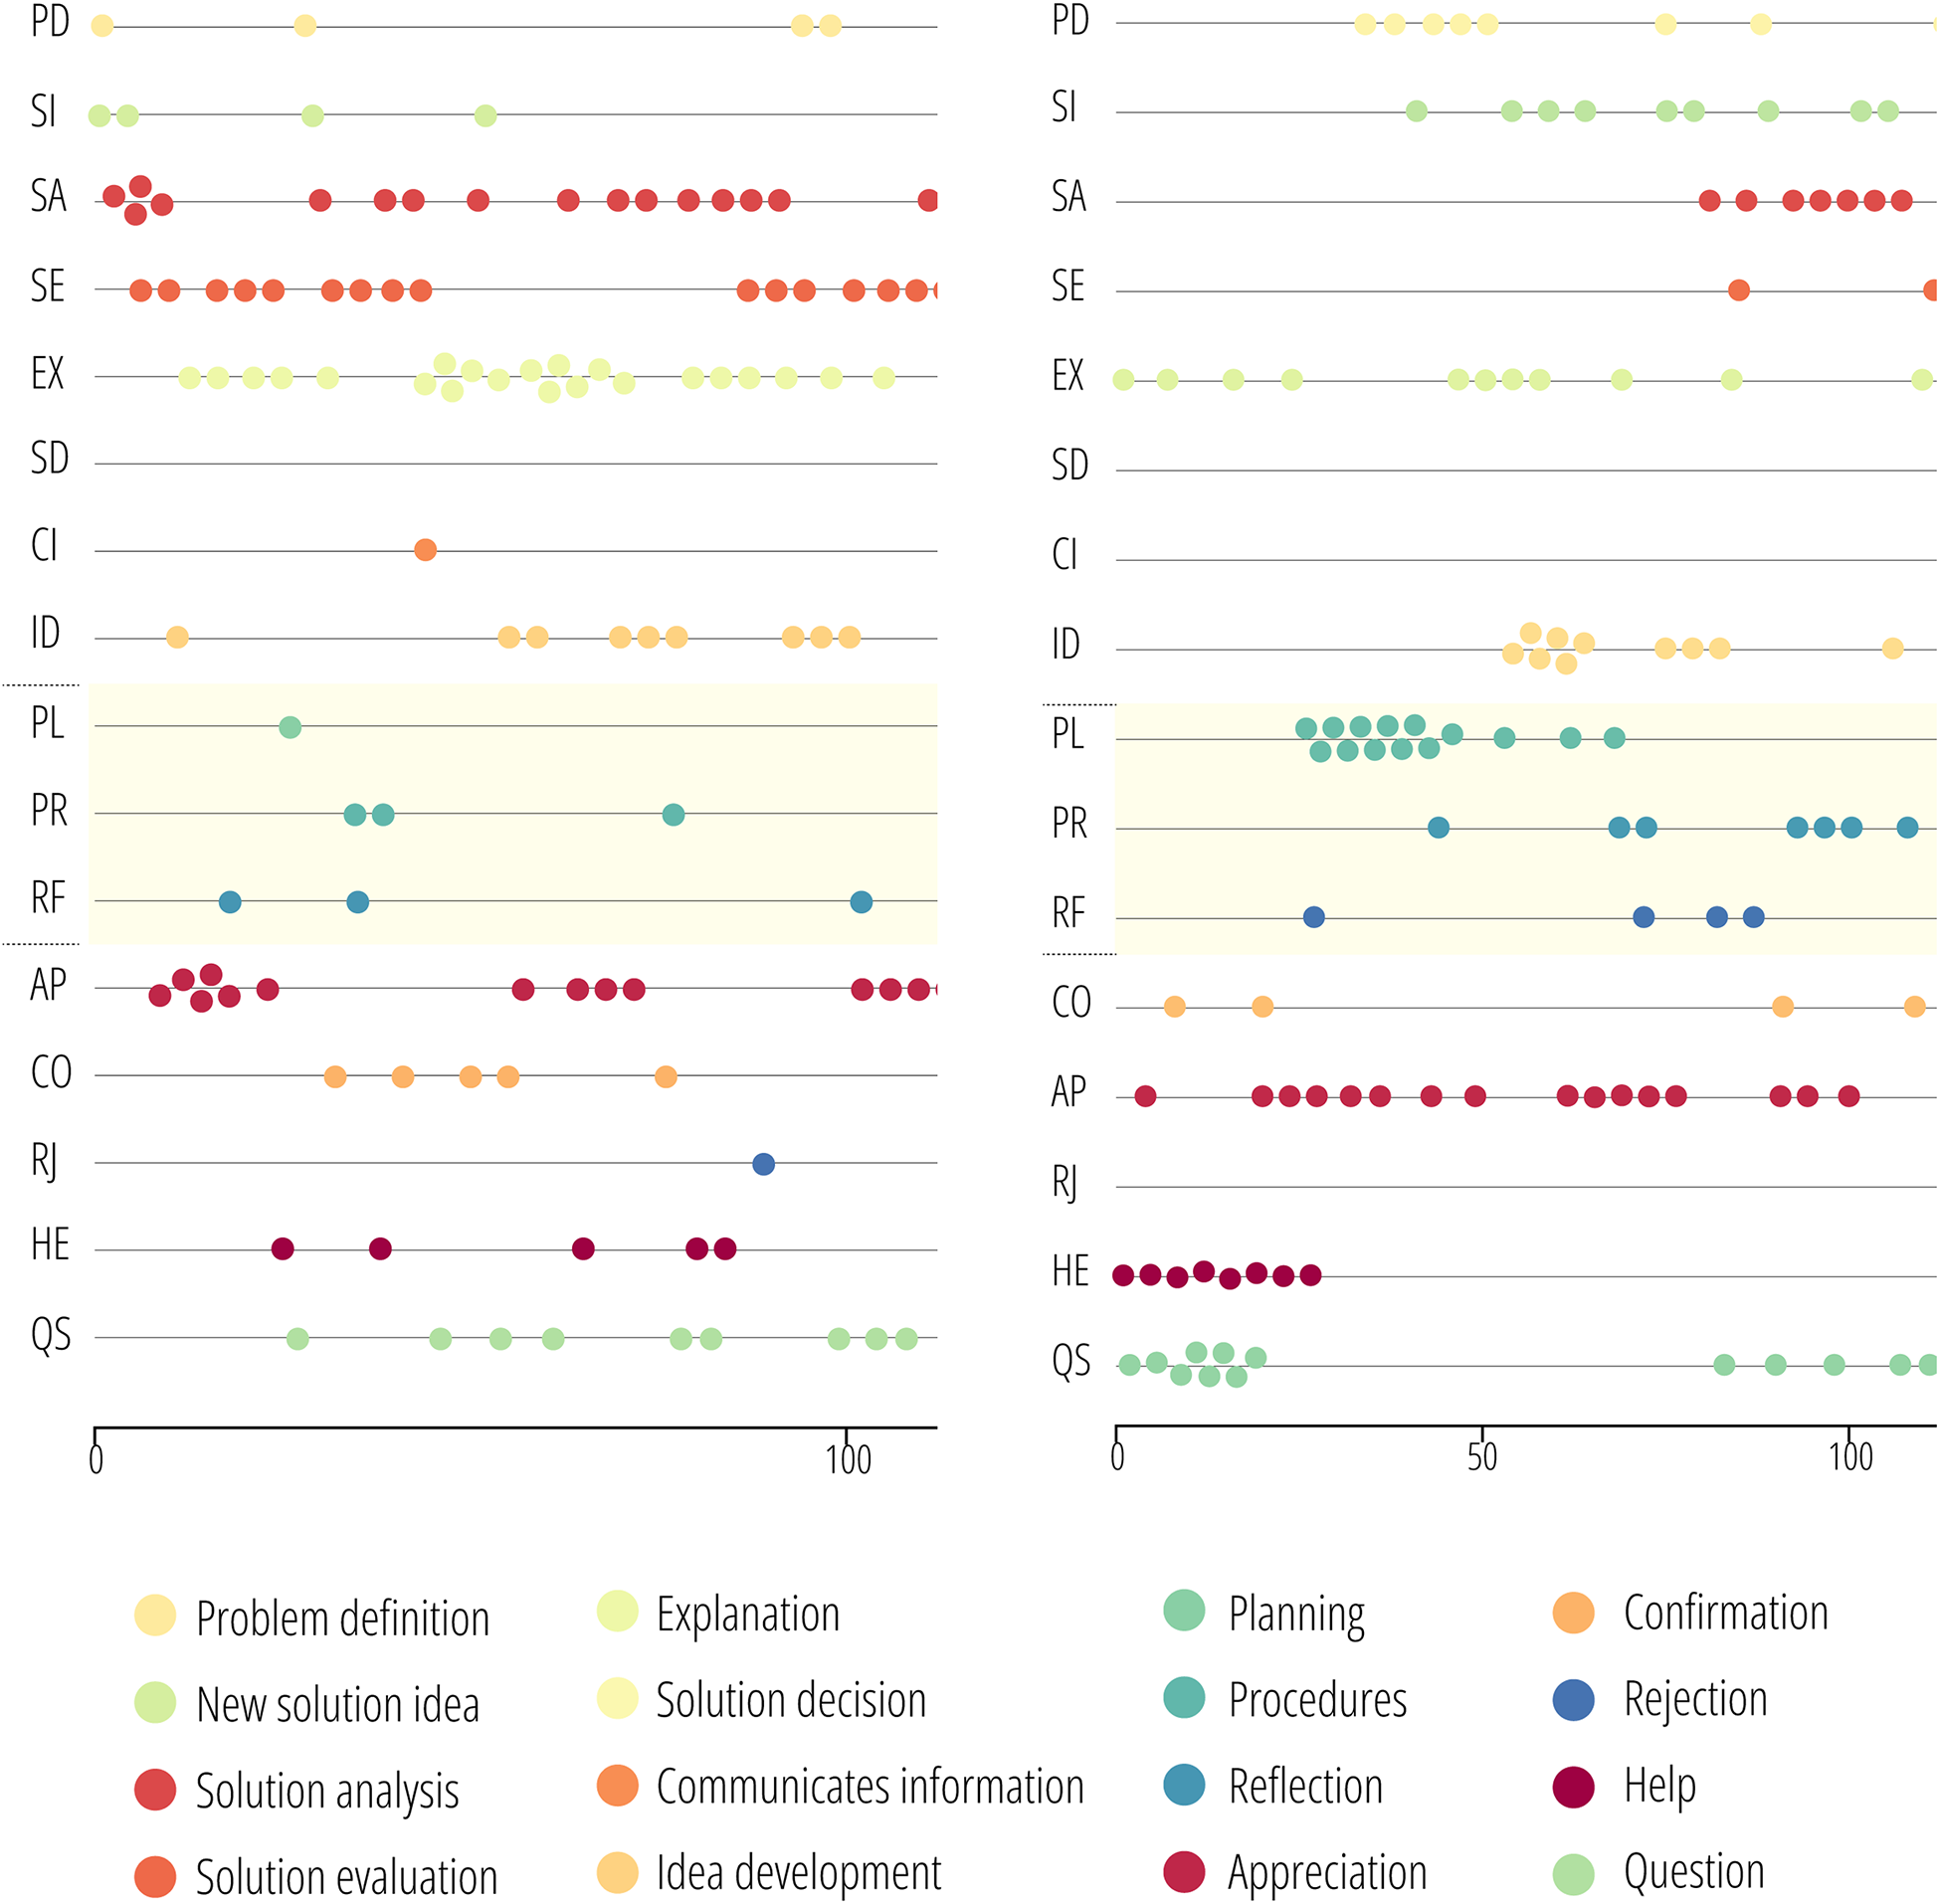
Figure 4. Long description
There are two vertical beeswarm plots side by side. The left plot represents the facilitated group, the right plot the unfacilitated group. Both plots have the same y-axis codes: from top to bottom, PD, SI, SA, SE, EX, SD, CI, ID, PL, PR, RF, AP, CO, RJ, HE, QS. The x-axis for both runs from 0 to 100, representing excerpt indices. Each code is represented by colored dots, with the color corresponding to a specific code type as indicated in the legend below. For the facilitated group, codes such as SE, EX, and AP show dense clustering, while others like PR and RF are sparse. In the unfacilitated group, codes like PL, EX, and AP are more densely populated, with a notable cluster of PL and EX between indices 20 and 80. The legend at the bottom assigns colors to each code: Problem definition (light yellow), New solution idea (light green), Solution analysis (red-orange), Solution evaluation (red), Explanation (yellow), Solution decision (light orange), Communicates information (orange), Idea development (yellow-orange), Planning (green), Procedures (teal), Reflection (blue), Appreciation (dark red), Confirmation (orange), Rejection (blue), Help (dark red), Question (light green). The background of the PL, PR, and RF rows is shaded. The distribution and density of codes differ between the two groups, with some codes appearing more frequently or in different patterns depending on facilitation.
Moreover, transition matrices enabled the identification of relational patterns among codes, through the presence or absence of representative values, offering a comparative perspective between groups. Qualitative analysis focused on moments when the facilitated group interacted with artifacts or formal mechanisms linked to the interventions (see Table 3). These observations, derived from audio and video records, were analyzed with the corresponding codes in tabular format and in visualization sequences.
Finally, the only intervention not directly traced in the facilitated group was integrative activities, as these occurred before the task. To address this, patterns were identified in cohesion codes and utterances linked to the research question. The unfacilitated group, lacking interventions, required identification of segments where the focal construct was observable in participants’ interaction, such as semantic barriers, reflective moments or situations of debate related to a decision to be made. In these moments, the sequences of codes were analyzed. These and other events are presented in the next section.
4. Results
The two groups displayed distinct collaborative behaviors that went beyond differences in overall communication volume (see Table 5), revealing contrasting modes of operation. The facilitated group enacted a more horizontally distributed workflow, with spontaneous role rotation between participants who consolidated the shared sketch and those who actively consulted the data tables and communicated task-relevant information to support the evolving artifact. In contrast, the unfacilitated group adopted a more centralized organization in which one participant (G2B, the graphic designer) primarily produced the consolidated visualization sketches and often sought information directly from the tables, while other members contributed through partial sketches and annotations. Despite these operational differences, both teams engaged in collaborative group reasoning and decision-making. This aspect is explored in more detail below.
Frequencies of subcategories of the task, process and team cohesion
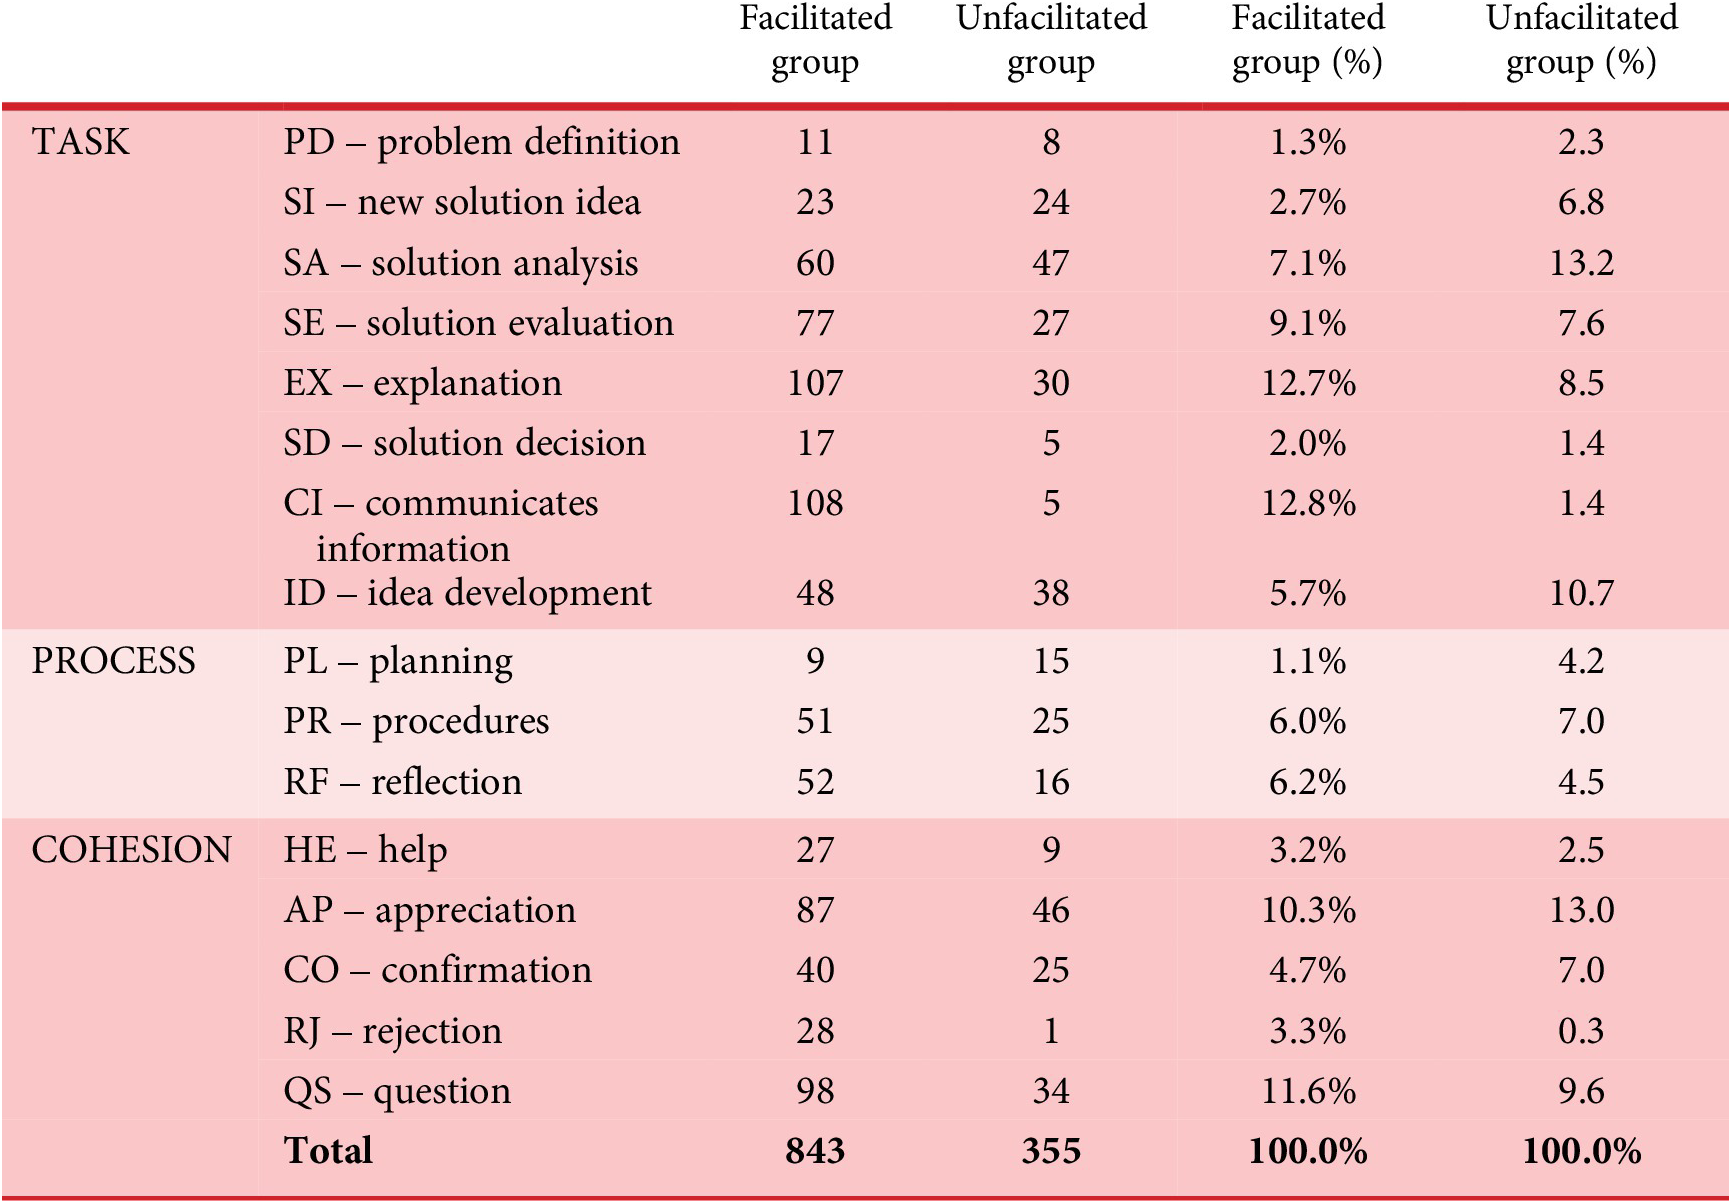
Table 5. Long description
Starting from the top, the table is divided into three main vertical sections: TASK, PROCESS, and COHESION. Each section contains subcategories listed in order. For TASK, subcategories are PD (problem definition), SI (new solution idea), SA (solution analysis), SE (solution evaluation), EX (explanation), SD (solution decision), CI (communicates information), and ID (idea development). For PROCESS, subcategories are PL (planning), PR (procedures), and RF (reflection). For COHESION, subcategories are HE (help), AP (appreciation), CO (confirmation), RJ (rejection), and QS (question). Each row presents counts and percentages for facilitated and unfacilitated groups, moving left-to-right across columns. For example, CI in TASK shows 108 occurrences and 12.8 percent for facilitated, versus 5 occurrences and 1.4 percent for unfacilitated. The total row at the bottom summarizes all counts: 843 for facilitated and 355 for unfacilitated, both at 100 percent. The spatial order follows vertical category grouping, then horizontal comparison by group.
Moreover, given the exploratory nature of the study and the small sample size, transition matrices were employed to detect patterns in team communication, which then informed the qualitative interpretation of the data. This approach enabled the identification of patterns in verbal interactions without inferring statistical significance, consistent with the preliminary nature of the findings.
We begin with a quantitative analysis of the coded data. The two groups exhibited distinct interaction patterns and overall communication styles. As shown in Table 5, the facilitated group produced a total of 843 coded utterances across the task, process and cohesion categories, while the unfacilitated group generated 355 utterances within the same coding system. In addition, the chi-square test of independence revealed a significant difference between the two groups in the distribution of utterance counts across mental model subcategories (χ2 = 99.418, df = 15, p < 0.001), evidencing distinctive communicative patterns between the two groups during their design processes.
Focusing on the subcategories of coded data, Table 5 shows that the facilitated group exhibited notably higher frequencies in “communicates information” (CI), “reflection” (RF) and “question” (QS). Meanwhile, the unfacilitated group exhibited higher frequencies in categories such as “solution analysis” (SA) and “appreciation” (AP), reflecting a distinct organizational pattern and a slower pace of iteration, resulting in fewer instances of explicit reflection when compared to the facilitated group.
The analysis of the transition matrices enabled the detection of recurrent code patterns in team communication, the examination of relationships between specific codes and the identification of gaps in explicit coordination among team members (see Tables 4 and 5). Next, for each group, we calculated the deviation from a uniform baseline distribution, where all transitions would be equally likely (6.25% for 16 possible destination codes). Positive deviations indicate transitions that occurred more frequently than expected by chance, while negative deviations represent less common sequences.
The following analysis examined how these codes combined sequentially in each group, with deviations from the uniform baseline (expressed in percentage points) serving as indicators of characteristic communication patterns. Tables 6 and 7 present the complete deviation matrices, while our interpretation focuses on transitions with deviations exceeding ±10 percentage points, as these represent the most distinctive patterns in each group’s communication structure.
Facilitated group deviations from uniform baseline (percentage points)
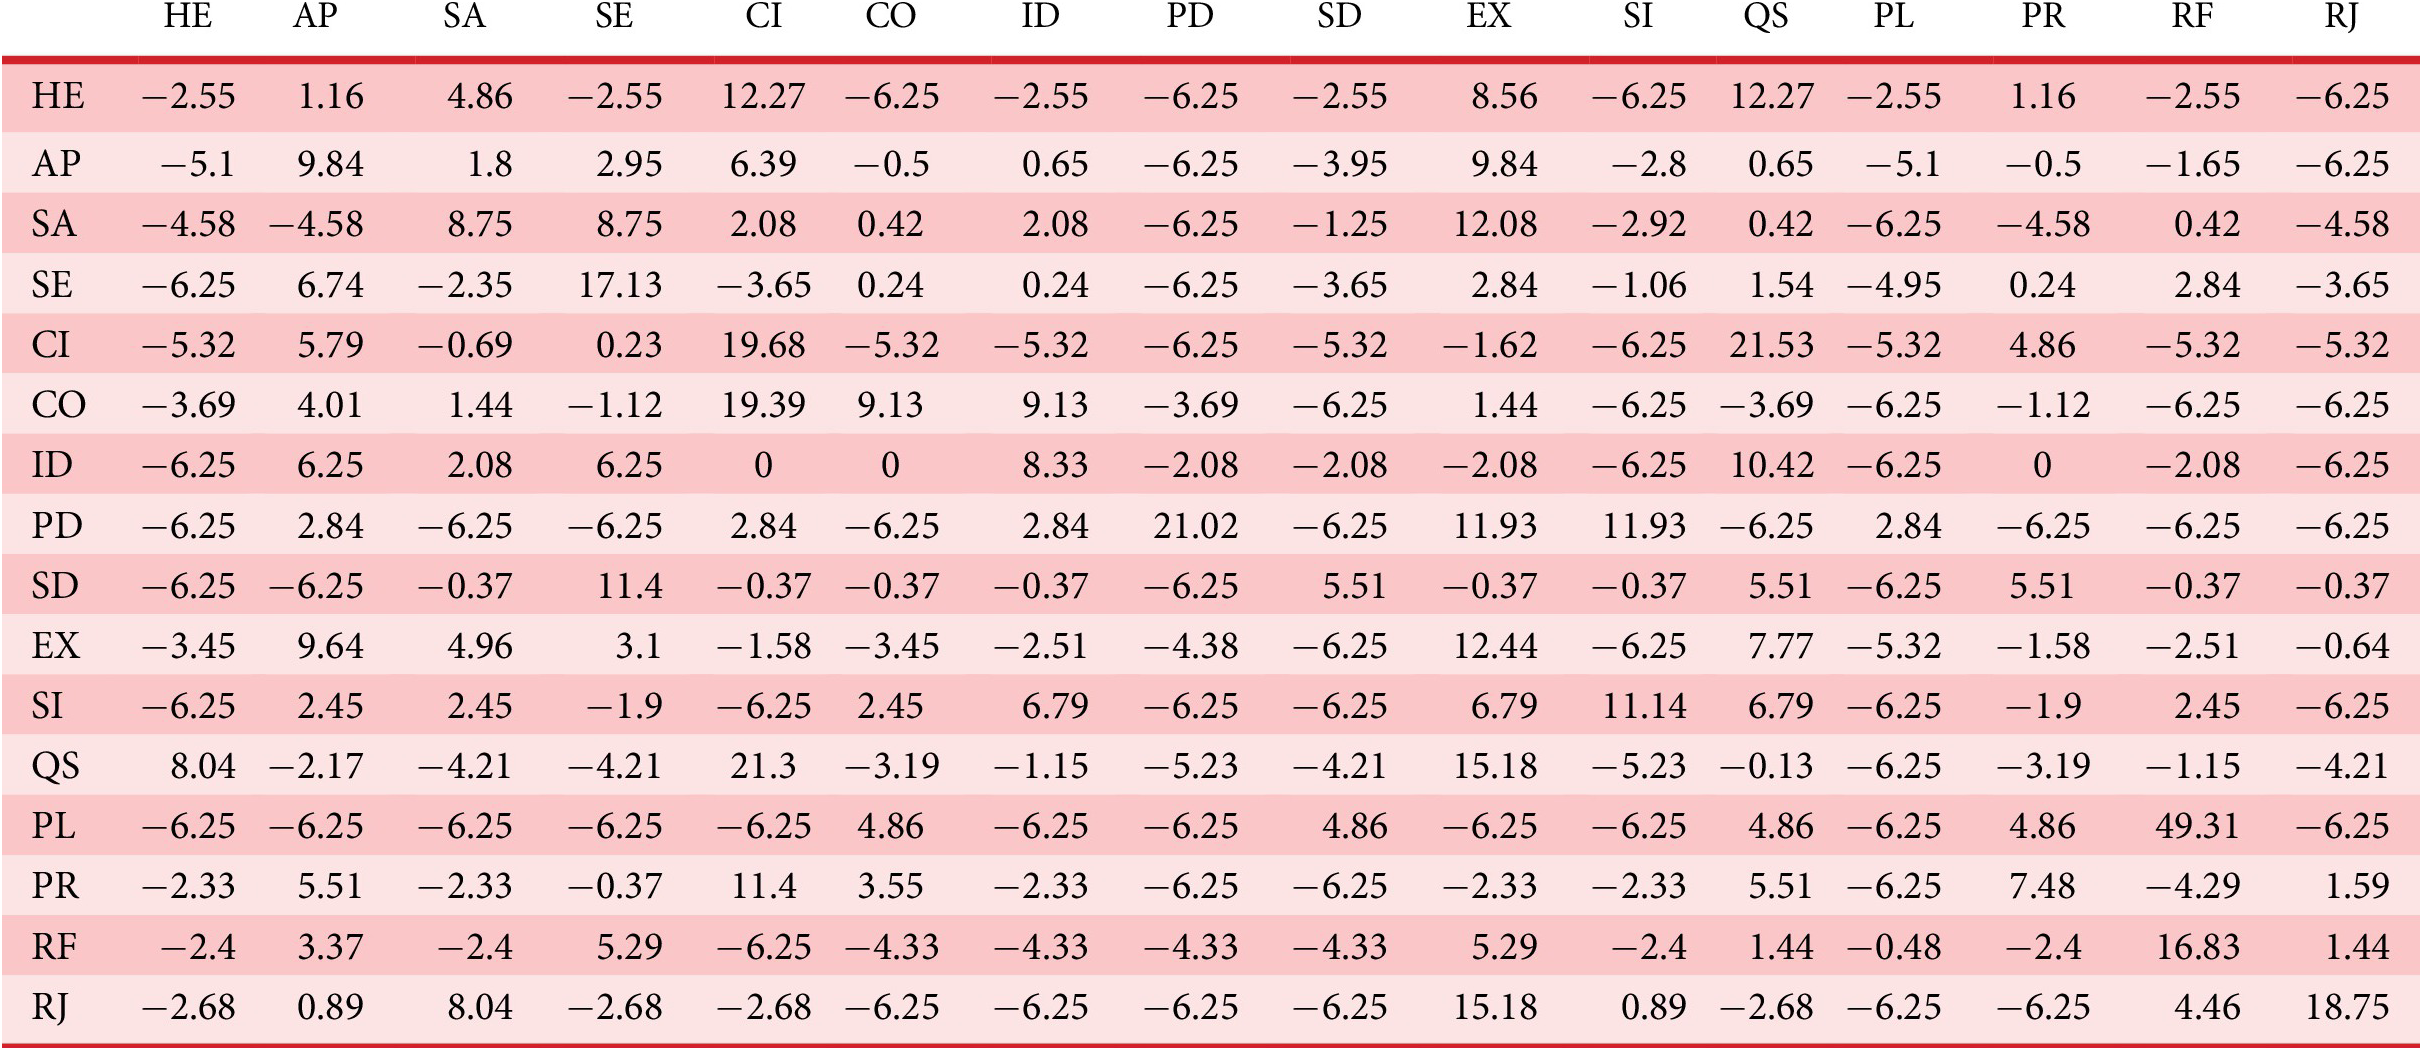
Table 6. Long description
Starting from the top row, each group code is listed in the leftmost column and repeated as column headers. The intersection cells display deviation values in percentage points for each pairwise transition. HE row: values range from minus 6.25 to plus 12.27, with the highest positive deviation at CI and QS columns (12.27), and the lowest negative at CO, SI, PD, and RJ columns (minus 6.25). AP row: highest positive deviation at AP and EX columns (9.84), lowest negative at HE, PD, QS, PL, and RJ columns (minus 6.25). SA row: highest positive deviation at EX column (12.08), lowest negative at HE, AP, SD, PL, and RJ columns (minus 6.25). SE row: highest positive deviation at SE column (17.13), lowest negative at HE, PD, QS, PL, and RJ columns (minus 6.25). CI row: highest positive deviation at QS column (21.53), lowest negative at CO, SI, PD, QS, PL, and RJ columns (minus 6.25). CO row: highest positive deviation at CI column (19.39), lowest negative at SD, EX, QS, PL, and RJ columns (minus 6.25). ID row: highest positive deviation at QS column (10.42), lowest negative at HE, PD, SD, EX, QS, PL, and RJ columns (minus 6.25). PD row: highest positive deviation at PD column (21.02), lowest negative at HE, AP, SA, SE, CI, CO, SD, EX, QS, PL, PR, RF, and RJ columns (minus 6.25). SD row: highest positive deviation at SD and PR columns (5.51), lowest negative at HE, AP, SA, SE, CI, CO, ID, PD, EX, QS, PL, PR, RF, and RJ columns (minus 6.25). EX row: highest positive deviation at EX column (12.44), lowest negative at SD, SI, QS, PL, PR, RF, and RJ columns (minus 6.25). SI row: highest positive deviation at SI column (11.14), lowest negative at HE, SE, CI, CO, PD, SD, EX, QS, PL, PR, RF, and RJ columns (minus 6.25). QS row: highest positive deviation at CI column (21.3), lowest negative at PL column (minus 6.25). PL row: highest positive deviation at PL column (49.31), lowest negative at HE, AP, SA, SE, CI, CO, ID, PD, SD, EX, QS, PR, RF, and RJ columns (minus 6.25). PR row: highest positive deviation at PR column (7.48), lowest negative at HE, SA, PD, SD, EX, QS, PL, RF, and RJ columns (minus 6.25). RF row: highest positive deviation at PD column (16.83), lowest negative at CI, CO, ID, PD, SD, EX, QS, PL, PR, and RJ columns (minus 6.25). RJ row: highest positive deviation at RJ column (18.75), lowest negative at CO, ID, PD, SD, EX, QS, PL, PR, RF columns (minus 6.25).
Unfacilitated group deviations from uniform baseline (percentage points)
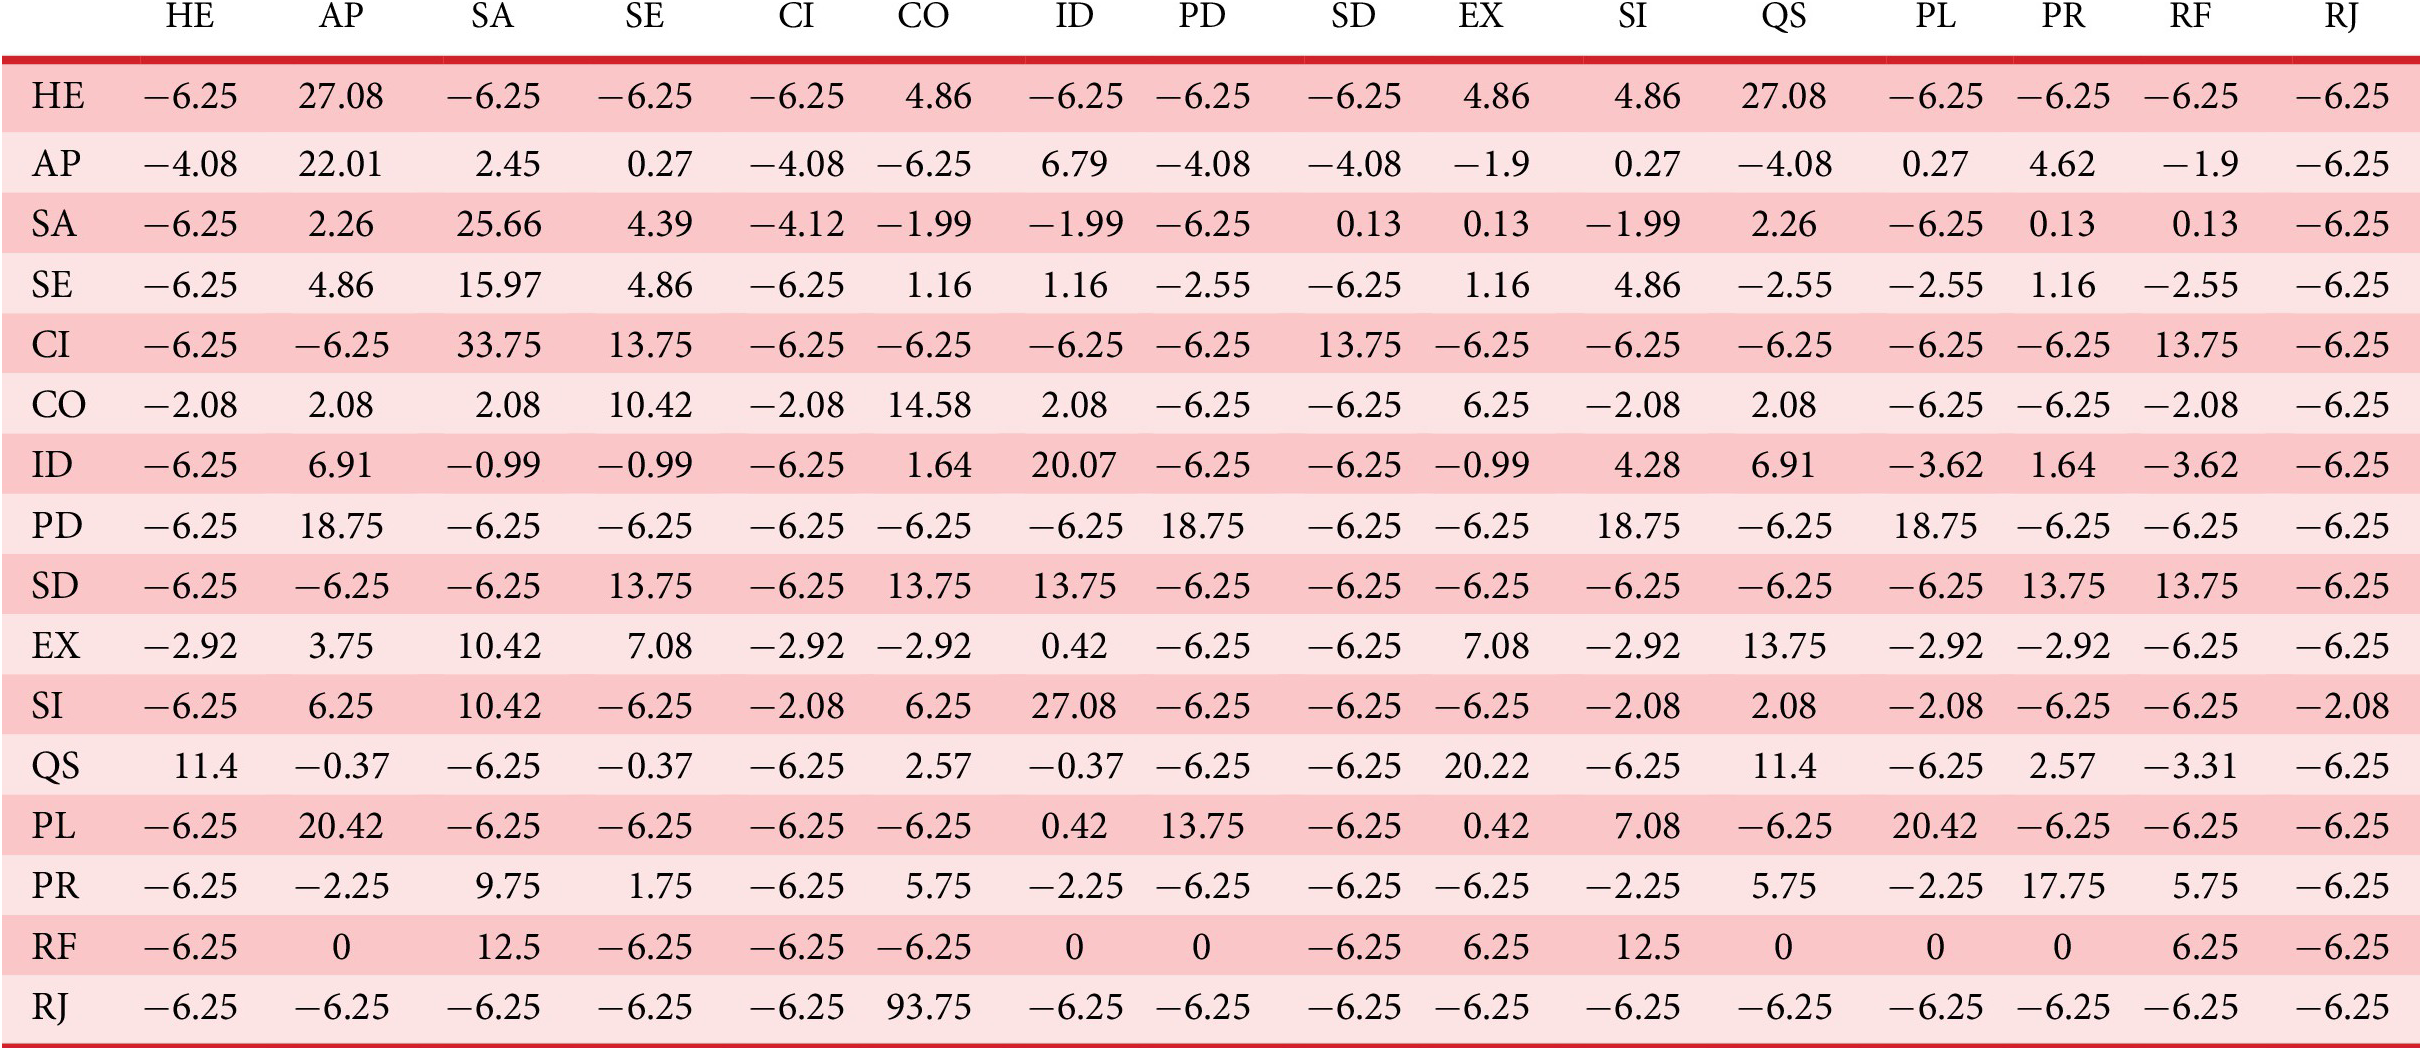
Table 7. Long description
The table consists of 17 rows and 17 columns. The leftmost column is labeled ‘from’, followed by group labels: H E, A P, S A, S E, C I, C O, I D, P D, S D, E X, S I, Q S, P L, P R, R F, R J. Each row represents the deviation from the group in the ‘from’ column to each group in the header, measured in percentage points. Most values are negative, typically minus 6.25, indicating below-baseline deviation. Positive values are scattered, with notable outliers: R J to C O is 93.75, C I to S A is 33.75, H E to A P and H E to Q S are both 27.08, S A to S A is 25.66, A P to A P is 22.01, P D to P D is 18.75, S E to S A is 15.97, C O to C O is 14.58, C I to S A is 33.75, S D to S D is 13.75, E X to S A is 10.42, Q S to Q S is 11.4, R F to S A is 12.5. The largest positive deviation is R J to C O at 93.75. Diagonal values (group to itself) are often positive, while off-diagonal values are mostly negative. The table highlights both uniformity and significant outliers in group deviations.
The facilitated group’s transition matrix reveals a highly integrated communication structure with coherent knowledge construction (see Table 6). Most notably, the PL → RF transition (+49.3 pp) demonstrates planning-reflection integration, reinforced by sustained reflection (RF → RF: +16.8 pp), indicating strong metacognitive awareness. Information processing followed a dialogical pattern through bidirectional CI↔QS transitions (~21 pp each), where information prompted questions systematically answered, creating processing cycles. This was complemented by clustered exchanges (CI → CI: +19.7 pp) and progression from questions to explanations (QS → EX: +15.2 pp). The group also sustained problem definition dialogues (PD → PD: +21.0 pp) and supportive dynamics where confirmation encouraged contributions (CO → CI: +19.4 pp), while moderate solution analysis (SA → SA: +9 pp) integrated with explanation (SA → EX: +12 pp) rather than occurring alone.
In contrast, the unfacilitated group exhibited a distinct communication structure (see Table 7). The strong deviation RJ → CO transition (+93.8 pp), based on a transition that occurred only once RJ → CO (n = 1), highlights minimal divergent discourse within team iterations. Information processing was related to analysis solutions, with direct CI → SA transitions (+33.8 pp) bypassing clarification phases. The group exhibited direct progression from new solution ideas to idea development (SI → ID: +27.1 pp) and isolated analysis clusters (SA → SA: +25.7 pp). Team cohesion manifested through appreciation sequences (AP → AP: +22.0 pp), while planning showed multiple patterns: self-perpetuation (PL → PL: +20.4 pp), transition to problem definition (PL → PD: +13.75 pp) and validation-seeking through appreciations (PL → AP: +20.42 pp).
The following sections use sequential matrices and qualitative analysis to examine results for each intervention. Additional matrices appear in Appendix E. Sequential analysis guided the qualitative interpretation, while visualizations revealed patterns related to specific events (e.g., artifact interaction or intervention timing) and contextualized transitions between utterances. Triangulating matrices, charts and excerpts enabled in-depth exploration across multiple layers of workshop data.
4.1. Integrative activities
The facilitated group’s pretask integrative activities influenced early team dynamics and communication patterns, as represented in Figure 4. Additionally, this representation enables the identification of patterns regarding the most prevalent coding clusters and reveals gaps in areas where teams had little or no interaction, aligning with the chi-square results that demonstrate that each group acted differently from the other. Analysis of the first 100 coded utterances (Figure 4) reveals that the facilitated group showed more immediate engagement with problem definition (PD) and solution ideation (SI), while the unfacilitated group prioritized clarification processes through questions (QS), explanations (EX) and planning (PL) activities.
Moreover, the transition matrix analysis demonstrates distinct patterns between groups, as presented in the chi-square analysis. The facilitated group’s communication structure featured strong planning-reflection integration (PL → RF: +49.3 pp), indicating a presence of planning followed by reflection. This contrasted with the unfacilitated group’s, where planning activities lacked transitions to reflection, showed self-perpetuation (PL → PL: +20.4 pp), validation-seeking behaviors (PL → AP: +20.4 pp).
A critical difference emerged in handling disagreement and divergent thinking. The facilitated group exhibited 28 rejection instances (RJ) distributed throughout their process, with notable sequences including RJ → RJ (+18.75 pp) and RJ → EX (+15.18 pp), suggesting clarification efforts following rejection. Rejections also appeared in process-related codes (PR → RJ, n = 4; RF → RJ, n = 4), though remaining close to uniform baseline (PR-RJ: +1.59 pp and RF → RJ: +1.44 pp), indicating that disagreements were integrated into procedural and reflective exchanges.
Figure 5 illustrates the distribution and antecedent codes for these rejections, demonstrating how the team transitioned from task and cohesion dimensions before rejections occurred. This visualization reveals the iterative process and reinforces the dialogical dynamic within the group, showing how rejection moments emerged after various types of explicit content rather than following predictable patterns.
Records of rejections (RJ) and the three preceding codes before each rejection within the facilitated group’s dialogical process. To facilitate readability, the visualization was divided into two parts.
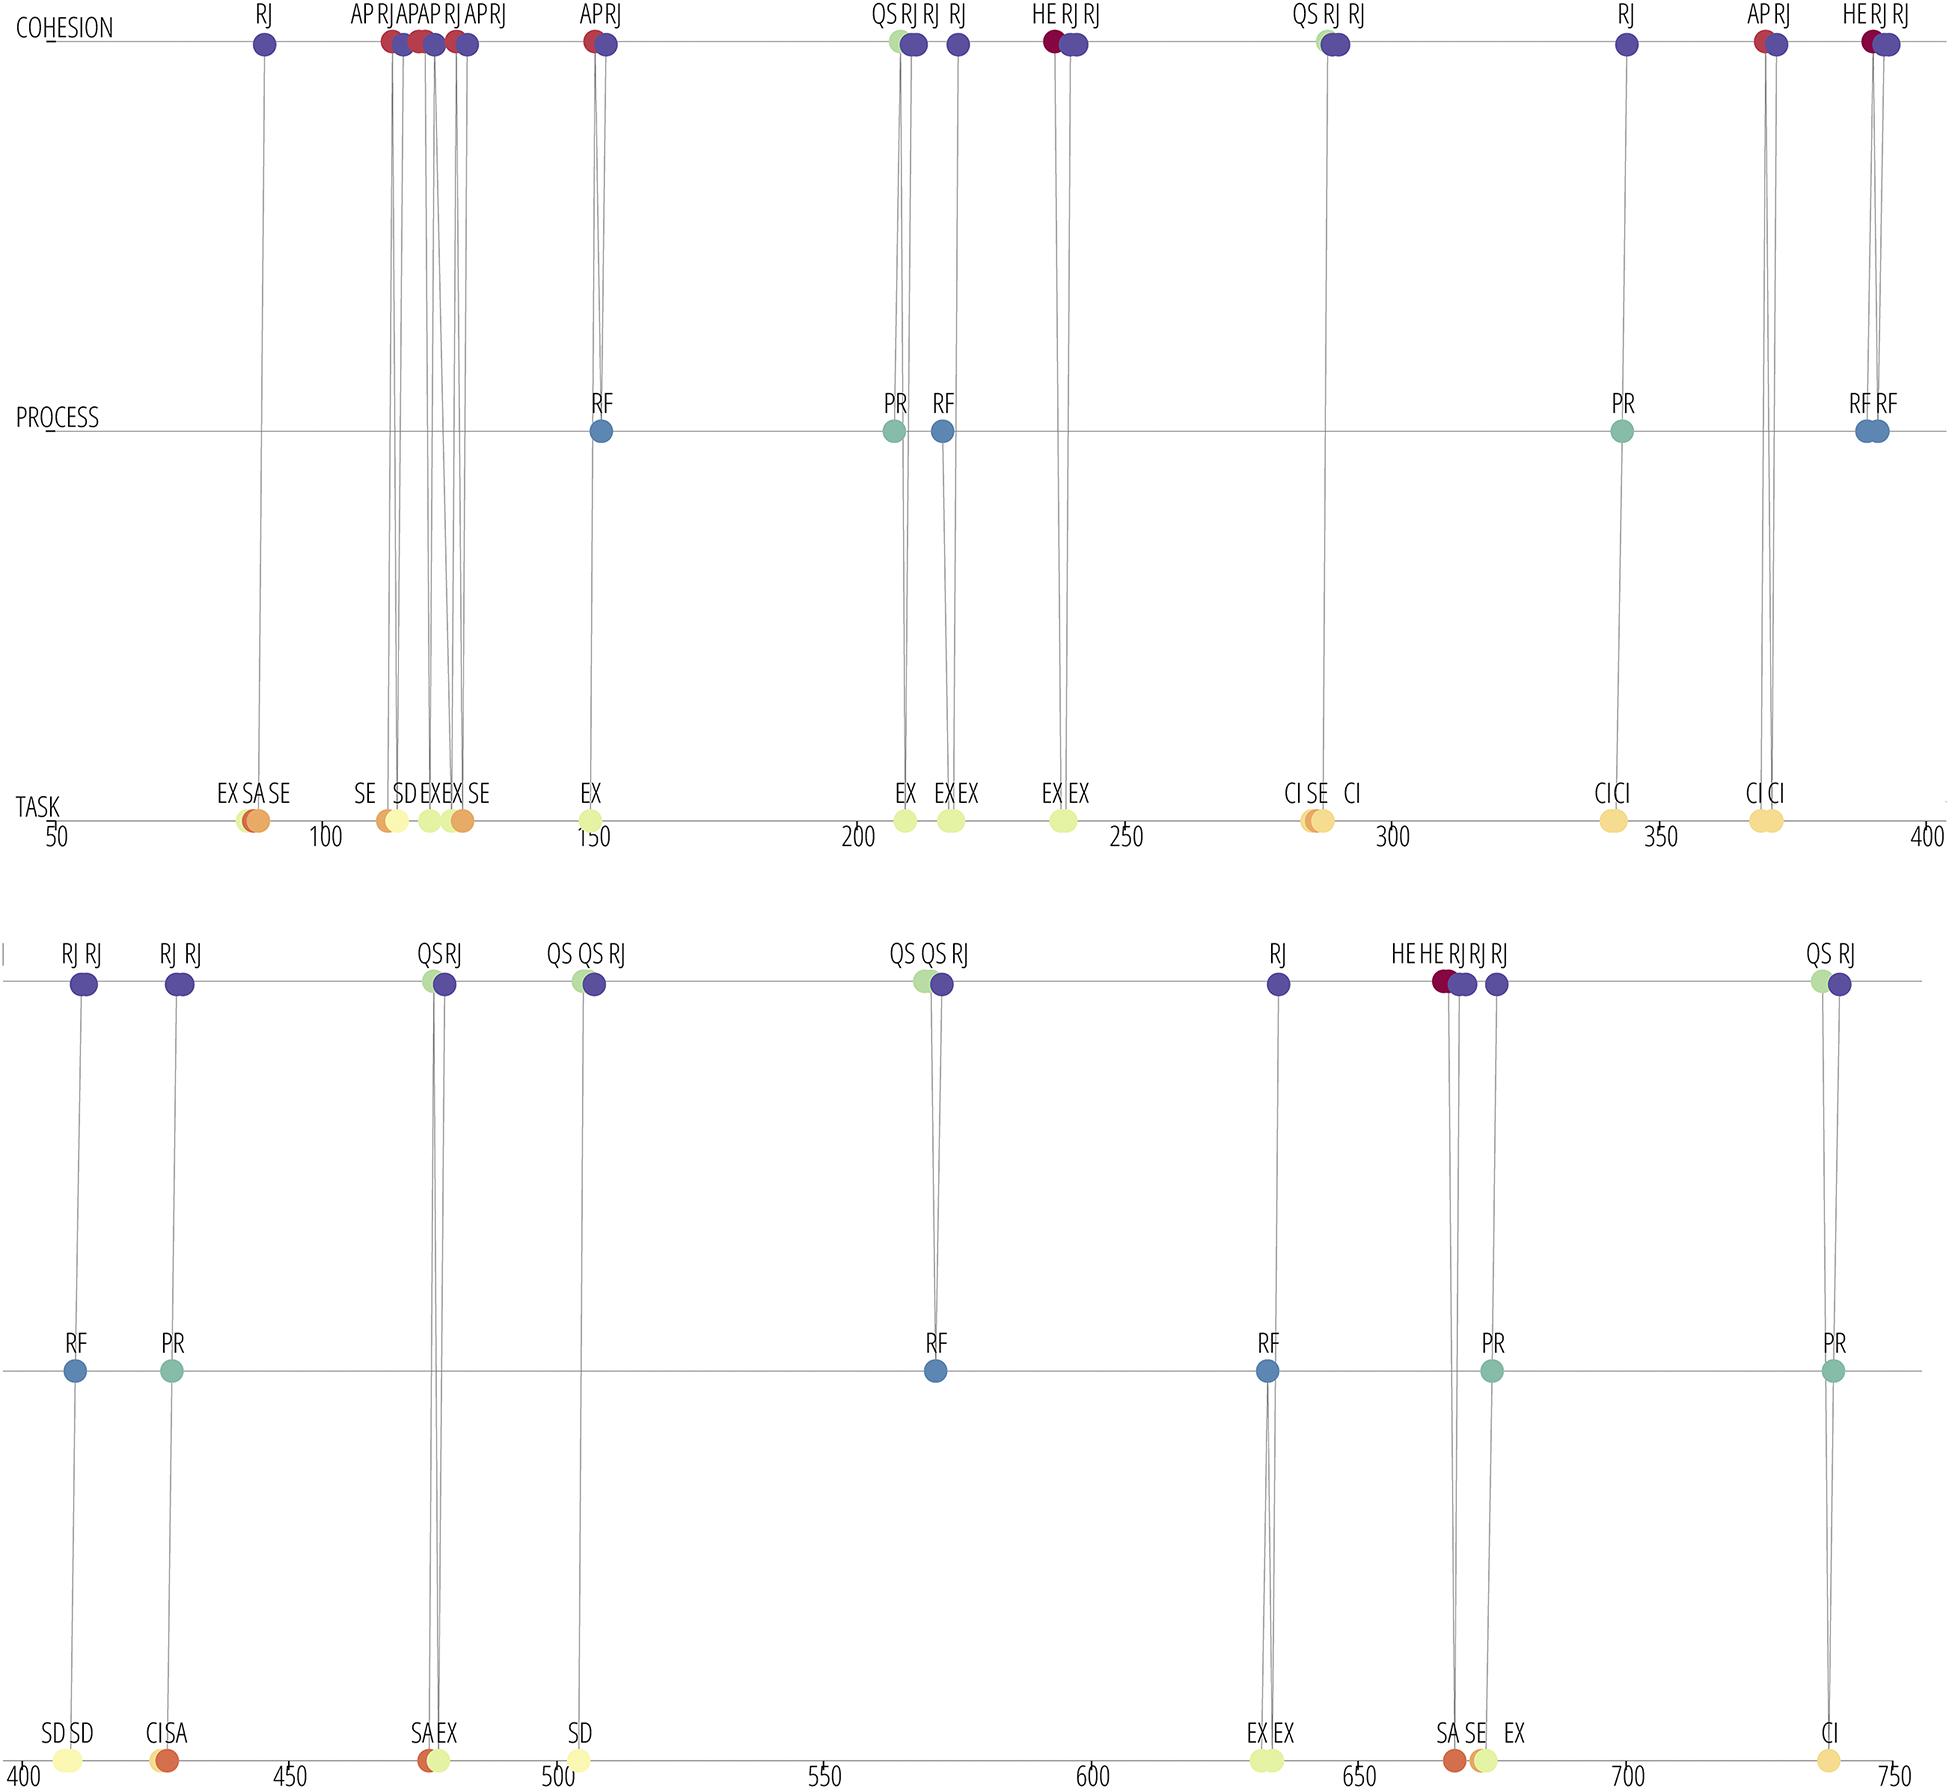
Figure 5. Long description
The visualization consists of two horizontal panels, each representing a segment of a continuous timeline from 50 to 750. The horizontal axis is marked in increments of 50. Each panel contains three horizontal bands labeled from top to bottom as COHESION, PROCESS, and TASK. Within each band, colored circles are labeled with codes such as RJ, AP, PR, QS, HE, RF, EX, SA, SE, SD, CI, and EX. Vertical lines connect groups of three preceding codes in the lower bands (PROCESS and TASK) to a rejection event (RJ) in the COHESION band above. For example, at timeline point 100, the COHESION band shows a cluster of AP, RJ, AP, RJ, AP, RJ, with corresponding PROCESS and TASK codes below, such as SE, SD, EX, SE. This pattern repeats at various points, with different combinations of codes leading up to each RJ event. The lower panel continues the timeline from 400 to 750, maintaining the same structure. Notable clusters include repeated QS, RJ, and HE codes, and the vertical connections visually trace the dialogical process leading to each rejection event.
In contrast, the unfacilitated group demonstrated only one rejection instance (RJ → CO, n = 1), with an extreme deviation from the uniform baseline (RJ → CO: +93.8 pp) representing immediate conflict resolution that did not develop further after a new solution was rejected (SI → RJ, n = 1). This suggests a lack of divergent discourse likely due to insufficient familiarity among the team. The facilitated group’s interpersonal grounding occurred during structured integrative sessions, enabling sufficient comfort for constructive conflicts to emerge within the team. For example:
Excerpt 1 – Facilitated group
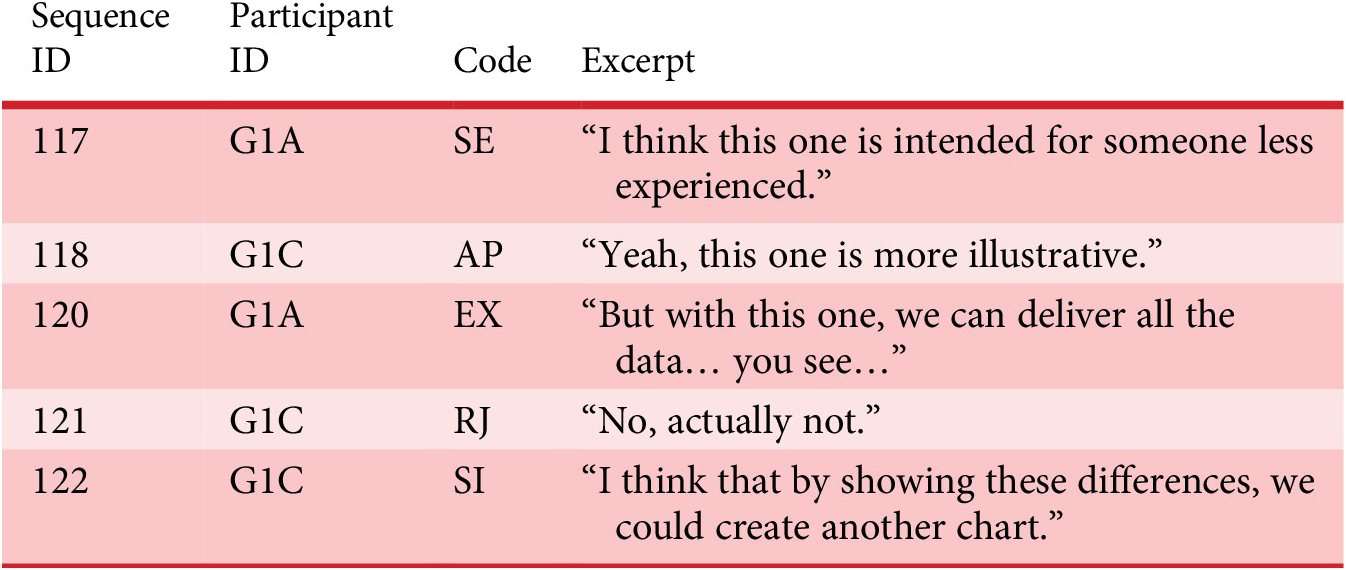
Table 8. Long description
Column headers from left to right are Sequence ID, Participant ID, Code, and Excerpt. Row one: Sequence ID 117, Participant ID G 1 A, Code S E, Excerpt ‘I think this one is intended for someone less experienced.’ Row two: Sequence ID 118, Participant ID G 1 C, Code A P, Excerpt ‘Yeah, this one is more illustrative.’ Row three: Sequence ID 120, Participant ID G 1 A, Code E X, Excerpt ‘But with this one, we can deliver all the data you see.’ Row four: Sequence ID 121, Participant ID G 1 C, Code R J, Excerpt ‘No, actually not.’ Row five: Sequence ID 122, Participant ID G 1 C, Code S I, Excerpt ‘I think that by showing these differences, we could create another chart.’
Conversely, the unfacilitated group exchanged interpersonal information parallel to task execution. During the analysis, explicit moments emerged where participants shared professional backgrounds during taskwork in an apparent effort toward role clarification, as illustrated:
Excerpt 2 – Unfacilitated group
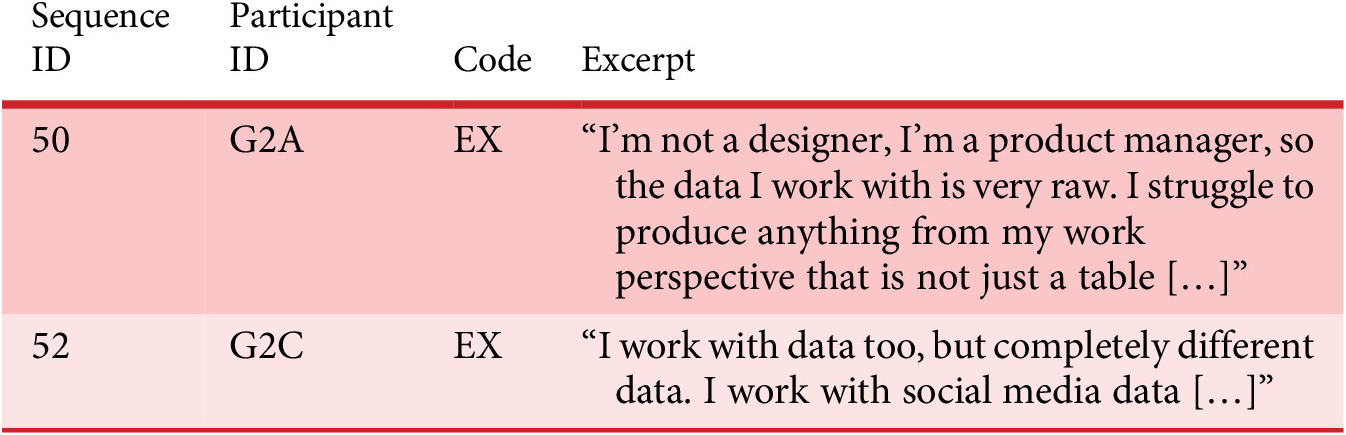
Table 9. Long description
The table has four columns labeled Sequence ID, Participant ID, Code, and Excerpt. The first row lists Sequence ID 50, Participant ID G2A, Code EX, and the excerpt: ‘I’m not a designer, I’m a product manager, so the data I work with is very raw. I struggle to produce anything from my work perspective that is not just a table […]’. The second row lists Sequence ID 52, Participant ID G2C, Code EX, and the excerpt: ‘I work with data too, but completely different data. I work with social media data […]’.
Excerpt 3 – Unfacilitated group
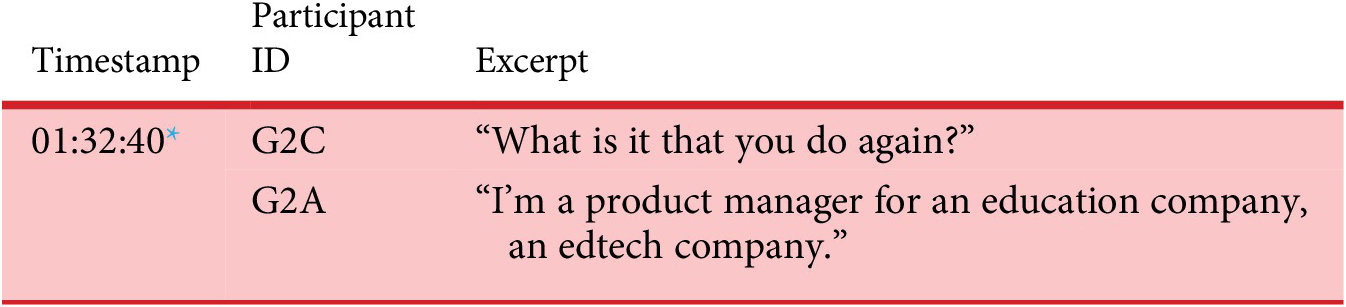
Table 10. Long description
From top to bottom, the first row lists timestamp 01:32:40 with participant G2C stating What is it that you do again. The second row at the same timestamp lists participant G2A responding I am a product manager for an education company, an edtech company. A footnote clarifies that timestamps mark moments when participants stood up to use the restroom and were not coded as workshop process entries.
* The citations above are marked by timestamps rather than codes, as they were recorded when participants stood up to use the restroom and thus were not coded as an entry related to the workshop’s working process.
Moreover, the facilitated group’s information processing followed dialogical patterns through bidirectional CI↔QS transitions (~21 pp each direction), where information systematically prompted questions that were answered, creating knowledge-building cycles among the group. This was reinforced by clustered information exchanges (CI → CI: +19.7 pp) and progression to explanations (QS → EX: +15.2 pp). The unfacilitated group demonstrated linear information processing (CI → SA: +33.8 pp), bypassing clarification phases and suggesting assumptive rather than verified understanding.
Task execution patterns also differed substantially. The facilitated group exhibited sustained problem definition dialogues (PD → PD: +21.0 pp) and supportive dynamics where confirmation encouraged further contribution (CO → CI: +19.4 pp). Their solution analysis integrated with explanation (SA → EX: +12 pp) rather than occurring in isolation. The unfacilitated group showed isolated analysis clusters (SA → SA: +25.66 pp) and direct progression from ideas to development (SI → ID: +27.1 pp), suggesting less iterative refinement.
These findings indicate that integrative activities established foundational conditions for dialogical spaces, enabling more frequent constructive disagreement and systematic knowledge construction. While both groups achieved comparable design outcomes, the facilitated group demonstrated earlier task readiness (see Figure 4) and more sophisticated coordination mechanisms. The unfacilitated group compensated through social validation processes and extended coordination activities, suggesting that integrative interventions optimize rather than replace inherent team capabilities.
4.2. Evocative artifacts
RQ2 investigated how evocative artifacts facilitate ideation, communication and evaluation and support solution exploration in interdisciplinary teams. The facilitated group received reference sheets containing infovis examples after reading the design brief, while the unfacilitated group operated without structured solution references.
The facilitated group accessed reference materials on three occasions, with meaningful integration occurring during the third instance (01:48 timestamp). Participant G1C suggested a population pyramid chart, triggering an extended dialogical exchange involving solution evaluation, analysis, development and reflection. Figure 6 illustrates the code sequence following this artifact engagement, demonstrating how visual references prompted exploration of constraints and opportunities. The facilitated group began with solution evaluation (SE) and solution analysis (SA) codes as they interacted with the material. Subsequently, a pattern emerged as the group engaged in idea development (ID), reflection (RF) and planning (PL) moments. As they advanced to new idea solutions (SI), a cohesion dynamic also became evident, with questions (QS), confirmations (CO) and appreciations occurring throughout the process.
Sequence of codes derived from team statements following the moment when the facilitated group effectively used the design reference sheets.
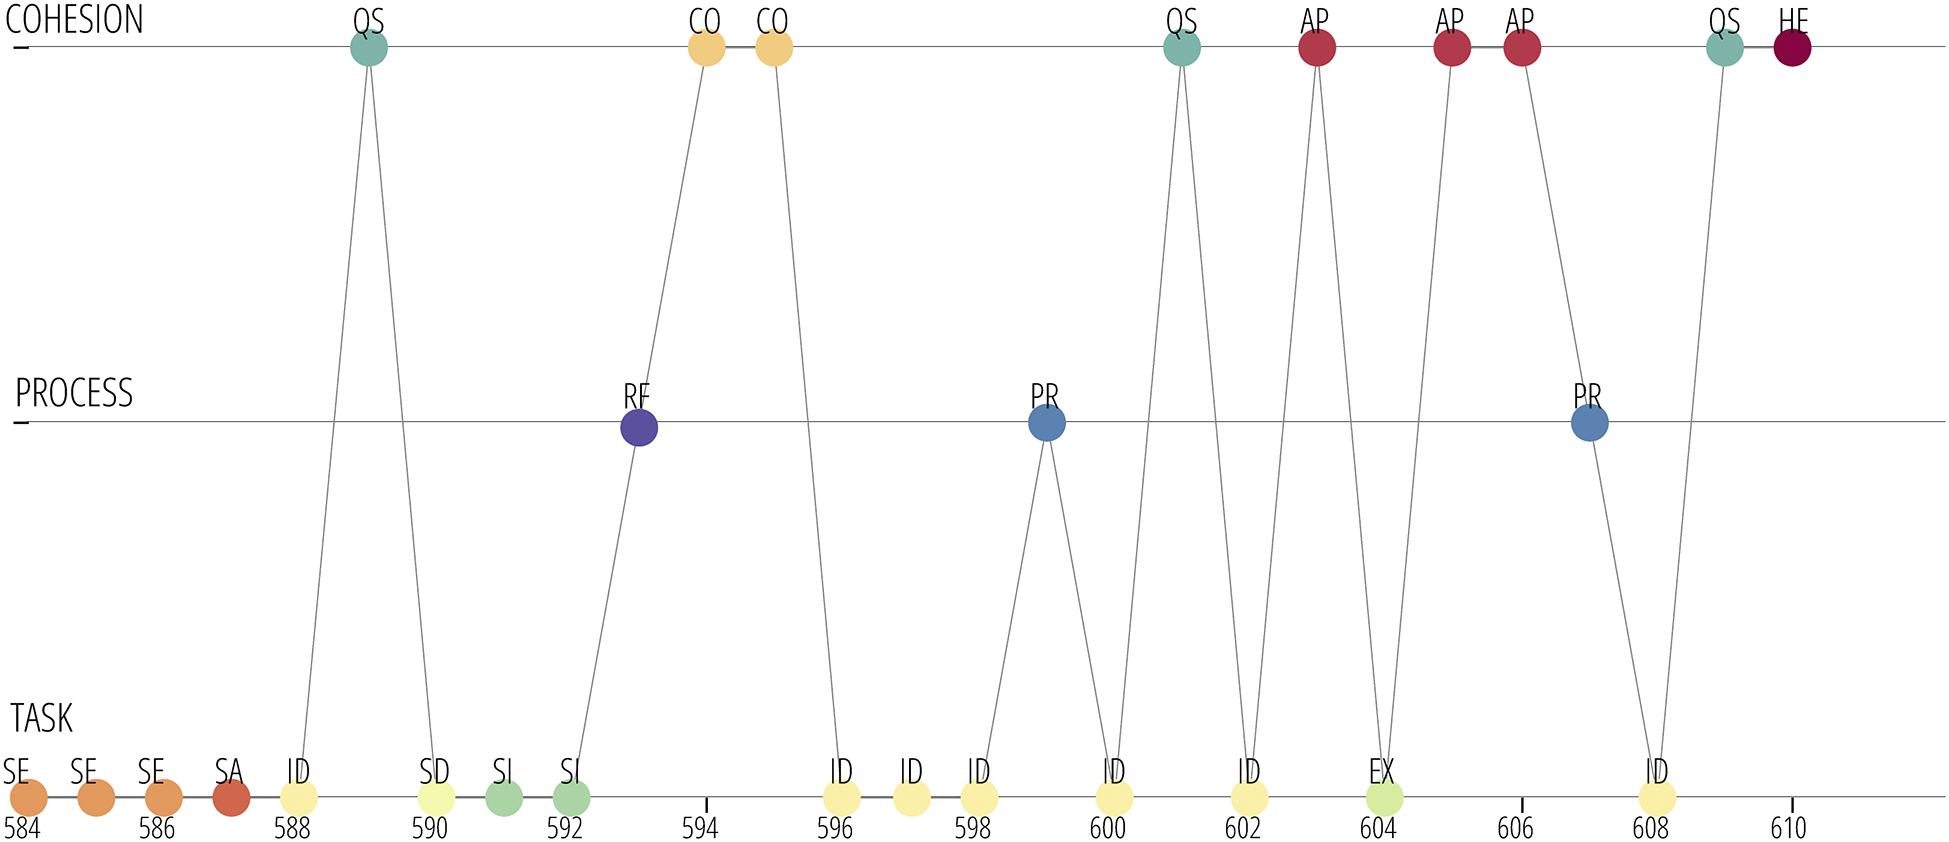
Figure 6. Long description
From left to right, the x-axis lists task codes with colored circles labeled SE at 584, SE at 586, SA at 588, ID at 588, SD at 590, SI at 592, ID at 594, ID at 596, ID at 598, ID at 600, ID at 602, EX at 604, ID at 606, ID at 608, ID at 610. Above each task code, a vertical line connects to a process code: RF at 592, PR at 596, PR at 600, PR at 608. Each process code is further connected vertically to a cohesion code: QS at 588, CO at 594 and 596, QS at 600, AP at 602, 604, and 606, QS at 608, HE at 610. The diagram visually tracks the transition of coded statements from task to process to cohesion, with each code represented by a distinct color and label. The overall structure highlights how team statements shift between categories over time.
The following excerpt offers contextualization, as the team was looking for a more creative solution when they resorted to the material. Following critical assessment of the pyramid chart’s perceived limitations, the facilitated group leveraged references for creative advancement. G1C introduced a more innovative concept inspired by circular visualizations, drawing from Giorgia Lupi’s work to propose a “life-line” representation.
Excerpt 4 – Facilitated group
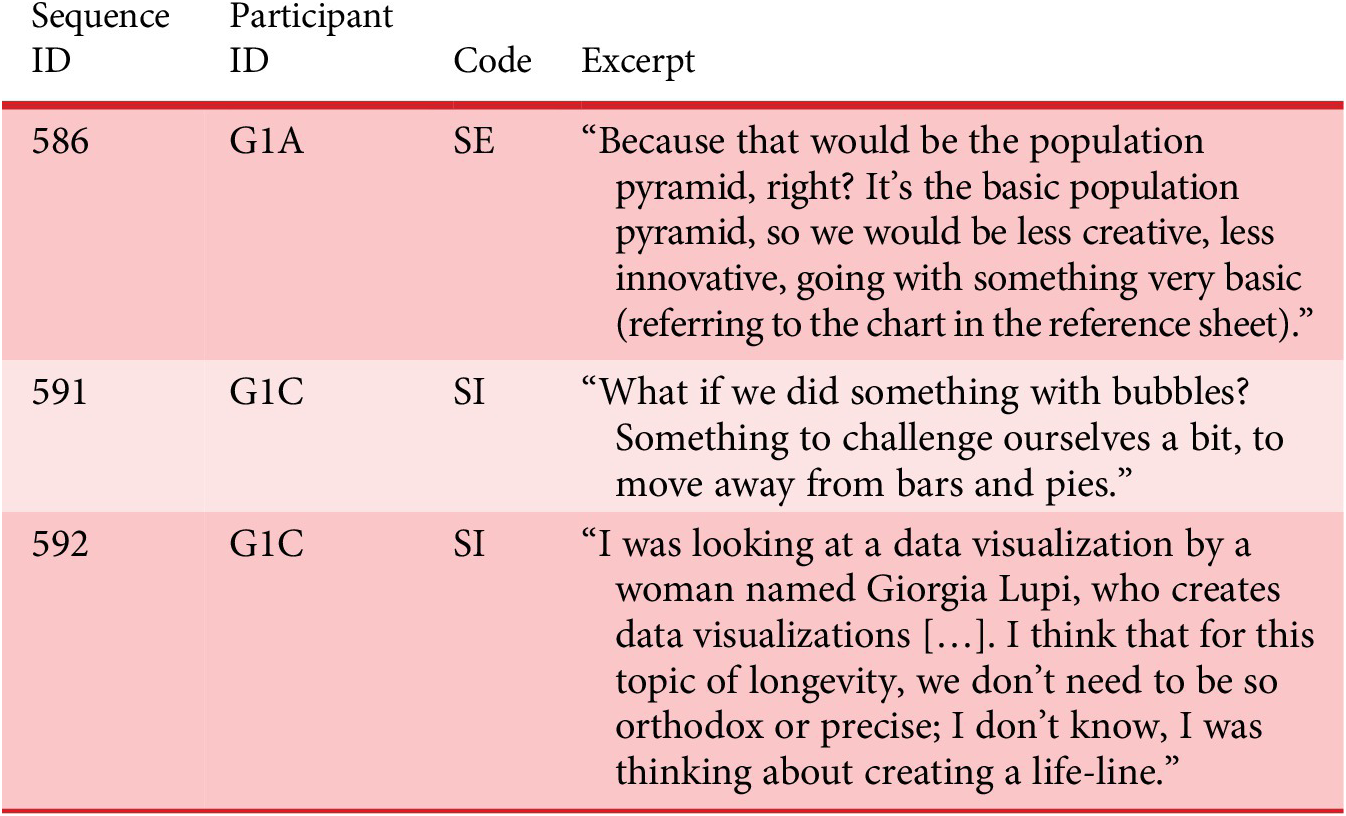
Table 11. Long description
The table contains four columns labeled Sequence ID, Participant ID, Code, and Excerpt. Row one: Sequence ID 586, Participant ID G1A, Code S E, Excerpt reads ‘Because that would be the population pyramid, right? It’s the basic population pyramid, so we would be less creative, less innovative, going with something very basic (referring to the chart in the reference sheet).’ Row two: Sequence ID 591, Participant ID G1C, Code S I, Excerpt reads ‘What if we did something with bubbles? Something to challenge ourselves a bit, to move away from bars and pies.’ Row three: Sequence ID 592, Participant ID G1C, Code S I, Excerpt reads ‘I was looking at a data visualization by a woman named Giorgia Lupi, who creates data visualizations […] I think that for this topic of longevity, we don’t need to be so orthodox or precise; I don’t know, I was thinking about creating a life-line.’
Post-artifact consultation revealed task-focused coordination emphasizing reference evaluation relative to design goals. The facilitated group’s transition patterns showed supportive dynamics where confirmation encouraged further contribution (CO → CI: +19.4 pp), collaborative development sequences (CO → ID: +9.1 pp) and systematic progression from questions to explanations (QS → EX: +15.2 pp). These patterns suggest the presence of structured knowledge-building cycles within the team.
On the other hand, the unfacilitated group encountered communication barriers when proposing unfamiliar visualization types. Participant G2A struggled to convey a bubble scatter plot concept and faced difficulties communicating the proposition to team members. This persisted until she spontaneously used her smartphone, with the facilitator’s consent, for visual exemplification, resulting in immediate comprehension and acceptance.
Excerpt 5 – Unfacilitated group
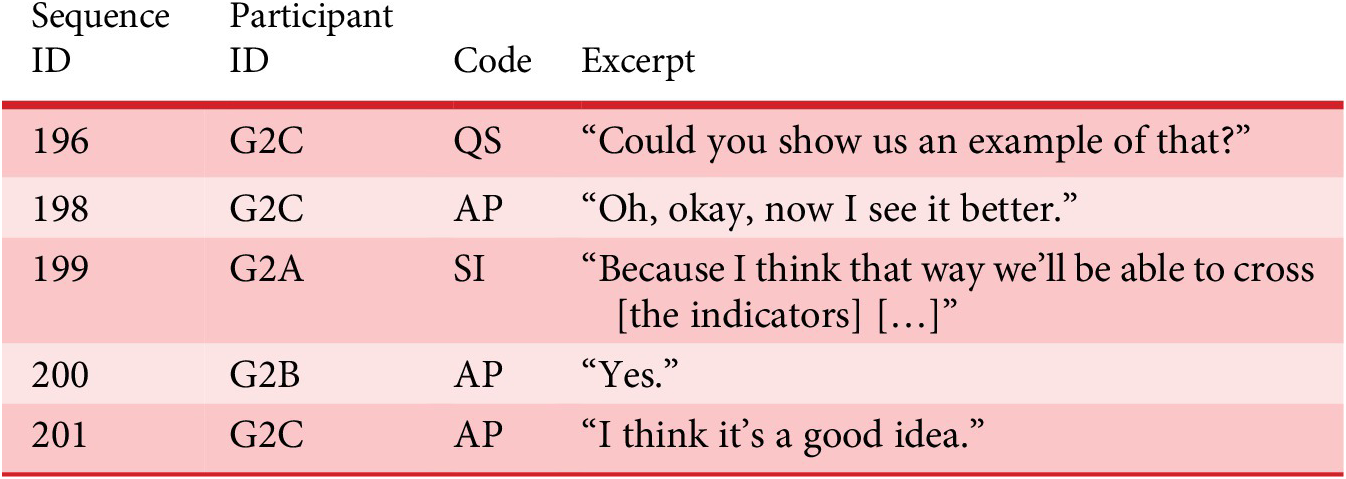
Table 12. Long description
The header row contains Sequence ID, Participant ID, Code, and Excerpt. The first row lists 196, G2C, Q S, and ‘Could you show us an example of that?’. The second row lists 198, G2C, A P, and ‘Oh, okay, now I see it better.’. The third row lists 199, G2A, S I, and ‘Because I think that way we’ll be able to cross the indicators…’. The fourth row lists 200, G2B, A P, and ‘Yes.’. The fifth row lists 201, G2C, A P, and ‘I think it’s a good idea.’
Next, Figure 7 displays the code sequence following this smartphone-mediated visual reference, highlighting the role of visual materials in bridging semantic and knowledge gaps in interdisciplinary contexts. The unfacilitated group’s transition patterns reflected a linear processing approach, with direct shifts from explanations to confirmations (EX→CO: +7.1 pp) and appreciation cycles (AP → AP: +22.0 pp), suggesting validation-seeking behaviors after the alignment. As shown, when the team accessed the smartphone reference, they began with explanation (EX), followed by appreciation (AP) and idea development (ID). The sequence also included process codes, reflection (RF) and process (PR), plus solution evaluation (SE) and analysis (SA). The visualization underscores the evocative artifacts’ role in reducing communication barriers and enabling new solutions based on prior references.
Sequence of codes derived from team statements following the moment when the unfacilitated group used a smartphone to search for a specific format of infovis.
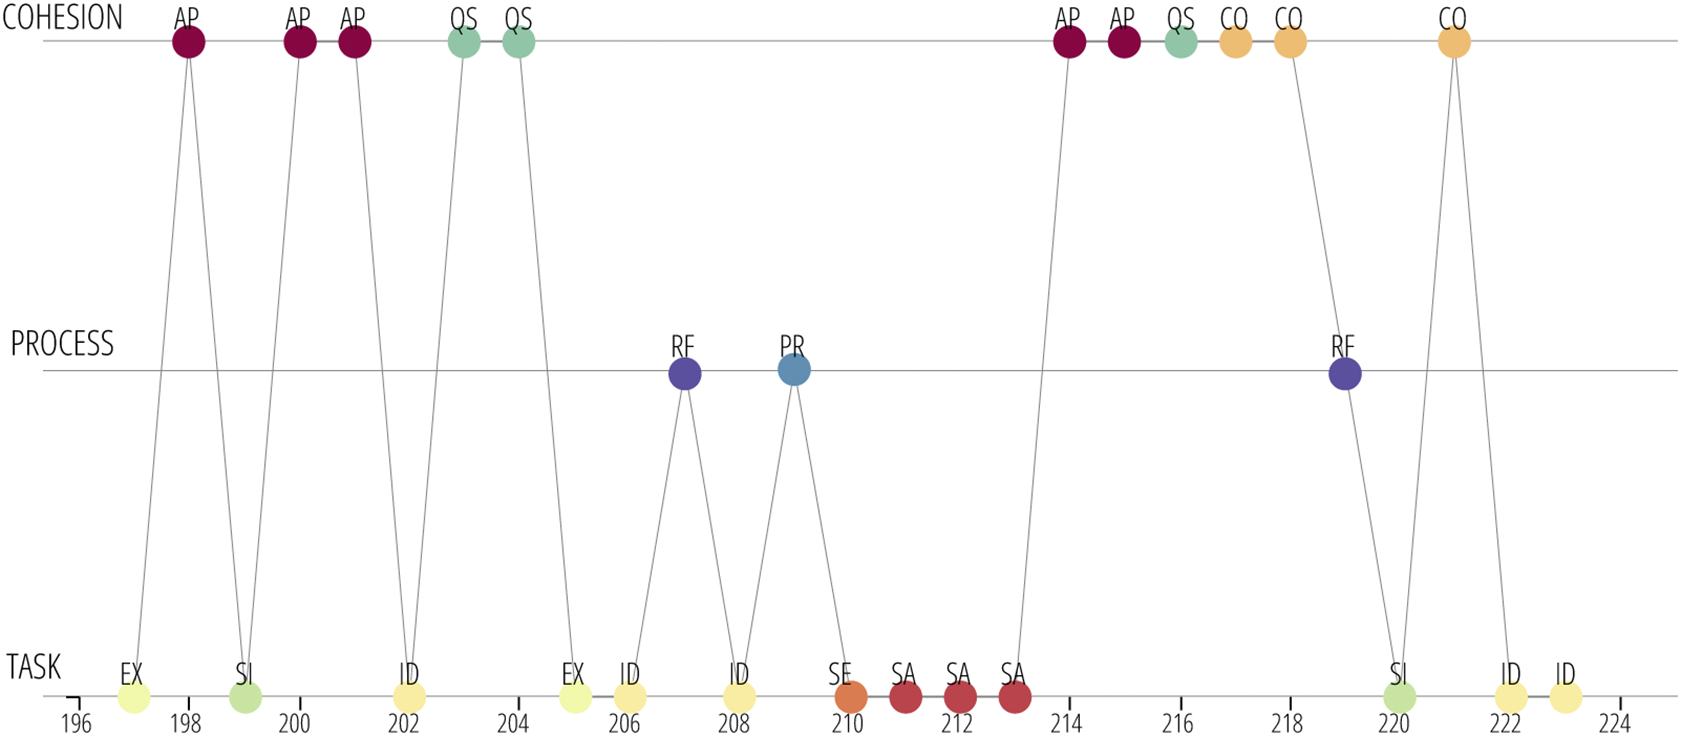
Figure 7. Long description
From left to right, the horizontal axis is marked with time points from 196 to 224. The lowest tier, labeled TASK, contains colored circles with codes: EX at 196 and 206, SI at 198 and 220, ID at 200, 202, 208, 210, 222, and 224, and SA at 212 and 214. The middle tier, labeled PROCESS, features RF at 208 and 218, and PR at 210. The top tier, labeled COHESION, includes AP at 198, 200, 202, 212, and 214, QS at 204, 206, and 216, and CO at 216, 218, 220, and 222. Thin lines connect circles vertically and diagonally, illustrating transitions between codes across tiers and time points. Each code is color-coded and aligned to its respective tier, with some codes recurring at multiple time points.
Both groups demonstrated reliance on visual references for design communication, although through different pathways. The facilitated group’s structured artifacts enabled systematic evaluation and creative advancement beyond presented examples, while the unfacilitated group’s spontaneous search resolved immediate knowledge and communication barriers. These patterns suggest that evocative artifacts may support both systematic design exploration and ad hoc semantic alignment in interdisciplinary collaboration.
4.3. Framing guides
RQ3 investigated how framing guides enhance adaptive decision-making throughout the design process by supporting task-focused discussions of shared objectives and fostering collective reflection. The facilitated group received framing guides after reading the task brief, while the unfacilitated group operated without structured framing interventions.
Initially, the facilitated group did not actively engage with the framing materials. However, at 00:59 into the workshop, participant G1A expressed frustration regarding the team’s lack of direction, prompting facilitator intervention reminding the team that they had the framing guides available, whereupon the team proceeded to use them (see Figure 8). Following this, the group began using the guides to clarify decision-making criteria and prioritize information elements:
Excerpt 6 – Facilitated group.
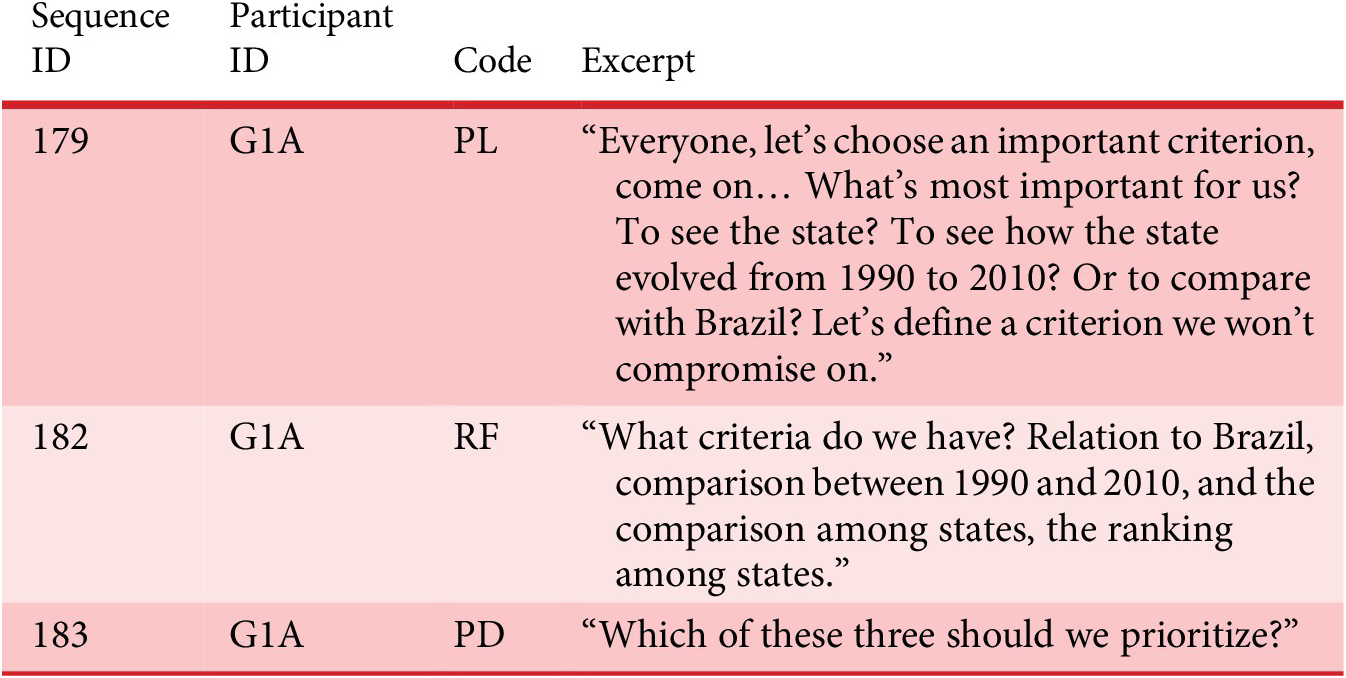
Table 13. Long description
The table has four columns labeled Sequence ID, Participant ID, Code, and Excerpt. Row one: Sequence ID 179, Participant ID G1A, Code PL, Excerpt is a quote about choosing an important criterion, mentioning the state, its evolution from 1990 to 2010, and comparison with Brazil. Row two: Sequence ID 182, Participant ID G1A, Code RF, Excerpt is a quote listing criteria including relation to Brazil, comparison between 1990 and 2010, and ranking among states. Row three: Sequence ID 183, Participant ID G1A, Code PD, Excerpt is a quote asking which of the three criteria should be prioritized.
Reproduction of the facilitated group’s annotations on the framing guide sheets. The translation follows: (1) relation between the (indicators of the) Northeast Region and Brazil; (2) relationship between all the states (ranking); and (3) relation of the years.
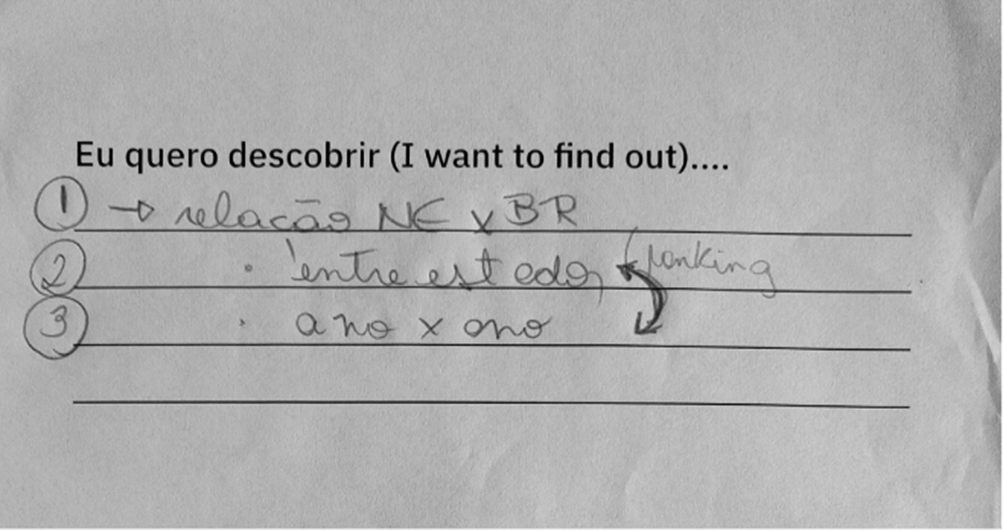
Postintervention transition patterns revealed enhanced coordination mechanisms. The facilitated group exhibited strong planning-reflection integration (PL → RF: +49.3 pp), systematic information-to-procedure transitions (CI → PR: +11.4 pp) and sustained problem definition dialogues (PD → PD: +21.0 pp). Figure 9 illustrates the code sequence following framing guide engagement, showing concentrated problem definition (PD), reflection (RF), planning (PL) and procedural (PR) activities. Concurrently, there was a strong sequence of solution evaluation (SE) that concluded with a new solution (SI) which transitioned to process (PR) and ended with an appreciation (AP).
Sequence of codes mapped after the facilitated group began using the framing guides.
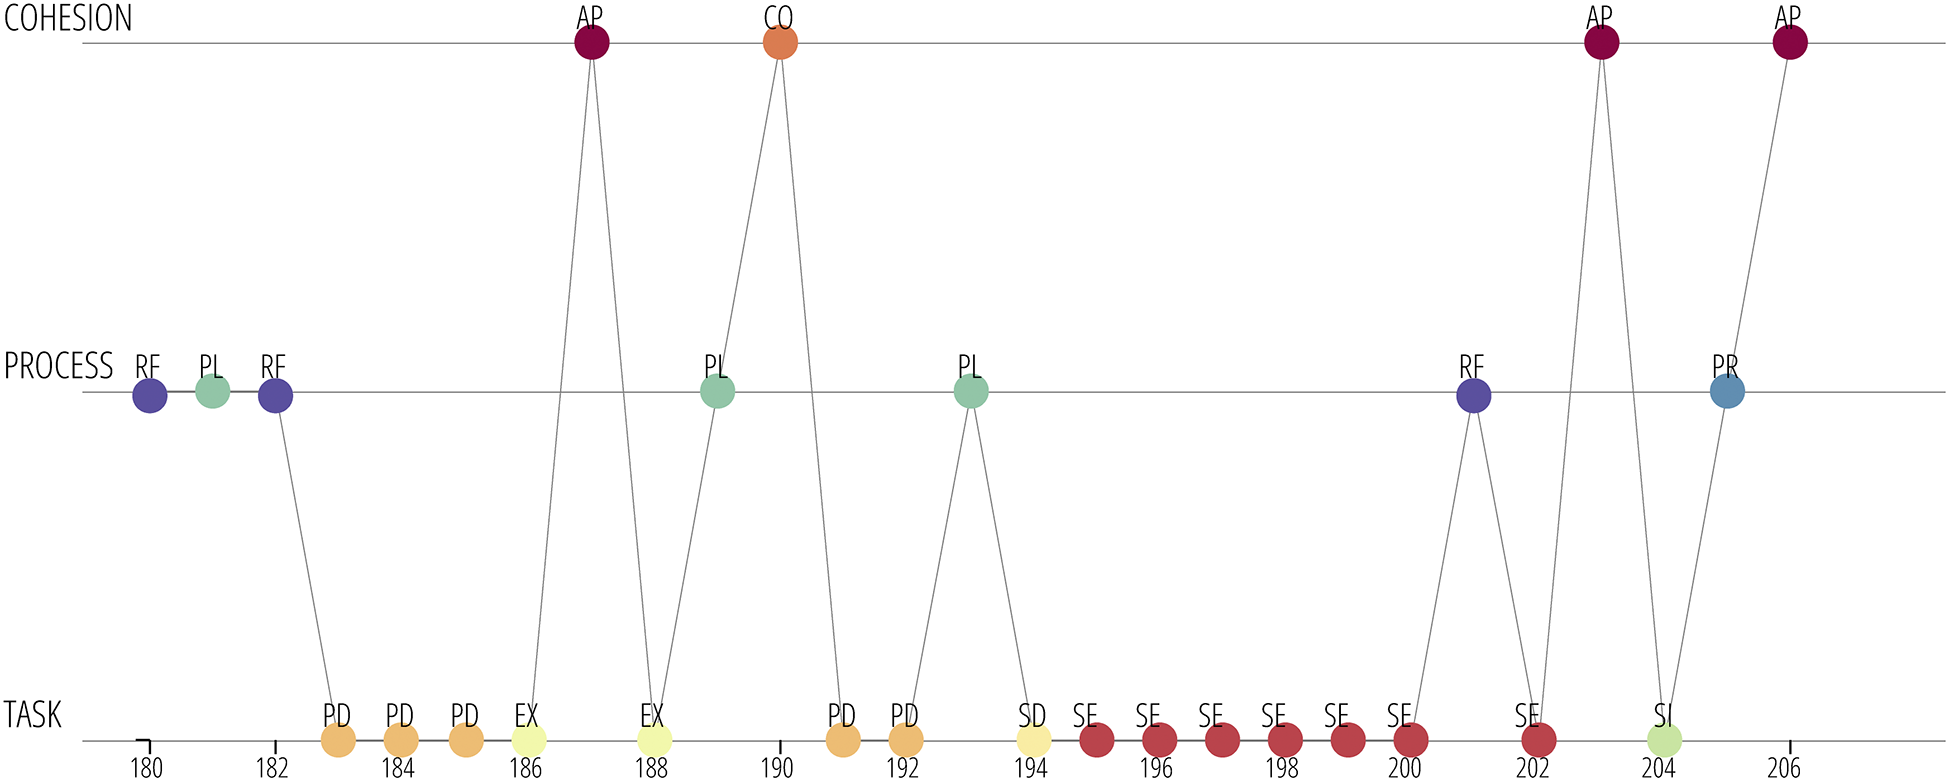
Figure 9. Long description
The diagram consists of three horizontal rows labeled from bottom to top as Task, Process, and Cohesion. Along the x-axis, time values range from 180 to 206. In the Task row, colored circles are labeled sequentially as PD at 182, 184, 190, 192; EX at 186, 188; SD at 194; SE at 196, 198, 200, 202; SI at 204. In the Process row, circles are labeled RF at 180, 200; PL at 182, 188; PR at 204. In the Cohesion row, circles are labeled AP at 186, 202, 204, 206; CO at 190. Vertical lines connect circles across rows, mapping the sequence of code transitions. For example, the PD at 182 in Task connects to PL at 182 in Process, which connects to RF at 180 in Process, and so on. The mapping visually tracks how codes shift between Task, Process, and Cohesion over time, with repeated transitions to AP in Cohesion at later time points.
The unfacilitated group encountered coordination challenges when attempting to establish solution criteria. Participant G2A initiated criterion definition efforts, but subsequent dialogue lacked sustained focus. This highlights that newly formed teams may be willing to create cohesion in their task processes, but, as occurred with the unfacilitated group, they may struggle with maintaining consistency and coherence:
Excerpt 7 – Unfacilitated group
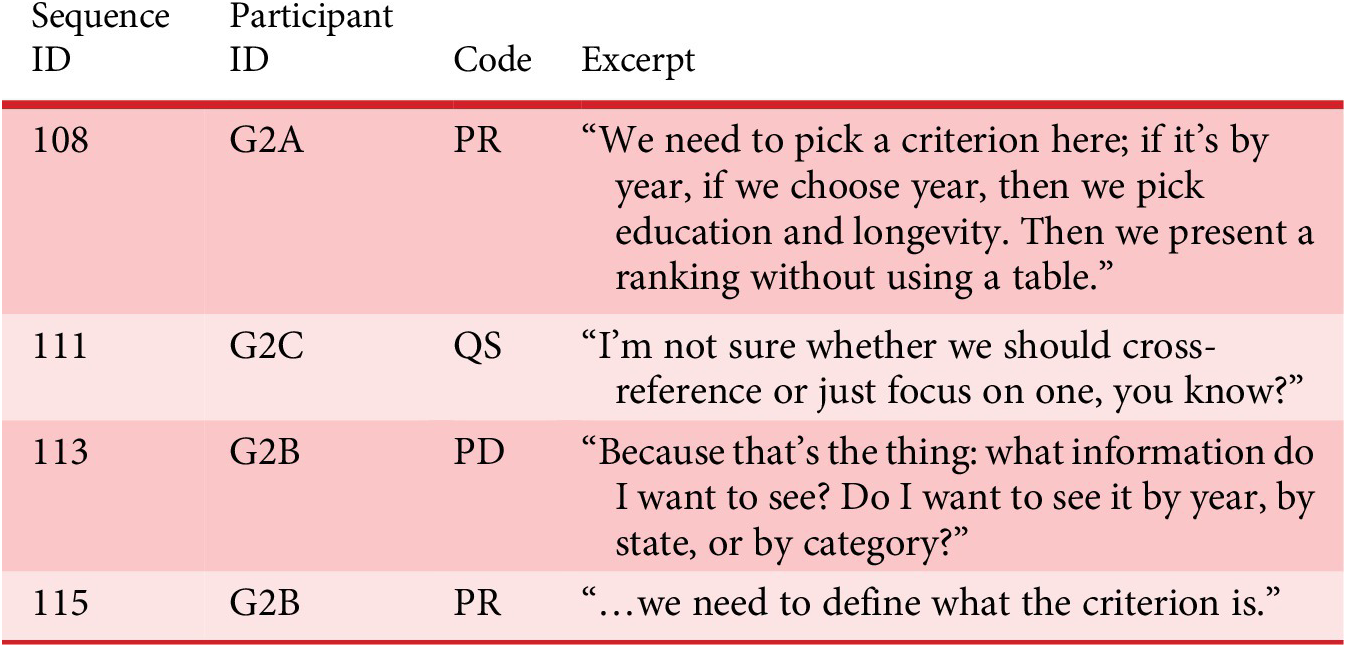
Table 14. Long description
Column headers from left to right are Sequence ID, Participant ID, Code, and Excerpt. Row one: Sequence ID 108, Participant ID G2A, Code PR, Excerpt reads ‘We need to pick a criterion here; if it’s by year, if we choose year, then we pick education and longevity. Then we present a ranking without using a table.’ Row two: Sequence ID 111, Participant ID G2C, Code QS, Excerpt reads ‘I’m not sure whether we should cross-reference or just focus on one, you know?’ Row three: Sequence ID 113, Participant ID G2B, Code PD, Excerpt reads ‘Because that’s the thing: what information do I want to see? Do I want to see it by year, by state, or by category?’ Row four: Sequence ID 115, Participant ID G2B, Code PR, Excerpt reads ‘…we need to define what the criterion is.’
The unfacilitated group’s transition patterns reflected fragmented coordination attempts, with distributed planning activities (PL → PL: +20.4 pp) and multiple validation-seeking sequences (PL → AP: +20.4 pp; AP → PR: +9.8 pp). Figure 10 displays the code sequence following G2A’s criterion-setting attempt, revealing diffuse conversation patterns despite unified coordination efforts. Most importantly, this sequence demonstrates the lack of rejection (RJ) codes; as the team was struggling to define their objectives, productive conflict could have helped introduce divergent ideas. Additionally, the sequence shows how they transitioned between the three dimensions in a fragmented manner.
Sequence of codes following participant G2A from the unfacilitated group, who prompted the team regarding the selection of design guidelines.
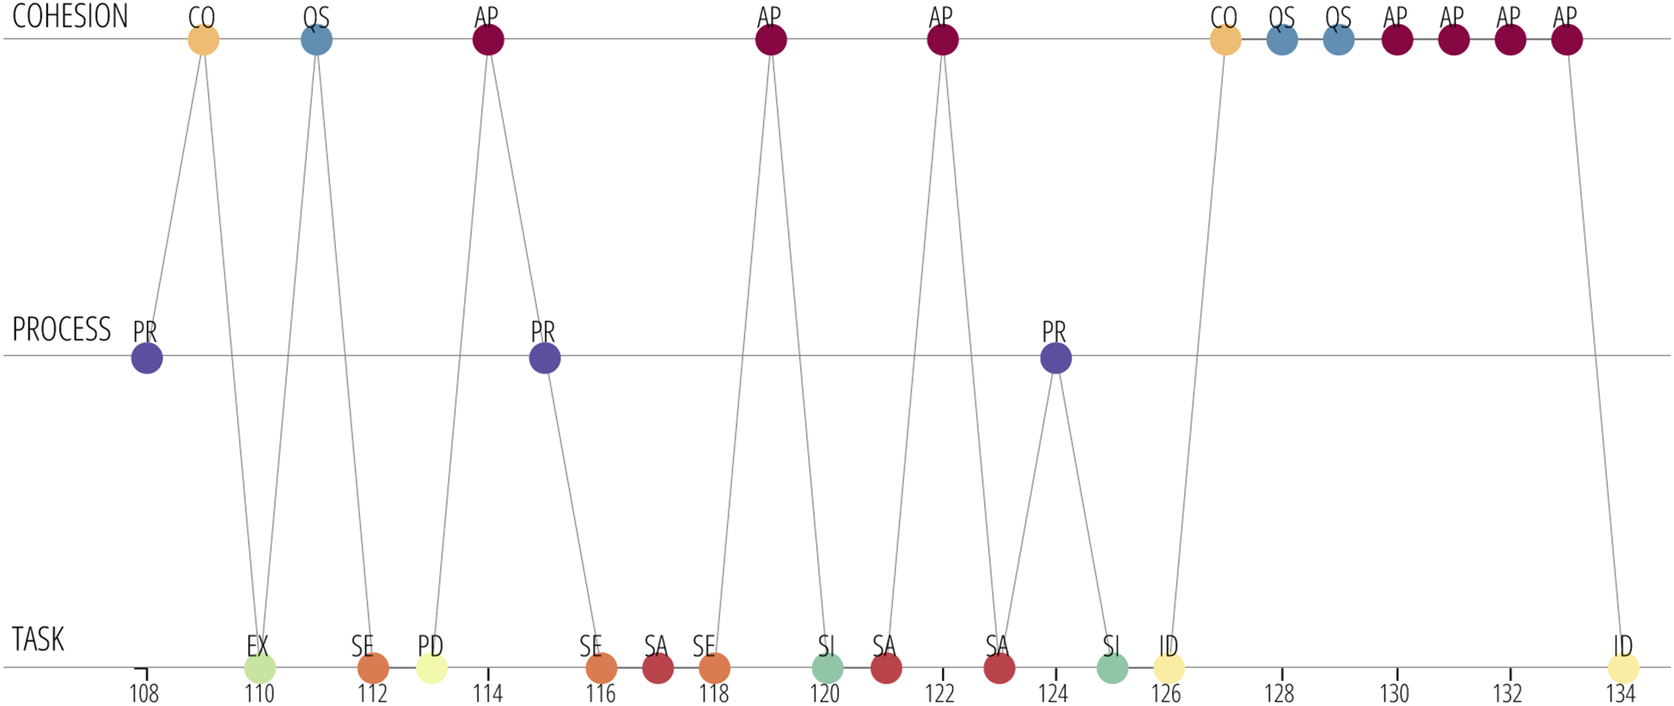
Figure 10. Long description
The horizontal axis at the bottom is labeled with numbers from 108 to 134, increasing left to right. Three horizontal bands are labeled from top to bottom as COHESION, PROCESS, and TASK. In the COHESION band, colored circles are labeled C O, Q S, and A P, distributed at intervals above the axis. In the PROCESS band, purple circles labeled P R are positioned at 108, 114, 124, and 126. In the TASK band, circles are labeled E X at 110, S E at 112 and 116, P D at 114, S A at 118, 120, and 122, S I at 124, I D at 126 and 134. Vertical lines connect each TASK code upward to its corresponding PROCESS and COHESION codes, forming a network of transitions. The sequence shows repeated alternation between A P and Q S in COHESION, with P R in PROCESS, and S A, S E, and S I in TASK. The distribution of codes illustrates the participant’s prompting and the team’s selection process, with denser activity between 120 and 132.
While the facilitated group demonstrated systematic problem-framing cycles facilitated by structured guides, the unfacilitated group showed recognition of coordination needs but struggled to maintain consistent frameworks throughout their collaborative process. These patterns suggest that framing guides support sustained dialogical negotiation around shared objectives, though both groups ultimately engaged in criterion-setting behaviors, indicating that the mechanism facilitated inherent team coordination capabilities.
4.4. Guided reflexivity
RQ4 examined how guided reflexivity enables the establishment of procedural strategies in recently formed interdisciplinary design teams by facilitating the articulation and refinement of shared process- and cohesion-related TMM content. The facilitated group received structured reflexivity interventions at strategic moments, while the unfacilitated group engaged in spontaneous reflective activities.
In addition, the facilitated group experienced two formal reflexivity interventions. The first occurred at 01:09:05, after completing their initial visualization proposal, allowing participants to evaluate solution quality, revisit framing guides that the team had used to establish their objectives and discuss future directions. As shown in Figure 8, during this first implementation of guided reflexivity, the team adapted the order of their objectives in the framing guides. This intervention prompted evaluation of their adherence to previously established criteria.
Excerpt 8 – Facilitated group
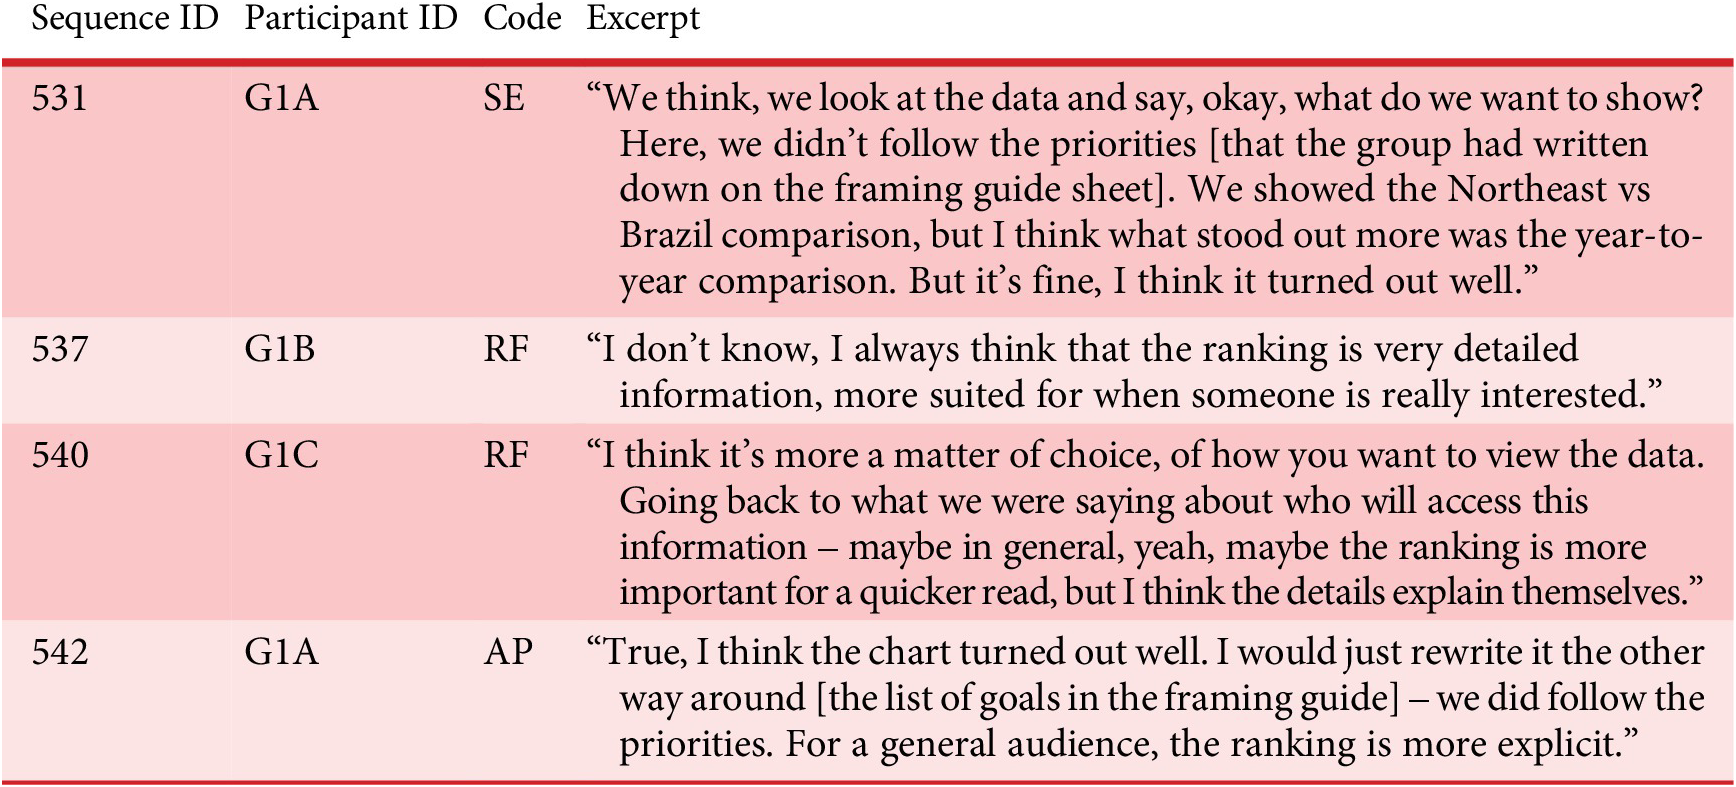
Table 15. Long description
Column headers from left to right are Sequence I D, Participant I D, Code, and Excerpt. Row one: Sequence I D 531, Participant I D G 1 A, Code SE, excerpt discusses showing Northeast versus Brazil comparison versus year-to-year comparison and group priorities. Row two: Sequence I D 537, Participant I D G 1 B, Code RF, excerpt notes ranking is detailed and best for those with specific interest. Row three: Sequence I D 540, Participant I D G 1 C, Code RF, excerpt reflects on choice in viewing data, ranking for quick read, details for explanation. Row four: Sequence I D 542, Participant I D G 1 A, Code AP, excerpt affirms chart quality, suggests rewriting priorities, and notes ranking is explicit for general audience.
Figure 11 illustrates the code sequence following this intervention, showing concentrated reflection (RF), planning (PL) and procedural (PR) discussions. The facilitated group’s transition patterns revealed systematic reflexive cycles (RF → RF: +16.8 pp), evaluative moments (RF → SE: +5.3 pp) and clarification processes (RF → EX: +5.3 pp), indicating structured information processing. This visualization reinforces the effects of the guided reflexivity intervention, as the team maintained continuous reflection (RF), concentrating most of their efforts within the process dimension, concluding the reflection code sequence with planning (PL) and process (PR) iterations.
Sequence of code following the first instance of guided reflexivity implementation in the facilitated group.
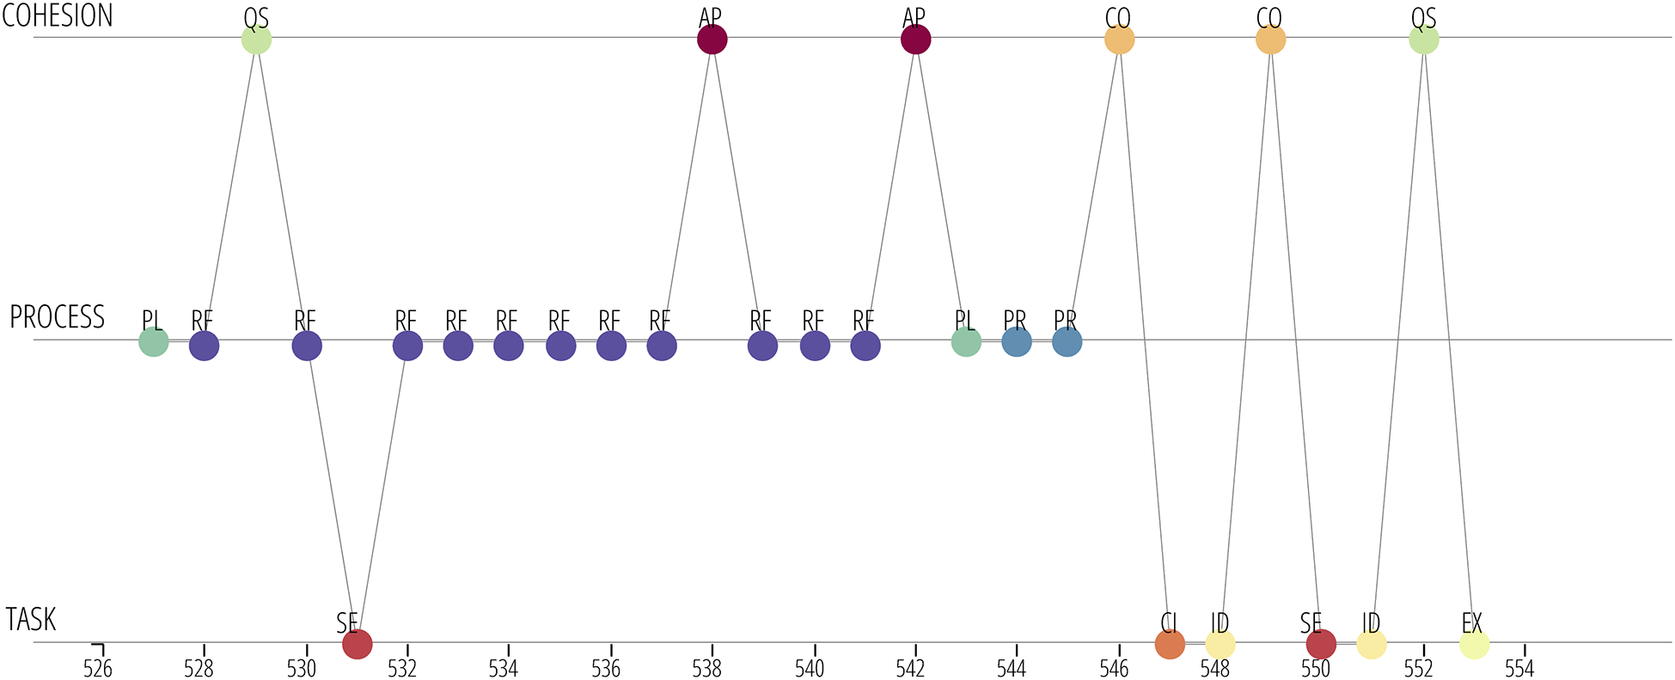
Figure 11. Long description
The diagram consists of three horizontal bands labeled Cohesion at the top, Process in the middle, and Task at the bottom. The x-axis is labeled Task, with values ranging from 526 to 554 in increments of two. Each band contains colored circles labeled with codes: Cohesion includes QS, AP, CO; Process includes PL, RF, PR; Task includes SE, CL, ID, EX. At task 526, PL is in Process. At 528, QS is in Cohesion and SE in Task, connected by a line. From 530 to 542, RF appears repeatedly in Process, with AP in Cohesion at 536 and 538, both linked to RF. At 544, PL is in Process, PR at 546, and CO in Cohesion at 546 and 548, each linked to CL and ID in Task. At 550, QS is in Cohesion, SE in Task, and at 552, QS in Cohesion, ID in Task, both connected. EX appears in Task at 554. Lines connect vertically aligned codes across categories at each task point, illustrating the sequence and relationships of code implementation.
Furthermore, the second intervention occurred near session completion, a moment where the reflection focused on team performance evaluation rather than forward planning. Participants expressed collective satisfaction and noted methodological improvements:
Excerpt 9 – Facilitated group
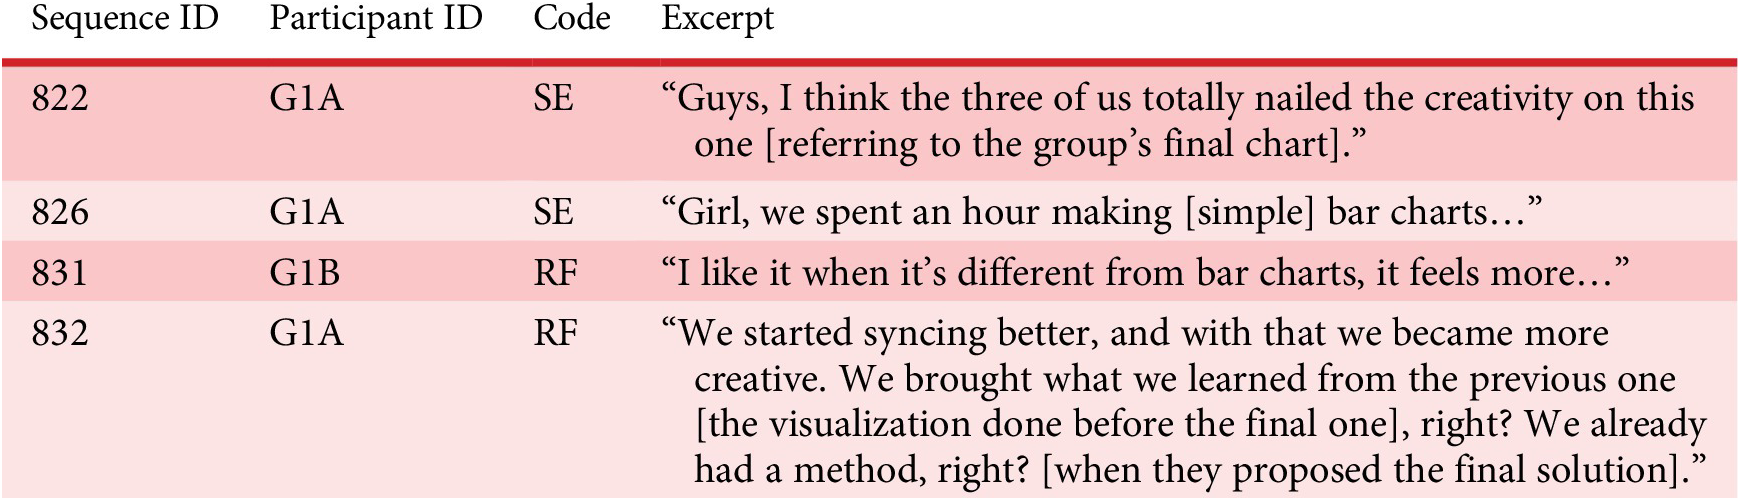
Table 16. Long description
The table contains four columns labeled Sequence ID, Participant ID, Code, and Excerpt. Row 1: Sequence ID 822, Participant ID G1A, Code SE, Excerpt: ‘Guys, I think the three of us totally nailed the creativity on this one [referring to the group’s final chart].’ Row 2: Sequence ID 826, Participant ID G1A, Code SE, Excerpt: ‘Girl, we spent an hour making [simple] bar charts…’ Row 3: Sequence ID 831, Participant ID G1B, Code RF, Excerpt: ‘I like it when it’s different from bar charts, it feels more…’ Row 4: Sequence ID 832, Participant ID G1A, Code RF, Excerpt: ‘We started syncing better, and with that we became more creative. We brought what we learned from the previous one [the visualization done before the final one], right? We already had a method, right? [when they proposed the final solution].’
Figure 12 shows the corresponding code sequence, featuring appreciation (AP), confirmation (CO) and analytical assessments (SA, SE), with notably absent future-oriented planning codes. This evidence suggests that when teams face time restrictions, formal guided reflexivity interventions trigger different kinds of reflection; during the final moments, teams look back and evaluate their development in alignment with their established solution criteria.
Sequence of codes following the second instance of guided reflexivity implementation in the facilitated group.
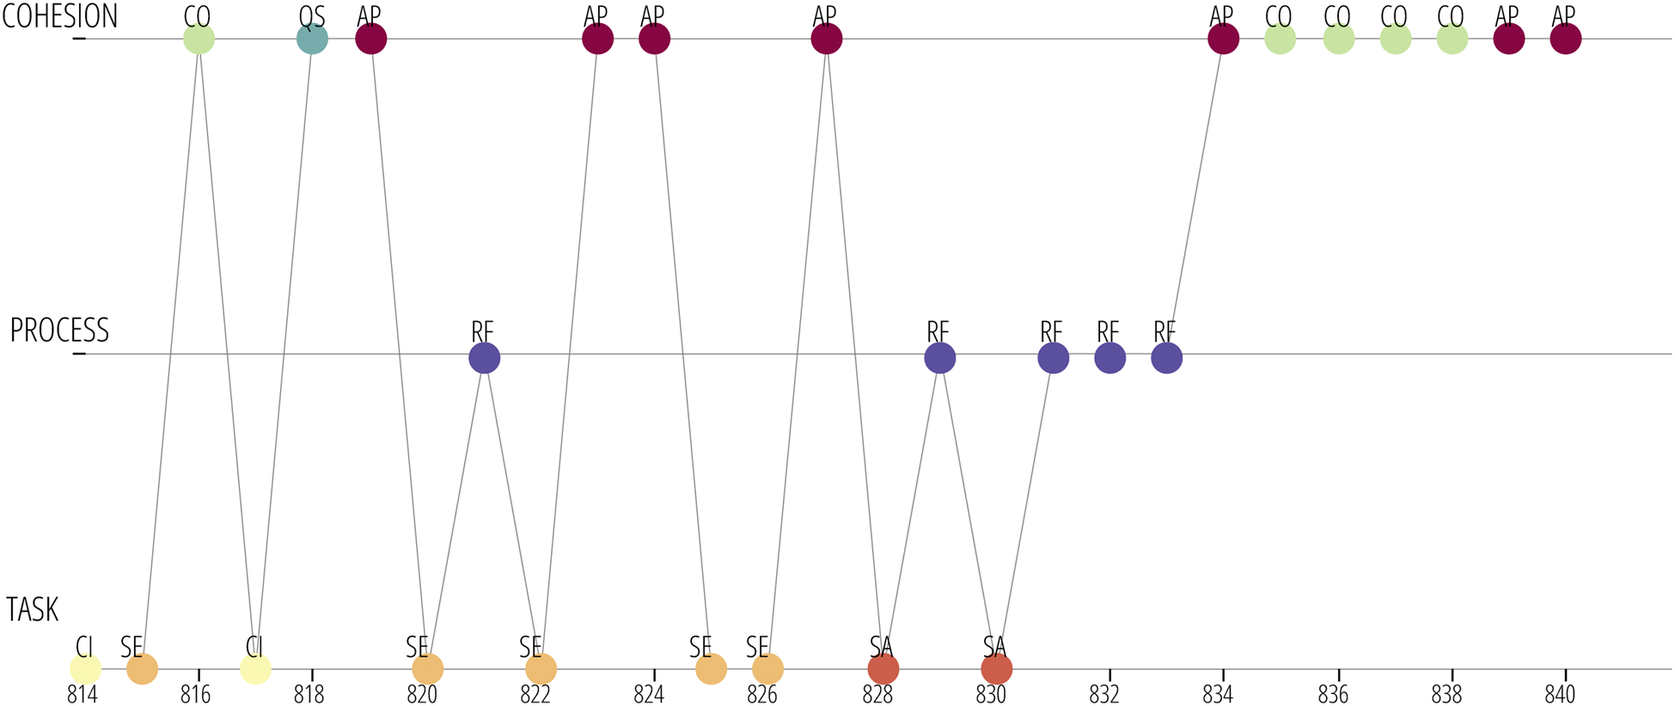
Figure 12. Long description
The x-axis displays time points from 814 to 840 in increments of two. The lowest level, labeled TASK, contains colored circles with codes: CI at 814 and 818, SE at 816, 820, 822, 824, 826, SA at 828 and 830. The middle level, PROCESS, shows RF at 822, 828, 830, 832, and 834. The top level, COHESION, includes CO at 814, 834, 836, 838, 840; QS at 816; AP at 820, 822, 824, 826, 832, 834, 840. Vertical and diagonal lines connect nodes across levels at each time point, indicating transitions between codes. For example, at 814, CI (TASK) connects to CO (COHESION); at 816, SE (TASK) connects to QS (COHESION); at 822, SE (TASK) connects to RF (PROCESS) and then to AP (COHESION). The pattern shows alternating connections among codes, with clusters of COHESION codes toward the right end.
Alternatively, the unfacilitated group engaged in spontaneous reflection at 01:29:02, led by participant G2B, after they finished their propositions and knew that the activity was close to the end. However, team members demonstrated uncertainty and misalignment when discussing the solution content and interpretation.
Excerpt 10 – Unfacilitated group
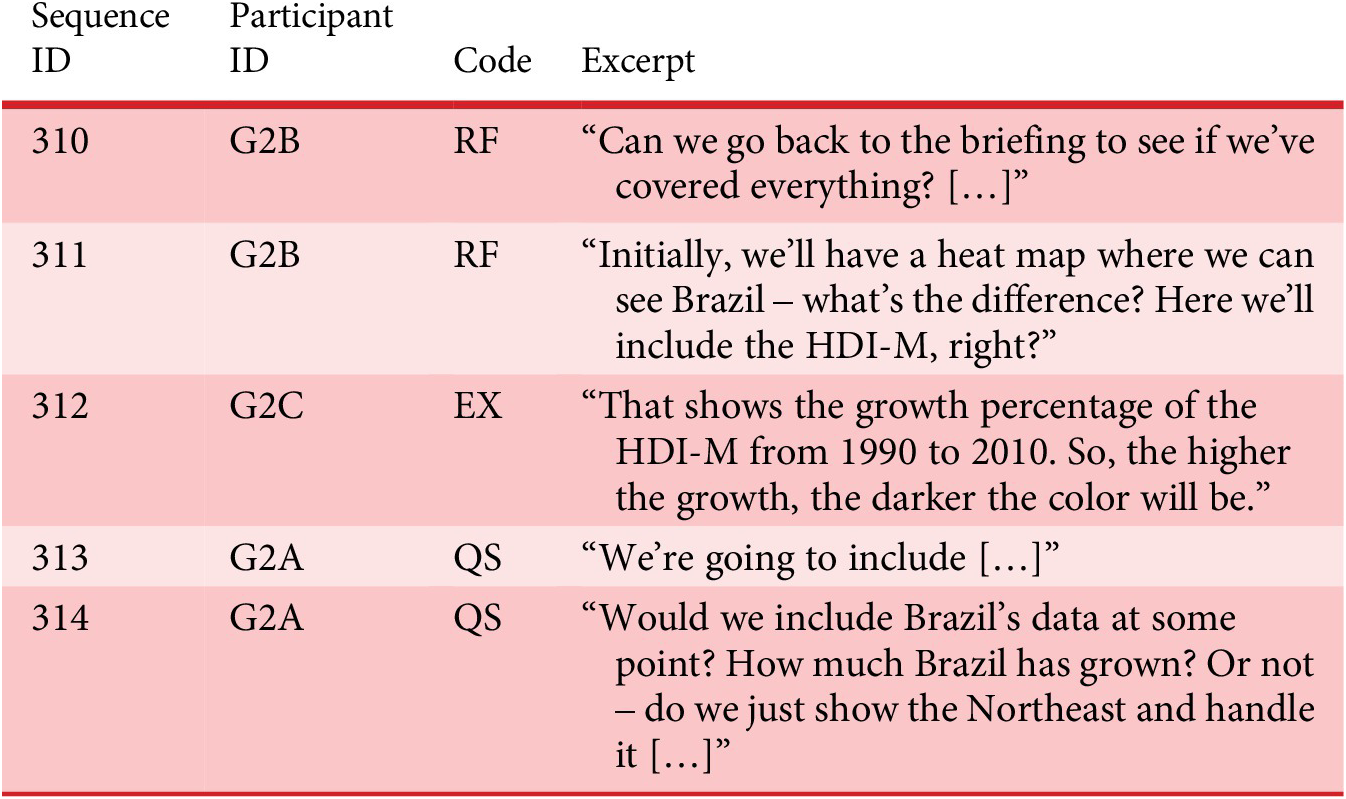
Table 17. Long description
The table has four columns labeled Sequence ID, Participant ID, Code, and Excerpt. The first row contains Sequence ID 310, Participant ID G2B, Code R F, and the excerpt ‘Can we go back to the briefing to see if we’ve covered everything? […]’. The second row lists Sequence ID 311, Participant ID G2B, Code R F, and the excerpt ‘Initially, we’ll have a heat map where we can see Brazil – what’s the difference? Here we’ll include the H D I dash M, right?’. The third row shows Sequence ID 312, Participant ID G2C, Code E X, and the excerpt ‘That shows the growth percentage of the H D I dash M from 1990 to 2010. So, the higher the growth, the darker the color will be.’. The fourth row presents Sequence ID 313, Participant ID G2A, Code Q S, and the excerpt ‘We’re going to include […]’. The fifth row contains Sequence ID 314, Participant ID G2A, Code Q S, and the excerpt ‘Would we include Brazil’s data at some point? How much Brazil has grown? Or not – do we just show the Northeast and handle it […]’.
Moreover, Figure 13 displays the unfacilitated group’s code sequence, revealing task-focused activities without concentrated process-related dimensions. Their transition matrix showed limited reflexive activity (RF → RF: +6.3 pp) and fragmented patterns, with minimal process-related shifts (RF → PR: +1.8 pp; RF → PL: +0 pp), contrasting with the facilitated group’s systematic reflexive structure. Evident are the frequencies of explanation (EX) and question (QS) codes following the initial reflection moment. Additionally, the sequence shows analytical states (SE and SA) and the only rejection code that transitioned from a new idea solution and ended with confirmation of the rejection (SI → RJ → CO).
Sequence of codes following the key moment when the designer G2B from the unfacilitated group, spontaneously reflected on the team’s design proposals at timestamp 01:29:02.
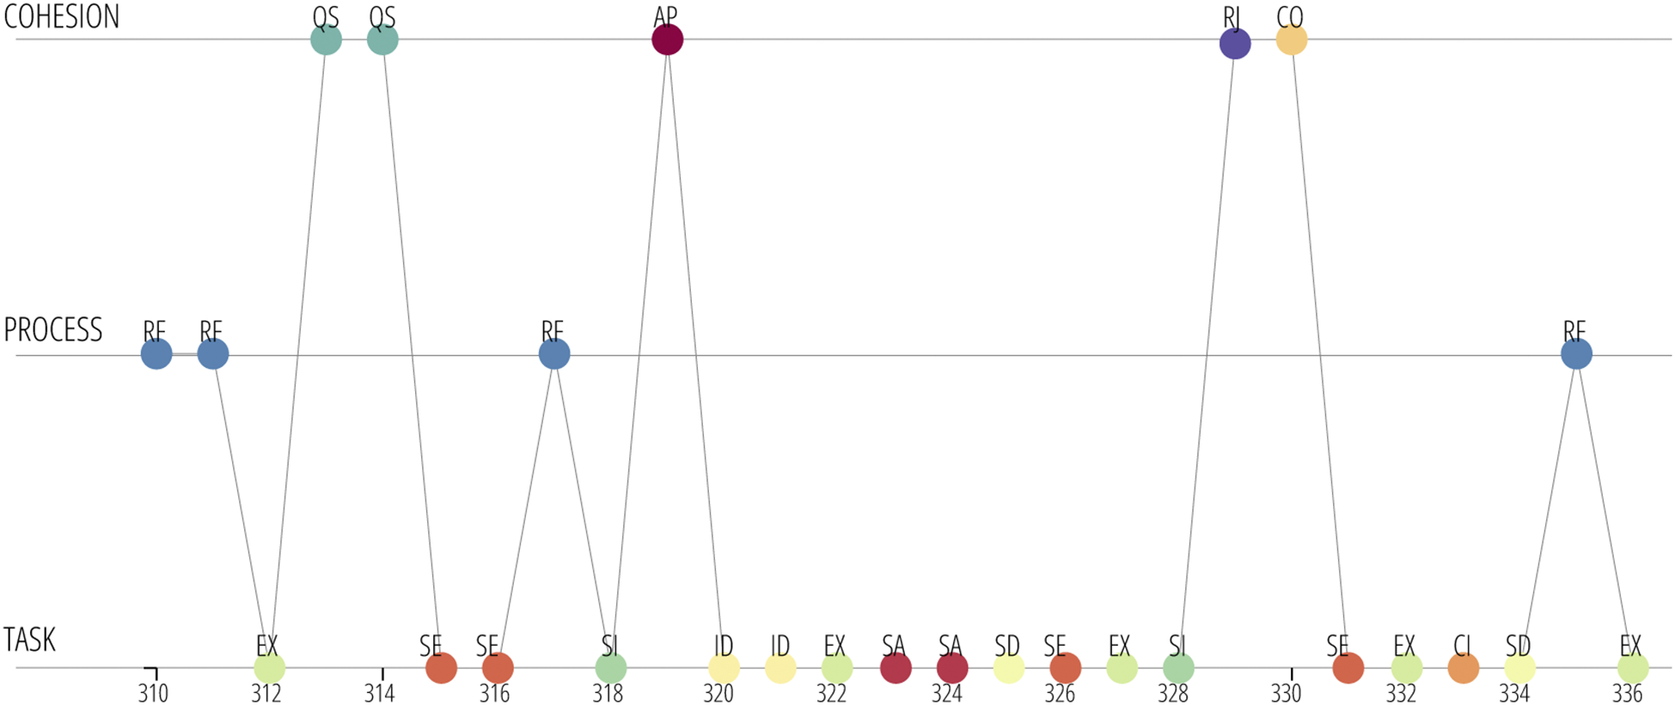
Figure 13. Long description
The horizontal axis at the bottom is labeled TASK, with tick marks and codes from 310 to 336. Above, two parallel lines are labeled PROCESS and COHESION. Colored circles mark events, each labeled with a two-letter code. From left to right: TASK codes include EX at 312, SE at 314 and 316, ID at 320, SA at 322 and 324, SD at 326 and 334, SL at 328, SE at 330, EX at 332 and 336, and CI at 332. PROCESS codes (blue) are RE at 310, 312, 318, and 336. COHESION codes (green, purple, yellow, red) are OS at 314 and 316, AP at 320, RI at 328, and CO at 330. Lines connect related codes vertically, showing when events at the TASK level correspond to PROCESS or COHESION events above. Peaks occur at AP (320), RI (328), and CO (330), indicating key moments of group cohesion.
The facilitated group’s guided reflexivity facilitated procedural strategy development through systematic evaluation cycles and alignment with established frameworks. This link between guided reflexivity and framing guides was unexpected but revealed that formal mechanisms like framing guides serve as anchors as teams progress in solution processes. During reflection, the facilitated group adapted criteria as their perception of the task evolved since first using the framing guides. The unfacilitated group’s spontaneous reflection, though present, lacked structured coordination mechanisms. These patterns suggest that formal reflexivity interventions enhance systematic information processing and strategic alignment, though both groups showed inherent reflective capabilities during collaborative design.
5. Analysis and discussion
Given the exploratory nature of our research, this section analyzes qualitative evidence and connects it with existing theories, while acknowledging the preliminary character of the findings and their limitations. With a small sample and only two groups, statistical analysis was unfeasible. Nevertheless, qualitative pattern identification revealed the dynamics of TMM sharedness and how systematic interventions influenced them. Therefore, although lacking statistical generalization, the detailed examination of verbal protocols and behavioral sequences offers valuable insights into mechanisms of co-design interventions. These insights guide future practice by clarifying how interaction patterns, communication strategies and team coordination contribute to the dynamics of TMM sharedness.
5.1. Integrative activities and dialogical spaces
The facilitated group’s willingness to engage in constructive conflict was evidenced by 28 coded instances of rejection moves, compared to only one in the unfacilitated group. This disparity indicates an openness to sharing divergent ideas in the facilitated group, supporting the claim that early team integration facilitates the emergence of dialogical spaces. In contrast, the unfacilitated group illustrated how the absence of early integration resulted in a lack of rejection moves and hindered the development of mutual understanding of roles and abilities, as reflected in participants’ repeated reliance on professional credentials to substantiate their arguments.
Integrative activities effectively address the challenges of interdisciplinary infovis projects, where participants from diverse backgrounds must navigate distinct vocabularies and domain-specific knowledge (Dörk et al. Reference Dörk, Müller, Stange, Herseni and Dittrich2020). By doing so, they create dialogical spaces that foster trust and familiarity among team members, thereby enabling constructive conflict (Santos et al. Reference Santos, Uitdewilligen and Passos2015). The facilitated group’s earlier engagement in problem-solving activities and higher frequency of explicit disagreements suggest that early forming activities accelerate progression through the storming phase (Tuckman Reference Tuckman1965). This finding is consistent with Jo’s (Reference Jo2011) observation that integrative activities act as antecedents of TMM sharedness in newly formed teams, fostering TMMs of roles and individual abilities.
To leverage these insights in practice, facilitators should deliberately structure and facilitate integrative activities at the outset of collaboration. This involves creating conditions for participants to share personal and professional backgrounds beyond formal credentials, encouraging openness about individual roles, abilities and perspectives. By framing such exchanges as opportunities for experimentation and co-creation, facilitators can cultivate dialogical spaces that enable constructive conflict. Structured prompts, role-clarification exercises and low-risk exploratory tasks can further support early alignment, enabling teams to navigate disciplinary boundaries and accelerate the emergence of shared TMM content.
5.2. Evocative artifacts and ideation, communication and evaluation
Both groups benefited from external artifacts, either provided systematically in the facilitated group or accessed spontaneously through the unfacilitated group’s smartphone use, indicating that evocative artifacts facilitate knowledge translation across disciplinary boundaries. In the facilitated group, such artifacts were employed to generate new propositions that extended beyond the available references, while the unfacilitated group drew on external examples to visualize complex concepts and to overcome knowledge gaps and communication barriers.
These findings align with prior research on external cognition and the distributed nature of the design process (Sanders & Stappers Reference Sanders and Stappers2014) and also offer exploratory evidence in alignment with the boundary objects literature (Star & Griesemer Reference Star and Griesemer1989). From a TMM perspective, evocative artifacts acted as stimuli that promoted sharedness by facilitating alignment on task content, such as visualization techniques and solution possibilities (Mohammed et al. Reference Mohammed, Ferzandi and Hamilton2010). Moving from artifact consultation to creative elaboration, visual references supported idea articulation and analogical reasoning (Sanders & Stappers Reference Sanders and Stappers2014; Dörk et al. Reference Dörk, Müller, Stange, Herseni and Dittrich2020). Moreover, the observation that participants sought their own visual references reinforces the proposition that TMM sharedness enables teams to identify and integrate external information into their collective mental models (Uitdewilligen et al. Reference Uitdewilligen, Waller, Roe and Bollen2023).
Therefore, for facilitators aiming to foster the generation of novel propositions and the establishment of shared criteria for evaluating solutions, it is essential to formally integrate evocative artifacts into team activities. Rather than relying solely on spontaneous consultation, facilitators can curate diverse material references that stimulate reasoning and broaden the repertoire of shared ideas. Simultaneously, they should encourage participants to explore external references, framing this practice as a legitimate and valuable contribution to collective sensemaking. By balancing structured provision with openness to emergent inputs, facilitators create conditions where artifacts act as catalysts for knowledge translation, miscommunication reduction and foster TMM sharedness, ultimately enhancing both task creativity and collaborative alignment.
5.3. Framing guides and adaptive decision-making
From a TMM perspective, framing guides facilitated alignment on task content, specifically procedures for data selection and visualization techniques, while also supporting team-cohesion content through clearer coordination strategies (Mohammed et al. Reference Mohammed, Ferzandi and Hamilton2010; Dörk et al. Reference Dörk, Müller, Stange, Herseni and Dittrich2020). In the facilitated group, the use of structured prompts such as “I want to find out…” supported collective goal alignment, consistent with research on TMM formation (Klimoski & Mohammed Reference Klimoski and Mohammed1994). These prompts enabled a cyclical process of setting collective goals, revisiting them during reflective sessions and evaluating potential solutions. By contrast, the unfacilitated group’s repeated efforts to establish criteria without a formal framework indicate that although teams may recognize the need for shared framing, they often struggle to sustain coherence in its absence. This highlights the difficulty of achieving initial alignment that is common in newly formed interdisciplinary teams.
This systematic approach enhances what Abrantes et al. (Reference Abrantes, Passos, Cunha and Santos2022) describe as teams’ capacity to maintain or improve performance when transitioning from stable to adaptive situations. The observed patterns resonate with Dorst’s (Reference Dorst2015) work on frame innovation, underscoring the importance of explicit problem framing in design processes. The challenges faced by the unfacilitated group reflect those identified by Santos et al. (Reference Santos, Uitdewilligen and Passos2015) as typical in heterogeneous teams, where conflicting interests and divergent goals can undermine collaborative effectiveness. Overall, the findings suggest that the introduction of formal framing mechanisms may both accelerate emergent processes and strengthen team cohesion through shared TMM development, encompassing task execution and adaptive capability.
Additionally, for facilitators seeking to stimulate adaptive decision-making that strengthens the capacity to collectively adjust decisions in response to evolving requirements, it is recommended to introduce structured framing guides early in the collaboration. Prompts that encourage collective goal articulation can be used to establish shared objectives while leaving room for reinterpretation and reframing as the process unfolds. Equally important is the facilitation of reflective moments, as explored in the next section, where teams revisit and refine their frames in light of emerging insights. By balancing structure with flexibility, facilitators can help heterogeneous teams transform divergent perspectives into resources for creative synthesis, strengthening both adaptive capacity and cohesion through the progressive development of TMMs.
5.4. Guided reflexivity and procedural strategies
The qualitative evidence suggests that guided reflexivity enhances the natural process of procedural strategy development, rather than introducing entirely new capabilities. The facilitated group’s structured reflection sessions yielded patterns consistent with established research on team reflexivity and the development of procedural strategies in design contexts. By contrast, the unfacilitated group’s spontaneous efforts to establish procedural frameworks indicate that teams exhibit an inherent recognition of the need for systematic procedural approaches, albeit with less structure and consistency. This observation aligns with research on design cognition, which identifies reflexivity as an intrinsic dimension of design activity (Schön Reference Schön1983).
Formal interventions facilitated what Casakin & Badke-Schaub (Reference Casakin and Badke-Schaub2017) define as procedural strategies, defined as clarifying the methods and procedures required to complete the design. From a TMM perspective, guided reflexivity operated as an explicit information-processing activity that enabled teams to reflect on strategies and adapt their functioning, particularly in complex and evolving project environments (Uitdewilligen et al. Reference Uitdewilligen, Waller, Roe and Bollen2023; Abrantes et al. Reference Abrantes, Passos, Cunha and Santos2022). The role of framing guides was especially evident during these interventions: to assess whether their actions aligned with established goals, teams actively referenced their guides during reflection sessions and adapted objectives based on the insights gained. Overall, the structured reflection sessions functioned as a mechanism for aligning procedural understanding, thereby supporting coordination in tackling complex design challenges that demand systematic methodology development (Santos et al. Reference Santos, Uitdewilligen and Passos2015).
These findings provide material for facilitators seeking to foster procedural strategies in co-design processes. Also, as noted before, it is advisable to combine guided reflexivity with the systematic use of framing guides. At the outset, facilitators can encourage teams to articulate explicit procedures and criteria, transforming tacit understandings into shared strategies. During reflection sessions, they should prompt participants to revisit these frames, compare them with evolving project demands and adjust objectives collaboratively. This practice not only reinforces procedural clarity but also creates a safe environment for testing ideas, negotiating disagreements and integrating diverse perspectives. In doing so, facilitators help teams transform reflexive practices into catalysts of adaptive learning and creative synthesis.
5.5. Synergistic effects of co-design interventions
Qualitative evidence indicates that systematic co-design interventions shape the dynamics of TMM sharedness in interdisciplinary teams. The facilitated group’s enhanced communicative patterns, increased constructive conflicts and established procedural strategies demonstrate that structured facilitation accelerates team cognition development (Klimoski & Mohammed Reference Klimoski and Mohammed1994; Santos et al. Reference Santos, Uitdewilligen and Passos2015). These interventions operate synergistically rather than additively, where integrative activities create interpersonal foundations for productive artifact interaction, supporting framing processes that enable effective reflexivity. This interconnected dynamic suggests that TMM formation requires coordinated attention to both cognitive and social collaboration dimensions (Uitdewilligen et al. Reference Uitdewilligen, Waller, Roe and Bollen2023; Abrantes et al. Reference Abrantes, Passos, Cunha and Santos2022).
Implications may extend beyond infovis to broader interdisciplinary design collaboration, especially those in which recently formed interdisciplinary design teams must cope with complex information environments and evolving project requirements. In the next section, a procedural framework is presented to offer systematic approaches for addressing fundamental collaborative visualization challenges: bridging semantic distances, integrating diverse perspectives and maintaining creative momentum (Dörk et al. Reference Dörk, Müller, Stange, Herseni and Dittrich2020).
6. Toward a conceptual synthesis
To address our research questions, this section presents a procedural framework integrating exploratory findings with research on TMMs and co-design. The framework (see Figure 14) specifically addresses challenges of domain dependency, interdisciplinary team composition and complex informational environments, typical of infovis projects. Given the limitations of our two-group research, we position this outcome as grounded more in literature integration than empirical evidence alone.
Procedural framework for fostering the sharedness of TMMs.
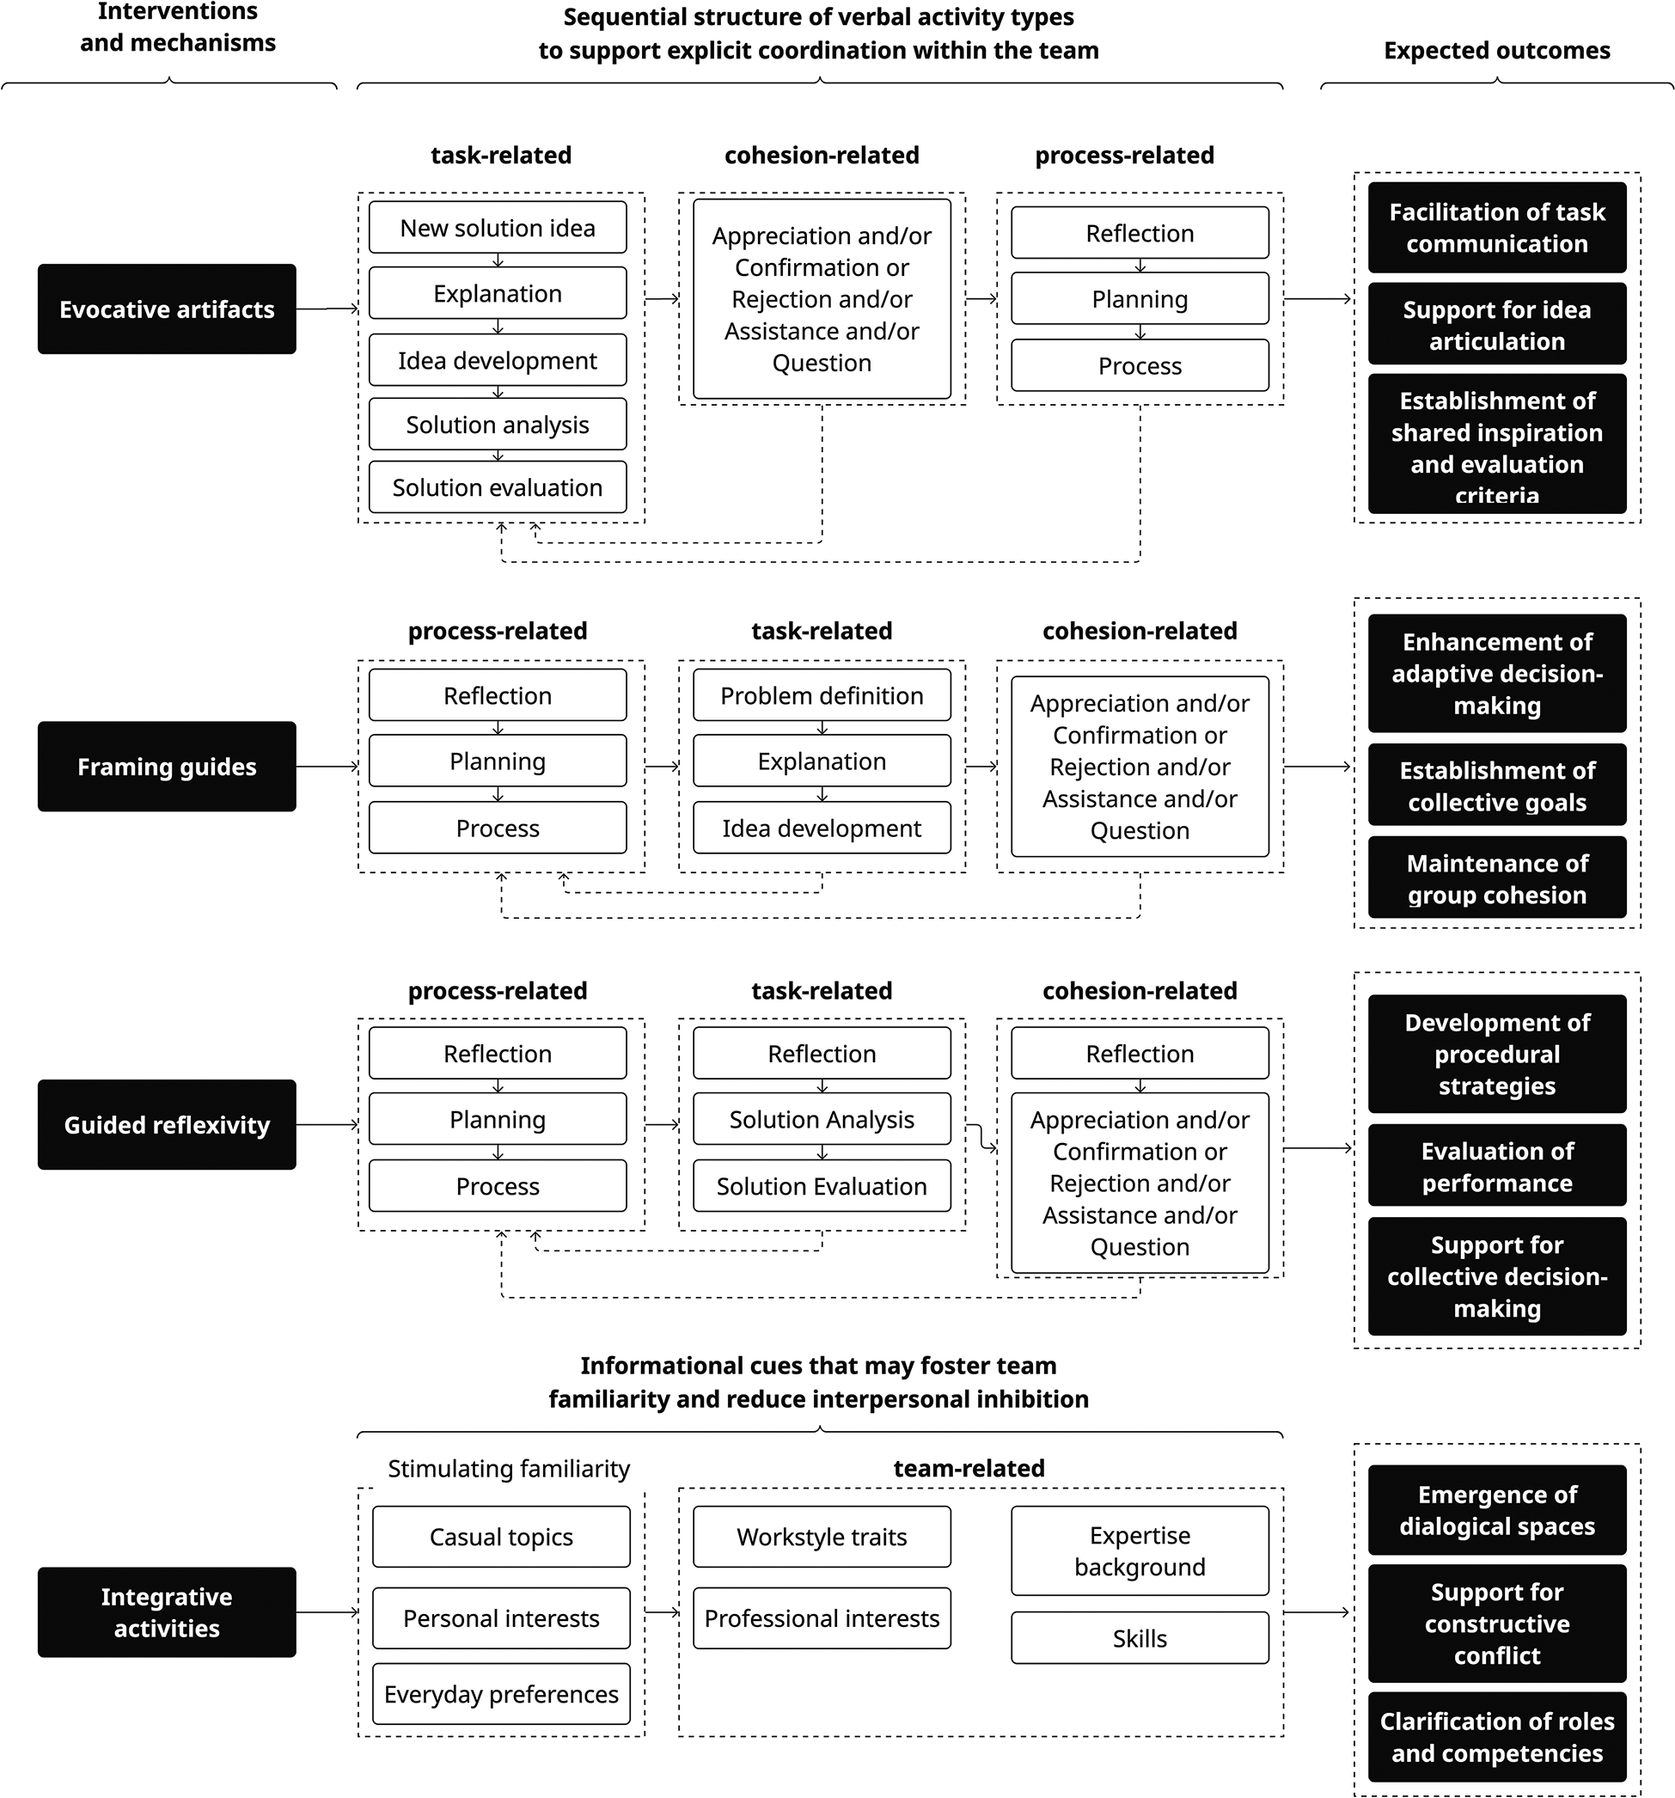
Figure 14. Long description
From top to bottom, four horizontal bands represent evocative artifacts, framing guides, guided reflexivity, and integrative activities. Each band starts at the left with a black box naming the intervention. To the right, white boxes group verbal activity types under task-related, cohesion-related, process-related, or team-related categories. For evocative artifacts, task-related types include new solution idea, explanation, idea development, solution analysis, and solution evaluation. Cohesion-related types list appreciation and or confirmation or rejection and or assistance and or question. Process-related types are reflection, planning, and process. Framing guides have process-related (reflection, planning, process), task-related (problem definition, explanation, idea development), and cohesion-related (same as above). Guided reflexivity includes process-related (reflection, planning, process), task-related (reflection, solution analysis, solution evaluation), and cohesion-related (reflection, appreciation and or confirmation or rejection and or assistance and or question). Integrative activities are split into stimulating familiarity (casual topics, personal interests, everyday preferences) and team-related (workstyle traits, professional interests, expertise background, skills). Dotted arrows connect verbal activity types to black boxes at the far right, listing expected outcomes. For evocative artifacts: facilitation of task communication, support for idea articulation, establishment of shared inspiration and evaluation criteria. For framing guides: enhancement of adaptive decision-making, establishment of collective goals, maintenance of group cohesion. For guided reflexivity: development of procedural strategies, evaluation of performance, support for collective decision-making. For integrative activities: emergence of dialogical spaces, support for constructive conflict, clarification of roles and competencies.
The procedural framework follows a systematic structure, where each component begins with a formal intervention implemented through an artifact or by the facilitator (positioned on the left side of each block) that was empirically investigated in our study. Following each intervention, three interconnected fields correspond to the TMM content dimensions established by Casakin & Badke-Schaub (Reference Casakin and Badke-Schaub2017), which categorize the observed code patterns in our study. However, for the integrative activities intervention, the framework follows a different structure, as this intervention is proposed to occur before the task and is intended to foster the sharing of professional and personal information among members. Each sequence concludes with expected outcomes derived from both established literature and empirical observations from our study.
For practitioners applying this framework, we recommend an approach that acknowledges the iterative nature of design processes. Our qualitative analysis of coded verbal sequences revealed patterns in how teams navigate the three TMM content areas (task, process and cohesion). On the left, the procedural framework presents interventions, either facilitator-led or artifact-based. At the center, blocks correspond to an activity, guiding the dialogue teams should prioritize. As this is iterative, facilitators must monitor discourse for engagement indicators and adjust interventions accordingly. The framework can be applied in co-design activities in similar contexts, offering a structured yet flexible means to foster TMM sharedness in information-rich environments.
The proposed framework extends existing understanding by suggesting that structured integrative activities create foundational conditions in the form of “dialogical spaces” (Jo Reference Jo2011; Santos et al. Reference Santos, Uitdewilligen and Passos2015), while evocative artifacts support semantic alignment as translational aids, crucial in infovis contexts where abstract data require collaborative interpretation (Goldschmidt Reference Goldschmidt2007; Dörk et al. Reference Dörk, Müller, Stange, Herseni and Dittrich2020). Structured framing interventions also enhance interdisciplinary teams’ capacity for adaptive decision-making (Uitdewilligen et al. Reference Uitdewilligen, Waller, Roe and Bollen2023; Abrantes et al. Reference Abrantes, Passos, Cunha and Santos2022), while guided reflexivity acts as a key mechanism for processing complex information and developing procedural strategies in design contexts (Casakin & Badke-Schaub Reference Casakin and Badke-Schaub2017; Fernandes et al. Reference Fernandes, Henriques, Silva and Pimentel2017; Uitdewilligen et al. Reference Uitdewilligen, Waller, Roe and Bollen2023).
The sequential task-process-cohesion structure underlying our framework integrates established team research (Badke-Schaub et al. Reference Badke-Schaub, Neumann, Lauche and Mohammed2007) with TMM development insights (Dong et al. Reference Dong, Kleinsmann and Deken2013), while expected outcomes derive from established relationships showing that higher TMM sharedness leads to improved coordination, creativity and performance (Jo Reference Jo2011; Santos et al. Reference Santos, Uitdewilligen and Passos2015). Our conceptual contribution lies in proposing specific mechanisms through which co-design practices can systematically influence these outcomes in interdisciplinary teams, particularly addressing the semantic barriers, heterogeneous composition and information-laden environments that present significant collaboration challenges in infovis contexts (Dörk et al. Reference Dörk, Müller, Stange, Herseni and Dittrich2020; Lamqaddam et al. Reference Lamqaddam, Vande Moere, Vanden Abeele, Brosens and Verbert2021; Morelli et al. Reference Morelli, Johansen, Pidcock, Harold, Pirani, Gomis, Lorenzoni, Haughey and Coventry2021).
7. Limitations and future directions
This study adopted an exploratory approach centered on TMMs, providing only one perspective among various approaches for studying group cognitive processes in interdisciplinary design activities. Although the verbal activity categorization system was meticulously applied, interpretive ambiguities emerged, reflecting the inherent subjectivity and possible biases in qualitative coding. While we adopted a mixed-method approach combining quantitative and qualitative methods to address these limitations, the restricted number of workshops and participants limited the generalizability of results. Thus, although the methodology yielded nuanced insights through qualitative analysis, a larger dataset would enable statistical methods approaches and more robust conclusions. We acknowledge that, even in a larger-scale study, because multiple interventions could be enacted within the same sessions and could interact with one another, observed differences may not be attributable to a single factor.
To address these limitations, future research should test the proposed procedural framework in larger-scale experimental settings, assessing whether interventions consistently enhance co-creation in infovis contexts. Incorporating multiple workshops with larger participant pools would also allow quantitative analyses to complement current qualitative depth, potentially revealing deeper correlations in group cognition. In line with this, future research could apply Markov chain analysis to a larger sample, integrating probabilistic analysis with protocol methods.
Yet, future studies could use the framework as a template to test different interventions in similar contextual scenarios and observe how code patterns and outcomes vary. Another viable path is to investigate whether the order of interventions influences team interaction, given that our findings suggest interdependencies among interventions that warrant further examination. Such expansions would validate the framework and refine understanding of TMM sharedness in interdisciplinary design while addressing temporal dynamics and contextual factors influencing collaborative outcomes.
8. Conclusions
This exploratory study investigated how facilitation-led co-design interventions may influence group coordination through the sharedness of TMMs in interdisciplinary design teams engaged in infovis work. A primary contribution is the proposed analytical framework, which renders team discussion visible by combining verbal protocol analysis with sequential transition matrices and charts. By translating theoretical propositions into observable interaction patterns, the framework provides empirical grounding for describing organizational mechanisms related to the dynamics observed within each group. The transition matrices supported the qualitative analysis that revealed communication patterns, thereby highlighting the value of a mixed-methods approach for advancing the understanding of collaborative cognition. In addition, this analytical approach enables researchers to examine the conversational data through multiple complementary lenses (e.g., qualitative excerpts, sequential structure and distributional patterns), supporting triangulation and richer interpretation of team communication.
The findings evidence that structured interventions foster distinct communication patterns compared to spontaneous coordination. In newly formed interdisciplinary teams, these facilitated techniques enhance TMM sharedness. The synergistic effects of the four interventions were especially evident, transforming common collaboration challenges, diverse vocabularies, competing priorities and varying technical preferences into improved team performance in creative tasks. Early interpersonal integration fostered cohesion and task-related TMM content, while evocative artifacts reduced communication barriers and stimulated novel ideas. Framing guides provided adaptable reference points for maintaining alignment, and guided reflexivity supported procedural strategies informed by prior evaluation and task planning.
The procedural framework emerging from this exploratory study provides initial guidance for practitioners aiming to improve collaboration in newly formed interdisciplinary teams, particularly in infovis projects. At the same time, it serves as a starting point for researchers interested in examining how systematic interventions can influence performance in similar contexts. Also, the verbal coding approach captured subtle yet critical shifts in how teams navigate uncertainty and coordinate actions in dynamic environments. This research advances the proposition of integrating transition matrices with protocol analysis, offering both a theoretical understanding of collaborative cognition and a practical framework for facilitating TMM sharedness. Overall, the findings demonstrate that formal interventions can fundamentally reshape the dynamics of interdisciplinary design team collaboration.
Appendices
Appendix A: Examples of terms coded using the categorization system for verbal activities in design teams
This section presents excerpts from the transcripts and illustrates how they were coded using the Categorization System for Verbal Activities in Design Teams. The examples include a variety of samples from both groups. The listing follows the structure outlined in Table 4 of the methods section and presents the information in the following order: (1) name of the code, (2) participant identifier, (3) group identification, (4) citation number from the transcript and (5) the excerpted speech segment. It is important to note that the following transcripts have not been edited and reflect the exact phrasing used by the participants.
A.1. TMM – TASK
Problem Definition | participant G2B | group 2.
113 – “I think visually it’s easier if we choose just one. Because that’s the thing, what information do I want to read – do I want to read by year or by state? No, not state – by category?”
New Solution Idea | participant G1A | group 1.
3 – “Well, the first is a ranking, right?… the most obvious would be a stair-step chart? I would make a graph comparing the two years.”
Solution Analysis | participant G1B | group 1.
135 – “It’s really just a comparison, decade [with] decade […] it’s about what the purpose is, someone unfamiliar with the topic should be able to look and see the comparison.”
Evaluation | participant G1A | group 1.
10 – “I think showing two graphs here really weakens it because it doesn’t compare ….”
Explanation | participant G1A | group 1.
50 – “Actually, the ones at the top (of the ranking) are the ones with the lowest numbers.”
Solution Decision | participant G2C | group 2.
241 – “So not here – here it’s two different colors that won’t match the ones in that other graph, so we won’t use shading differences, we’ll do this: whenever it’s 1990, it will be dark orange, and whenever it’s 2010, it will be dark blue.”
Communicates Information | participant G1A | group 1.
778 – “Ceará will be 62, then Maranhão 58, Paraíba 59, Pernambuco 62, Piauí 61, Rio Grande do Norte 60, and Sergipe 60… the blue is 1991.”
Idea Development | participant G1B | group 1.
76 – “I was thinking here about the Y-axis, the height being these horizontal bars, with Brazil and the states, and always split by color, when it’s 2010 and when it’s 1991. Like, the legend by color, and here a ranking.”
A.2. TMM – PROCESS
Planning | participant G1A | group 1.
179 – “Guys, let’s choose a key criterion. What’s most important to us? Comparing one state? Seeing how the state developed? Or comparing it to Brazil?”
Procedures | participant G2A | group 2.
191 – “There’s each state, right? Because either we use the increase in education level, and in 1991 it was here, and in 2010 it was there. If we use all the states, we’ll have too many lines (on the graph); if we use just one state, we can do it, we can cross it (with other indicators), we have to choose.”
Reflection | participant G2B | group 1.
531 – “I think we didn’t follow the priorities – we showed the Northeast versus Brazil relationship, but I think what stood out more was year-to-year, not between the states, the ranking, you know … but it’s fine, I think it turned out well … I think we kind of flipped our objective.”
A.3. TMM – COHESION
Help | participant G1B | group 1.
672 – “Like that, one graph over the other, a comparison between decades.”
Appreciation | participant G2C | group 2.
288 – “No worries, it’s great.”
Confirmation | participant G1C | group 1.
419 – “Yeah, exactly!”
Rejection | participant G1C | group 1.
123 – “Actually, no.”
Question | participant G2C | group 2.
98 – “Are you thinking of crossing them? Like doing a calculation between the data so the graph shows a formula? What kind of calculation did you have in mind?”
Appendix B: Workshop protocol (guidelines for the brainsketching workshops)
B.1. People present in the workshop
Facilitator: Responsible for explaining the structure of the workshop, presenting the design task, managing time and answering questions related to the workshop throughout its duration. In this study, one of the researchers will assume the role of facilitator. However, to avoid influencing the dynamics of the activity, interactions between participants and the researcher will be limited to the protocols described at the beginning of this section and other guidelines outlined in this script.
Participants: Responsible for performing the task.
Participant profile: One designer with experience in information visualization and two professionals, if possible, from different fields, who use data in their daily work will be selected.
Selection process: Participants will be volunteers who express interest in taking part in the process. Recruitment will occur through the researcher’s network, the academic advisor and other faculty members at FAU-USP. The selection will aim to balance the groups based on participants’ professional experience.
B.2. Environment preparation, materials and equipment
Environment: A room with a table large enough to accommodate the activity and three chairs for the participants. A restroom must be available at all times.
Food and beverages: A nearby table will offer bottled water, juice, coffee and cheese bread. These will be available throughout the session.
Materials: Large sheets of brown paper, poster board, or similar material (approximately 80 × 120 cm each), and sticky notes for team members to jot down ideas. There will be no limit to the quantity of materials participants can use. On the table, colored pens and pencils will be available for sketching and proposal creation.
A camera mounted on a tripod will be positioned in front of the table to record audio and video of the entire process (see Figure B1). The camera will be adjusted to capture both drawings and participants’ verbal interactions.
Each participant will receive a printed A4 version of the design brief.
Evocative artifacts (visualization references): The facilitated group will receive a set of printed cards featuring examples of visualizations. This material will remain available throughout the workshop. The unfacilitated group will not have access to this material.
Schematic illustration of the camera’s positioning relative to the table and its capture angle.
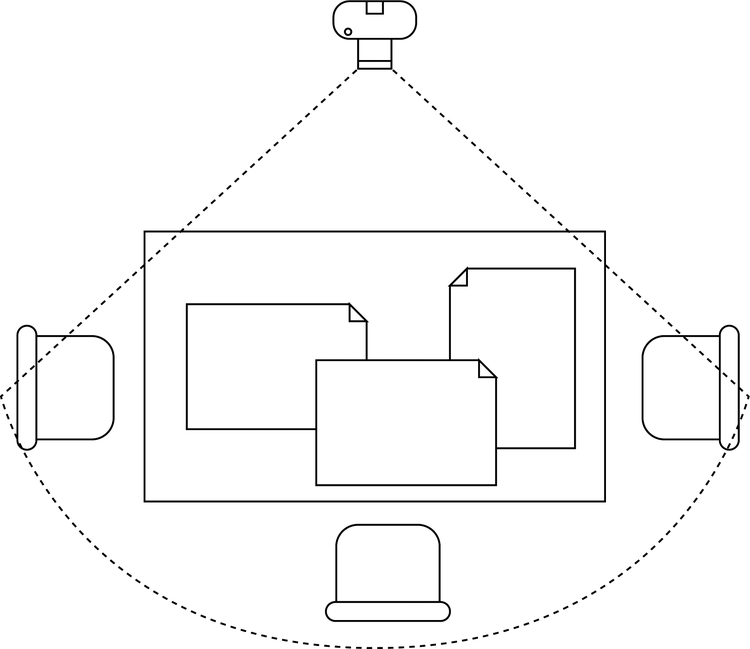
B.3. Beginning of the workshop
Participants will enter the room and be guided by the facilitator to the table.
The researcher will be present in the room but will not interact with or interfere in the process.
The facilitator will introduce the activity’s scope, its duration and the task objectives (to design an information visualization based on a data set). Lastly, participants will be informed that they will have 10 minutes at the end of the session to present their results.
Start of activity.
Facilitated condition: Before handing out the task brief, the facilitator will conduct a 15-minute integrative activity (icebreaker). The facilitator will ask each participant to answer two questions in conversation format: (1) What is your name and age? (2) What is your profession and what do you like most about it? After these brief introductions, participants will draw cards placed on the table and respond to the questions printed on them in a roundtable discussion format.
Unfacilitated condition: This group will proceed directly to the task briefing. After reading it, the facilitator will indicate that they may begin the activity.
Next, participants will receive the design brief for the information visualization task. This document includes a sample data set, task context and objectives. The facilitator will read through the document along with the team members.
After the briefing, only the unfacilitated group will receive printed material containing reference infovis solutions grouped by function.
Problem framing – Facilitated group only: After the icebreaker and briefing, the facilitator will introduce this activity and distribute the relevant sheets. The group will be asked to collectively respond to prompts such as “I want to show…” or “I want to discover…” based on the data in the brief. The facilitator may clarify that these prompts are meant to guide exploration, for example, “I want to discover how the municipality with the lowest HDI performs across all dimensions.” The group will write down their answers and select between one and three focus points. The facilitator may indicate that this framing can be revised if needed during the process.
After this explanation, the facilitator will inform participants that they may begin the task.
Guided reflexivity: During the session, the facilitated group will engage in two moments of guided reflection – after 1 hour and again at 1 hour and 40 minutes. In each, the facilitator will prompt the group to reflect on their progress and how they plan to proceed.
Unfacilitated group: No formal facilitator intervention will occur during the activity.
With 20 min remaining, the facilitator will notify participants of the upcoming presentations, which will take place in the final 10 minutes of the session.
At the 2-hour mark, each group will present their proposals.
B.4. Conclusion of the workshop
After the presentations, the facilitator will ask the group about their experience with the process.
After this conversation, the recording will be paused.
The sketches and visual artifacts produced by participants will be collected for documentation purposes.
Appendix C: Design brief – Task scope provided to groups during the brainsketching workshops
C.1. Project objective
To make the information from the Atlas of Human Development in Brazil accessible through data visualizations that facilitate understanding and access to the current databases. In this initial phase, the proposal adopts an exploratory approach to map possible solution pathways for visually representing the database information.
The graphics will be part of a digital platform. At this stage, there is no need to worry about the interface, layout or site structure. However, if any ideas emerge regarding possible interactions with the charts (filters, menus, etc.), these elements can be included in the sketches of the proposed solutions.
Feel free to suggest comparisons and intersections between the dimensions and categories of the data where applicable. In this briefing, they are separated for easier reading due to the short time available, but you may choose how to construct the narratives and possibilities for interpreting this information.
C.2. Expected deliverable
As stated above, this is an initial phase of the project. However, by the end of the activity, the team must deliver a solution that includes one or more visualizations.
It is not mandatory to use all the data dimensions presented in this briefing – you may choose which tables to work with. The deliverable may consist of one or more sketches/drawings outlining your proposed solutions. As this is a low-fidelity prototype, textual annotations can be added to the drawings to indicate the ideas and informational content of the proposed solutions.
C.3. Target audience of the project
We aim to democratize access to Human Development Index (HDI) information. Previous research showed that the report was difficult for non-experts to read. For this new version, our primary audience consists of students, early-career researchers from various knowledge areas, journalists and professionals working in public policy development. Below are two user profiles summarizing the characteristics of the future users of the visualization tool:
Profile 1
Table C1. Long description
From the top row downward, the left column displays characteristic labels and the right column provides details. Name is Mariana de Oliveira. Age is 28 years. Gender is Female. Profession is Social Sciences Researcher. Education Level is Bachelor’s in Sociology, beginning Master’s. Main Objective is to conduct Master’s research using H D I data. Challenges include limited experience with data and the need to learn to interpret information and correlate it with qualitative data sources for her research. Motivations are to contribute to the advancement of social science research and positively impact her community.
Profile 2
Table C2. Long description
The table has two columns. The left column lists characteristics, the right column provides details. From top to bottom: Name is Pedro Oliveira. Age is 32 years. Gender is male. Profession is journalist. Education level is bachelor’s in journalism. Main objective is to develop journalistic stories on H D I index changes over time. Challenges are to understand the complexity of H D I data, identify relevant insights that could lead to compelling stories, and transform numbers into comprehensible narratives for the general public. Motivations are to inform the public about social issues and demographic changes in the country, and use data to support his reporting.
C.4. Database
You are receiving a sample from the database focused on the Northeast region of Brazil. The structure is the same for other regions. Thus, a visualization based on one dimension of the Northeast can be adapted for the remaining regions.
Due to time constraints during the activity, it is not mandatory to use all data dimensions or samples provided in this briefing. The group may choose which dimensions to explore.
Data Source: Human Development in Brazil’s Macroregions.
Authors: UNDP, IPEA, FJP.
ISBN: 978-85-88201-31-6.
Edition Year: 2016.
C.5. Table index included in this scope
1. Ranking of Northeastern states in Brazil according to HDI in 1991, 2000 and 2010.
2. Longevity.
3. Education.
4. Income.
-
1. Ranking of Northeastern States According to HDI (1991, 2000 and 2010)
Table C3. Long description
From the top, Brazil is listed with HDI values of 0.50 in 1991 and 0.73 in 2010. Each Northeastern state follows, with two rows per state: the first row shows the ranking (ordinal number with degree symbol) for 1991 and 2010, and the second row shows the HDI value in parentheses for each year. Alagoas ranked 24th in 1991 (0.37) and 27th in 2010 (0.63). Bahia ranked 22nd in both years, with HDI rising from 0.39 to 0.66. Ceará improved from 20th (0.40) to 17th (0.68). Maranhão moved from 27th (0.36) to 26th (0.63). Paraíba remained 23rd, HDI increasing from 0.38 to 0.65. Pernambuco shifted from 14th (0.44) to 19th (0.67). Piauí moved from 26th (0.36) to 24th (0.65). Rio Grande do Norte stayed 16th, HDI rising from 0.43 to 0.68. Sergipe changed from 18th (0.41) to 20th (0.66). All states show higher HDI values in 2010 compared to 1991, indicating improvement.
-
2. Longevity
Table C4. Long description
The table has five columns: States, H D I Longevity 1991, H D I Longevity 2010, Life Expectancy at Birth 1991, and Life Expectancy at Birth 2010. From top to bottom, the rows are: Brazil with H D I Longevity 0.66 in 1991 and 0.81 in 2010, Life Expectancy 64.73 in 1991 and 73.94 in 2010; Alagoas with 0.55 and 0.75, 58.10 and 70.32; Bahia with 0.58 and 0.78, 59.94 and 71.97; Ceará with 0.61 and 0.79, 61.76 and 72.60; Maranhão with 0.55 and 0.75, 58.04 and 70.40; Paraíba with 0.56 and 0.78, 58.88 and 72.00; Pernambuco with 0.61 and 0.78, 62.04 and 72.32; Piauí with 0.59 and 0.77, 60.71 and 71.62; Rio Grande do Norte with 0.59 and 0.79, 60.48 and 72.52; Sergipe with 0.58 and 0.78, 59.83 and 71.84. All states show increases in both H D I Longevity and Life Expectancy at Birth from 1991 to 2010.
-
3. Education
Table C5. Long description
The table has seven columns: States, H D I dash Education for 1991 and 2010, School Attendance Subindex for 1991 and 2010, Educational Attainment Subindex for 1991 and 2010. The first row lists Brazil with H D I dash Education values of 0.27 in 1991 and 0.63 in 2010, School Attendance Subindex of 0.26 in 1991 and 0.68 in 2010, Educational Attainment Subindex of 0.30 in 1991 and 0.54 in 2010. The following rows present data for Alagoas, Bahia, Ceará, Maranhão, Paraíba, Pernambuco, Piauí, Rio Grande do Norte, and Sergipe. For example, Alagoas shows H D I dash Education of 0.17 in 1991 and 0.52 in 2010, School Attendance Subindex of 0.16 in 1991 and 0.58 in 2010, Educational Attainment Subindex of 0.19 in 1991 and 0.40 in 2010. All states show increases in all indices from 1991 to 2010, with Brazil having the highest values overall. The lowest 1991 values are in Piauí and Maranhão, while the highest 2010 values are in Brazil and Ceará.
-
4. Income
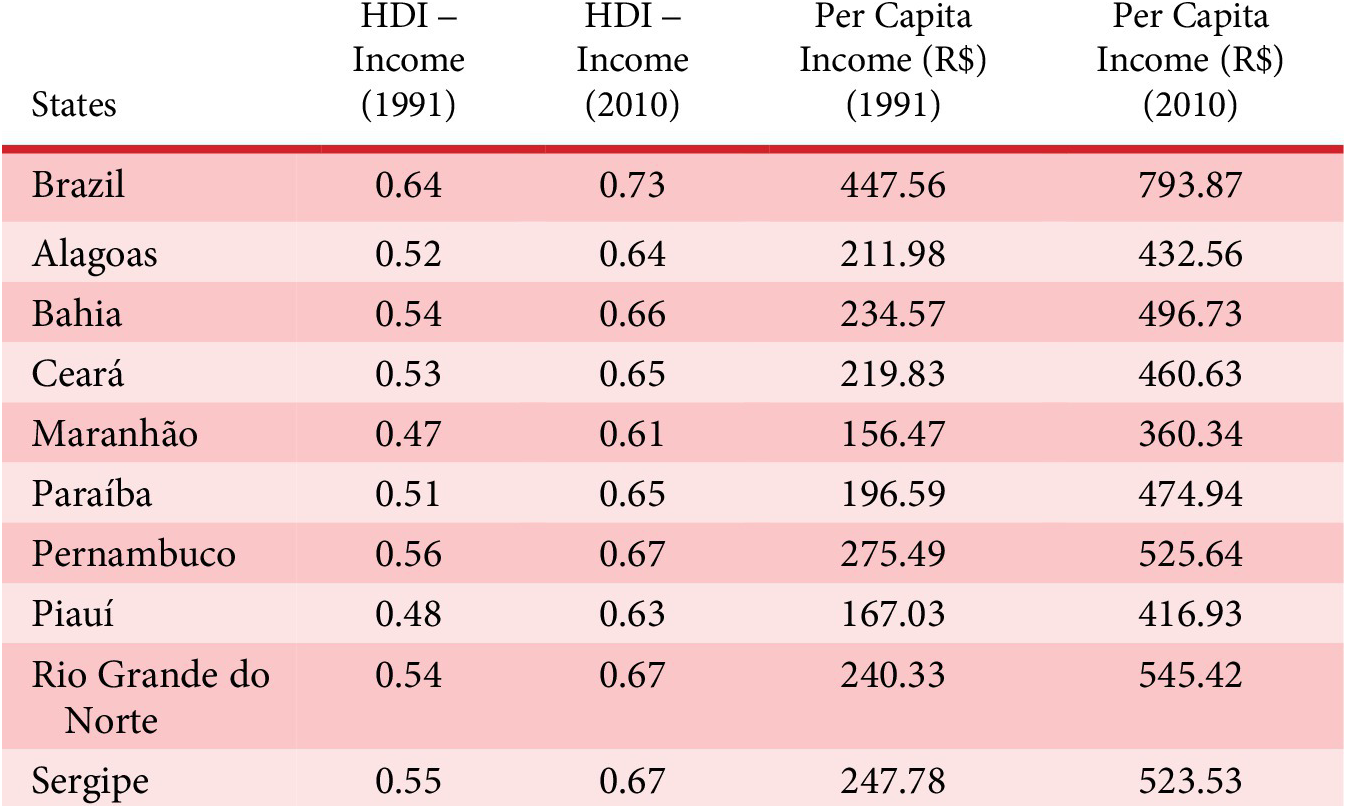
Table C6. Long description
The table has five columns: States, H D I Income 1991, H D I Income 2010, Per Capita Income in R dollar 1991, and Per Capita Income in R dollar 2010. From top to bottom: Brazil shows H D I Income rising from 0.64 to 0.73 and Per Capita Income from 447.56 to 793.87. Alagoas increases from 0.52 to 0.64 and 211.98 to 432.56. Bahia rises from 0.54 to 0.66 and 234.57 to 496.73. Ceara from 0.53 to 0.65 and 219.83 to 460.63. Maranhao from 0.47 to 0.61 and 156.47 to 360.34. Paraiba from 0.51 to 0.65 and 196.59 to 474.94. Pernambuco from 0.56 to 0.67 and 275.49 to 525.64. Piaui from 0.48 to 0.63 and 167.03 to 416.93. Rio Grande do Norte from 0.54 to 0.67 and 240.33 to 545.42. Sergipe from 0.55 to 0.67 and 247.78 to 523.53. All states and Brazil show increases in both H D I Income and Per Capita Income between 1991 and 2010.
Appendix D: Samples of the developed solutions
This appendix presents the outcomes of the brainsketching workshops conducted with the facilitated group and the unfacilitated group. In total, each group presented three information visualization solutions. The solutions are displayed first in their entirety on the teams’ worksheets and subsequently through detailed excerpts of each specific proposal. In doing so, we also aim to present part of the teams’ working process in the generation of ideas and solutions.
The sequence of images represents the solutions developed by the facilitated group.
The figures show two infovis sketches from the facilitated group. The sketch on the left proposes a visualization of the ranking of the overall IDHM indicator for the Northeast region of Brazil in comparison to the national ranking.
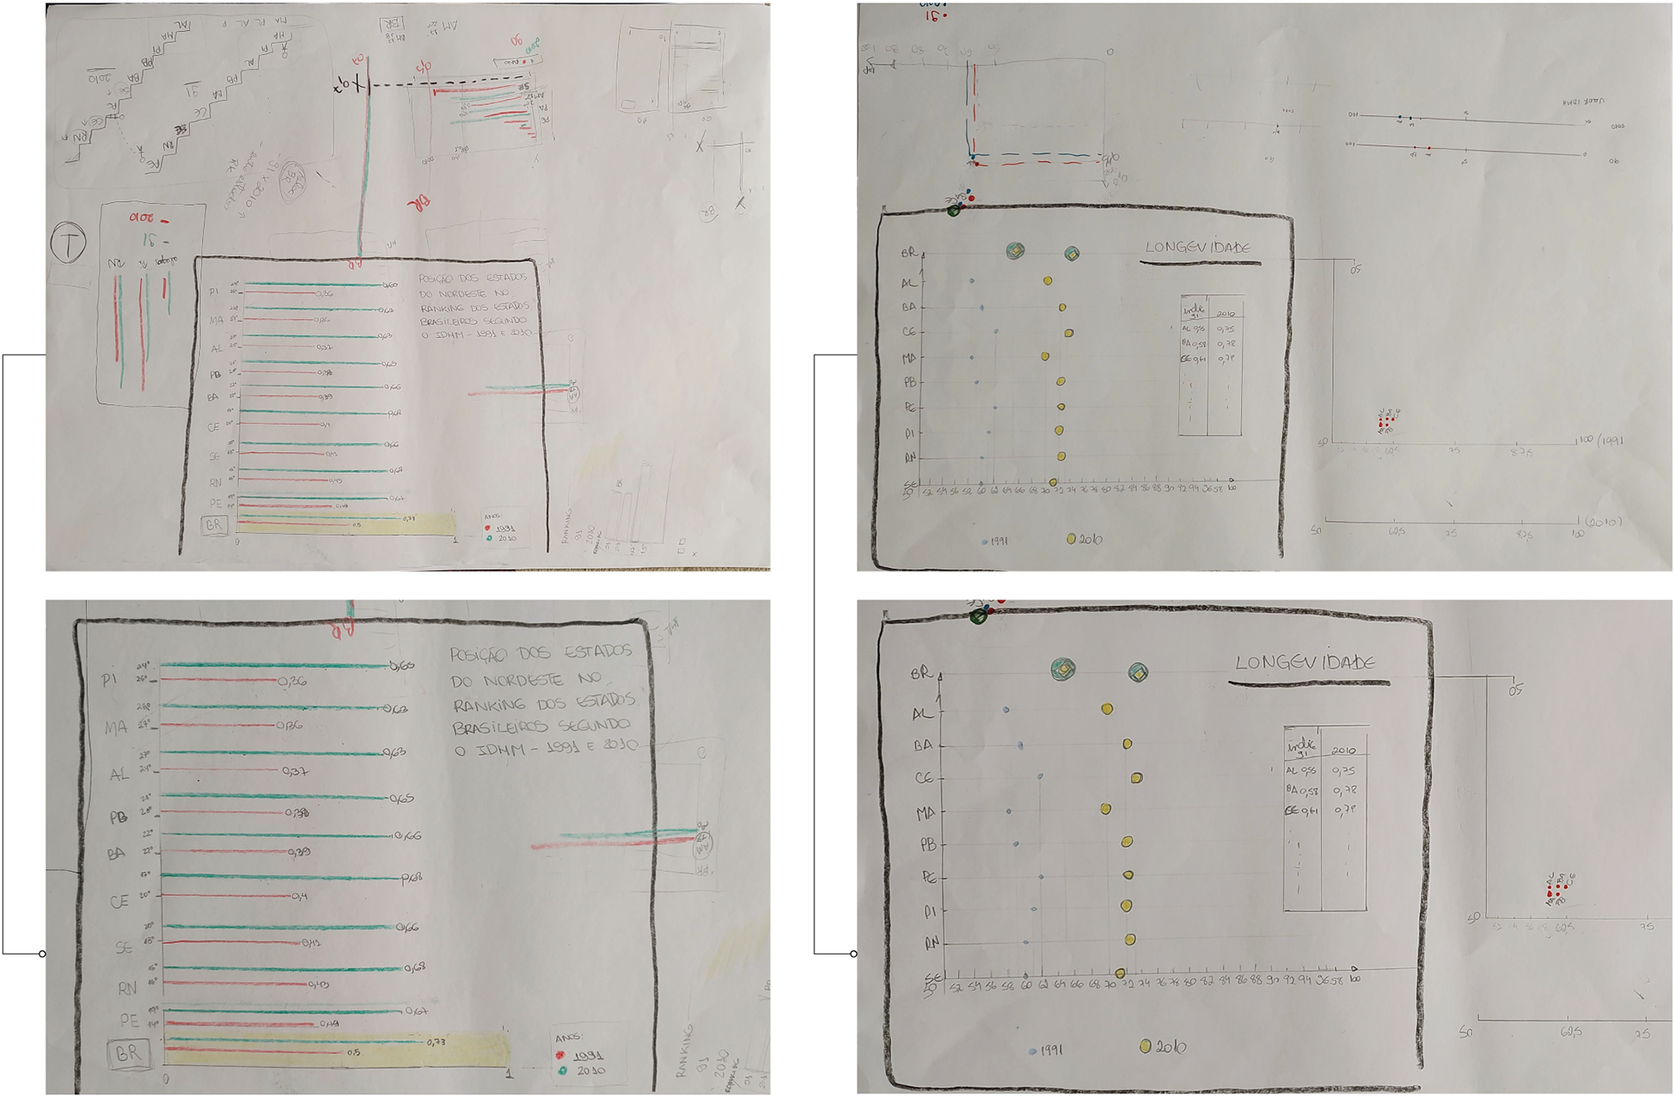
Figure D1. Long description
Top left panel: Contains a horizontal bar chart with states listed vertically on the y-axis and IDHM values on the x-axis. Each state has two bars, one for 1991 and one for 2010, color-coded. The bottom bar is labeled BR for Brazil. A legend at the bottom right distinguishes years. Top right panel: Contains a scatter plot titled Longevidade with states on the y-axis and longevity values on the x-axis. Data points for 1991 and 2010 are marked with different colors. A small table at the right lists values for selected states. Bottom left panel: Repeats the horizontal bar chart with clearer state labels (PI, MA, AL, BA, PB, SE, CE, RN, PE, BR) and corresponding IDHM values for 1991 and 2010. The legend and color scheme are consistent with the top left. Bottom right panel: Repeats the scatter plot for longevity, with states on the y-axis and longevity values on the x-axis. Data points for 1991 and 2010 are shown, and a table at the right lists values for selected states. All panels use hand-drawn lines and annotations, with emphasis on comparing 1991 and 2010 data for Northeast states.
This figure represents the facilitated group’s proposal to visualize the IDHM Education index by comparing its variation across two different decades, 1990 and 2010.
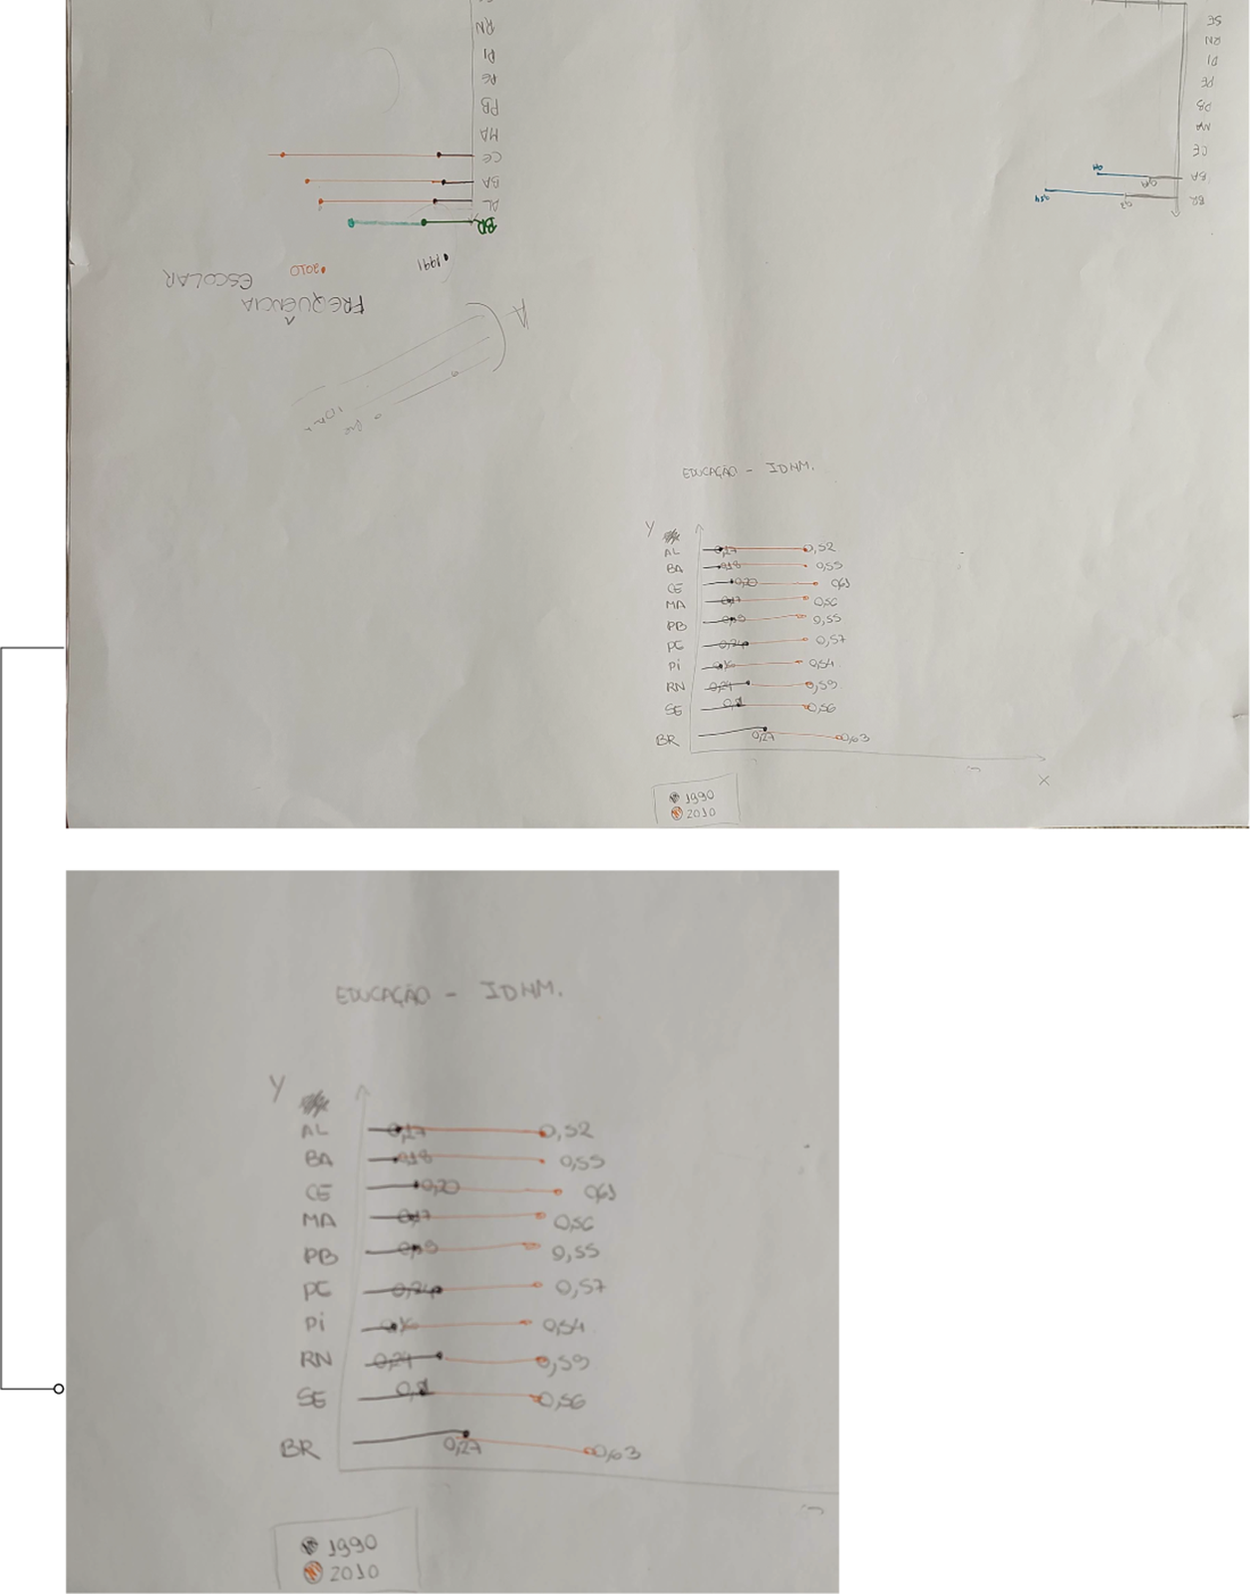
Figure D2. Long description
At the top, the y-axis lists states: A L, B A, C E, M A, P B, P E, P I, R N, S E, and B R for Brazil. The x-axis shows IDHM Education index values from 0.2 to 0.6. For each state, a black dot at left marks 1990, an orange dot at right marks 2010, connected by a horizontal line. Data values: A L 0.32 to 0.52, B A 0.32 to 0.53, C E 0.32 to 0.51, M A 0.30 to 0.50, P B 0.33 to 0.55, P E 0.34 to 0.54, P I 0.31 to 0.51, R N 0.34 to 0.59, S E 0.31 to 0.56, B R 0.27 to 0.63. All states and Brazil show an increase in the index from 1990 to 2010. The legend at the bottom indicates black for 1990 and orange for 2010.
Next, the following images are the samples from the unfacilitated group.
The image presents the team’s proposed visualization of the schooling and school attendance subindices.
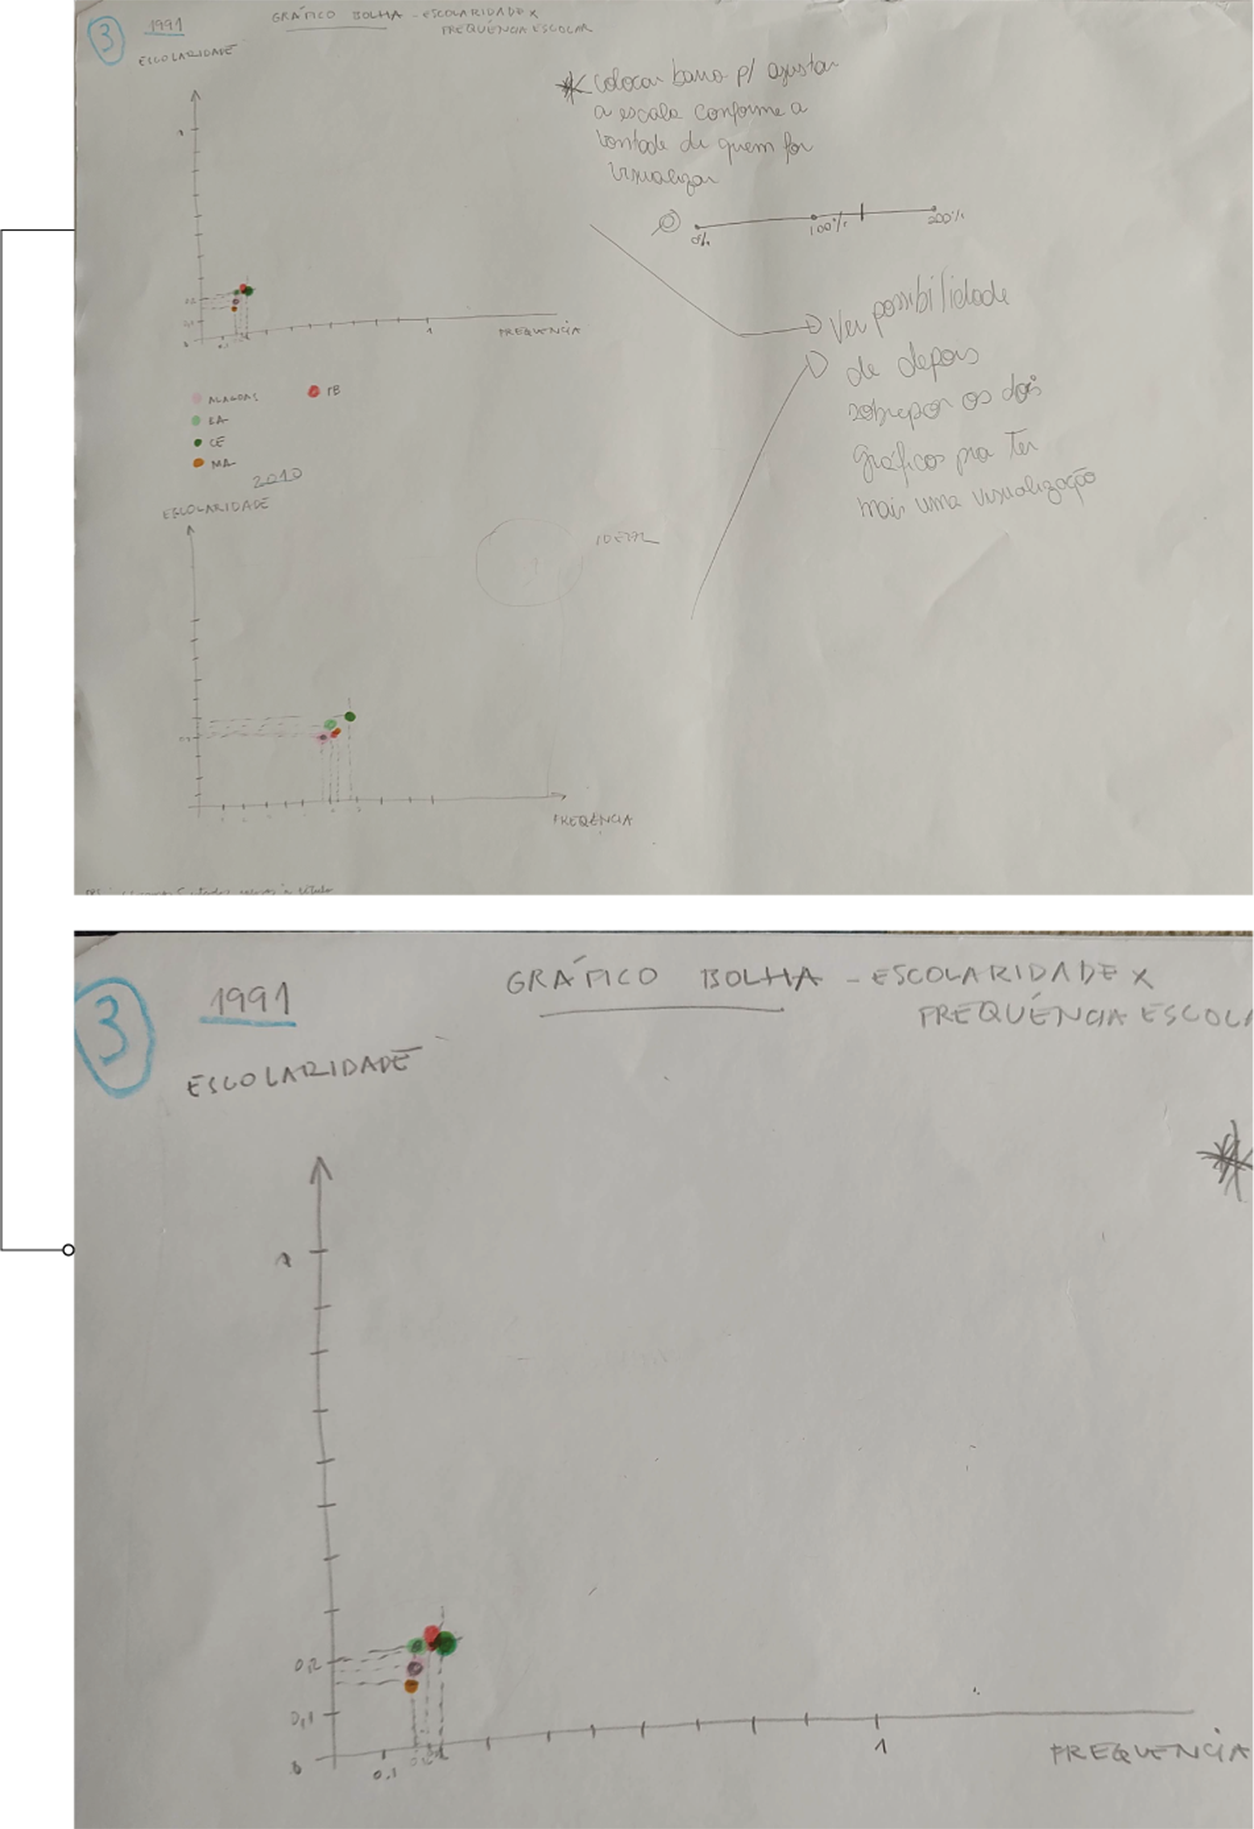
Figure D3. Long description
The top panel contains two smaller bubble charts on the left, each with vertical axes labeled ‘Escolaridade’ and horizontal axes labeled ‘Frequência.’ Colored bubbles (red, green, orange, yellow) represent different groups, with a legend indicating ‘Alunas,’ ‘L E,’ ‘L C,’ and ‘T B.’ Handwritten notes on the right provide instructions for adjusting the scale and highlight the possibility of overlapping groups. The bottom panel shows a larger bubble chart for 1991, with the same axes and color-coded bubbles clustered near the origin. The legend and axis labels are repeated, and the data points are concentrated in the lower left quadrant.
Finally, the following image contains two visualization proposals from the unfacilitated team. The first is a map representing the variation of the education indicators in the Northeast region of Brazil. The second, and third overall solution, is a stacked chart proposing to display the variation of the IDHM across two decades.
The unfacilitated team’s proposals for visualizing the education indicators and the variation over the decades.
Figure D4. Long description
The collage consists of three vertically stacked panels, each showing hand-drawn sketches and notes for visualizing education data. In the top panel, at the left, there is a rough outline map of Brazil with regions labeled and shaded, annotated with ‘IDHM 91/2010’ and ‘mapa de calor.’ To the right, there are sketches of bar charts, one with horizontal bars labeled ‘IDHM,’ ‘91,’ and ‘2010,’ with colored segments and frequency notations. Further right, there is a line graph with two curves labeled ‘91’ and ‘2010,’ showing variation over time. The middle panel repeats the map of Brazil on the left, again labeled ‘IDHM 91/2010’ and ‘mapa de calor,’ with similar annotations. The right side contains a horizontal bar chart with colored segments and a line graph with two lines labeled ‘91’ and ‘2010.’ The bottom panel focuses on the bar chart, showing five horizontal bars with colored segments, labeled ‘IDHM,’ ‘91,’ and ‘2010,’ with frequency notations and a line graph to the right. Throughout, there are handwritten notes in Portuguese discussing color mapping, comparison, and growth, as well as arrows connecting elements and additional small sketches of axes and legends.
Appendix E: Transition matrices
-
1. Facilitated group count.
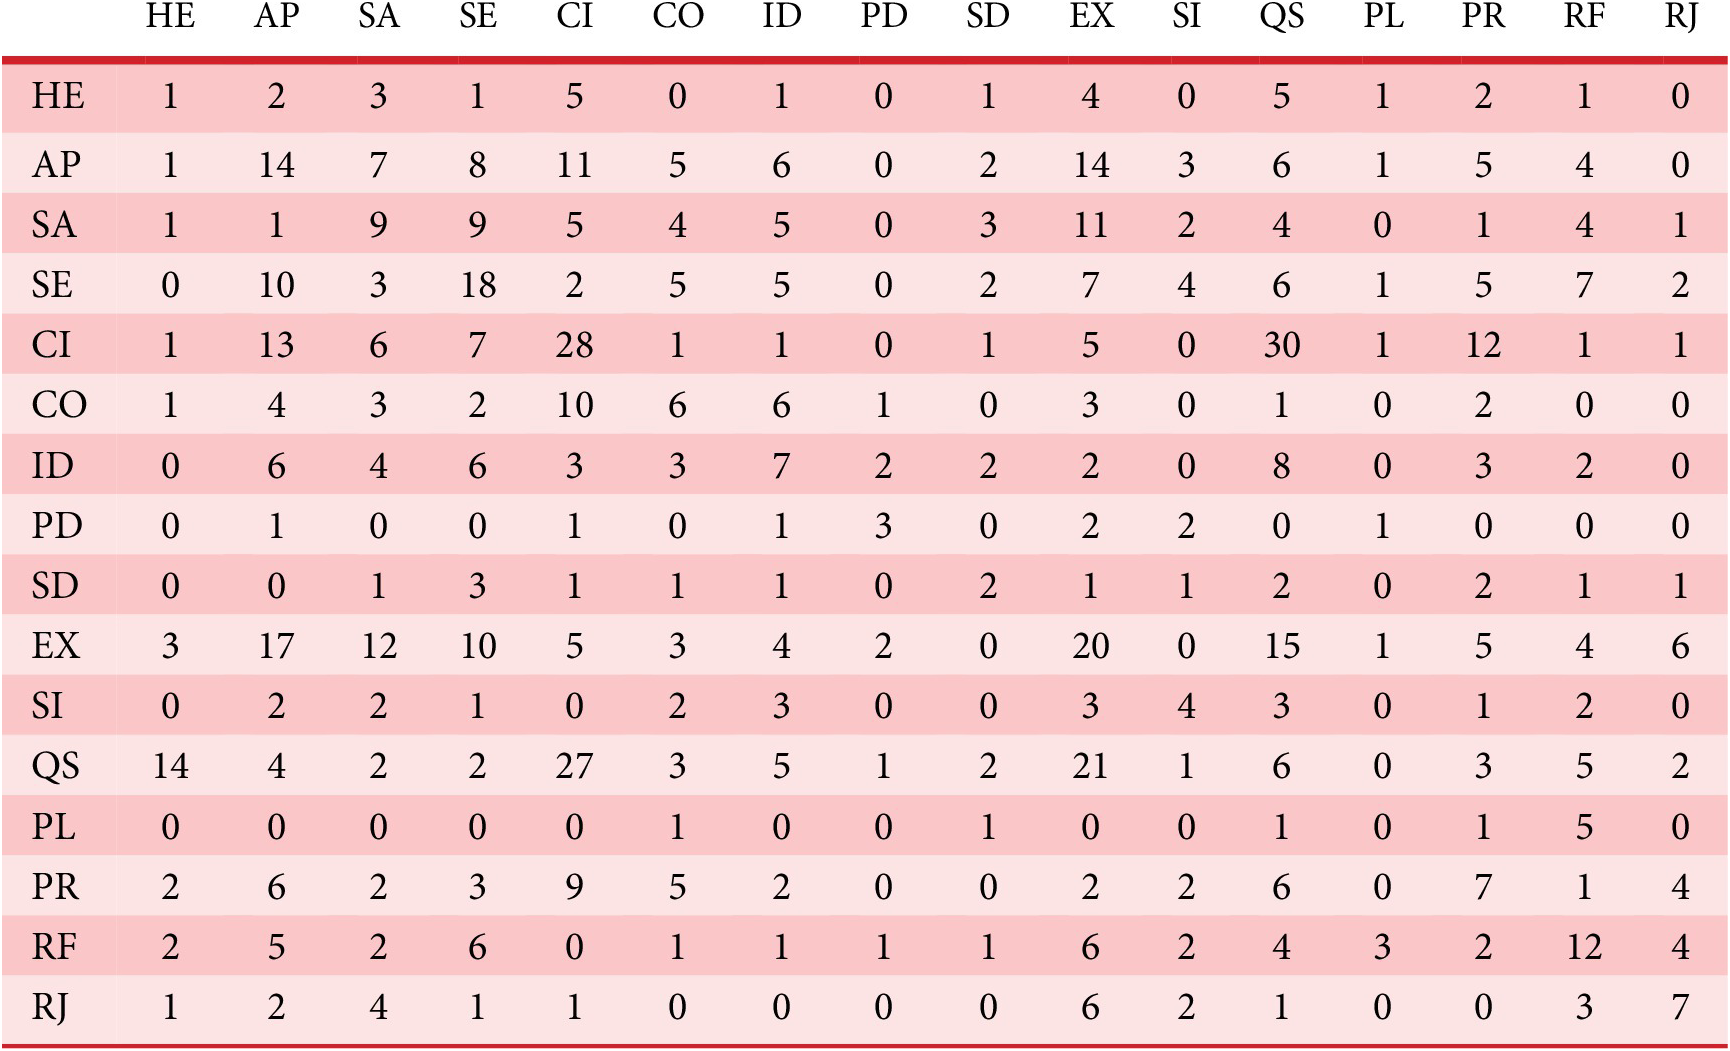
Table E1. Long description
The table displays a 16 by 16 symmetric matrix with both rows and columns labeled H E, A P, S A, S E, C I, C O, I D, P D, S D, E X, S I, Q S, P L, P R, R F, and R J. Each cell at the intersection of a row and column contains a count value. Diagonal cells represent self-pairings and are generally the highest in each row, such as H E to H E equals 1, A P to A P equals 14, S A to S A equals 9, S E to S E equals 18, and C I to C I equals 28. Off-diagonal values show pairwise counts, for example, H E to A P is 2, H E to S A is 3, H E to C I is 5, A P to S E is 8, and C I to Q S is 30. Many cells have zeros, especially in the lower right and for less frequent pairings. The matrix is symmetric, so the value for row H E and column A P matches that for row A P and column H E. The highest off-diagonal value is C I to Q S at 30. The table provides a comprehensive overview of pairwise relationships among the 16 categories.
-
2. Unfacilitated group count.
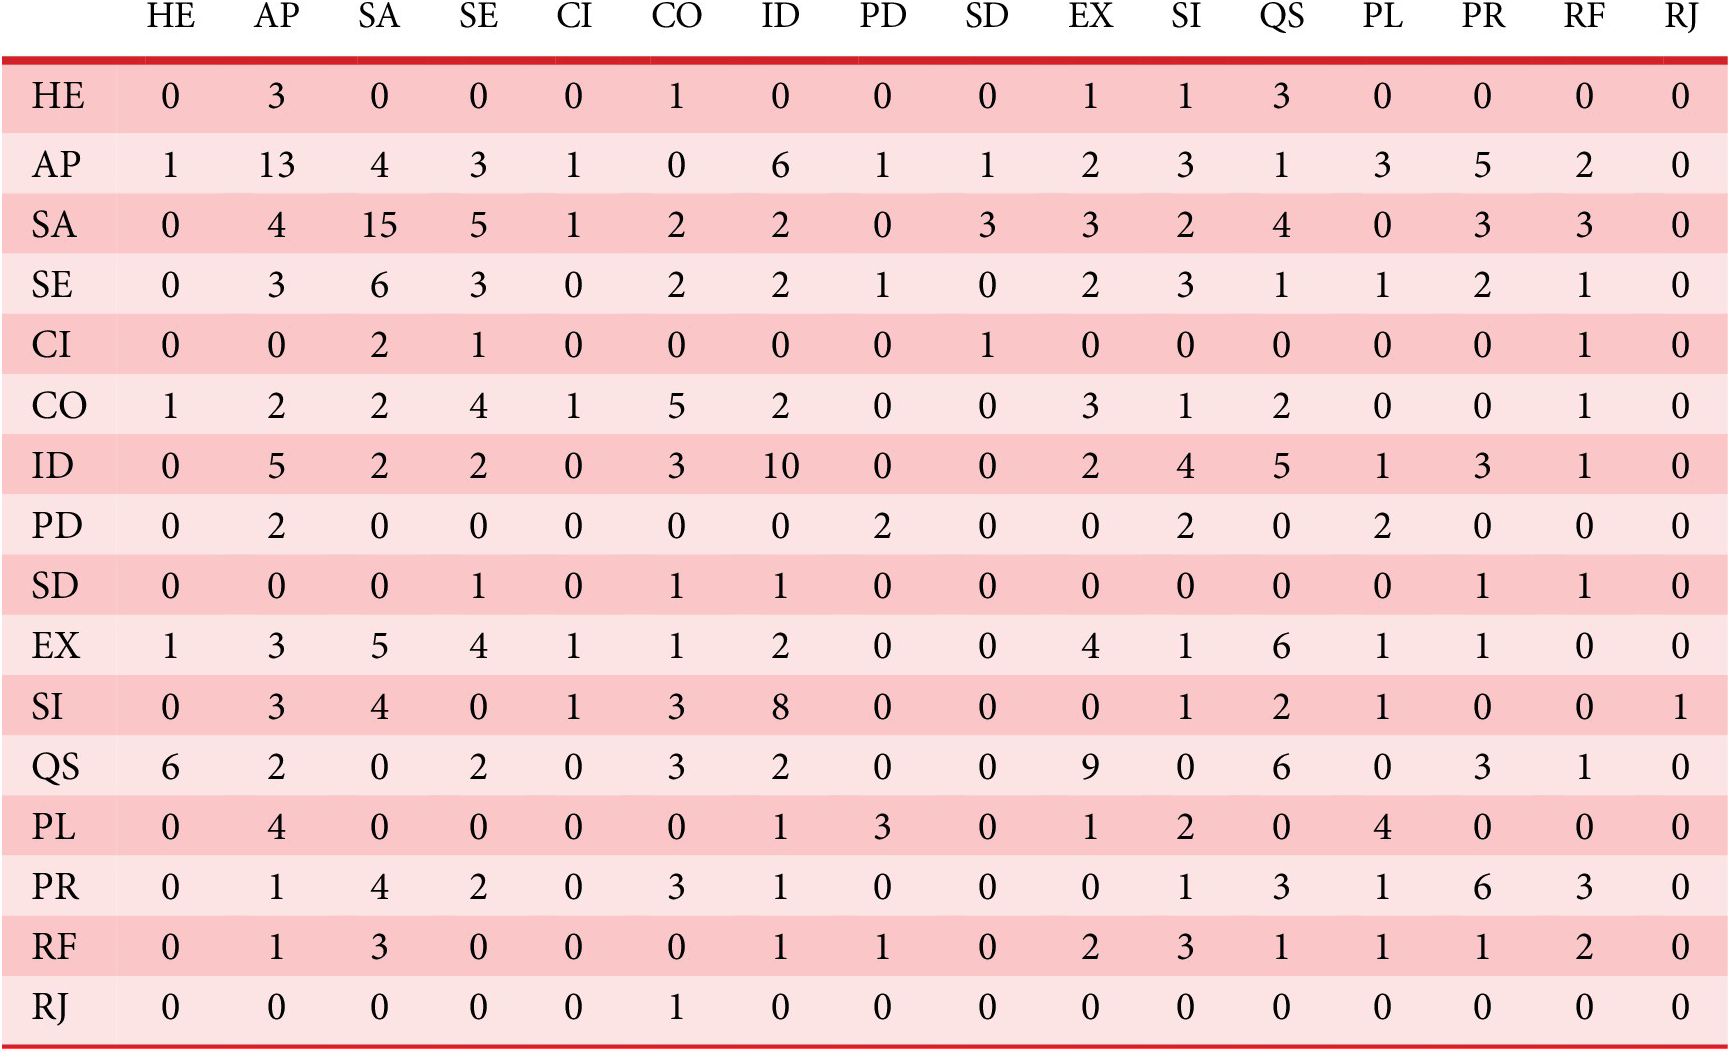
Table E2. Long description
The table consists of sixteen categories labeled HE, AP, SA, SE, CI, CO, ID, PD, SD, EX, SI, QS, PL, PR, RF, RJ. The header row lists these categories left to right. Each subsequent row begins with a category label and displays counts for interactions with all other categories. The AP row has the highest values, including 13 for AP/AP, 6 for AP/ID, 5 for AP/RF, and 4 for AP/SA. SA also shows high values, notably 15 for SA/SA, 5 for SA/EX, and 5 for SA/QS. Most diagonal cells (category with itself) have higher values than off-diagonal cells. HE has low counts, with 3 for HE/AP and 3 for HE/QS. Several cells are zero, especially for CI, SD, and RJ. The table highlights strong intra-category interactions for AP and SA, and weaker or absent interactions for CI, SD, and RJ.
-
3. Percentage of observed transitions between verbal codes in the facilitated group.
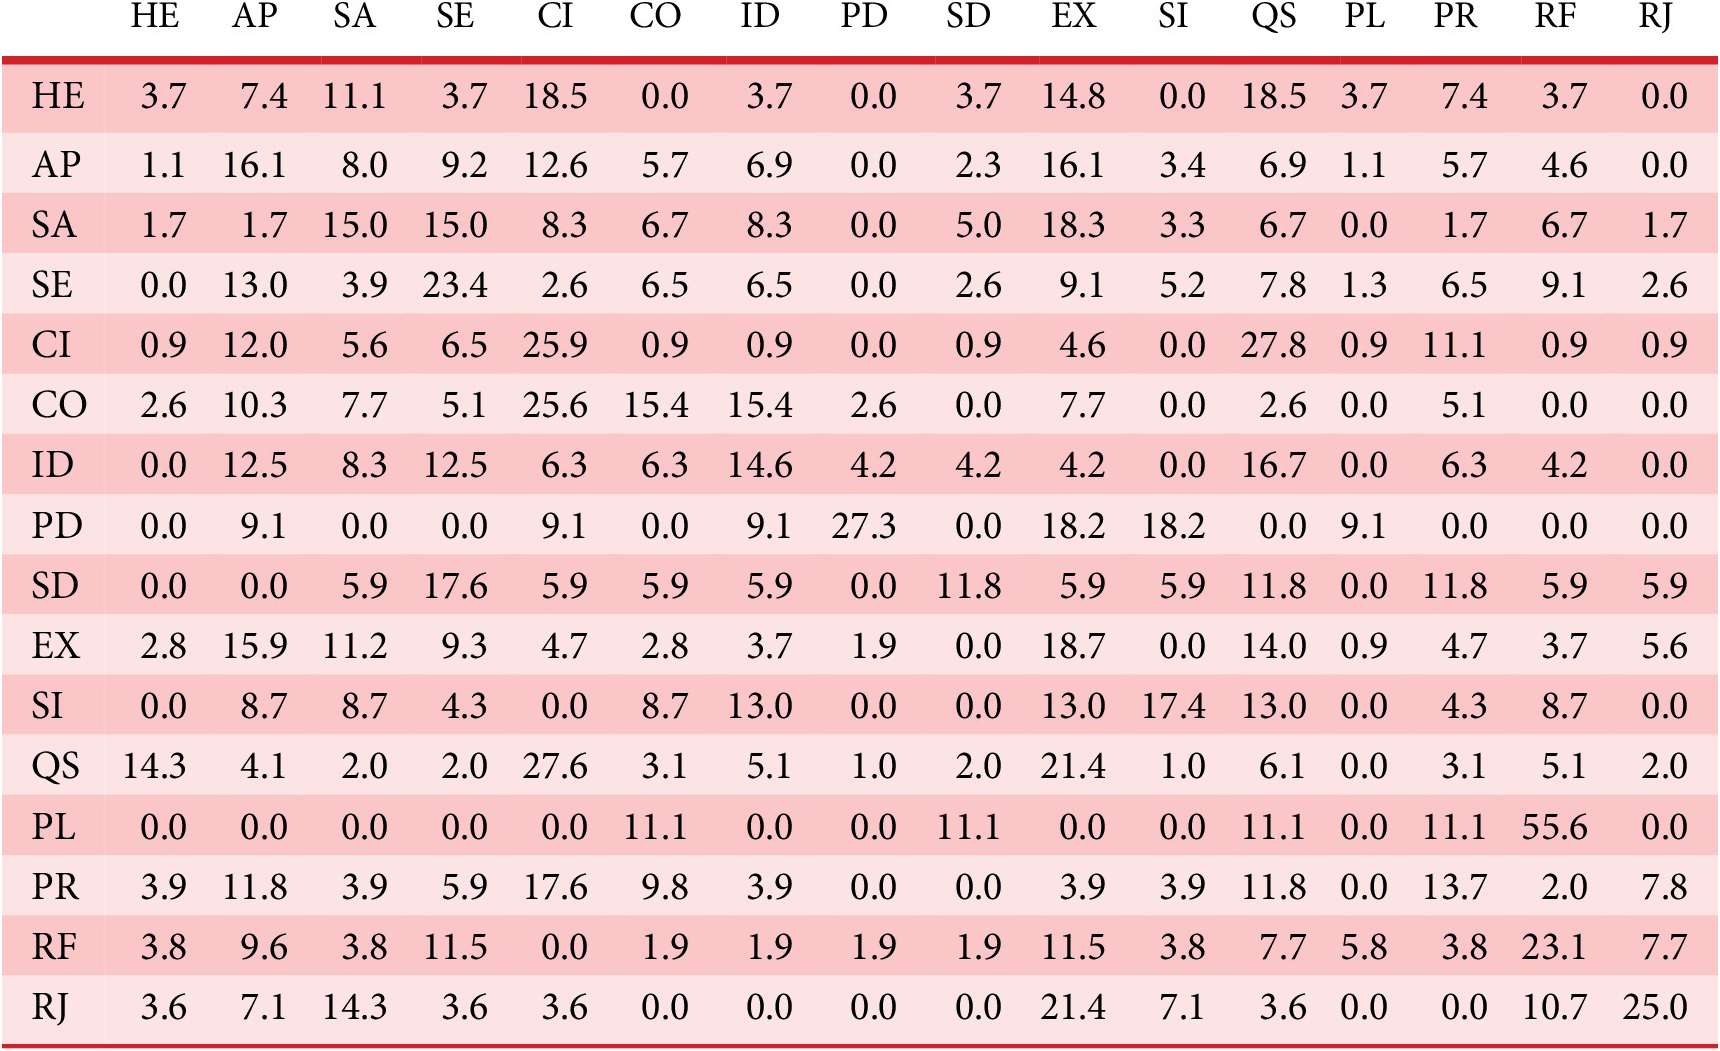
Table E3. Long description
The table consists of sixteen rows and sixteen columns. Each row and column is labeled with two-letter abbreviations: H E, A P, S A, S E, C I, C O, I D, P D, S D, E X, S I, Q S, P L, P R, R F, R J. Each cell contains a percentage value. Starting from the top row labeled H E, values range from 0.0 to 18.5, with highest values in C I and Q S columns. The second row, A P, shows a peak of 16.1 in A P and E X columns. The third row, S A, has highest values in S A, S E, and E X columns. The fourth row, S E, peaks at 23.4 in S E column. The fifth row, C I, has a maximum of 27.8 in Q S column. The sixth row, C O, shows 25.6 in C I and 15.4 in C O and I D columns. The seventh row, I D, peaks at 16.7 in Q S and 14.6 in I D. The eighth row, P D, has 27.3 in P D and 18.2 in E X and S I. The ninth row, S D, peaks at 17.6 in S E and 11.8 in S D, E X, and R F. The tenth row, E X, has 18.7 in E X and 15.9 in A P. The eleventh row, S I, peaks at 17.4 in S I and 13.0 in E X, S I, and Q S. The twelfth row, Q S, has a maximum of 27.6 in C I and 21.4 in E X. The thirteenth row, P L, peaks at 55.6 in P L and 11.1 in S D, R F, and R J. The fourteenth row, P R, has 17.6 in C I and 13.7 in R F. The fifteenth row, R F, peaks at 23.1 in R J and 11.5 in S E and E X. The sixteenth row, R J, has 25.0 in R J and 21.4 in E X. Most rows show their highest values in their own column or in Q S, C I, or P L columns. Zero values are distributed throughout, especially in P D, S D, P L, and R J rows.
-
4. Percentage of observed transitions between verbal codes in the unfacilitated group.
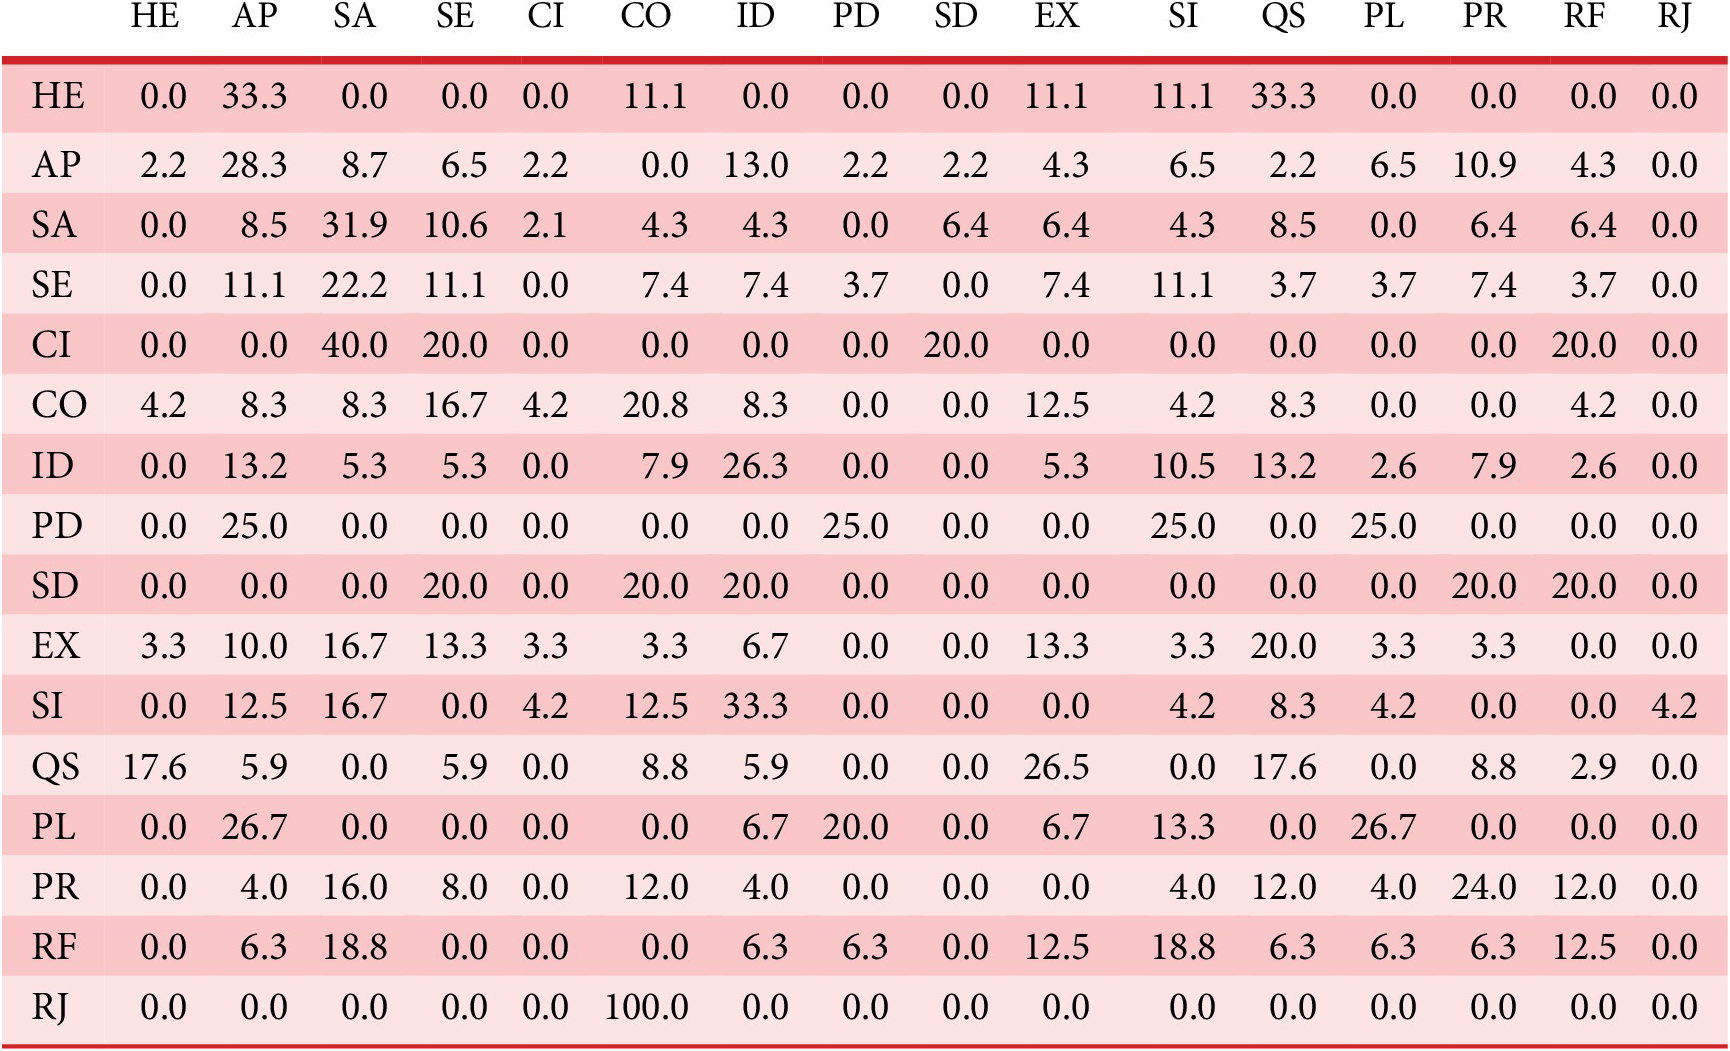
Table E4. Long description
The table is a 16 by 16 square matrix with region codes as both row and column headers: H E, A P, S A, S E, C I, C O, I D, P D, S D, E X, S I, Q S, P L, P R, R F, R J. Each cell shows the percentage overlap from the row region to the column region. Diagonal cells represent self-overlap and are generally the highest, such as S A to S A at 31.9 percent, C I to C I at 40.0 percent, and R J to C O at 100.0 percent. Off-diagonal overlaps include H E to A P at 33.3 percent, H E to Q S at 33.3 percent, and A P to I D at 13.0 percent. Several regions have zero overlap with others, especially in the lower right of the matrix. Notable off-diagonal values include C O to C O at 20.8 percent, I D to I D at 26.3 percent, and S D to S E, C O, and I D at 20.0 percent each. The matrix highlights both strong self-overlap and select inter-regional connections.
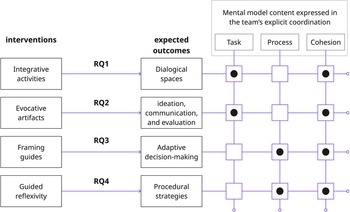
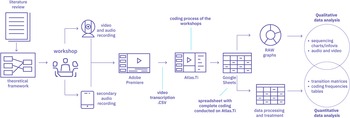
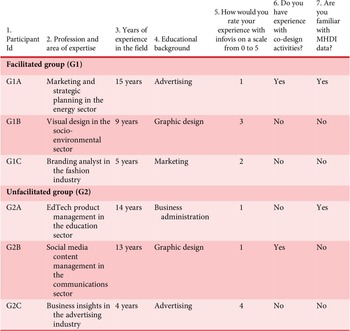

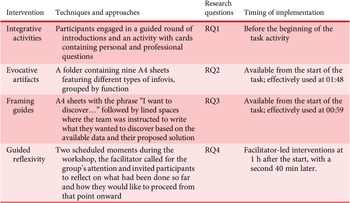
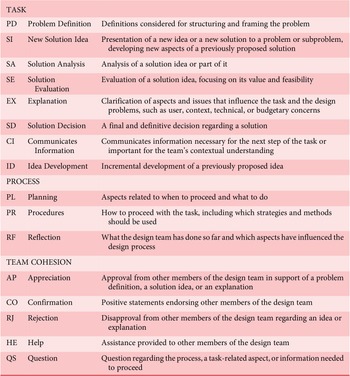
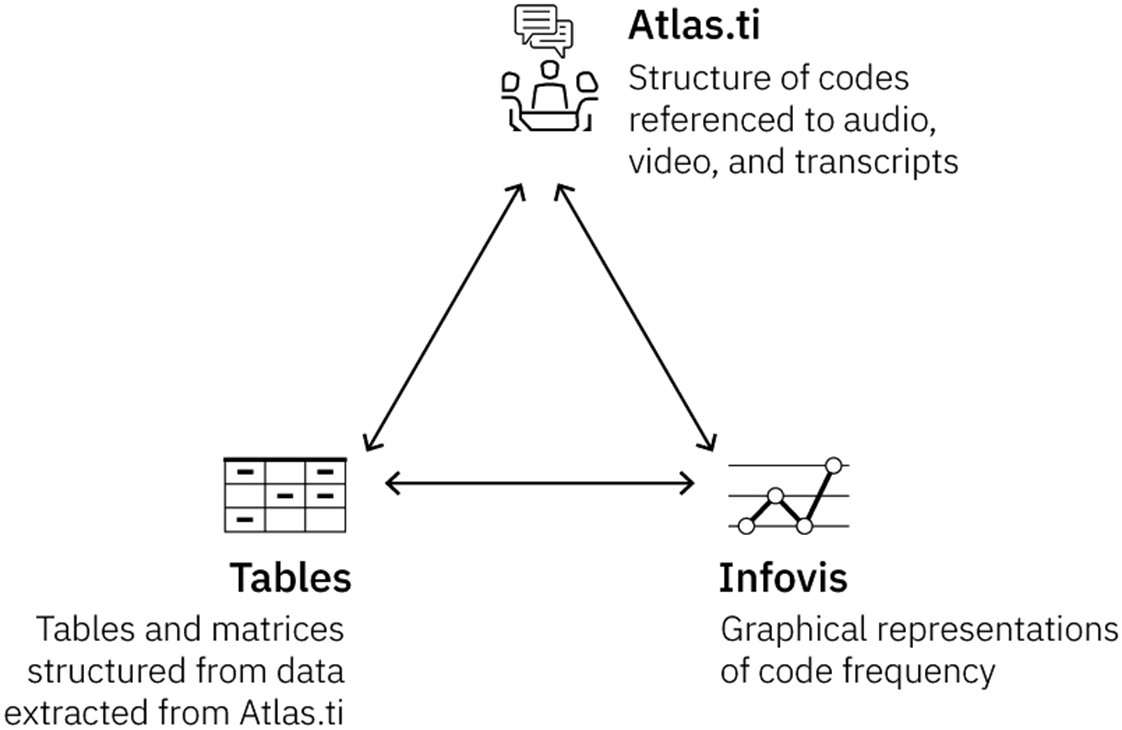
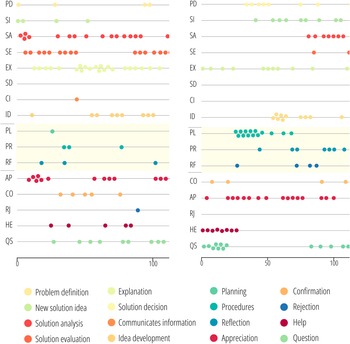
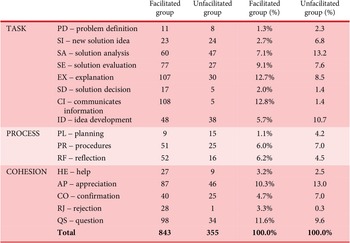
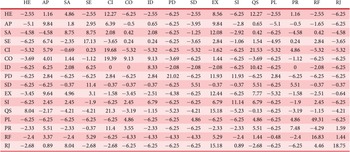
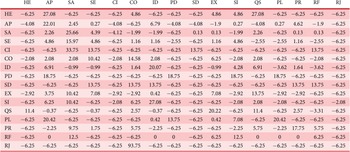
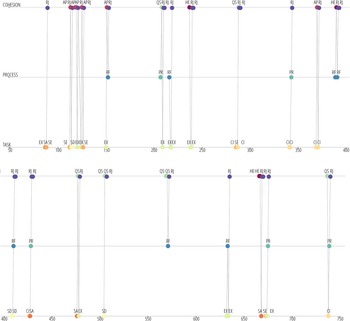
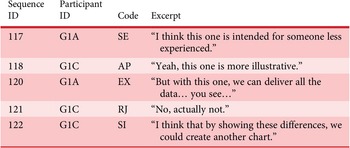
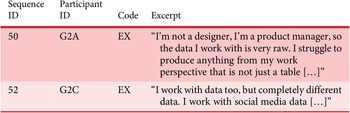
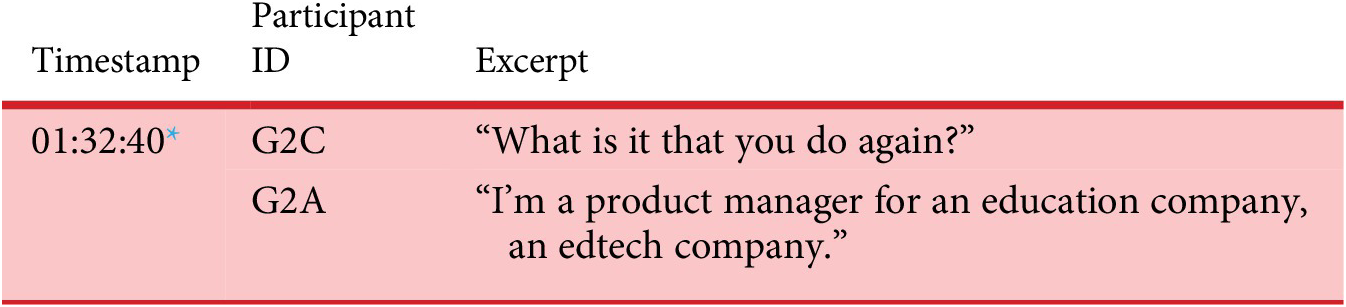
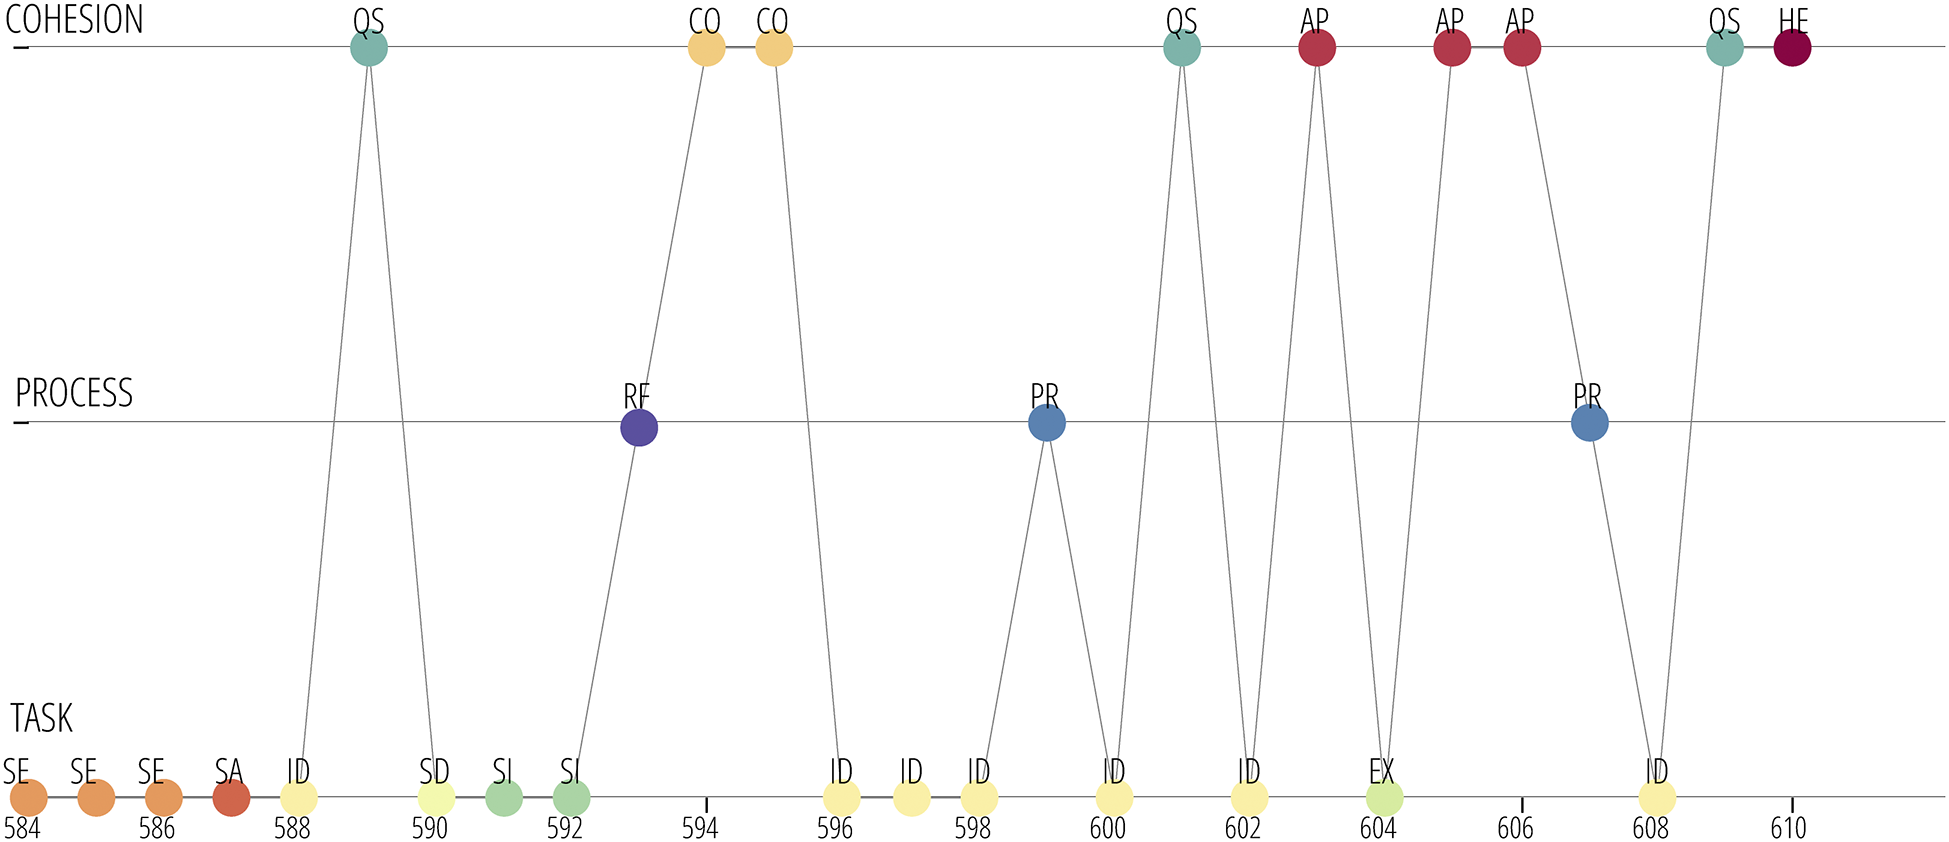
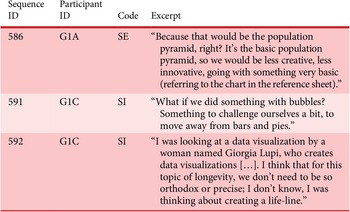
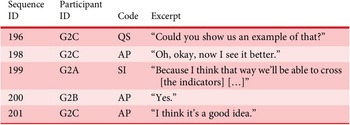
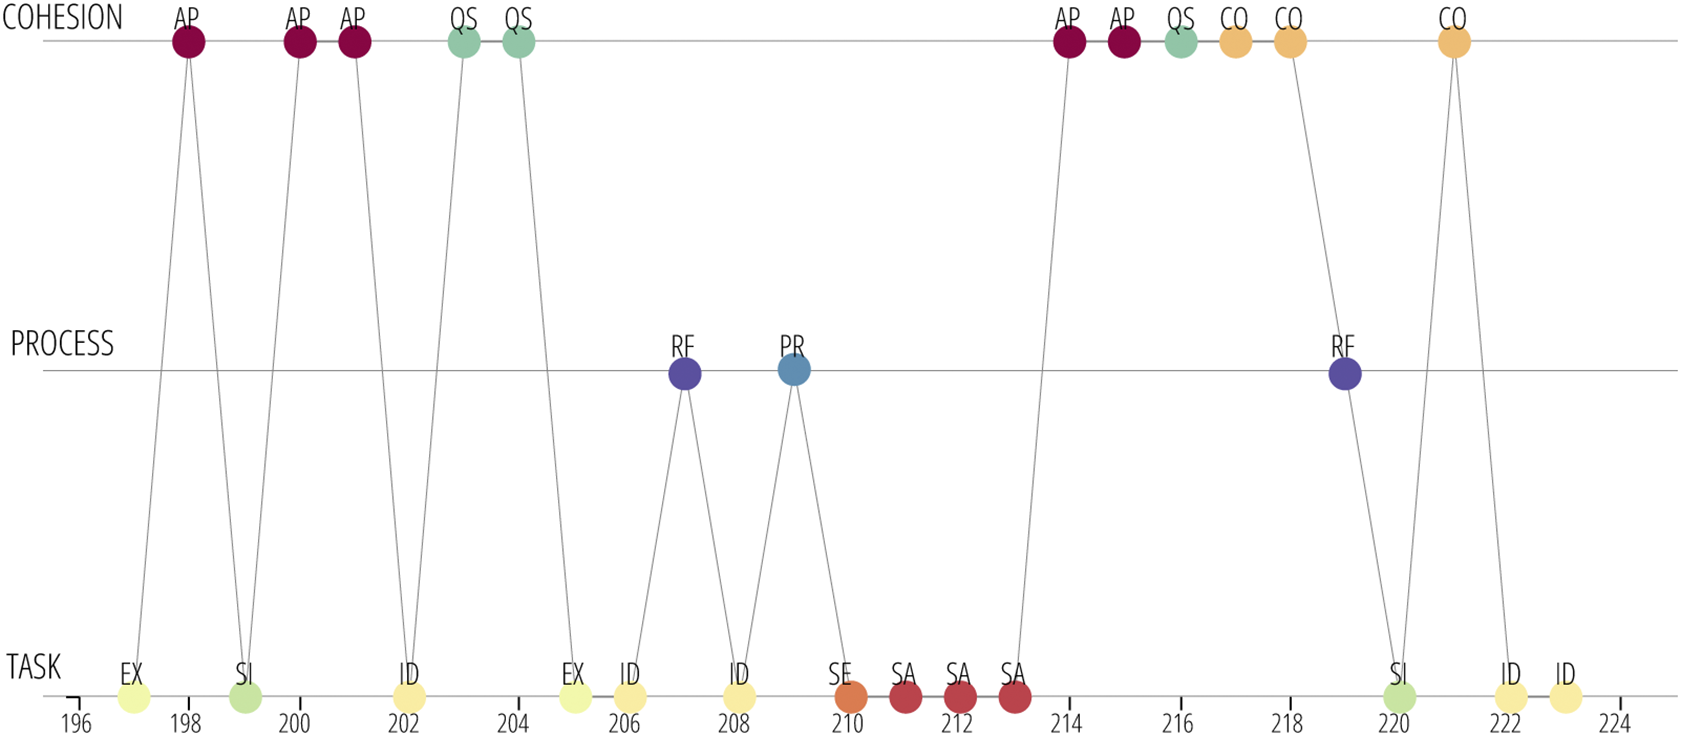
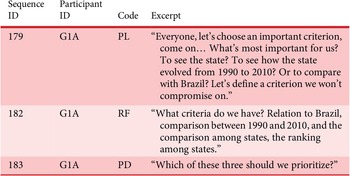
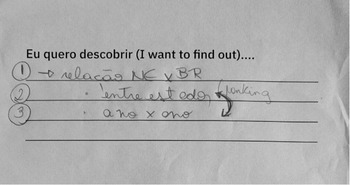
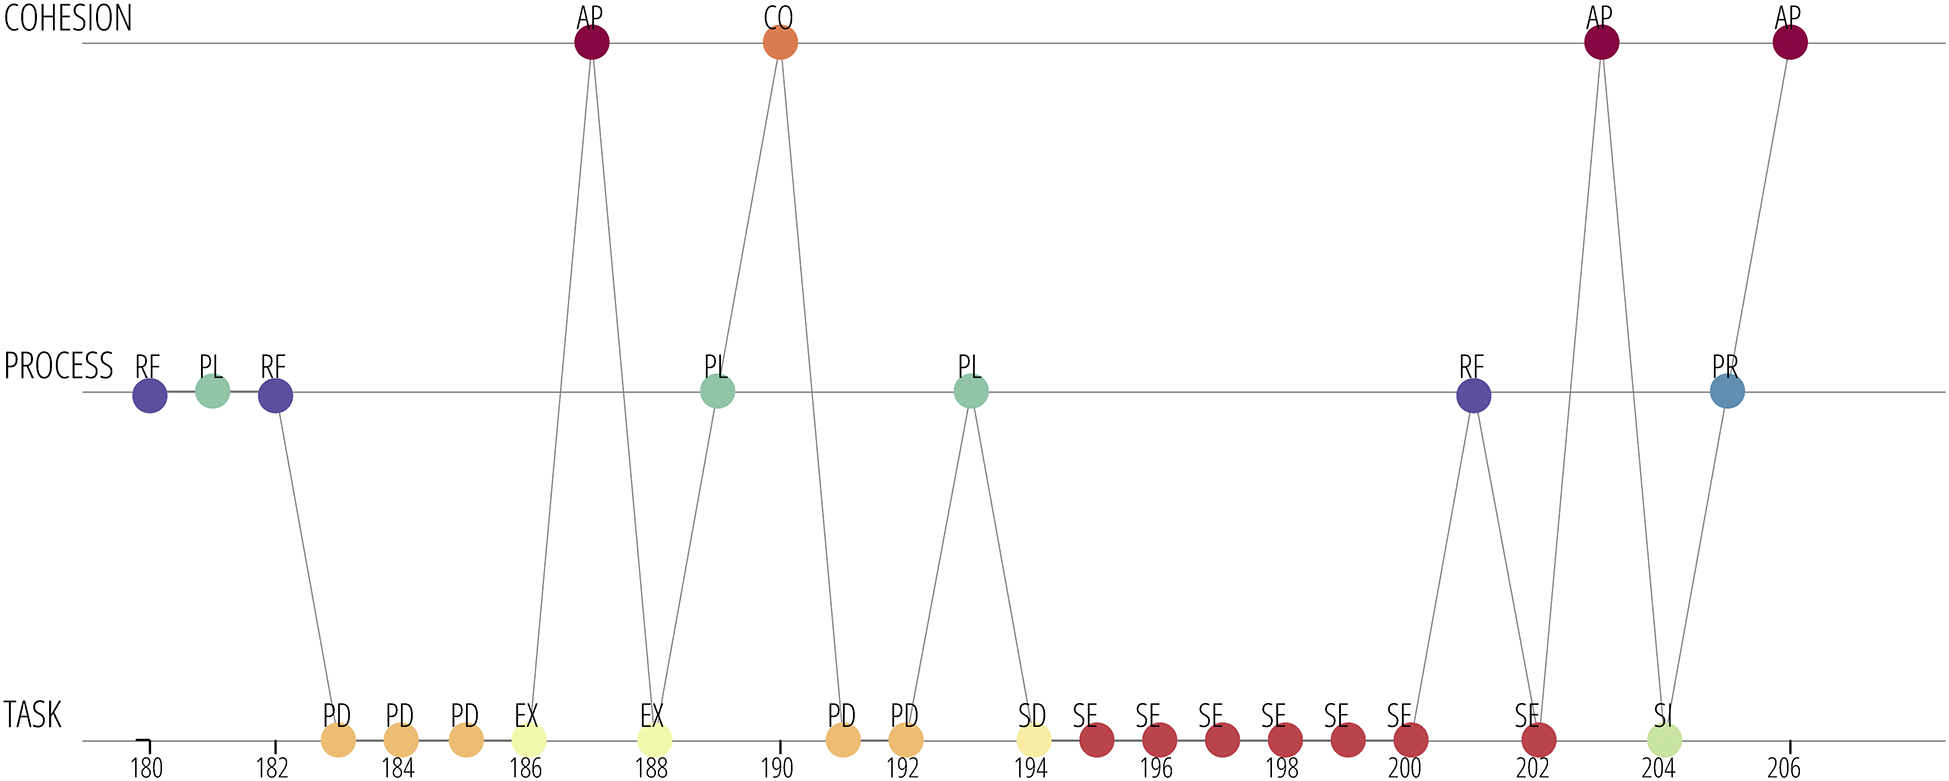
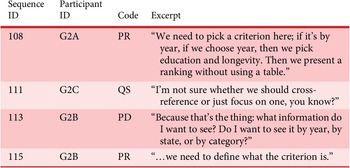

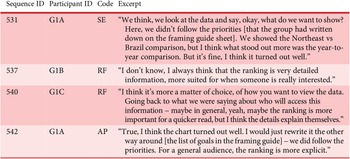
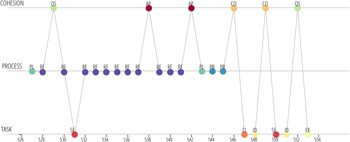
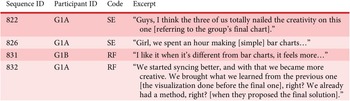
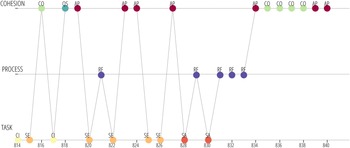
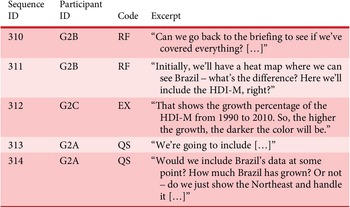
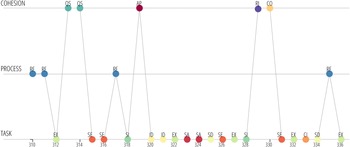
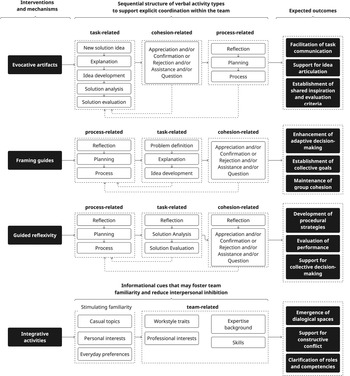
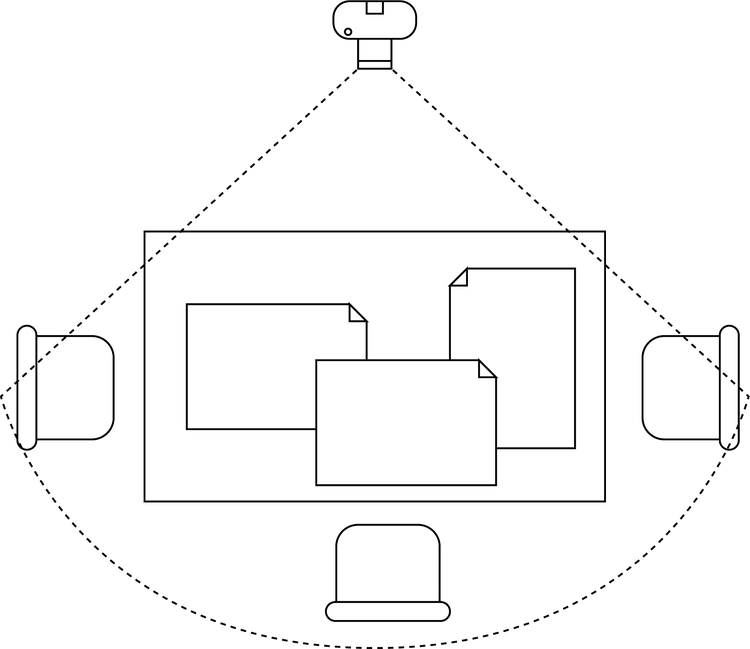
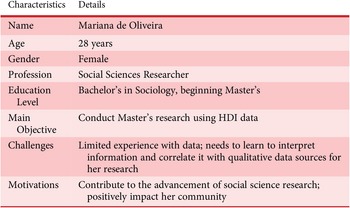
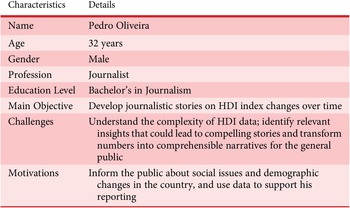
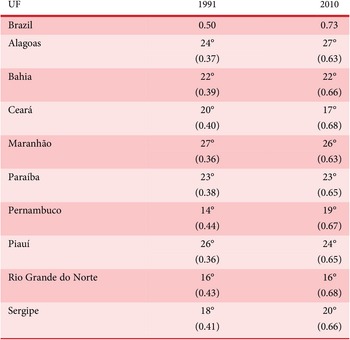
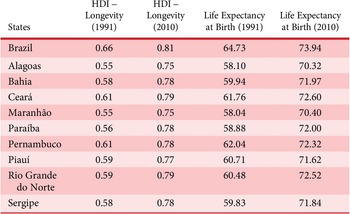

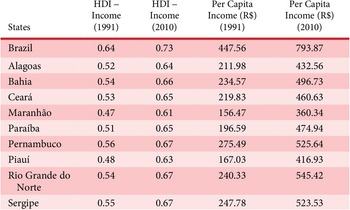
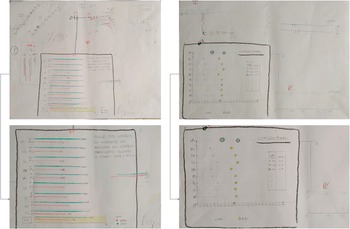

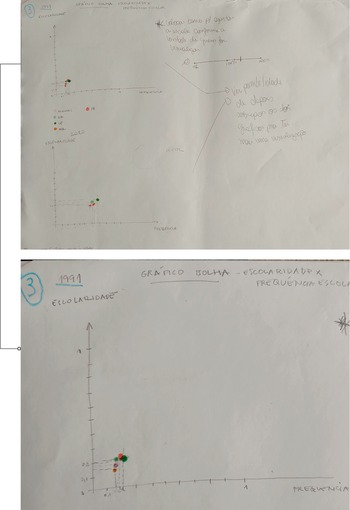

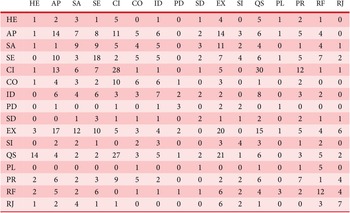
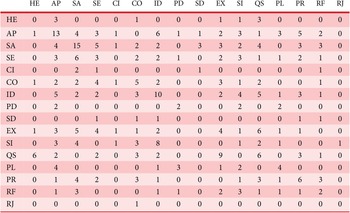
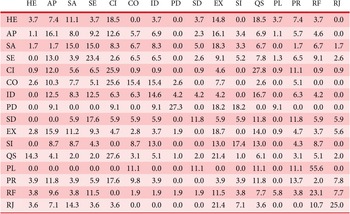


 Open access

