


Muscle mass maintenance is regulated by the balance between muscle protein breakdown and synthesis rates, and muscle synthesis is highly responsive to dietary protein intake(Reference Burd, Tang and Moore1). The postprandial muscle protein synthetic response to feeding is regulated on a number of levels, including dietary protein digestion, amino acid absorption, splanchnic amino acid metabolism, postprandial insulin release, amino acid uptake by muscle and cellular signalling in the muscle(Reference Burd, Tang and Moore1). Previous work as reviewed by Gorissen et al.(Reference Gorissen, Rémond and Van Loon2) has shown that the muscle protein synthetic response to feeding can be modulated by changing the amount of protein ingested and the source of dietary protein.
Milk proteins are a rich source of essential amino acids and have been shown to stimulate muscle protein synthesis. Comparison of milk protein fractions (milk contains an 80:20 mix of casein and whey) showed that whey proteins produced a rapid, short-lived peak in plasma amino acid concentrations, whereas the plasma amino acid peak was more moderate and prolonged with casein when given as a single protein meal(Reference Boirie, Dangin and Gachon3). These differences are due to the speed at which the protein is released into the small intestine, digested and the amino acids absorbed(Reference Burd, Tang and Moore1,Reference Boirie, Dangin and Gachon3,Reference Boutrou, Gaudichon and Dupont4) . In some studies(Reference Moughan, Cranwell and Smith5,Reference Wilson and Leibholz6) , the gastric emptying rate of soya protein was similar to that of milk, but stable isotope experiments(Reference Bos, Metges and Gaudichon7) showed that intestinal processing of soya protein was faster overall, leading to earlier appearance of most amino acids in peripheral blood for soya(Reference Burke, Winter and Cameron-Smith8). Thus, soya can be classified as producing an intermediate rate of digestion between fast whey and slow casein(Reference Tang, Moore and Kujbida9). In the work of Reidy et al.(Reference Reidy, Walker and Dickinson10,Reference Reidy, Walker and Dickinson11) , it was suggested that blends of whey and soya protein produced more prolonged increases in plasma amino acids following resistance exercise, resulting in more sustained aminoacidemia and muscle protein synthesis, as compared with whey-only treatments. Better insight into how protein blends impact postprandial aminoacidemia will inform the design of high-protein food products for older adults. Such products should contain enough digestible protein to stimulate muscle synthesis and thereby improve muscle protein balance in the positive direction.
Given the reported differences in digestion kinetics for whey, casein and soya protein, we hypothesised that drinks containing blends of the three proteins in different ratios would give rise to different postprandial plasma amino acid responses. A whey protein-based comparator drink was used to benchmark protein blends against a well-studied protein. In contrast to other studies(Reference Boirie, Dangin and Gachon3,Reference Reidy, Walker and Dickinson10,Reference Liu, Klebach and Visser12) , which have provided solutions of protein in water, we used a realistic model meal replacement drink prepared under pilot-scale industrial processing conditions.
This reflects a more real-world scenario of older adults consuming fully formulated ready-to-drink beverage products, though we acknowledge that the amount consumed here was larger than free-living older adults would usually consume in a single sitting. Delivering protein via a shelf-stable formulated beverage, not unlike commercial beverage products, allows us to measure the effect of protein type while also accounting for effects of the food matrix and processing on protein digestion and amino acid absorption(Reference Horstman, Ganzevles and Kudla13,Reference Mulet-Cabero, Mackie and Brodkorb14) .
In this study, we compared the plasma amino acid responses following the consumption of three nutritionally-matched mixed protein-source drinks in an acute crossover study with men aged between 50 and 70 years. Additionally, we used NMR urinary metabolite fingerprinting to assess some of the systemic or downstream effects of the three test drinks. Urine is a biofluid containing low-molecular breakdown products (metabolites) from the food digestion process(Reference Bouatra, Aziat and Mandal15). NMR spectroscopy is a reproducible and fast method for detecting urinary metabolites with a concentration of >10 mmol/L, in a single measurement, in the form of a metabolite fingerprint. Multivariate data analysis can then be used to rapidly compare the fingerprints from the three test drinks to assess their similarities and differences.
Materials and methods
Human study design
This study was conducted according to the guidelines laid down in the Declaration of Helsinki, and all procedures involving human subjects/patients were approved by the Massey University Human Ethics Committee (SOA 17/20). Written informed consent was obtained from all subjects.
A power calculation was performed in G * Power version 3.1.9.2(Reference Erdfelder, Faul and Buchner16,Reference Erdfelder, Faul and Buchner17) . Postprandial human blood plasma leucine concentrations after consuming whey drinks or whey–casein–soya drinks(Reference Borack, Reidy and Husaini18) were used to calculate that a trial required twelve participants to reach a power of 90 %. Exclusion and dropout rates are high for this age group, so extra participants were recruited. Healthy male participants (n 16) were recruited for this randomised crossover study (ANZCTR trial registration ACTRN12619000852156). All experiments were performed in accordance with Massey University’s guidelines ‘Code of Ethical Conduct for Research, Teaching and Evaluations Involving Human Participants’.
Participants were recruited from the Palmerston North and Wellington regions. Inclusion criteria were males, BMI 18·5–30 kg/m2, non-smokers, aged 50–70 years, in good general health conditions and with no history of gastrointestinal or chronic urinary tract disorders. Exclusion criteria included a history of food allergies, weight loss > 5 kg in the previous 6 months, antibiotic use in the previous 2 weeks and more than 4 h of medium-to-high intensity exercise per week. All participants underwent a screening visit and completed a medical questionnaire.
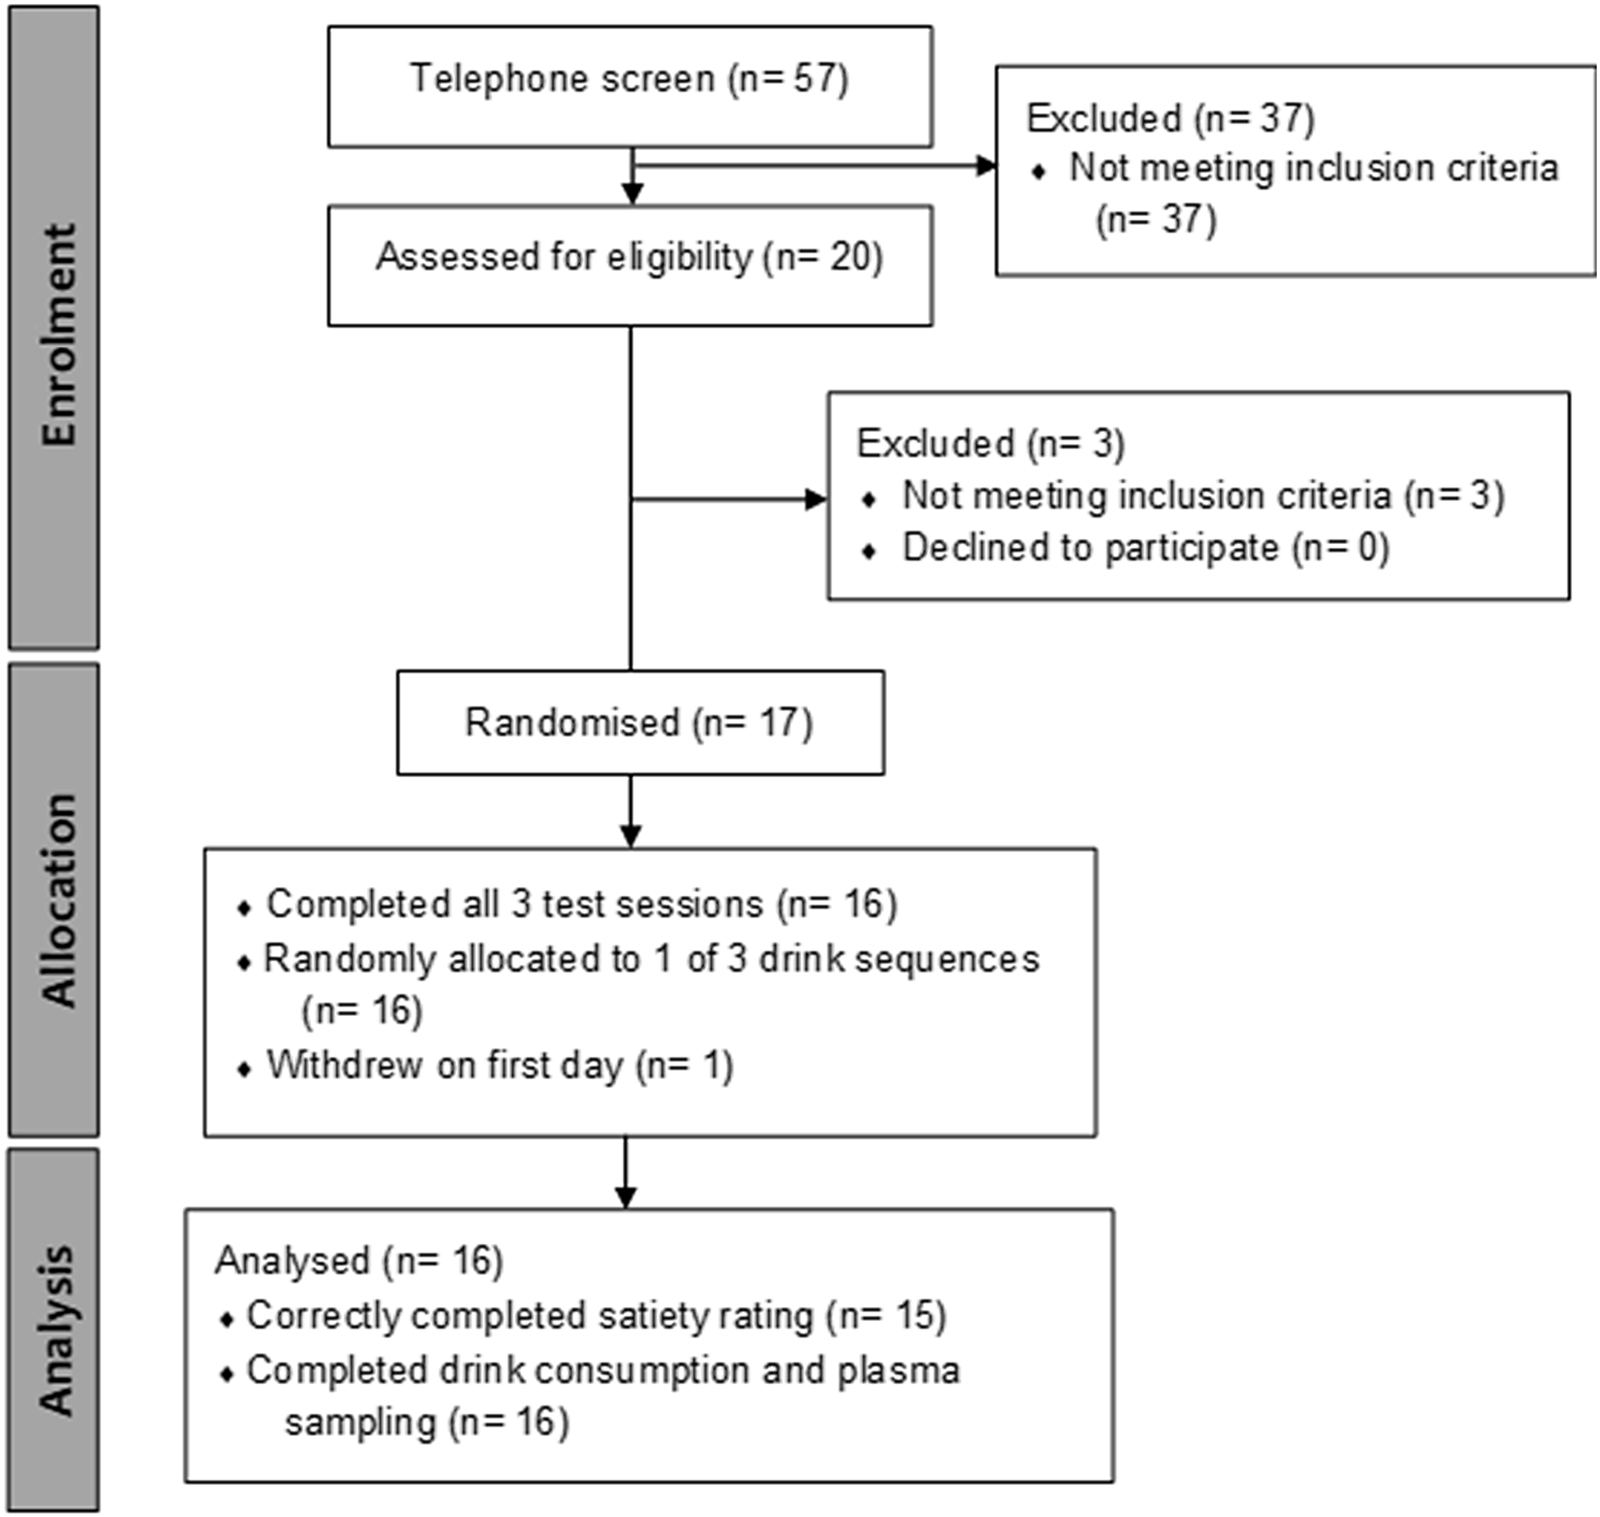
Eligible participants (Fig. 1) were sent to Medlab Central Medical Testing Laboratory or Wellington SCL Testing Laboratory for a blood sample to screen for abnormalities in complete blood count, liver function, renal function and glycated Hb.
Consort flow diagram. Of the fifty-seven people who underwent an initial telephone-based screening questionnaire on health status, twenty volunteers attended a face-to-face interview for height and weight measurement. Of twenty volunteers passing the telephone screen, seventeen who passed a clinical screen for complete blood count, liver function, renal function and glycated Hb score were recruited for the clinical trial. One participant opted out of the study on the first day. All remaining sixteen participants successfully completed beverage consumption and plasma sampling, and fifteen correctly completed satiety rating, and urine sampling. Participants were aged 60·8 (sd 5·1) years (range 52–70) with BMI of 25·4 (sd 2·2) (range 21·8–28·8).
Eligible participants were invited to attend three trial visits on which a single drink treatment was consumed in each visit. The order of consuming the three drinks was randomised using a Latin square design, and participants were blind to the type of drink they consumed at each visit. Randomisation and blinding were done by T. F. W., and participants attended trial visits between September 2018 and March 2019.
On the night before the trial, participants consumed a ready-made meal of 2310 kJ in 440 g (Thai Green Chicken Curry) containing 22·6 g fat, 22·6 g protein and 62·4 g carbohydrate, and for the remainder of that night they consumed only water. The standardised dinner on the night before the trial day was supplied in order to reduce the inter-individual variation in urine metabolic profile on the trial day.
On the morning of the trial day, participants collected all urine from the first urination on rising (T0), kept records of waking urination time and the time of previous urination, and a 50 ml subsample of the T0 urine was kept chilled. Shortly afterwards, participants arrived at either the Human Nutrition Research Unit (Massey University Turitea campus, Palmerston North) or the Massey Sports and Exercise Science Laboratory (Massey University Wellington campus, Wellington), and a cannula was inserted into a forearm vein for blood sampling.
A 12 ml baseline blood sample was collected before test drink consumption. Further blood samples were collected at 30, 60, 90, 120, 180, 240 and 300 min after drink consumption. Further urine samples were collected at 60, 180 and 300 min. Participants were requested to drink 200 ml of water every hour for hydration during their visit. The blood was collected in EDTA blood collection tubes (Becton and Dickinson) and kept on ice until being centrifuged at 780 g for 12 min at 4°C. The supernatant plasma and urine samples were stored at –80°C until analysis of plasma amino acids and urine metabolite profiles, respectively.
Meal replacement beverages
The participants consumed two test drinks and a reference drink. The test drinks were soya–dairy meal replacement drinks which were formulated to supply 30 g of protein from mixtures of soya protein and dairy protein in mass ratios of either 1:1 (48 % soya protein, 32 % casein, 20 % whey protein) or 1:2 (34 % soya protein, 52 % casein, 14 % whey protein). Protein in the test drink was supplied by fresh milk ultrafiltration retentate, standardised to 11·8 % w/w protein, whey protein concentrate (WPC392; New Zealand Milk Products Limited, 78·9 % w/w protein) and soya protein isolate (Wilmar I200, 74·3 % w/w protein). Protein in the whey protein comparator was supplied by whey protein isolate (WPI8855; New Zealand Milk Products Limited, 93·5 % w/w protein). Other ingredients that were common to all drinks were cane sugar (4·2 % w/w), maltodextrin DE30 (9·2 % w/w), rapeseed oil (5·2 % w/w), lecithin (0·16 %), buffering salt tri-potassium citrate (0·175 %) and an alginate-based antifoaming agent, SeaKem 6143 (0·005 %). The macronutrient and amino acid compositions of the drinks, as measured by an accredited analytical laboratory (Massey University Nutrition Laboratory), are given in Table 1. The nutritionally-matched drink called ‘whey comparator’ was used as a reference for amino acid response after consuming the test drinks. Participants consumed 290 ml of the 1:1 soya:dairy drink, 266 ml of the 1:2 soya:dairy drink and 250 ml of the whey comparator drink.
Macronutrient and amino acid content of trial drinks

For the whey comparator, a beverage base was prepared with 2 % WPI8855 and all non-protein ingredients, then ultra-high temperature (UHT) treated. On trial days, extra WPI8855 was stirred into the beverage base to bring the protein content to the required level. The 2 % WPI in the beverage base was necessary to properly emulsify the rapeseed oil, and remaining WPI was added after UHT treatment because a beverage with the full protein content supplied by WPI would have gelled during UHT treatment.
All drinks were homogenised and UHT treated with indirect heating at a food-safe pilot processing facility located at Massey University in Palmerston North.
Satiety assessment
For satiety assessment, before drink consumption and every 60 min afterwards, participants rated satiety (hunger, fullness, prospective consumption, desire to eat) and thirst on a visual analogue scale of 0–10 cm(Reference Chungchunlam, Moughan and Henare19). The visual analogue scale questions in order were ‘How hungry are you?’, ‘How much food would you like to eat?’, ‘How full are you?’, ‘How thirsty are you?’ and How strong is your desire to eat?’
Compositional analysis of trial drinks
Compositional analysis was carried out by the Nutrition Analytical Laboratory (Massey University). Ash was determined by AOAC 942.05, DM by vacuum oven (AOAC 990.19, 990.22), total nitrogen (AOAC 968.06; Dumas method), fat (Mojonnier, Dairy; AOAC 989.050), total dietary fibre (Megazyme, AOAC 991.43), and available carbohydrate was calculated by difference. Sugars were determined by the phenol-sulphuric method. Standard amino acid profile was determined for acid stable amino acids using HCl hydrolysis followed by RP HPLC separation and AccQ Tag derivatisation (AOAC 994.12); cysteine and methionine were prepared by performic acid oxidation (AOAC 994·12). Tryptophan was determined following alkaline hydrolysis at the AgResearch Analytical Laboratory, Palmerston North (modified AOAC 988.15). The repeatability of these amino acid determinations is within 5 %.
Plasma amino acid determination
Plasma amino acids were analysed by HPLC at AgResearch Grasslands Analytical Laboratory, Palmerston North, New Zealand using the PicoTag method(Reference Fierabracci, Masiello and Novelli20). Plasma samples were prepared and analysed as described in Milan et al. (Reference Milan, Samuelsson and Shrestha21)
NMR spectroscopy data acquisition
An NMR internal standard solution was prepared in deuterated water (D2O, Sigma Aldrich, 99 atom%) containing 5 mmol/L 2,2-dimethyl-2-silapentane-5-sulfonate (Sigma Aldrich) as a chemical shift reagent and internal standard, and 5 mmol/L difluorotrimethylsilanylmethyl phosphonic acid (Bridge Organics Vicksburg) as a pH indicator.
Randomised urine aliquots were thawed on ice on the day of analysis and 0·75 ml of well-dispersed sample aliquoted into microfuge tubes and centrifuged at 10 000 g for 10 min at 4°C. Samples judged by eye to be highly coloured were diluted 2-fold with 0·75 ml 4 mmol/L sodium azide (Thermofisher Scientific) in MilliQ water for 15 min prior to centrifugation. The supernatant (315 μl) was diluted with 105 μl 0·3 m Na phosphate buffer at pH 6·5 and 210 μl MilliQ water. For supernatants judged to be diluted by eye, MilliQ water was replaced by 210 μl additional supernatant. An aliquot (70 μl) of internal standard was gently mixed into the sample and 625 μl pipetted into NMR tubes. Blanks were prepared with water in place of urine. Samples were analysed over 4 d, and each day included a pooled sample from randomly selected samples.
One-dimensional 1H-NMR spectra to obtain urinary metabolite fingerprints were acquired in randomised order using a Bruker Avance 700 MHz NMR spectrometer (Bruker BioSpin GmbH Rheinstetten) at 25°C. The spectrometer operated at a 1H frequency of 700·25 MHz and was equipped with a 5 mm cryo-probe and a BACS automatic sample changer. 1H-NMR spectra of urine samples were obtained using a standard one-dimensional nuclear Overhauser effect with pre-saturation pulse sequence (NOESYPRESAT; Bruker BioSpin GmbH). Spectra were collected with sixty-four transients of 16k data points spanning a spectral width of 16·8 kHz (24 ppm), using a 2 s relaxation delay(Reference Hindmarsh, Awati and Edwards22).
NMR spectral analysis
The NMR spectra acquired on the urine samples were processed using MestreNova v.12.0.3 (MestreLab Research). Each spectrum was individually referenced to 2,2-dimethyl-2-silapentane-5-sulfonate at 0·00 ppm. Phasing was carried out using the automatic phasing function and no baseline adjustment was necessary.
Following this, the spectra were superimposed and inspected for spectral quality and/or large variations in peak intensity due to varying dilution; two spectra of insufficient quality were excluded from the data set. All processed spectra were binned into 421 bins covering from 0·65 ppm to 9·30 ppm using a constant bin width of 0·02 ppm. The region around the water peak (4·68–4·91 ppm) and the region 6·537–6·577 ppm (which contained spectral artifacts for some of the samples) were excluded. Integrals (peak areas) for each bin in each urine sample were exported to Excel. Three regions with pH-sensitive metabolites were identified and bins containing these metabolites were merged. The resulting data table was used for the statistical analysis(Reference Xia, Sinelnikov and Han23).
Statistical analysis
Plasma amino acid data were analysed using Minitab 18.1 (Minitab Inc.). The total AUC was calculated from measurements at each time point using the trapezoid rule. Plasma amino acid concentrations for the different test drinks were compared using repeated measures (mixed model) ANOVA with drink and time as fixed factors, and participant and drink order as random factors. For time points at which ANOVA reported significant treatment effects (P < 0·05), Tukey’s multiple comparisons were applied post hoc to obtain treatment groupings with 95 % confidence. AUC data were also analysed using one-way ANOVA and Tukey multiple comparisons. P-values are shown in online Supplementary Table S1 for all ANOVA results for which P < 0·05.
Data analysis of urine metabolomics data was carried out using time series analysis in MetaboAnalyst 3.5.1 (https://www.metaboanalyst.ca/)(Reference Xia, Sinelnikov and Han23). Bin integral data were normalised by sum to account for variations in urine concentration, transformed using a cube root transformation and scaled using Pareto scaling. First, unsupervised principal component analysis was conducted to examine the variation in the total data set. Then supervised sparse partial least squares discriminant analysis of data sets for each sampling time was carried out, and a further Wilcoxon rank-sum test was applied to determine statistical differences (P < 0·05) between treatments.
Results
Participant baseline characteristics
Sixteen participants successfully completed the study and had an average age of 60·8 (sd 5·1) years and average BMI of 25·4 (sd 2·2) kg/m2.
Plasma amino acid profiles
Fig. 2 shows the postprandial plasma amino acid time course data for total amino acids, essential amino acids, branched-chain amino acids and individual amino acids for which significant differences at 95 % confidence (ANOVA P-values below 0·05) were observed. Corresponding data for all other amino acids are shown in online Supplementary Fig. S1. The postprandial plasma amino acid response was not significantly different between all three drinks for total amino acids, but differences emerged for individual amino acids (Fig. 2; Table 2), reflecting different protein composition of the drinks (Table 1).
Plasma amino acid concentration of older adult men after consumption of (![]() ) 1:1 soya:dairy, (
) 1:1 soya:dairy, (![]() ) 1:2 soya:dairy and (
) 1:2 soya:dairy and (![]() ) whey comparator drinks, n 16 ± sem. Statistical significance represented by: (a) whey comparator v 1:1 soya:dairy; (b) whey comparator v 1:2 soya:dairy. Data for other amino acids can be found in online Supplementary Fig. S1.
) whey comparator drinks, n 16 ± sem. Statistical significance represented by: (a) whey comparator v 1:1 soya:dairy; (b) whey comparator v 1:2 soya:dairy. Data for other amino acids can be found in online Supplementary Fig. S1.

AUC for plasma amino acid concentration ± standard error. Participants were older men and treatments were 1:1 soya: dairy drink, 1:2 soya:dairy drink or whey comparator drink. Along rows, data with different symbols had statistical significance (P < 0·05) on post-hoc Tukey’s honestly significant difference analysis. Where only one treatment carries a symbol, the treatment differed statistically from the other two treatments
(Mean values and standard errors)

Whey protein is naturally rich in the branched-chain amino acids leucine and isoleucine, as well as lysine, methionine and tryptophan, and the whey drink also contained more cysteine and alanine (Table 1). Plasma levels of these amino acids reflected this, with significantly higher peaks for the whey comparator drink compared with the soya:dairy test drinks for lysine, methionine and tryptophan, but not cysteine or alanine. The soya:dairy test drinks contained more valine and phenylalanine than the whey comparator (Table 1). In line with this, the soya:dairy test drinks gave significantly higher plasma levels of these two amino acids from 180–300 min after consumption. AUC data (Table 2) broadly reflected the same trends, with higher leucine, tryptophan, phenylalanine and lysine from the whey comparator.
The two test drinks produced almost identical postprandial plasma amino acid profiles, with only small differences observed. Compared with the 1:1 soya:dairy drink, the 1:2 soya:dairy drink delivered methionine and tryptophan slightly faster during the first 60 min and gave slightly lower peak levels for isoleucine, phenylalanine and ornithine, but these differences were not significant. AUC values 1:1 and 1:2 soya:dairy drinks (Table 2) were not significantly different from each other, but the 1:2 soya:dairy drink gave significantly higher AUC than the whey comparator for proline.
Hunger and satiety
There were no significant differences in visual analogue scale responses (online Supplementary Fig. S2) between the three test drinks. Although the study power was not high enough to detect significant differences in these subjective measures, the data means suggested that the soya:dairy drinks were slightly more satiating, which is consistent with their content of slow-digesting casein.
NMR metabolomic analysis of urine
Differences in urinary metabolite fingerprints following ingestion of the three drinks were analysed to determine whether the different plasma amino acid responses affected downstream systemic metabolic outcomes.
Principal component analysis scores plots of the entire sample set (all time points) showed that there were no clear differences between the three treatment groups (data not shown). However, some time-course trends are observed in the scores plots from supervised sparse partial least squares discriminant analysis of data sets from each sampling time point (Fig. 3). In most cases, the greatest driver of difference in the data appeared to be inter-individual variation. No significant differences were found between treatment groups at 0 or 60 min, which corresponds to overlapping confidence ellipses in Fig. 3(a) and (b) (statistical data not shown). When comparing the 1:1 soya:dairy treatment group with the 1:2 soya:dairy treatment group at 180 or 300 min (Fig. 3(c) and (d)), there was also no significant difference (data not shown).
Scores plots from sparse partial least squares discriminant analysis (sPLS-DA) analysis of urine metabolites at individual time points, colour coded by test drink: (![]() ) 1:1 soya: dairy drink, (
) 1:1 soya: dairy drink, (![]() ) 1:2 soya:dairy drink or (
) 1:2 soya:dairy drink or (![]() ) whey comparator. (a)–(d): 0, 60, 180 and 300 min, respectively. Coloured ellipses indicate 95 % confidence regions. The figure shows plots of component 1 v. component 2.
) whey comparator. (a)–(d): 0, 60, 180 and 300 min, respectively. Coloured ellipses indicate 95 % confidence regions. The figure shows plots of component 1 v. component 2.

A Wilcoxon rank-sum test showed a few bins with statistical significance when the soya:dairy drinks were compared with the whey drink at 180 and 300 min (online Supplementary Table S1). In Fig. 3(c) and (d), the confidence ellipse for the whey drink was largely distinct from other treatments along component 1, suggesting different metabolic effects.
Discussion
Amino acid levels in blood plasma at a given time point, as measured here, reflect the net result of multiple processes including digestion, absorption, splanchnic retention, protein synthesis and protein breakdown(Reference Trommelen, Tomé and van Loon24). The levels of amino acids in blood plasma following ingestion of dietary protein can be considered a downstream proxy for protein digestion, gut amino acid absorption, first-pass absorption and amino acid release in the circulation.
In this study, we show that protein source can influence the postprandial plasma amino acid response and the downstream metabolomic profile, but between the two protein blends tested, differences were subtle. Two soya:dairy protein drinks containing 30 g of protein, but with different ratios of soya, casein and whey, were analysed. Overall, the results showed that despite the difference in protein ratios, the two drinks gave similar amino acid responses and similar urinary metabolomic fingerprints. The 1:1 soya:dairy drink contained ∼40 % more soya and ∼40 % less milk protein (casein and whey) than the 1:2 soya:dairy drink, and this was reflected in small differences in amino acid profile (Table 1). With the exception of proline, these differences did not translate into different amino acid responses or urinary metabolomic fingerprints.
The whey drink gave significantly higher peak plasma concentrations of branched-chain amino acids and essential amino acids, compared with the 1:2 soya:dairy test drink. However, the AUC for total branched-chain amino acid and total essential amino acid were not significantly different between the three drinks. Higher levels of leucine, lysine and tryptophan in the whey drink translated to significantly higher AUC, whereas soya:dairy drinks delivered higher overall (AUC) amounts of phenylalanine and proline, reflecting compositional differences.
Whey protein has been shown previously(Reference Horstman, Ganzevles and Kudla13,Reference Burke, Hawley and Ross25) to be rapidly digested and thus produces a rapid spike in blood amino acid concentrations, and our results are consistent with this. Activation of skeletal muscle protein synthesis is contingent on amino acids being taken up by the muscle from the blood; therefore, the overall length of prolonged blood hyperaminoacidaemia is crucial(Reference Pennings, Boirie and Senden26,Reference Burd, Yang and Moore27) . All of the drinks in this study gave a peak in amino acid concentration at 90 min, and levels of plasma amino acids were close to baseline levels by 180 min. The time of peak amino acid concentration for the whey protein drink was later than for isolated whey protein or low-fat UHT milk, but comparable with full-fat UHT milk(Reference Reidy, Walker and Dickinson10,Reference Horstman, Ganzevles and Kudla13,Reference Borack, Reidy and Husaini18) suggesting that the rapeseed oil and/or maltodextrin in the formulation may have delayed digestion. Lacroix et al.(Reference Lacroix, Bon and Bos28) examined postprandial nitrogen metabolism in human participants who consumed N15-labelled UHT milk, pasteurised milk or microfiltered (unheated) milk. Uptake of N was significantly faster with UHT milk (as confirmed by Horstman et al.(Reference Horstman, Ganzevles and Kudla13)), resulting in lower postprandial N retention, and this was attributed to modified digestive kinetics as a result of heat processing. The authors suggested that UHT heat-induced amino acid derivatisation may have contributed to N loss via deamination, but modified gastric coagulation behaviour was thought to be the main driver of differences in N metabolism(Reference Lacroix, Bon and Bos28).
The key phenomenon regulating gastric transit of casein consumed in dairy beverages is the extent of acid- and pepsin-induced coagulation during the minutes after ingestion(Reference Ye, Cui and Dalgleish29). This depends on the concentration of casein in a beverage and the presence of other materials, either in the beverage or already in the stomach, that can inhibit coagulation or weaken the gastric coagulum. It also depends on the processing history of the casein: here, test beverages underwent UHT processing, which weakens the ability of casein to coagulate in the stomach, due to heat-induced binding of whey proteins to the surface of casein micelles(Reference Mulet-Cabero, Mackie and Wilde30,Reference Ye, Liu and Cui31) . Fat slows down the gastric transit of dairy products(Reference Horstman, Ganzevles and Kudla13), especially when it has been homogenised into fine protein-coated droplets(Reference Horstman, Ganzevles and Kudla13,Reference Mulet-Cabero, Mackie and Wilde30) , as was the case here. Maltodextrin and sugar may also somewhat attenuate the plasma amino acid response to protein intake(Reference Gorissen, Burd and Hamer32), but these components are common to all the treatment beverages.
Hence, the two test beverages contained a substantial amount of casein (9·6 and 15·6 g for 1:1 and 1:2 soya:dairy beverages), but the presence of homogenised rapeseed oil and the processing that the beverages underwent (homogenising, UHT heating) are likely to have mitigated gastric coagulation of casein. We propose this as the explanation for faster and less long-lived plasma amino acid response, when compared with unheated solutions of micellar casein(Reference Horstman, Ganzevles and Kudla13,Reference Gorissen, Burd and Kramer33) , and similar plasma total amino acid response to the whey comparator. There was no difference in the plasma amino acid levels of leucine between the two soya:dairy drinks. Leucine is demonstrated to be responsible for activating protein synthesis(Reference Norton and Layman34). While leucine was higher in the whey drink, as expected, the levels of whey/casein in the soya:dairy test drinks did not affect plasma leucine release.
There were few significant differences in urinary NMR metabolomics results between whey and soya:dairy drinks, despite some significant differences in plasma amino acid concentrations. The study was powered to detect differences in plasma amino acid concentration, which show less inter-individual variation than metabolomic profiles. Examining detailed metabolomic effects of protein source would require a larger study.
The metabolomic data at 180 min and 300 min seem to be following a similar pattern to plasma amino acid release in the first 120 min after consuming the drinks (Fig. 2), i.e. the whey treatment gave a different pattern from the soya:dairy treatments, which were not different from each other. These results suggest that the differences in urinary metabolites occur only after the digestion of protein and appearance of amino acids in the blood, and that the source of protein influences postprandial metabolism. Further analysis would be required to identify metabolites associated with the spectral bins that showed statistically significant treatment effects. Other studies have shown the usefulness of an NMR metabolomics approach in human nutritional studies. Examples include insights into metabolic differences between high-GI and low-GI diets(Reference Rasmussen, Winning and Savorani35), how changes in gut microbiota modulated the urinary metabolite fingerprints in infants supplemented with milk fat globule membrane(Reference Zhao, Yi and Liu36), and the ability to detect consumption of whole grains from urinary fingerprints(Reference Garg, Brennan and Price37).
Few other studies of protein digestion and metabolism have used protein blends or meal replacement formats, as were used here. In studies that used simple solutions/dispersions of protein rather than meal replacement beverages, whey protein was digested and absorbed faster than casein or soya protein(Reference Boirie, Dangin and Gachon3,Reference Reidy, Walker and Dickinson10) . We have shown that in a meal replacement format, postprandial plasma amino acid responses are qualitatively identical for whey and soya:dairy blends, notwithstanding different amino acid composition. This suggests that non-protein food ingredients such as maltodextrin and rapeseed oil can diminish the differences in digestive behaviour between ‘fast’ and ‘slow’ proteins.
Conclusions
This study shows that delivering dietary protein to 50–70-year-old males in the format of a ready-to-drink UHT beverage largely eliminates the slow-digesting nature of casein in beverages supplying blends of milk protein and soya. In this format, plasma amino acid responses and metabolic fingerprints largely reflect the component amino acids of the source proteins. This finding contrasts with studies in which protein powders are freshly dissolved in water immediately before serving to trial participants; under this scenario, the ‘fast’ and ‘slow’ natures of different proteins are generally more extreme. We believe that the difference is due to added oil, homogenising and UHT heat treatment.
Acknowledgements
The authors thank Ajitpal Purba, Florine Siedel and Sylwia Bajdzenko for technical assistance, and Pat Edwards at BioNMR, Massey University, Palmerston North, for NMR data acquisition.
This research was funded by the New Zealand Ministry of Business, Innovation and Employment (MBIE) under the High Value Nutrition National Science Challenge, MultiProMo project.
Conceptualisation: S. M. L. and S. H., methodology, S. H., L. M. S., formal analysis, T. F. W., N. A., writing – original draft preparation, T. F. W., writing – review and editing, N. A. N., S. M. L., S. H., L. M. S., N. A., visualisation, T. F. W., N. A. N., N.A., funding acquisition and project administration, S. M. L.
There are no conflicts of interest.
Supplementary material
For supplementary material referred to in this article, please visit https://doi.org/10.1017/S0007114521004591


