


Introduction
Three of the largest ice-shelf disintegration events in Antarctica, Larsen A, Larsen B and Wilkins, in 1995, 2002 and 2008, respectively (Reference Cook and VaughanCook and Vaughan, 2010), displayed a common pattern of rapidly expanding plumes of closely packed ice-shelf fragments which, after coming to a stop, had areas that greatly exceeded those of the original contiguous ice shelves. Satellite imagery of the Larsen A and B collapse events, for example, reveals that the outward expansion of these plumes can be >400 m h - 1 in their central areas, with maximum values >750 m h - 1 (Reference Rack and RottRack and Rott, 2004).
The expansion of sea-surface area coverage between the initial contiguous ice shelf and the final resting state of the ice-shelf fragment plume is no less impressive. Figure 1 shows satellite images of the Larsen B and Wilkins ice shelves both immediately prior to their break-up and after the densely packed plume of fragments has come to rest. Analysis of the images for the Larsen B ice shelf (personal communication from O. Sergienko, 2012; see also Reference MacAyeal, Scambos, Hulbe and FahnestockMacAyeal and others, 2003; Reference Rack and RottRack and Rott, 2004) shows that the final area of the plume (prior to dispersal by winds and ocean currents) of 6750 km2 was created from an initial area half as large, 3200 km2. Within the resting plume, 1600 km2 represents tabular icebergs in their original, firn-side-up state. This means that 1600 km2 of the original ice shelf was converted to ice-shelf fragments that subsequently cover >5150 km2 of the ocean surface in the densely packed plume. This large increase in area was one of the factors that motivated the ice-shelf capsize mechanism as a leading explanation of the plume’s behaviour (Reference MacAyeal, Scambos, Hulbe and FahnestockMacAyeal and others, 2003).
Satellite imagery (Reference Scambos, Bohlander and RaupScambos and others, 1996) of the collapse of the (a) Larsen B and (b) Wilkins ice shelves was used to calculate the expansion of the area of ice-shelf-fragment plume coverage. The area of the contiguous ice shelf that disintegrated is coloured green. The subsequent area of the plume, once it has come to a rest, but before being dispersed by winds and currents, is the sum of the green and yellow areas.

Considerable attention has been devoted to identifying the physical mechanisms responsible for weakening ice shelves and triggering their sudden break-up (e.g. Reference Skvarca, Rack, Rott and DonangeloSkvarca and others, 1999; Reference Scambos, Hulbe, Fahnestock and BohlanderScambos and others, 2000, Reference Scambos, Hulbe, Fahnestock, Domack, Burnett, Leventer, Conley, Kirby and Bindschadler2003, Reference Scambos, Sergienko, Sargent, MacAyeal and Fastook2005, Reference Scambos2009; Reference DomackDomack and others, 2005). These collapse events are unprecedented in the Holocene epoch, indicating that recent climate warming is an essential catalyst (Reference DomackDomack and others, 2005). Prior to collapse, the surface of ice shelves, with the exception of the Wilkins Ice Shelf, is typically covered with arrays of surface meltwater ponds and streams. This water assists the vertical propagation of ice-shelf crevasses (Reference Scambos, Hulbe, Fahnestock, Domack, Burnett, Leventer, Conley, Kirby and BindschadlerScambos and others, 2003), and is thus regarded as a key proximal cause for the impending collapse of the ice shelf. In the case of the Wilkins Ice Shelf, where surface water was not observed as distinctly as in the other examples, subsurface water within the firn, created both from surface melting and sea-water infiltration, may explain the apparent departure from the causal pattern. The elastic response of the ice shelves before collapse has also been investigated (Reference Doake, Corr, Rott, Skvarca and YoungDoake and others, 1998), and it has been suggested that the trigger for collapse could be a shift in the frequency response of a crevassed ice shelf subjected to periodic forcing (Reference Freed-Brown, Amundson, MacAyeal and ZhangFreed-Brown and others, 2012).
Much less is known about the dynamics of the actual disintegration process. The ‘capsize mechanism’ articulated by Reference MacAyeal, Scambos, Hulbe and FahnestockMacAyeal and others (2003), and given considerable support by the study of the Wilkins Ice Shelf by Reference ScambosScambos and others (2009), invokes a coupling between fracture, calving and capsize, that leads to a runaway feedback. Iceberg capsize, which has been implicated as a source of teleseismic glacial earthquakes (Reference Tsai, Rice and FahnestockTsai and others, 2008; Reference Nettles and EkstromNettles and Ekstrom, 2010; Reference Amundson, Burton and Correa-LegisosAmundson and others, 2012) and coastal tsunamigenesis (Reference MacAyeal, Abbot and SergienkoMacAyeal and others, 2011; Reference BurtonBurton and others, 2012), is a potent source of gravitational potential energy. When considering the possible capsize of multiple icebergs in an ice-shelf collapse scenario, interactions between icebergs will involve granular collisions and hydrodynamic coupling within the sea water between the icebergs. A granular model of ice-shelf collapse by iceberg capsize has been investigated recently (Reference GuttenbergGuttenberg and others, 2011), where the potential energy released by capsize is dissipated by the constant inelastic collisions of adjacent icebergs and simple viscous drag from the fluid. In addition, during the capsize of a single iceberg, recent experiments reveal that the majority of energy is dissipated into the water through kinetic energy of motion, ultimately leading to small-scale turbulence (Reference Amundson, Burton and Correa-LegisosAmundson and others, 2012; Reference BurtonBurton and others, 2012).
In this study, we continue to explore the dynamics of ice-shelf disintegration by further investigating the behaviour of arrays of ice-shelf fragments (icebergs) that are capable of capsize. Our method involves laboratory experimentation, building on the previous work by Reference BurtonBurton and others (2012), in which the capsize dynamics of single, isolated icebergs were investigated. In particular, we study the behaviour of multiple adjacent icebergs in an effort to understand cooperative behaviour that may impact the dynamics of capsize and subsequent motion of the icebergs. We report measurements of the potential and kinetic energies of N capsizing icebergs vs time, and the effects of initial iceberg spacing and iceberg geometry (aspect ratio) on the capsize process. Our results show that adjacent icebergs can capsize in a cooperative fashion due to hydrodynamic coupling (i.e. capsizing in unison and rotating in the same direction) and provide a possible physical mechanism operating in the post-collapse rapid expansion of Antarctic ice shelves.
Experimental Methods
Satellite imagery of ice-shelf collapse suggests that a significant fraction of icebergs capsize and subsequently move across the ice/ocean interface. If the kinetic energy of motion is supplied by the gravitational potential energy released through capsize (Fig. 1), then the source of this kinetic energy is internal to the iceberg arrangement; this constitutes a principal difference between previously proposed sources, such as wind (Reference Rack and RottRack and Rott, 2004). We restricted our experiment to a two-dimensional representation of ice-shelf collapse and iceberg-fragment plume, by considering a band of arrayed icebergs in a linear wave tank. A schematic diagram of the experimental apparatus, created by enhancing the apparatus used in the experiments for single icebergs (Reference BurtonBurton and others, 2012), is shown in Figure 2.
Schematic diagram of the experimental apparatus. A linear wave tank containing rectangular, plastic icebergs of height H = 10.3 cm, length L = 26.7 cm, and varying widths W, where W < H, so that ε < 1. An aluminium plate with adjustable feet and support beams holds the icebergs upright and level. The aluminium supports under the icebergs are 2 cm wide and span the length of the icebergs. The positions of the supports, and thus the spacing of the icebergs, are adjusted using thumbscrews. A wave attenuator is placed at one end of the tank to damp sloshing modes. Water slowly fills the tank until the icebergs begin to float. Once afloat the spontaneous capsize of one iceberg initiates the subsequent behaviour. The resulting motion is filmed using a digital camera, and the positions and angles of the icebergs are tracked using black marker dots and image-analysis software.
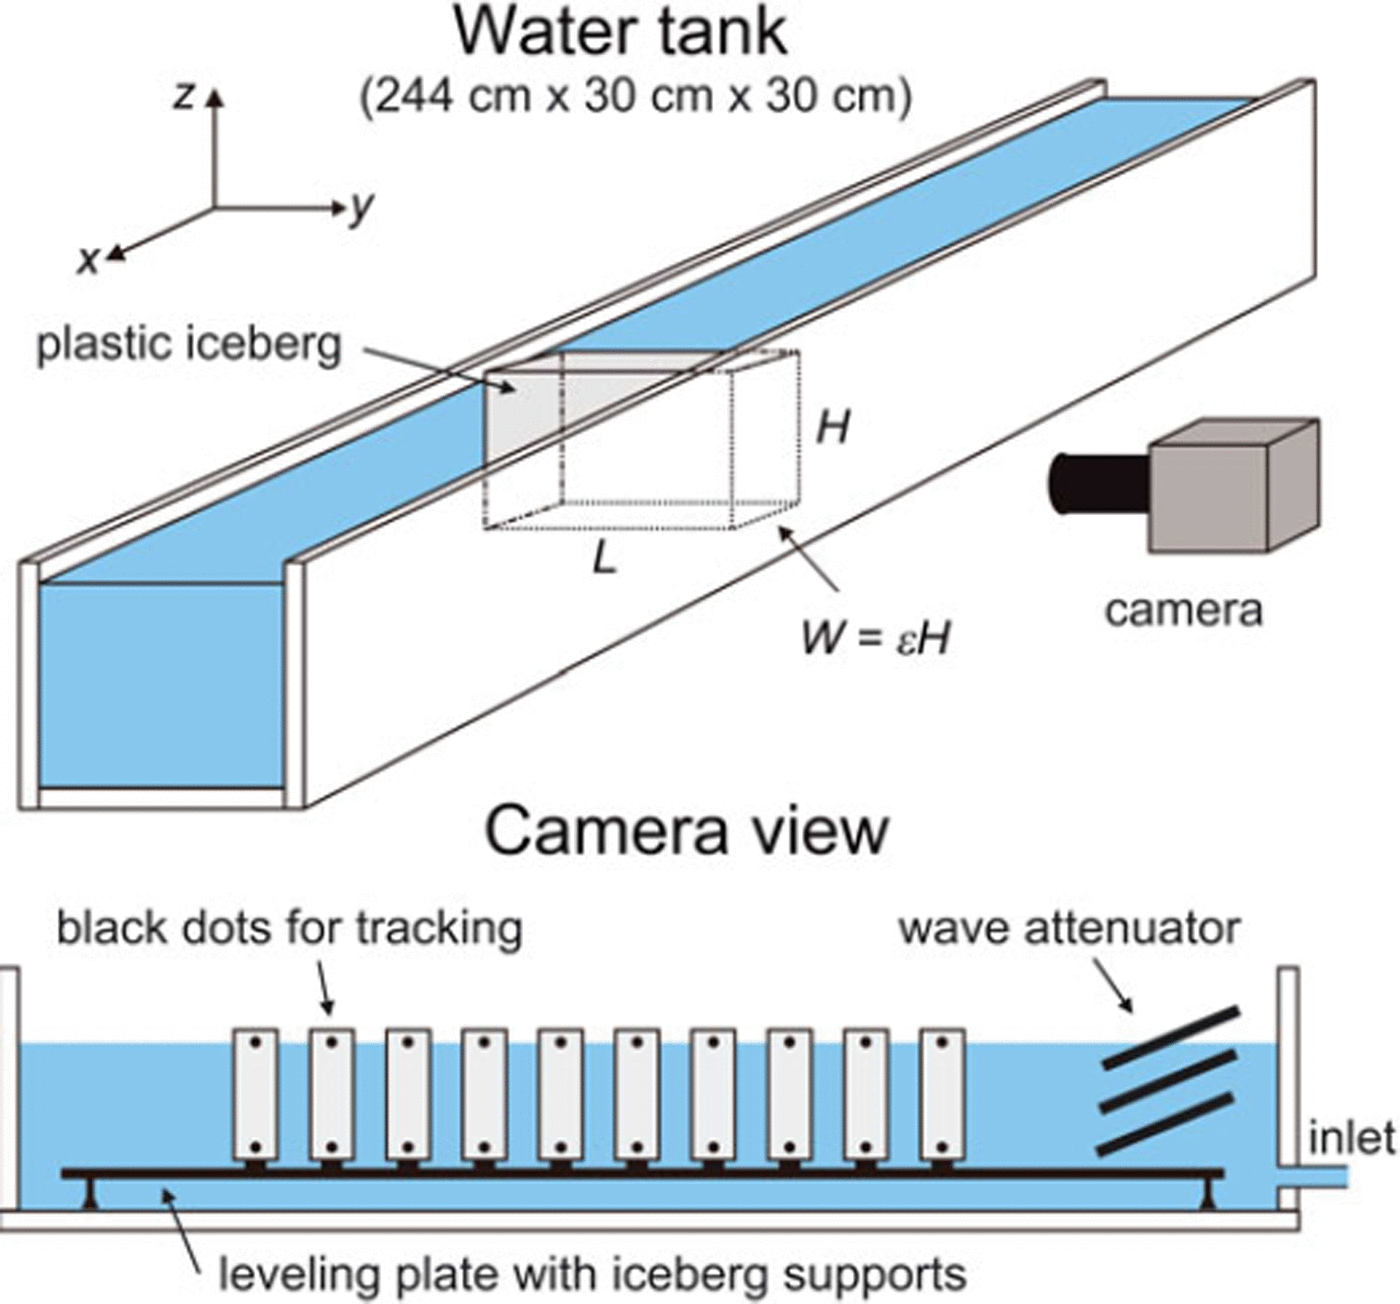
Multiple plastic icebergs, with density ρi = 920 kg m- 3 , were placed on aluminium supports to stabilize their position in the tank while the tank was filled with water, and to fix their positions over multiple experiments. The supports were attached, using thumbscrews, to an aluminium positioning plate which could be levelled using adjustable feet. A wave attenuator (Reference Cho and KimCho and Kim, 2008) was placed at the inlet side of the tank in order to damp out tank sloshing modes, generated by filling the tank or by the subsequent uplift of the icebergs from the aluminium support. After installation of the attenuator, identical experiments showed that the icebergs would capsize in either direction (clockwise or counterclockwise) equally, indicating a negligible effect from the quiescent wave field in the tank. For each experiment, fresh water at room temperature (density ρw = 997 kg m- 3 ) slowly filled the tank, so that the change in water level was ∼0.5 cm min- 1 . Eventually the icebergs became buoyant, separated from their basal support, and commenced to spontaneously capsize due to gravitational instability (Reference BurtonBurton and others, 2012). Using this method to initiate the capsize of multiple icebergs precluded the study of variable water depth in these experiments, although experiments reported by Reference BurtonBurton and others (2012) for the capsize of a single iceberg showed a weak dependence on water depth.
The pre-capsized vertical dimension for all icebergs used in the experiments was H = 10.3 cm and the length of all icebergs in the direction of the short axis of the tank was L = 26.7 cm Three different aspect ratios, ε = W/H, where W is the pre-capsized iceberg width in the direction of the long axis of the tank, were used for the rectangular icebergs (Fig. 2): ε = 0.25, 0.375 and 0.5. The number of icebergs, N, was varied between 1 and 10, and the spacing between adjacent icebergs, S, was varied from 1.25 to 24 cm, so that S/H varied from 0.12 to 2.33. The capsize process was filmed at 30 frames per second using a digital camera (Casio EX-FH20). Black sticker dots were placed on the icebergs so that their angle of orientation and centre-of-mass position (both vertical and horizontal) could be identified in each video frame.
The potential energy released during the capsize of multiple icebergs,  , is simply the number of icebergs multiplied by the energy released for a single iceberg (Reference MacAyeal, Abbot and SergienkoMacAyeal and others, 2011; Reference BurtonBurton and others, 2012):

where g is acceleration due to gravity. From Eqn (1), we see that has a maximum when ε = 1/2. However, spontaneous capsize can only occur when the iceberg is sufficiently thin, when ε is smaller than the critical value, εc (Reference MacAyeal, Scambos, Hulbe and FahnestockMacAyeal and others, 2003; Reference BurtonBurton and others, 2012):
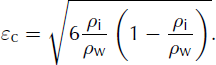
For icebergs in salty ocean water εc « 0.75, and for our plastic icebergs in fresh water εc « 0.65. A full discussion of dynamic similarity of the laboratory model to actual field conditions is provided by Reference BurtonBurton and others (2012). We note here that the Froude number is of order unity and comparable to field values; however, the Reynolds number for our laboratory model is ∼ 2 x 10⁴, while typical values in the field range from 108 to 1010.
Results
Figure 3 shows the basic difference between ‘uncoupled capsize’, where the capsize of each iceberg is essentially independent of the motion of its neighbours, and ‘cooperative capsize’, where capsize occurs in unison and in the same direction. As the spacing between the icebergs, S, becomes larger than the iceberg height, H, so that S/H ^ 1, icebergs begin to capsize in alternate directions. The capsize of one iceberg can still initiate the capsize of a marginally stable adjacent iceberg through radiated surface gravity waves; however, the resulting capsize dynamics are not coupled and are nearly identical to that of an isolated, single iceberg.
Video frames showing the two distinct modes of capsize with multiple icebergs. (a) Uncoupled capsize: when icebergs are placed sufficiently far apart (S/H 1) capsize proceeds without regard to the motion of adjacent icebergs, so that there is little hydrodynamic coupling between the icebergs. (b) Cooperative capsize: when icebergs are closely spaced (S/H 0.1), capsize always proceeds in the same direction (toward one or the other end of the tank) due to hydrodynamic coupling. In the cooperative scenario, icebergs typically collide before expanding horizontally, and rotational motion is slowed while translational motion is enhanced. The height of the pre-capsized icebergs in both sets of images is 10.3 cm.

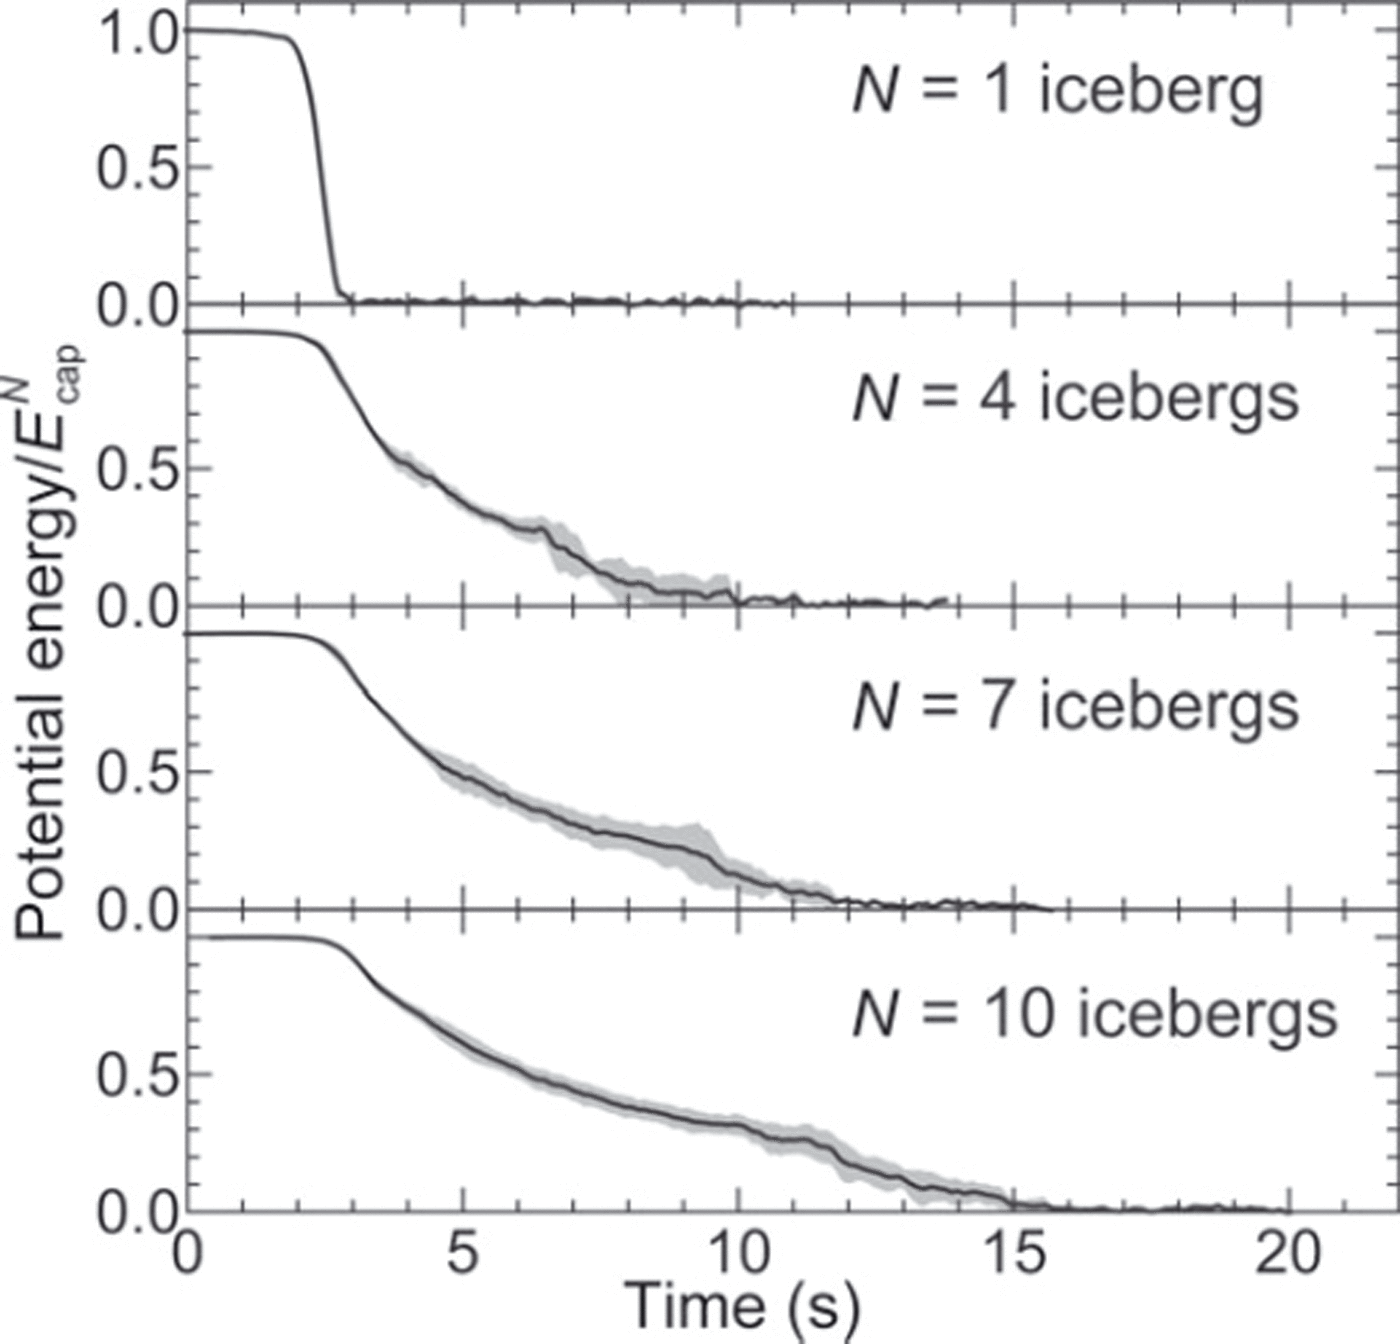
A quantitative analysis of the capsize process shows that cooperativity strongly affects the partitioning of potential energy into rotational and translational kinetic energies and dissipation. Figure 4 shows the potential energy vs time for the capsize of one, four, seven and ten icebergs. The potential energy is calculated using the method of Reference BurtonBurton and others (2012), where the volume of each iceberg is found using image analysis. The capsize process is very rapid for one iceberg; however, the timescale for the potential energy to decay to zero significantly increases with N. This result is due to two separate processes. First, as we show below, the cooperative capsize process is slower than the capsize of a single iceberg due to the required horizontal expansion of the system with larger N. Second, sometimes icebergs can get stuck on top of each other (i.e. rafting) for a short period of time, and then slip and complete the capsize process.
Potential energy of capsizing icebergs divided by . This ratio is equal to 1 when all the icebergs are upright, and 0 when all the icebergs have capsized. The aspect ratio of all icebergs was ε = 0.375 and the spacing between adjacent icebergs was kept fixed at S = 1.25 cm (S/H = 0.12). The solid line is the average of five experiments, and the grey band represents the standard deviation between the experiments. As the number of icebergs is increased, the time required to release all of the potential energy also increases.
The kinetic energy of a single capsizing iceberg is divided into three components,

where x and z refer to the horizontal and vertical directions (Fig. 2), and r refers to the rotational component. The expressions for the kinetic energies are
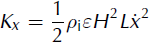
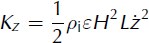

Here  and
and  are the velocities of the centre-of-mass, and
  is the angular velocity about the y-axis (perpendicular to image plane of the camera, Fig. 2). We have disregarded kinetic energy associated with motions in the y-direction because these are small. For the capsize of a single iceberg, the maximum value of Kr
is nearly three times larger than Kx + Kz, and has a large peak with a maximum at 1020% of
is the angular velocity about the y-axis (perpendicular to image plane of the camera, Fig. 2). We have disregarded kinetic energy associated with motions in the y-direction because these are small. For the capsize of a single iceberg, the maximum value of Kr
is nearly three times larger than Kx + Kz, and has a large peak with a maximum at 1020% of  (Fig. 5a; also Reference BurtonBurton and others, 2012), which will depend on the aspect ratio, e. After capsize, the iceberg translates horizontally and slows due to dissipation in the water. At moderate and high Reynolds number (Re ⪆ 104), the dissipation is due to turbulent drag. For larger values of N, the peak in Kr
is strongly suppressed, since the iceberg array must expand for the icebergs to fully rotate. This expansion also increases the timescale of the capsize process so that, for N ⨠ 1, we would expect a cooperative capsize process, where all the kinetic energy is in horizontal translational motion.
(Fig. 5a; also Reference BurtonBurton and others, 2012), which will depend on the aspect ratio, e. After capsize, the iceberg translates horizontally and slows due to dissipation in the water. At moderate and high Reynolds number (Re ⪆ 104), the dissipation is due to turbulent drag. For larger values of N, the peak in Kr
is strongly suppressed, since the iceberg array must expand for the icebergs to fully rotate. This expansion also increases the timescale of the capsize process so that, for N ⨠ 1, we would expect a cooperative capsize process, where all the kinetic energy is in horizontal translational motion.
Kinetic energy partitioning depends strongly on the number of coupled icebergs. (a) Rotational kinetic energy, Kr , vertical kinetic energy, Kz , and horizontal kinetic energy, Kx , as a function of time for different numbers of capsizing icebergs. All energies are scaled by the total gravitational energy available to the system, EcNap. Each curve is the average of five experiments, and the grey band represents the standard deviation between the experiments. For more than one iceberg, the spacing, S/H, was fixed at 0.12, so the motion of the icebergs was strongly coupled. (b) Ratio of time-integrated kinetic energies. Error bars (not visible on some points) represent one standard deviation of variation between the five experiments. The dashed, black curve represents the prediction from the model (Eqn (10)).
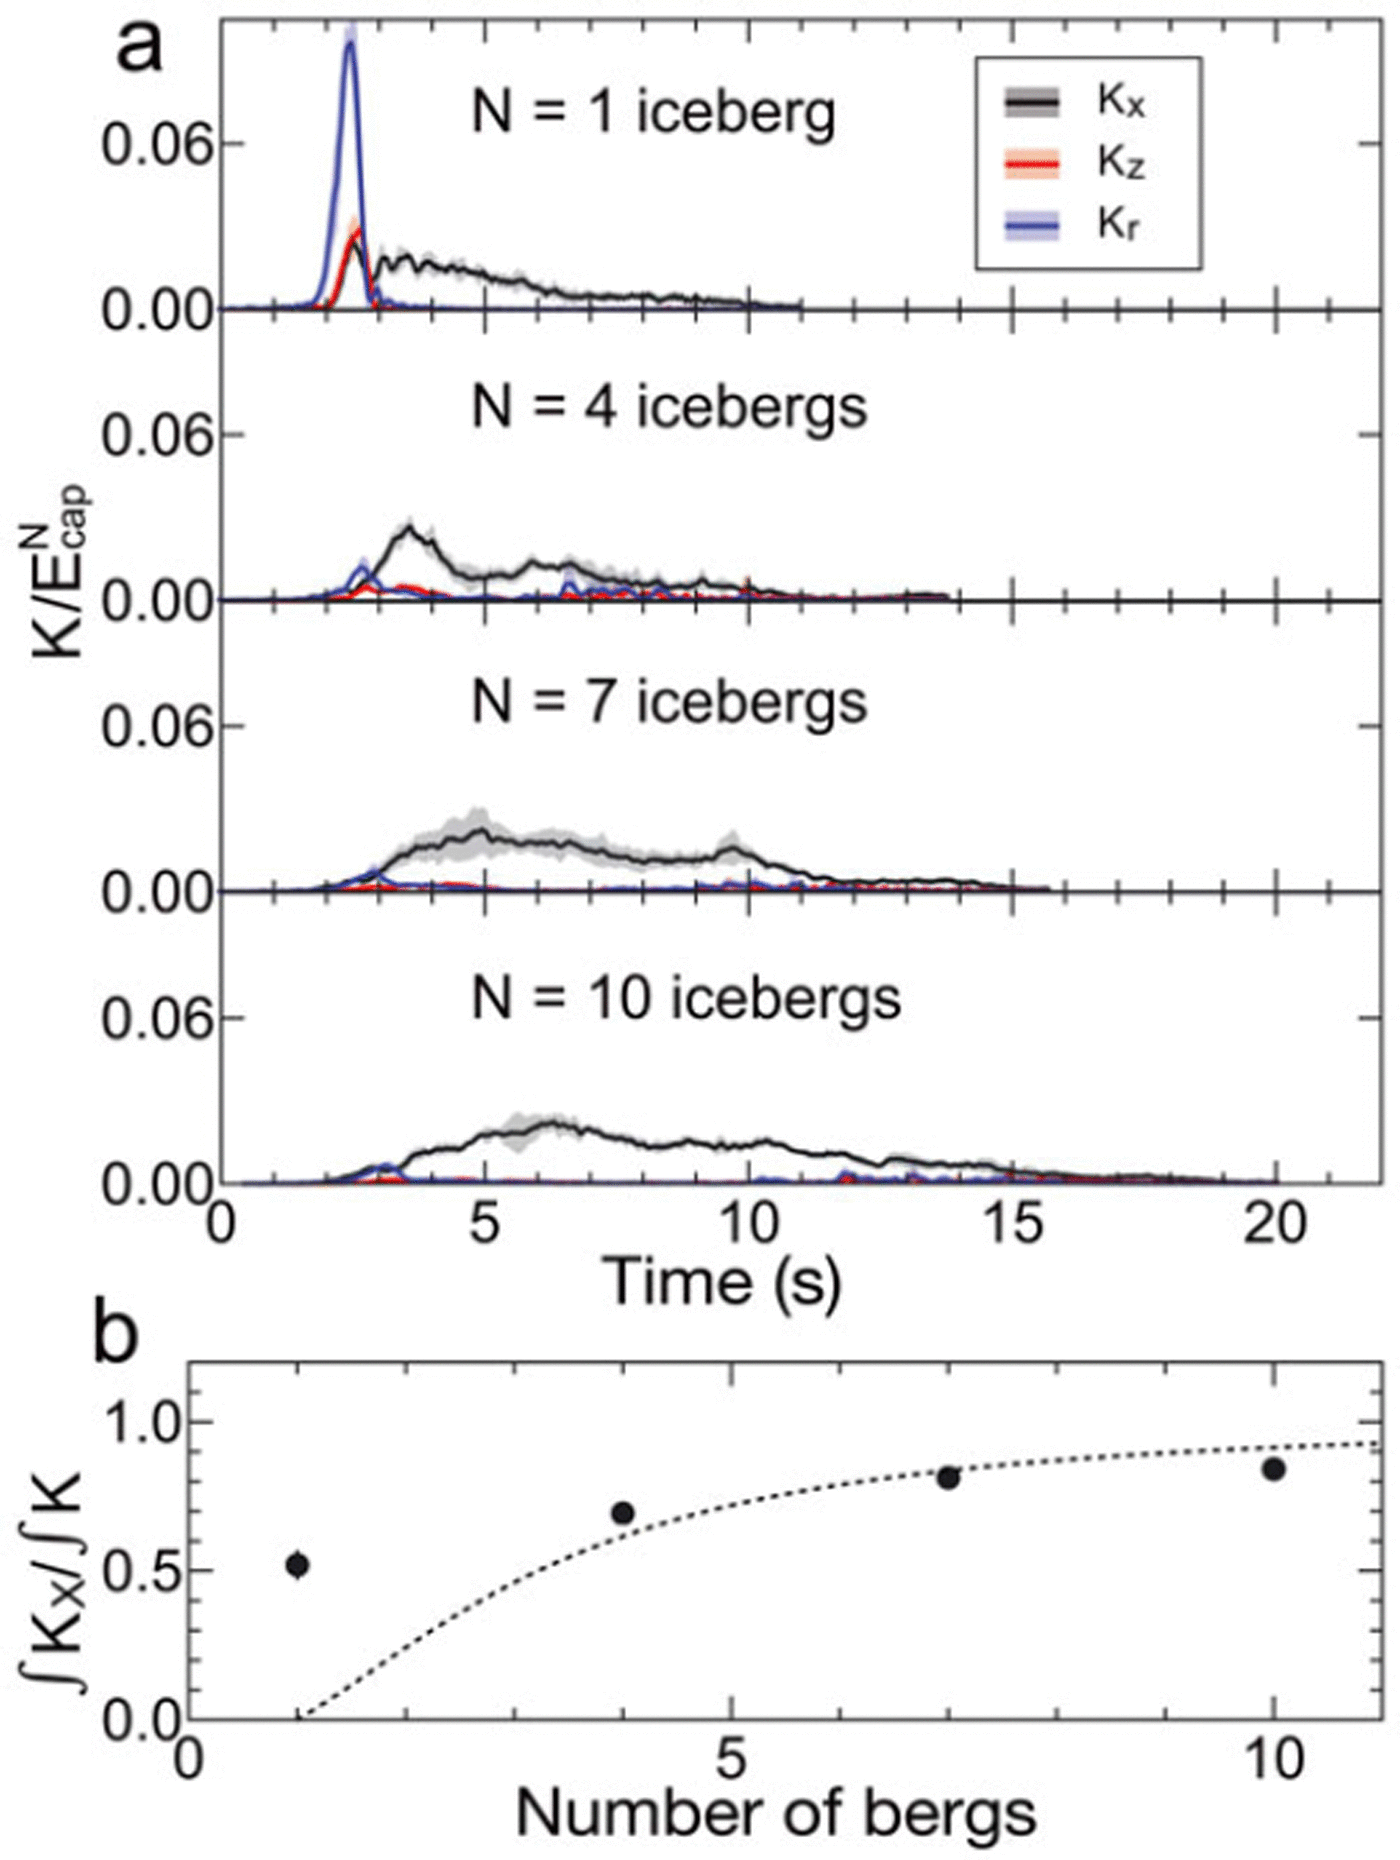
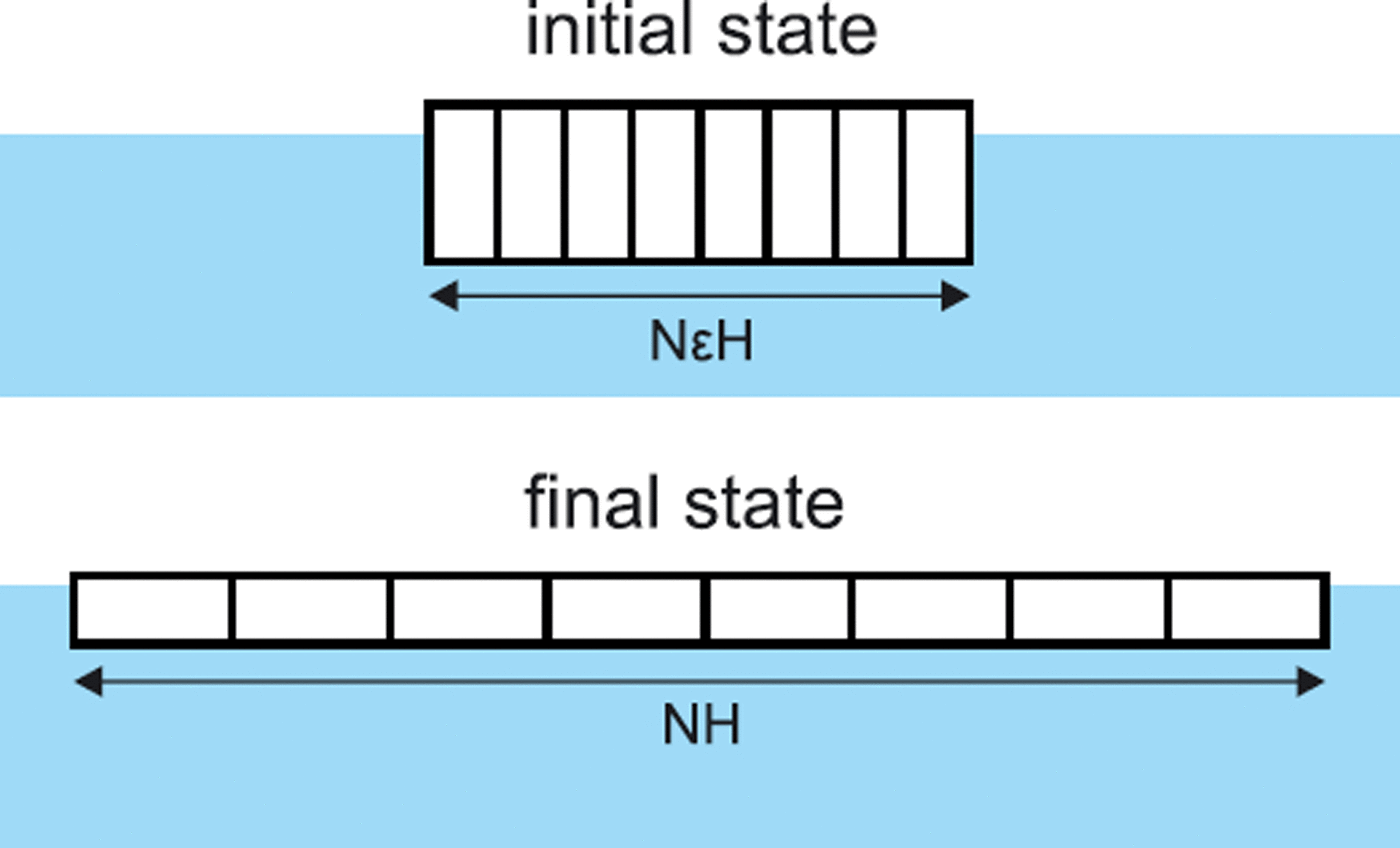
Figure 5b shows the ratio of the time-integrated translational kinetic energy, ʃ Kxdt, with respect to the time-integrated total kinetic energy, ʃ Kdt. This is computed by calculating the area under the curves in Figure 5a. For N = 1, the ratio is 0.5, while for N = 10 it is 0.84; thus Kx constitutes a greater fraction of the total kinetic energy as N is increased. The dependence on N can be calculated from a simple geometrical argument. If we consider a system of N icebergs that quasi-statically transition between initial and final states while maintaining hydrostatic equilibrium, as depicted in Figure 6, then the overall displacement of the centre-of-mass Δz and Δx, and the angular displacement, Δ9, can be analytically calculated for each iceberg. The total angular displacement for a rectangular iceberg is

The vertical displacement can be computed by equating gravitational and buoyancy forces in the pre-capsized and capsized states:
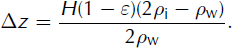
In the horizontal direction, however, the displacement will depend on the iceberg’s initial position in the array, so that

where d is the initial distance of each iceberg’s centre-of-mass from the centre of the array, as shown in Figure 6.
Schematic of the capsize of multiple icebergs. The initial and final positions can be calculated exactly, so we may estimate the ratio of kinetic energies in Eqn (10).
From these displacements, the velocities and kinetic energies can be computed. Let us assume that the transition from the initial to the final state occurs over a timescale T, so that  ,
,  and
and  . By plugging these velocities into Eqns (4-6) and summing over N icebergs, we obtain the following expression for the fraction of time-integrated kinetic energies:
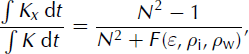
where the n on-dimensiona l function, F, is independent of N:

The value of F is larger than unity, and F 8.35 for the dashed curve shown in Figure 5b, which is in reasonable agreement with the data for N > 1. Thus for many icebergs, geometry requires that a large horizontal expansion must occur during cooperative capsize, so that nearly all kinetic energy is Kx.
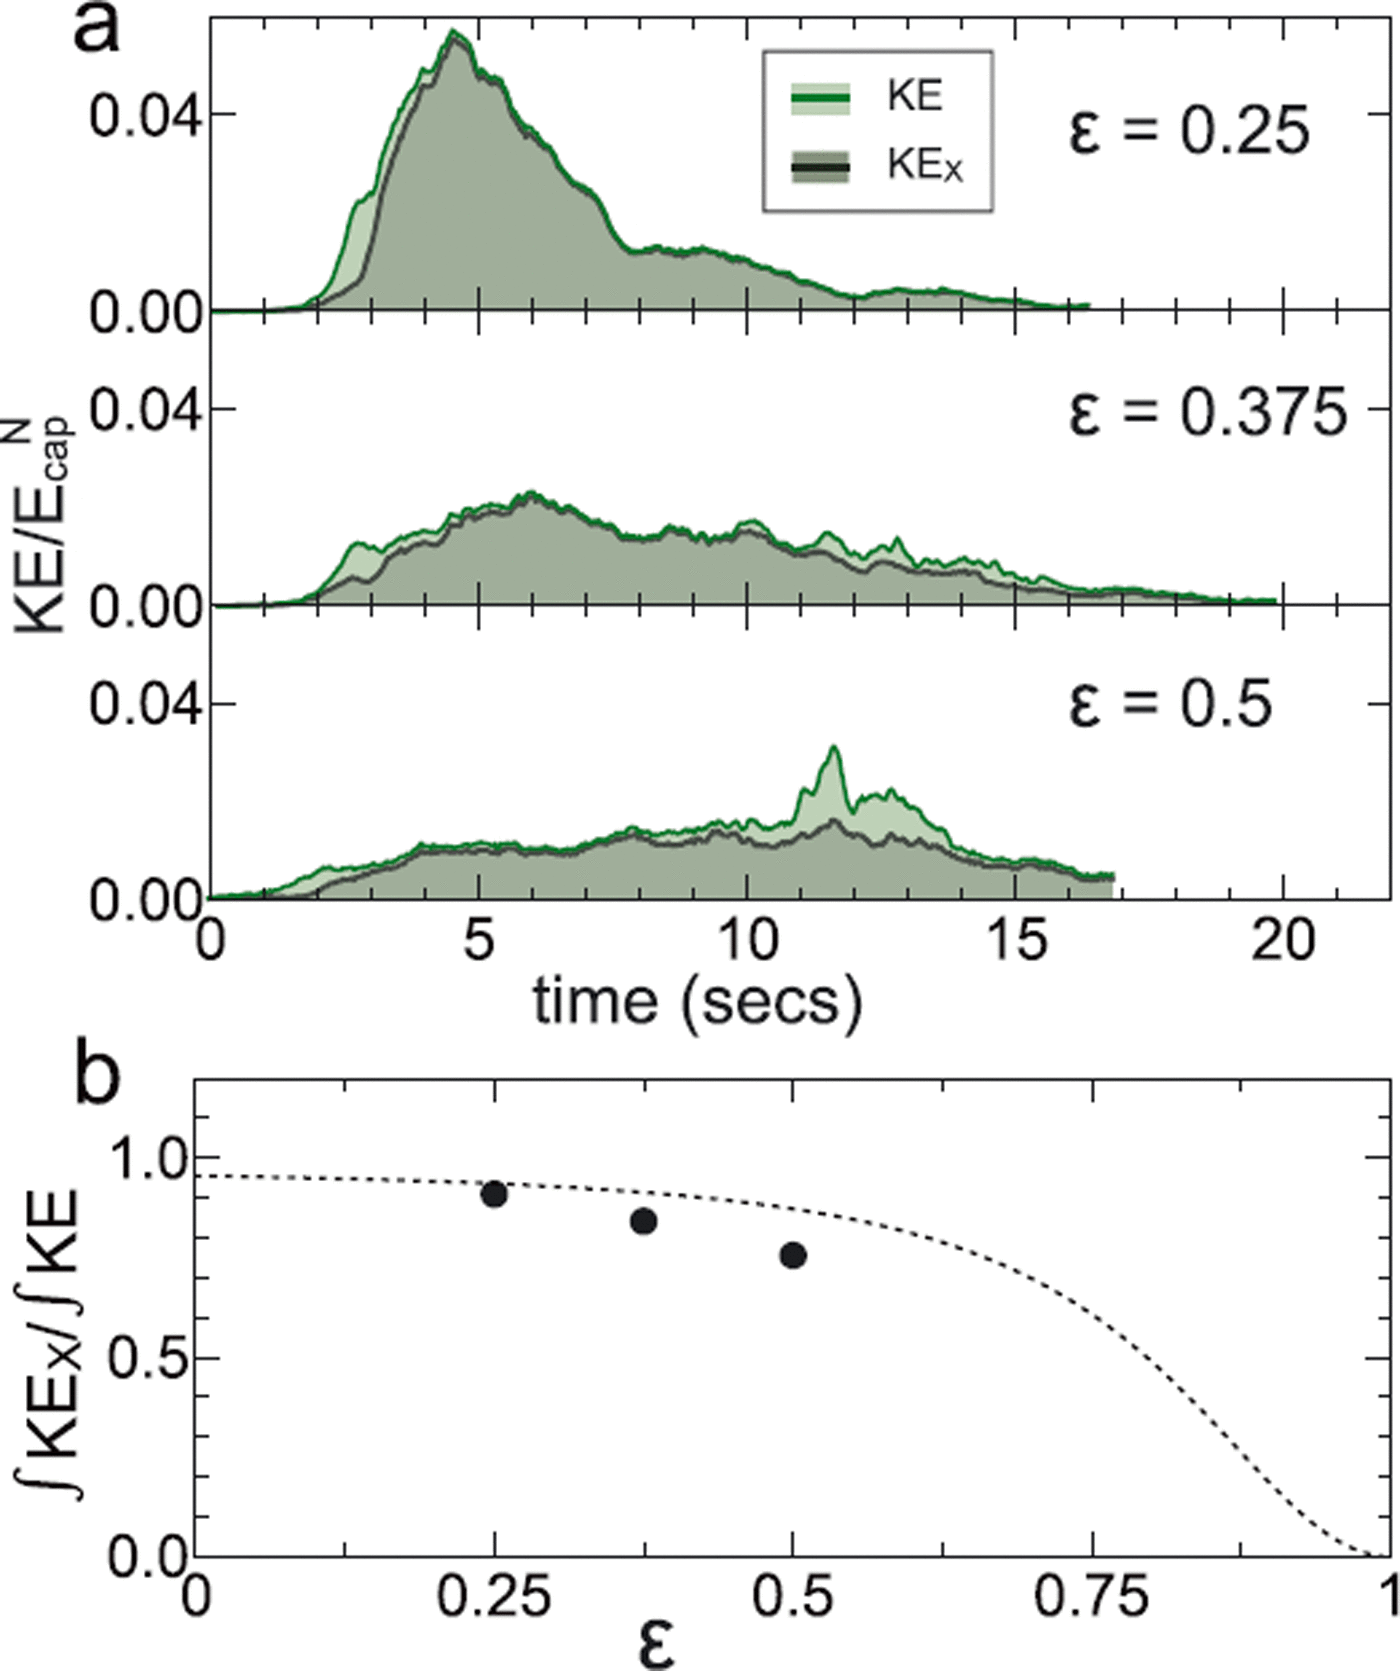
The amount of coupling between icebergs will necessarily depend on their initial geometry. Our simple geometric argument from Figure 6 indicates that the iceberg aspect ratio, e, should have a significant effect. The horizontal extent of the post-capsized icebergs is much greater than that of the pre-capsized state when e is small, thus the translational velocities will be correspondingly larger. Figure 7a shows Kx and K for three different aspect ratios: e = 0.25, 0.375 and 0.5. Icebergs that capsize cooperatively with e = 0.25 have a much larger peak in translational kinetic energy than those with larger e. The ratio of time-integrated kinetic energies, / Kx dt/ J K dt, is plotted as a function of e in Figure 7b. The trend agrees qualitatively with the model results, confirming that small e increases the fraction of horizontal kinetic energy.
(a) Horizontal translational energy, Kx, and total kinetic energy, K, for three different values of ε. Each panel shows the average of five experiments with ten icebergs at a spacing S/H = 0.12. The filling provides a visual indication of the fraction of total area represented by Kx, which is plotted in (b). This fraction increases for smaller ε, in agreement with the model (Eqn (10), dashed curve).
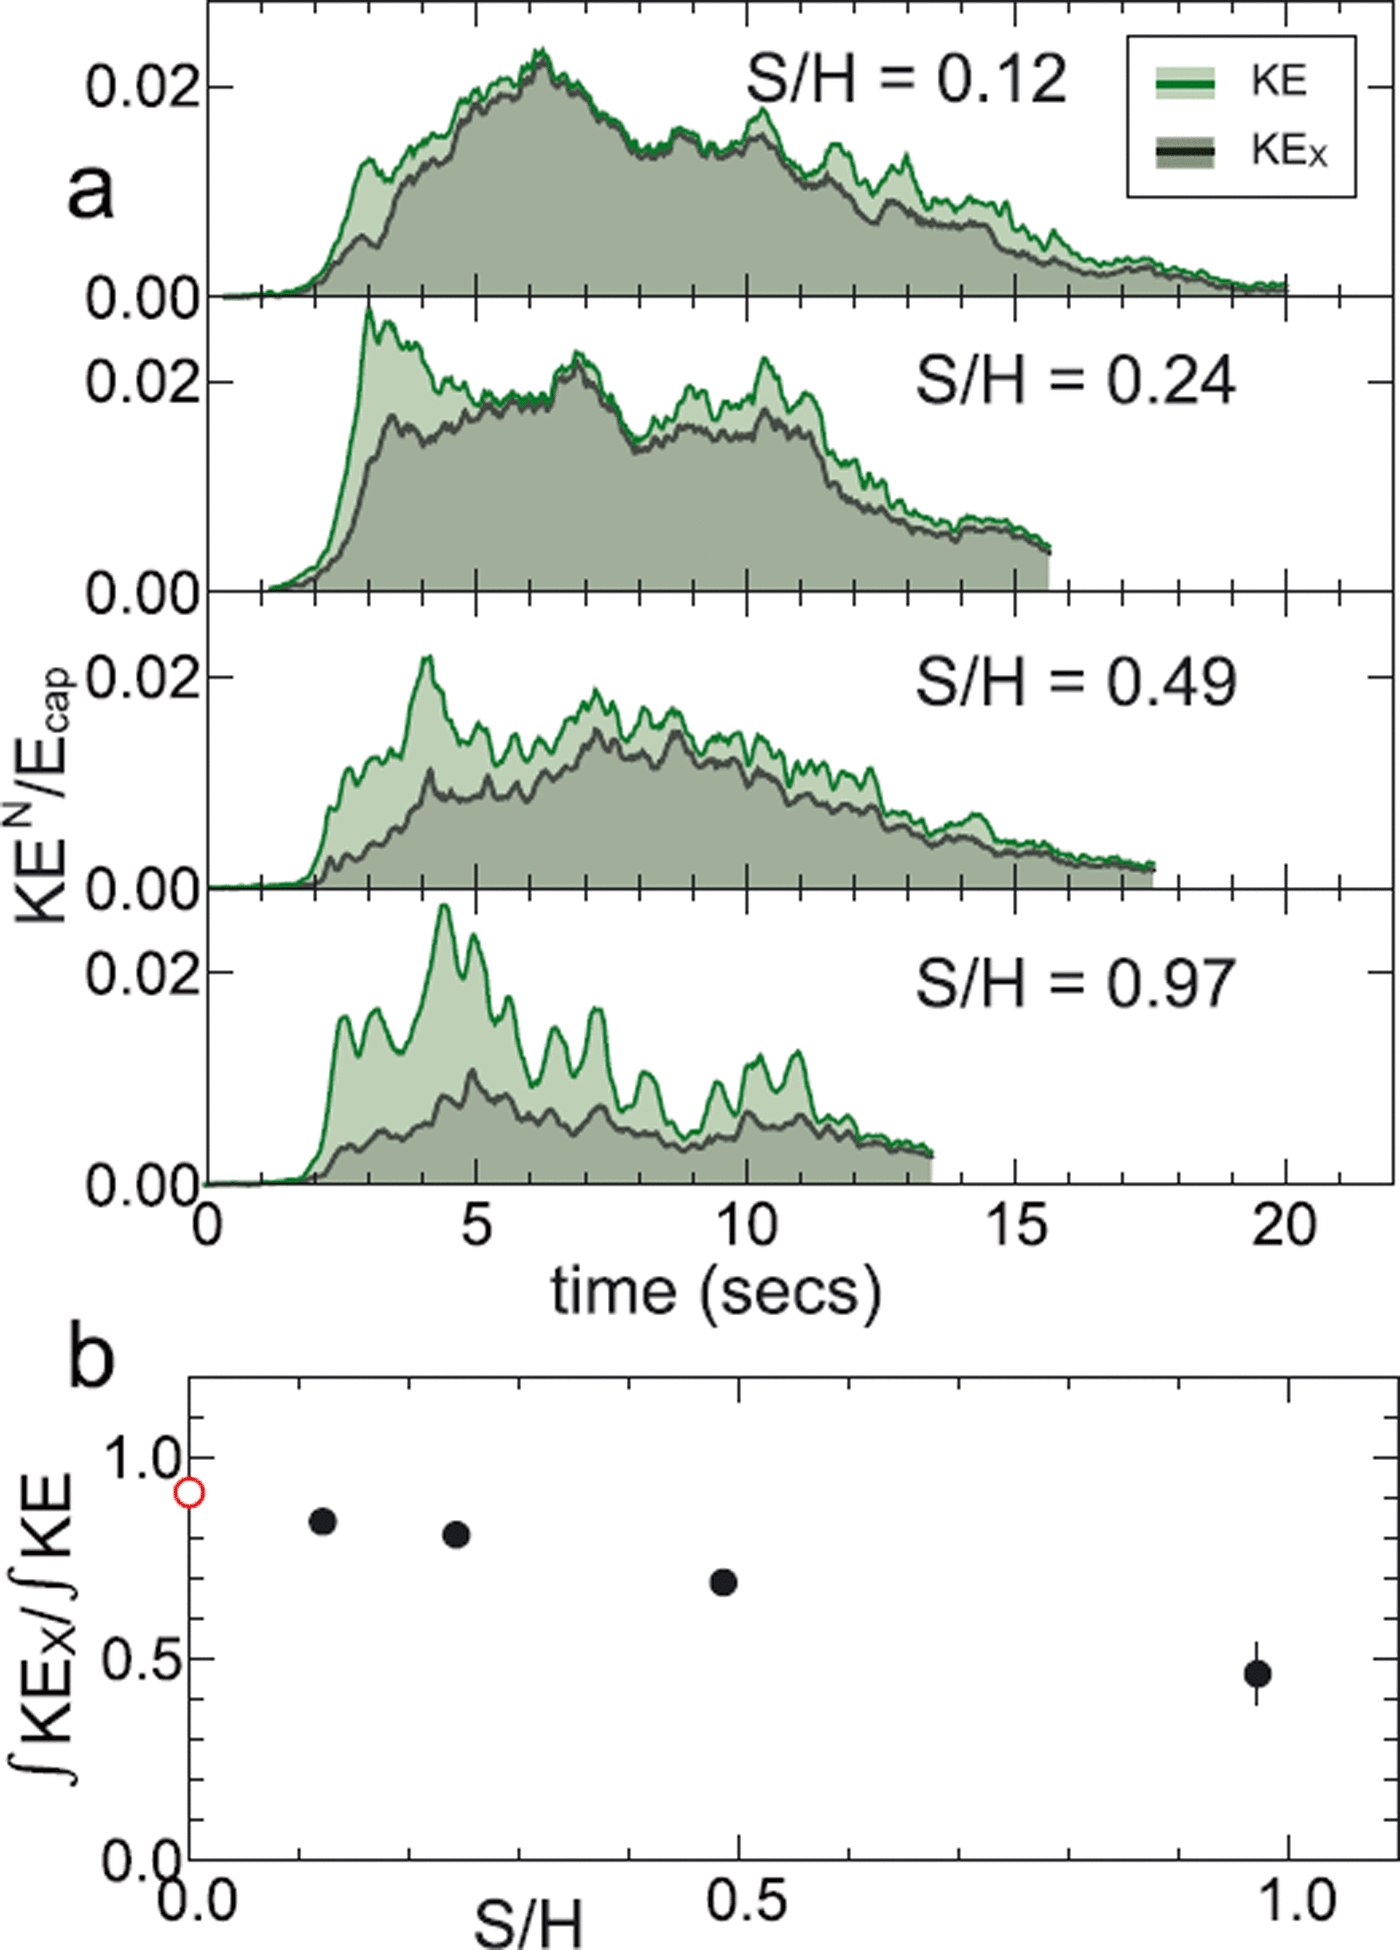
However, the model assumes that the spacing, S, between the icebergs is zero. When the spacing between the icebergs is too large, they will no longer be coupled by hydrodynamic pressure. Figure 8a shows Kx and K for four different values of S/H, the spacing normalized by the height of the icebergs. The number of icebergs is N = 10 and the aspect ratio is held fixed at e = 0.375. As S/H is increased, the icebergs no longer capsize cooperatively, and ʃ Kx dt/ J K dt decreases to its value for N = 1 (Fig. 5b). The open red circle on the graph represents the prediction of Eqn (10), which assumes S/H = 0.
(a) Horizontal translational energy, Kx, and total kinetic energy, K, for four different values of spacing, S/H. Each panel shows the average of five experiments with ten icebergs with an aspect ratio ε = 0.375. The filling provides a visual indication of the fraction of total area represented by Kx, which is plotted in (b). This fraction increases for smaller S, showing that cooperative capsize enhances the translational kinetic energy. Error bars (not visible on some points) represent one standard deviation of variation between the five experiments. The open red circle shows the model prediction (Eqn (10)), which assumes S/H = 0.
Finally, we explored the effects of cooperative capsize near a rigid wall, which is intended to represent a glacier terminus. Figure 9a shows the geometry. The major difference when compared to capsize in an open ocean is that expansion can occur only in one direction, which results in a slower capsize process. Figure 9b shows Kx for the capsize of N = 10 icebergs with and without the rigid wall. We can also compute the ratio of time-integrated kinetic energies in the presence of the wall, the difference being that the origin where the velocity is zero is not in the centre of the array of icebergs, but at the wall. The result is
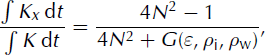
where the function G is

(a) Contrasting experimental set-ups, with and without a rigid wall. (b) Comparison of horizontal kinetic energies, Kx, during the cooperative capsize of N = 10 icebergs with S/H = 0.12 and ε = 0.375. The blue curve is from Figure 5a, and the red curve is the result when icebergs are capsizing in the presence of a fixed wall on one side, such as a glacier terminus. The capsize process takes longer in the latter case, because expansion of the array can only occur in one direction.
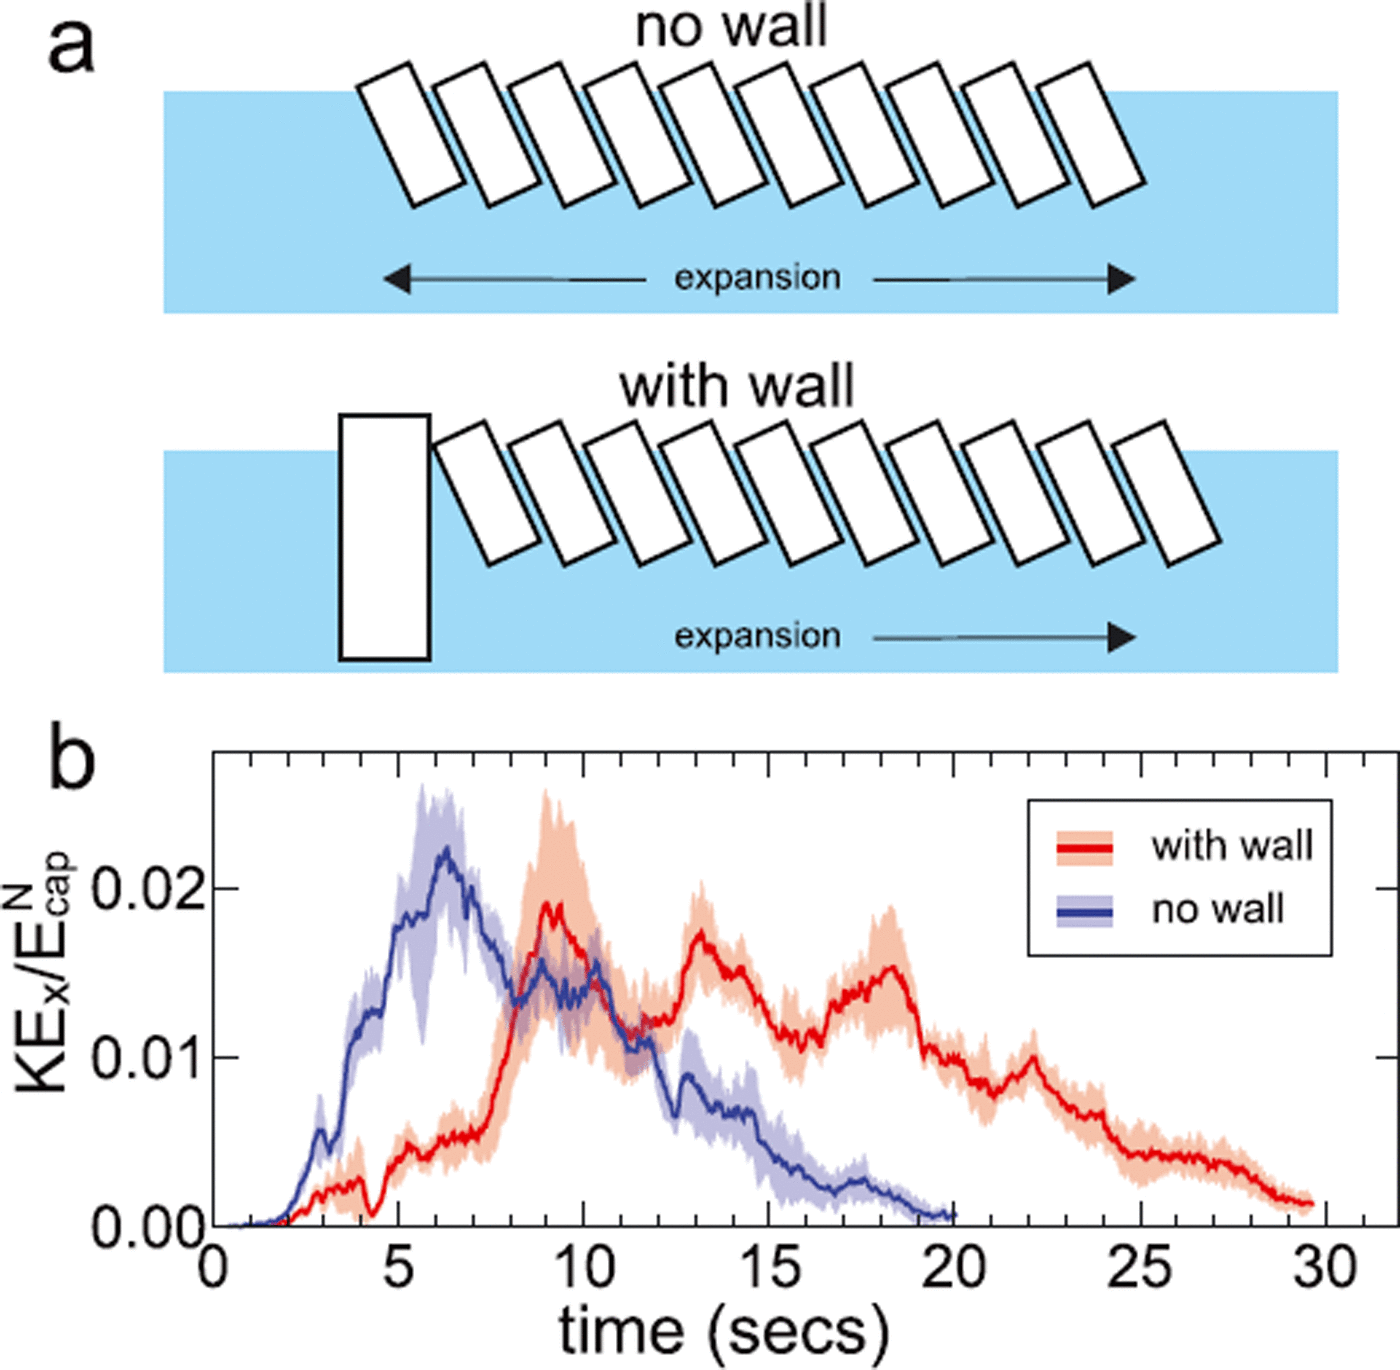
Our measurements for ten icebergs with e = 0.375 give a time-integrated kinetic energy ratio of ∼0.84 without a wall and ∼0.89 with the wall. Without a wall, the model (Eqn (10)) predicts 0.91, and with the wall (Eqn (12)) the prediction is 0.99. Although our measurements are systematically lower for these parameters, the model captures the essential result implied by the analysis that more energy is partitioned into Kx when the expansion in constrained by a rigid boundary.
Discussion
The laboratory model and experiments presented here were primarily motivated by two observations. First, analysis of satellite observations shows long, rectangular slabs of ice with e < 1 that break apart and capsize during ice-shelf disintegration (Reference MacAyeal, Scambos, Hulbe and FahnestockMacAyeal and others, 2003; Reference ScambosScambos and others, 2009). This process occurs mostly in one direction, driving a rapid expansion of the ice shelf into the ocean. Second, results from our previous experiments with single icebergs highlighted the importance of hydrodynamics and drag forces during iceberg capsize (Reference BurtonBurton and others, 2012). Although our small-scale, highly idealized experiment uses rectangular blocks in a two-dimensional geometry, the results provide some insight into Antarctic ice-shelf collapse. The mechanism of cooperative capsize, i.e. coupling of the hydrodynamic pressure between adjacent icebergs, exists even when the aspect ratio is varied over a wide range. In addition, the spacing between icebergs can be a reasonable fraction of the height (S/H « 0.5) and still display significant coupling and cooperation.
A direct, quantitative comparison of our laboratory results to Antarctic ice shelves is difficult, due to our highly idealized conditions. Due to the disparity of length and velocity scales, the Reynolds number is orders of magnitude larger in the field. This means that hydrodynamic effects can potentially be quite different to those in the laboratory model. However, we have previously verified that turbulent drag forces are significant at the scale of our model (Reference BurtonBurton and others, 2012), and they will certainly be significant on the scale of actual icebergs. In our geometric, toy model, all displacements (Δx, Δ z and Δ0) are coupled by the close-packed geometry, and the only adjustable parameter is the timescale, T, of the capsize process. Equations (10) and (12) involve ratios of kinetic energies, so T is eliminated from the problem. Thus the enhancement of the translational kinetic energy, Kx, is a general feature which does not depend on the detailed forces and interactions between icebergs, and the huge disparity in the Reynolds number is unimportant.
Also, during an actual collapse event, we do not expect the entire shelf to behave as one large wall of ‘dominoes’, capsizing in unison. Rather, we speculate that isolated domains of ice-shelf fragments may capsize and break apart in a cooperative manner, with each domain adding to the expansion of the melange. Unfortunately, the time intervals between satellite images and their spatial resolution do not allow for such a detailed account of the post-collapse evolution. Nevertheless, the resulting areal change of the iceberg plume from the satellite measurements (e.g. 1600 → 5150 km2 for Larsen B) is consistent with our model, which predicts a lower bound for the change in area prior to dispersal by winds and ocean currents. For N identical icebergs with aspect ratio ε, the fractional change in area is (1 — ε)/ε. Actual areal changes will be larger, because not every iceberg capsizes (ε > εc), and icebergs are not likely to remain closely packed (S = 0) after the capsize process.
Conclusions
We find that when iceberg spacing is comparable to the height of the icebergs (S/H « 1), hydrodynamic coupling favours a simultaneous, cooperative capsize in the same direction. This process strongly affects the partition of potential energy into rotational and translational kinetic energy, as well as the timescale for energy dissipation into the water. For many icebergs that are closely spaced, the kinetic energy is dominated by the horizontal translational component, providing a sustained velocity that drives the expansion of the ice melange. We hypothesize that hydrodynamic coupling leading to cooperative capsize plays an important role in the post-collapse rapid expansion of disintegrating Antarctic ice shelves.
Acknowledgements
This work is supported by the US National Science Foundation under grants ANT-0944248 and NSF-PREM DMR-0934192. The Fultz family and N. Nakamura provided access to laboratory facilities where the experiments were conducted. We thank D.S. Abbot, J.M. Amundson, K.N. Darnell, W.W. Zhang, S. Correa-Legisos, O. Sergienko and A. Boghosian for assistance and helpful discussions. We also thank two anonymous reviewers for their comments. We are particularly indebted to D.R. MacAyeal for insightful comments on the manuscript.



