


Sucralose (1,6-dichloro-1,6-dideoxy-β-d-fructofuranosyl-4-chloro-4-deoxy-α-d-galactopyranoside) is a non-energy artificial sweetener (NAS) synthesised by the selective halogenation of sucrose(Reference Magnuson, Carakostas and Moore1). Approved by the Food and Drug Administration for use in humans, it is 600 times sweeter than sucrose. Due to its low production cost, high thermostability and solubility, sucralose has emerged as an important sugar substitute in foods and drinks. The acceptable daily intake (ADI) of sucralose has been established at 15 mg/kg body weight(Reference Martyn, Darch and Roberts2).
The concept that replacing sucrose with NAS in foods and drinks improves metabolic control has been challenged(Reference Shearer and Swithers3). In mice, sucralose added to drinking water for 11 weeks impaired oral glucose tolerance when compared with water alone or water with sucrose or glucose(Reference Suez, Korem and Zeevi4). Such deleterious effect was prevented when mice were treated with broad-spectrum antibiotics against Gram-negative or Gram-positive bacteria. The fact that sucralose displays bacteriostatic action on several gut microbes(Reference Omran, Ahearn and Bowers5,Reference Wang, Browman and Herzog6) , and that most of the sucralose is not absorbed in the intestine(Reference Magnuson, Carakostas and Moore1,Reference Sylvetsky, Bauman and Blau7,Reference Roberts, Renwick and Sims8) , gives support to observations showing that sucralose can alter gut microbiome composition(Reference Wang, Browman and Herzog6,Reference Rodriguez-Palacios, Harding and Menghini9) . Taken together, the notion that sucralose influences glucose control through alterations in intestinal microbiota has emerged.
In humans, consumption of high doses of sucralose for 3 months has been assessed in non-diabetic(Reference Grotz, Pi-Sunyer and Porte10) and type 2 diabetic(Reference Grotz, Henry and McGill11) individuals. Those studies showed no influence of sucralose on glycaemic control when compared with placebo. However, between-subject variability in given markers of glycaemic control appears higher after sucralose v. placebo, particularly in non-diabetic individuals. Eventually, the glycaemic response to sucralose in humans, as in mice, is also mediated through changes in gut microbiota(Reference Lobach, Roberts and Rowland12).
Considering the relevance of chronic diseases and the wide availability of sucralose in foods and drinks, it is critical to determine the effect of sucralose on metabolic responses and the gut microbiome. The goal of the present study was to evaluate the short-term effect of sucralose on glycaemic control and its interaction with the microbiota in healthy subjects.
Methods
Subjects
The present study was conducted in accordance with the Declaration of Helsinki and approved by the Ethics Committee of the Faculty of Medicine, Pontificia Universidad Católica de Chile. All participants provided a written informed consent. Thirty-four healthy men between 18 and 50 years with stable weight (variation <2 kg in the last 3 months) and BMI between 20 and 30 kg/m2 were recruited. None of them carried out intense physical activity regularly or received any drug treatment during the last 3 months. The fulfilment of all the inclusion criteria was evaluated in an initial screening, and individuals not meeting the requirements were excluded. Only males were included in order to avoid potential menstrual cycle-related changes in insulin sensitivity.
Study design
A parallel, double-blind, placebo-controlled study was performed. Selected participants were requested to fast overnight and instructed to avoid intense physical activity the day before the evaluation, in addition to smoking, alcohol and energy drinks consumption 12 h previous to the evaluation. On the evaluation day, subjects were requested to bring or collect in the clinical facility a faecal sample in a 15-ml anaerobic container. The faecal sample was immediately stored at −80°C for gut microbiome analysis. Body weight was measured followed by the insertion of an intravascular cannula in a peripheral vein of the arm. After resting for 30 min, two 10-min apart blood samples were taken followed by the administration of an oral glucose load (75 g in 290 ml solution). Blood samples were obtained after 30, 60, 90 and 120 min of glucose ingestion. Once finished this procedure, volunteers were randomly assigned to an intervention group with sucralose (n 17) or placebo (n 17). For this we used an online resource (https://www.randomizer.org/). Randomisation was conducted by one of the members of our group. This person was not involved in recruiting, selecting or performing any of the measurements of the present study, and broke the labels after data analysis. Four subjects did not finish the study, resulting in sixteen subjects in the sucralose group and fourteen in the placebo group. Individuals were instructed to ingest one capsule containing sucralose or placebo, three times a day for 7 d. Sucralose was purchased from VitaSweet. Each sucralose capsule contained 260 mg sucralose and 70 mg calcium carbonate; thus the three capsules consumed daily were equivalent to the 75 % of the acceptable daily intake(Reference Martyn, Darch and Roberts2) (15 mg/kg per d) of a subject weighing 70 kg. Each placebo capsule contained 250 mg of calcium carbonate. Each subject was instructed to register and report any adverse events. After 7 d, subjects were requested to attend the clinical facility to repeat the same procedures. Volunteers were instructed to record any adverse events or change in their customary diet.
Glucose and insulin tests
Plasma concentrations of glucose were determined by the glucose oxidase method, in a dry chemistry equipment (Vitros 4600, Ortho Clinical Diagnostics). Serum concentrations of insulin were quantified by a capture chemiluminescent immunoassay (Centaur XPT, Siemens). Insulin resistance was calculated as the homeostasis model assessment of insulin resistance index, using the formula by Matthews et al. (Reference Matthews, Hosker and Rudenski13): (fasting insulin (µU/ml) × fasting glucose (mmol/l))/22·5. Alternatively, the insulin sensitivity index (ISI)-composite was also determined, using the formula proposed by Matsuda & DeFronzo(Reference Matsuda and DeFronzo14): 10 000/(fasting glycaemia (mg/dl) × fasting insulin (µU/ml) × average glycaemia in the oral test (30–120 min) (mg/dl) × average insulin in the oral test (30–120 min) (µU/ml))0·5. Total AUC for insulinaemic and glycaemic responses were also calculated, using the trapezoidal rule(Reference Krzyzanski and Jusko15).
Statistical analysis
Clinical data were expressed as averages and standard deviations. Statistical analyses were run on SASv9.2 (SAS Institute). Subjects’ characteristics at screening were compared between groups using Student’s t test. Differences in the AUC for the glycaemic and insulinaemic responses were assessed through the Wilcoxon’s rank sums test and the Mann–Whitney U test. Differences in clinical variables before and after the intervention were determined using a repeated-measures ANOVA including group, time (repeated) and the group × time interaction. The significance level for all analyses was set at P <0·05.
Sample size
The sample size needed to detect a difference in glycaemia (i.e. mean of glycaemia between 30 and 120 min after oral glucose tolerance test) after 1-week sucralose ingestion was estimated from two 4-week apart oral glucose tolerance tests performed in healthy, young, non-obese individuals(Reference Galgani, Vasquez and Watkins16). Considering a within-subject standard deviation of ±11 mg/dl (0·61 mmol/l) as the expected variability without intervention, and a between-subject standard deviation of 21 mg/dl (1·17 mmol/l), fifteen subjects will allow detecting a difference of 13 mg/dl (0·72 mmol/l) in glycaemia after 1-week sucralose ingestion, with a power of 82 % for paired samples two-sided and significance level of 5 %.
Gut microbiome analysis
Faecal samples stored at –80°C were first thawed and 150 mg were used for total DNA extraction (Quick-DNA Fecal/Soil Microbe Miniprep Kit; Zymo Research) using a Disruptor Genie device (Scientific Industries)(Reference Medina, Pedreros and Turiel17). DNA samples were quantified (NanoDrop 2000c; Thermo Fisher Scientific USA) and diluted to 20 ng/µl in nuclease-free water (IDT). DNA samples were submitted for Illumina MiSeq sequencing at Integrated Microbiome Resource. The 16S rRNA gene V3-V4 variable region was amplified using V3-V4 primers(Reference Comeau, Douglas and Langille18), which also included a barcode in the forward primer. The DADA2 v1.10 R package was used to analyse the 16S rRNA gene sequences(Reference Callahan, McMurdie and Rosen19), following a modified procedure(Reference Callahan, McMurdie and Rosen19). Briefly, the sequences were filtered by quality and trimmed to remove the barcode and low-quality nucleotides prior to estimating the sequencing error. Then, sequences were denoised to identify Amplicon Sequence Variants(Reference Callahan, McMurdie and Holmes20), then merged and used to assign microbial taxonomy following a naïve Bayesian classifier(Reference Wang, Garrity and Tiedje21), employing the SILVA database version 132(Reference Quast, Pruesse and Yilmaz22,Reference Schweer, Parfrey and Quast23) . Raw data paired-end reads obtained from the MiSeq platform were stored in the European Nucleotide Archive database, under study accession number PRJEB27704.
Bioinformatic analysis
Microbiome composition similarity at phylum level was determined employing principal coordinates analysis with distances calculated with the weighted UniFrac method(Reference Lozupone, Hamady and Kelley24,Reference Lozupone, Lladser and Knights25) . The weighted UniFrac quantitatively estimates the β-diversity taking into account phylogenetic distances between microbial taxa and their relative abundance. The similarity between microbiome compositions was calculated with the unweighted pair group method with arithmetic mean algorithm. Fold changes in the relative microbiome composition at the phylum level (values after/before intervention), for each group of subjects and subgroups, were determined using the Mann–Whitney U test. The significance level for all analyses was set at P<0·05.
Results
Subjects characteristics at the screening
Age, weight and height were similar between groups (Table 1), while BMI was higher in the placebo compared with the sucralose group (P=0·04). Such difference in BMI was accompanied by higher blood cholesterol concentration (P<0·01), but similar blood glucose concentration (Table 1).
Clinical parameters at screening
(Mean values, standard deviations and ranges)
* To convert glycaemia in mg/dl to mmol/l, multiply by 0·0555. To convert cholesterol in mg/dl to mmol/l, multiply by 0·0259.
Metabolic responses to sucralose
Body weight remained stable throughout the study, with an average change of 0·16 (sd 0·74) kg (P=0·44) and 0·21 (sd 1·17) kg (P=0·49) in the placebo and sucralose groups, respectively. Volunteers in the placebo and sucralose groups did not report adverse events or changes in their usual dietary pattern. As observed at screening, fasting plasma glucose concentration was similar between groups and not affected by the consumption of placebo or sucralose (Table 2). In turn, a borderline higher fasting serum insulin concentration was observed in the placebo v. sucralose group (P=0·07; Table 2). Similar to fasting plasma glucose, consumption of sucralose or placebo did not affect fasting serum insulin concentration (Table 2).
Metabolic response to intervention
(Mean values and standard deviations)
HOMA-IR, homeostasis model assessment of insulin resistance; ISI, insulin sensitivity index.
* Calculated as values after minus before intervention.
† To convert glycaemia in mg/dl to mmol/l, multiply by 0·0555.
‡ Mean of the respective response over the 30–120 min period after glucose ingestion.
Upon glucose ingestion, the average glycaemic and insulinaemic responses were similar between groups and not affected by the consumption of sucralose or placebo (Table 2). Regarding insulin resistance (sensitivity) markers, no differences by group and intervention were detected (Table 2).
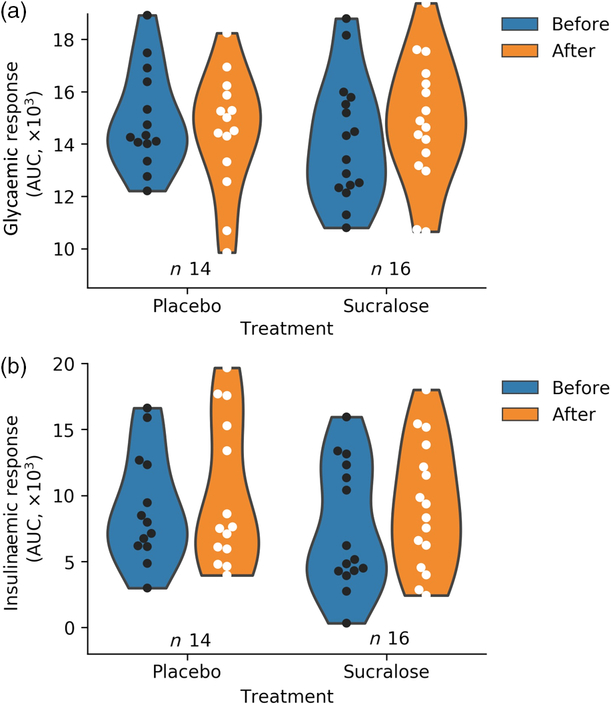
One further assessment included the analysis of the changes in the aforementioned variables after both interventions. Consistent with ANOVA, none of the changes was different from zero (Table 2). We calculated the AUC for glycaemic and insulinaemic responses for each subject (Fig. 1). This analysis did not show alterations in glycaemia or insulinaemia in any group.
Changes in metabolic responses upon oral glucose consumption before and after the intervention. (a) Total glycaemic AUC for each group (P = 0·57); (b) insulinaemic total AUC (P = 0·73). Subjects with insufficient data to calculate the AUC were not included. The kernel density estimation shows the probability of the values.
Changes in gut microbiome composition
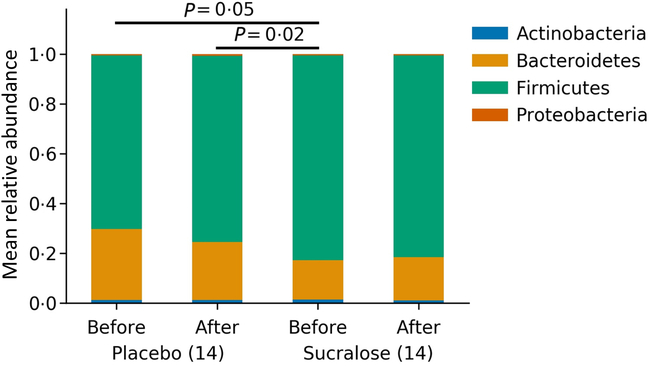
The gut microbiome of all subjects in each group, both before and after the 7-d intervention period, was analysed. As expected, the Firmicutes and Bacteroidetes phyla were dominant in the microbiome of these subjects (online Supplementary Fig. S1). Smaller representations of Actinobacteria, Verrucomicrobia and Proteobacteria were also observed. On average, a higher relative abundance of the Firmicutes phylum in the placebo v. sucralose group was observed before initiating the treatments (Fig. 2). However, microbiome composition remained stable throughout in both interventions (Fig. 2).
Gut microbiome compositions for each group before and after each treatment. Bars show the average relative abundance of the four dominant phyla of the human gut microbiome.
We performed a principal component analysis to identify variations in the gut microbiome composition for each individual before and after interventions (Fig. 3(a)). This principal component analysis represents the normalised absolute abundance for all fourteen phyla identified in every microbiome sample evaluated. Consistent with the aforementioned analysis, most subjects displayed modest variations in their microbiome composition (Fig. 3(a)).
Comparisons of gut microbiome composition between subjects. (a) Principal coordinates analysis of all phyla identified showing close similarity for groups including both placebo and sucralose at both intervention times. Arrows show the trajectories of changes in microbiome composition for each individual in the study. (b) Heatmap of distances calculated as the weighted UniFrac and clustering of closest distances using the UPMGA algorithm.
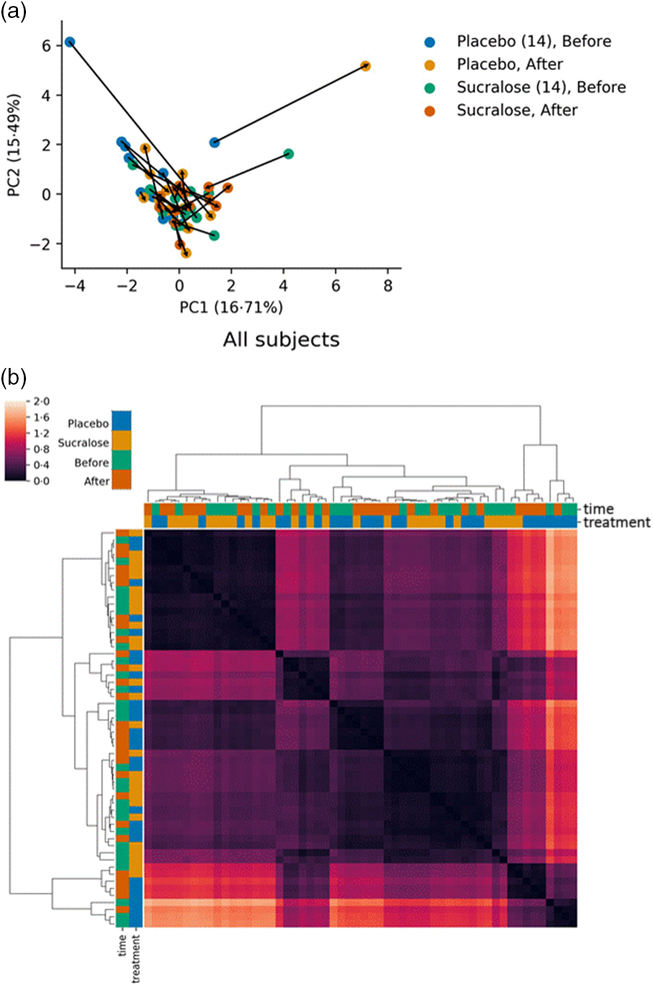
We also calculated the weighted UniFrac distances for each gut microbiome (Fig. 3(b)), in order to determine biological diversity among the microbiomes. This analysis showed that microbiomes in the sucralose group before and after the intervention (S1/S2) tend to cluster together, as well as microbiomes from subjects in the placebo group before and after the intervention (P1/P2). Again, this analysis indicates that both treatments did not substantially modify the microbiome of these subjects, while differences detected before interventions remained.
Correlations between gut microbiome and metabolic markers
Next, we classified individuals according to their metabolic responses, by calculating the after-to-before ratio for serum insulin and glucose AUC, BMI and insulin resistance (sensitivity) markers. This was aimed to determine if within the same treatment certain subjects responded differently, identifying responders (subjects with a ratio higher than 1) and non-responders (a ratio smaller or equal to 1)(Reference Suez, Korem and Zeevi4).
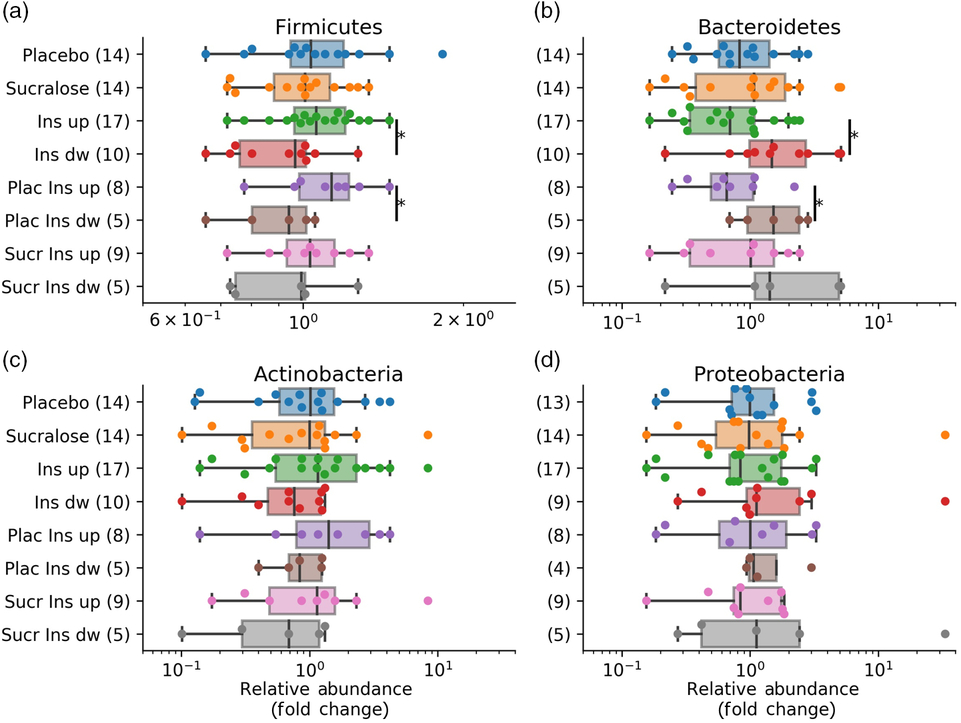
Independent of the treatment received, responders v. non-responders according to insulin AUC had higher Firmicutes and lower Bacteroidetes abundances in their microbiomes (Fig. 4(a) and (b)). Such differences were also noted when classifying subjects according to their change in glucose AUC, albeit with borderline significance (online Supplementary Fig. S2). Bacteroidetes relative abundance was also lower in responders according to changes in homeostasis model assessment (online Supplementary Fig. S3). Finally, classifying individuals by their BMI (overweight or normal weight) did not show significant changes in their gut microbiomes regardless of the treatment received. Only for individuals in the placebo group, we observed that overweight individuals had higher Firmicutes and Actinobacteria compared with those with normal weight (online Supplementary Fig. S4).
Pairwise correlations between fold changes in microbiome phyla and insulinaemia responder status. The figure shows the fold change in all major four phyla before and after the intervention, correlated with subgroups on the x-axis. Insulinaemia AUC ratios were calculated with AUC values after/before the intervention. (a) Fold changes in Firmicutes; (b) Bacteroidetes; (c) Actinobacteria; (d) Proteobacteria. Boxplots indicate the median and the interquartile range, with whiskers determined as the 1·5 range of the box. * Significant differences (P < 0·05) determined with the Mann–Whitney U test. Ins, insulinaemia; dw, down; Plac, placebo; Sucr, sucralose.
Discussion
Evidence of metabolic impairments for non-energy artificial sweetener
Sucralose is one of the most consumed NAS in the world(Reference Schiffman and Rother26), with several foods and beverages being supplemented with this sweetener. While recognised as safe by several studies, recent evidence has shown that sucralose among other NAS may promote weight gain and metabolic disturbances such as glucose intolerance(Reference Swithers27). Therefore, it is critical to understand the actual impact of NAS in our metabolism.
Previous findings in mice showed no adverse effects of sucralose on inflammatory markers or fasting glucose levels, even at large doses for up to 2 years(Reference Johannsen and Levinskas28,Reference Grice and Goldsmith29) . A study in diabetic subjects administrating sucralose at a dose of 667 mg (about 7·5 mg/kg per d) for 13 weeks did not observe changes in glycated Hb, fasting glycaemia or fasting C-peptide against placebo(Reference Grotz, Henry and McGill11), which are similar observations compared with this work. Another study conducted in non-diabetic individuals who consumed 1000 mg/d of sucralose (about 13·2 mg/kg per d) for 12 weeks did not detect differences relative to placebo in fasting glycaemia, insulinaemia or glycated Hb(Reference Grotz, Pi-Sunyer and Porte10). Sucralose consumption at the population level may reach up to 15 % acceptable daily intake, which is evidently lower compared with the amount provided in these previous reports(Reference Magnuson, Roberts and Nestmann30). None of these studies evaluated the gut microbiome composition of these subjects. Here we performed a short-term study with small sample size, finding that sucralose consumption at high doses does not alter the glycaemic response of healthy individuals.
Recently the gut microbiome has emerged as a factor that could contribute to the biological effects of NAS, in particular sucralose(Reference Suez, Korem and Zilberman-Schapira31). Early environmental studies revealed a strong bacteriostatic effect of several NAS, including sucralose and saccharine(Reference Omran, Ahearn and Bowers5,Reference Wang, Browman and Herzog6,Reference Suez, Korem and Zilberman-Schapira31,Reference Omran, Baker and Coughlin32) . Wang et al. (Reference Wang, Browman and Herzog6) also showed increases in Firmicutes in mice exposed to sucralose. Thus, alterations in gut microbiome have been shown to be associated with NAS exposure, and these alterations could be causative of metabolic impairments such as glucose intolerance and insulin resistance(Reference Suez, Korem and Zeevi4). In C57/BL6 mice sucralose altered microbiome composition, increased pro-inflammatory faecal metabolites and induced hepatic pro-inflammatory markers(Reference Bian, Chi and Gao33). Suez et al. (Reference Suez, Korem and Zeevi4) reported that in addition to saccharin, sucralose induced glucose intolerance in mice. For saccharin, this metabolic effect is transmittable to germ-free mice through their gut microbiome, indicating causality(Reference Suez, Korem and Zeevi4).
The Suez et al. (Reference Suez, Korem and Zeevi4) study was pioneer in showing that after short-term saccharin exposure, individuals display contrasting responses in terms of glucose tolerance and microbiome composition. Some of the observations raised have, however, been questioned by other studies(Reference Lobach, Roberts and Rowland12). Interestingly, that contrasting glucose tolerance was emulated in germ-free mice transplanted with the microbiome of the human donors. That study also provided insights into what micro-organisms are being altered in the complex gut microbiome. Saccharin consumption in the short term resulted in enrichment in the Bacteroides phylum, especially Bacteroides vulgatus and Bacteroides fragilis (Reference Suez, Korem and Zeevi4). Interestingly this exposure in mice also resulted in decreased abundance of Akkermansia muciniphila, a key gut microbe that has been associated with anti-inflammatory properties(Reference Zhao, Liu and Wang34,Reference Everard, Belzer and Geurts35) . While short-term saccharin consumption resulted in an increase in Bacteroidales and decrease in Clostridiales in responders(Reference Suez, Korem and Zeevi4), here we observed that sucralose administration at 75 % of the maximum acceptable daily intake for a similar period of time resulted in no major changes in the gut microbiome composition in healthy subjects. Evidently, metabolic and microbiome responses to saccharin could be very different compared with those of sucralose, considering their chemical properties and their differences in absorption and metabolism. The absence of the effect of sucralose consumption on gut microbiome composition could be explained for powering the study on glycaemia and not on gut microbiome data.
We observed that at the beginning of the study, subjects in the placebo group had a different gut microbiome (higher Firmicutes and lower Bacteroidetes) compared with the sucralose group. Interestingly this correlated with these subjects having higher initial BMI and cholesterol compared with the sucralose group. These differences were not intentional and could be expected from the randomisation of a population of healthy subjects. Moreover, subjects in the placebo group with higher insulinaemia, homeostasis model assessment or BMI presented significant changes in their gut microbiomes (Fig. 4, online Supplementary Figs. S3 and S4). These changes were a higher abundance of the Firmicutes phylum and lower Bacteroidetes. These observations indicate that the placebo group had substantial differences regarding glycaemic response and gut microbiome compared with the sucralose group, and even inside the placebo group there were interesting differences between these individuals. In spite of these baseline differences, neither group presented changes in glycaemic response or gut microbiome associated with the treatment received.
In addition, we did not observe differences in the gut microbiome between responders and non-responders associated with sucralose or placebo consumption, using criteria changes in serum insulin AUC. However, subjects who had a higher insulin AUC after the intervention, and regardless of the treatment received, had a higher Firmicutes:Bacteroidetes ratio (Fig. 4). This indicates that this metabolic difference could be more relevant than the intervention itself. This also correlates with the idea of this cohort being so healthy that only minimal or very sensitive changes in the gut microbiome were obtained. Changes in these phyla are probably relevant and implicate a considerable rearrangement of the community, considering they represent more than 90 % of the total gut microbiome. This same phenotype (higher Firmicutes and lower Bacteroidetes, or a higher Firmicutes:Bacteroidetes ratio) has been observed in several studies reporting alterations in the gut microbiome in obese subjects and especially in type 2 diabetes(Reference Most, Goossens and Reijnders36–Reference Ley, Mardis and Magrini39). Mechanistically, these microbiomes have been associated with low-grade inflammation, higher gut permeability and higher circulating lipopolysaccharide(Reference Boulange, Neves and Chilloux40).
Conclusion
The present study shows that the consumption of high doses of sucralose for 7 d in healthy subjects does not alter glycaemic control. There were no changes in the gut microbiomes of these subjects with respect to the consumption of sucralose or placebo. Independent of the intervention, subjects displaying an increase v. decrease in insulinaemia after either intervention had different gut microbiome compositions. Thus, initial metabolic differences could have been more important than the intervention itself in terms of altering the gut microbiome. Further studies should study the impact of other important non-energy sweeteners, but including potential responder–non-responder differences among subjects.
Acknowledgements
We appreciate the contribution to this work of Angélica Ubilla, Daniel Medina, Verónica Ortúzar, Camila Solar and Carolina Ulloa.
This project was funded by VRI-UC, Concurso de Investigación Interdisciplinaria 2015, VRI 13/2015 (C. A., J. E. G., D. G.) and Fondecyt Postdoctorado 3170609 (P. T.).
The authors declare no conflict of interest.
Supplementary material
For supplementary material/s referred to in this article, please visit https://doi.org/10.1017/S0007114519001570


