


Women’s labor force participation is an important driver of economic development and gender equality (Duflo Reference Duflo2012; Jayachandran Reference Jayachandran2015). In this paper, we study the short- and medium-run effects of a major demographic shock on women’s employment: the 1918 influenza pandemic in India. Demographic shocks, even when mortality is roughly equal by gender, may affect the female labor supply. The Black Death, for example, is seen to have led to the growth of a labor market for women in North-Western Europe (Broadberry Reference Broadberry2020; De Moor and van Zanden 2010). Empirical evidence for this pattern is scarce, however, particularly for regions outside the Western world. Where mortality is more unbalanced by gender, effects may be more pronounced; the world wars were another shock to the labor market that had consequences for women’s labor market participation (Boehnke and Gay Reference Boehnke and Gay2022; Fernández, Fogli, and Olivetti Reference Fernández, Fogli and Olivetti2004).
We focus on a different economic, social, and cultural context—that of India—in order to gain a different perspective on the drivers of women’s economic participation. Today, India has low levels of participation of women in economic activity outside the home. Although women’s labor force participation was higher in colonial India, most women worked in agriculture and many worked in the setting of the household. A recent literature (e.g., Fletcher, Pande, and Moore (2017)) on female labor force participation (FLFP) in India has highlighted a declining trend, despite rising incomes and greater education of women. Early marriage, social conservatism, and the limited participation of women in certain types of economic activities are among the reasons given in the literature. In recent times, FLFP has declined as economic growth has increased.
We study the influenza pandemic of 1918 in India to understand its impact on women’s labor force participation in a socially conservative environment. From 1918 to 1919, a deadly influenza pandemic hit India. It first appeared in Bombay and then spread to the North and the West. Regions that received less than normal rainfall were more affected (Chandra and Kassens-Noor Reference Chandra and Kassens-Noor2014; Hill 2011). Mortality estimates for India are wideranging, from 12 to 20 million (Chandra, Kuljanin, and Wray 2012; Davis Reference Davis1951; Patterson and Pyle Reference Patterson and Pyle1991). In some districts, mortality was as high as 15 percent. This exogenous demographic shock might have affected FLFP in both the short run and the long run. The pandemic led to a shortage of labor and created a situation where women could potentially participate in the labor force and substitute for men in activities previously performed by men. This could generate a short-run increase in FLFP during the 1920s and 1930s, similar to what Goldin (Reference Goldin1991) identifies after WWII. Although the population eventually reverted to previous levels, the impact of this demographic shock on female labor supply could have persisted if women’s working behavior was transmitted to subsequent generations, for example, by updating their beliefs toward the role of women (Fernández Reference Fernández2013; Fernández, Fogli, and Olivetti Reference Fernández, Fogli and Olivetti2004). By contrast, if norms against women’s work are strong and difficult to change, low levels of FLFP could be durable despite changes in the economic environment (Fernández Reference Fernández2007, Alesina, Giuliano, and Nunn Reference Alesina, Giuliano and Nunn2013). The influenza epidemic provides a natural experiment with which to look at the effect of a demographic shock on FLFP in India. The pandemic originated outside of India and affected districts differentially due to factors such as geography and weather that were unlikely to otherwise shape later trends in FLFP on their own. Did FLFP respond to the shock? If so, was it transitory or permanent?
We use district-level influenza mortality data for India from the Sanitary Reports of 1918 and 1919 and historical data on FLFP from the decadal censuses of 1901 through 1931 to create district-level panel data on women’s labor market participation. We consider both aggregate participation and participation in the specific sectors of agriculture, industry, and services. We estimate the short- and medium-run effects by adopting an event study method that compares the change in women’s employment in districts that were exposed to different levels of influenza mortality, before and after the influenza pandemic. We consider the 1931 census data to see if the changes in women’s labor market participation lasted beyond the short run. We find that FLFP increased only in services and only in the 1921 census; there is no evidence of a sustained response. Our results suggest that the mortality shock experienced by a typical district led FLFP to be 2.8 percentage points higher in 1921 than it would have been otherwise.
We test two mechanisms that could drive the short-run results. Women might have needed to enter the labor market in order to mitigate the economic shock due to the death of their husbands or other male relatives during the pandemic. At the same time, the general shortage of labor could have driven up wages and induced more women to join the labor force. Reduced population may, however, have also reduced demand, lessening the availability of jobs. Cultural norms that explain sectoral and regional variations in FLFP prior to the epidemic could help explain why the response to the epidemic was transitory. By contrast, if FLFP had been initially low due to frictions in the labor market, the increase could have been permanent. We show that the share of women who were widowed rose in districts most greatly affected by the pandemic, though there was no similar increase in the share of never-married women. Population density fell in more affected districts and wages rose. Districts with greater shares of widows saw greater FLFP, both generally and in services. More densely populated districts saw lower FLFP in services. While both these channels can help explain our results, they do not fully mediate them. We find little evidence of a response by male labor force participation (MLFP) to the influenza pandemic, suggesting that women’s reactions were not part of a more generalized increase in labor force participation in response to higher wages.
Contribution
This research project is related to several strands of literature. The first considers the role of women in South Asian economies. Recent work has emphasized the response of the Indian FLFP to economic incentives,
including agro-ecological zones (Chen Reference Chen1989), cropping patterns (Gulati Reference Gulati1975; Reddy Reference Reddy1975), deep tillage (Carranza Reference Carranza2014), and caste (Eswaran, Ramaswami, and Wadhwa Reference Eswaran, Ramaswami and Wadhwa2013; Luke and Munshi Reference Luke and Munshi2011). This literature has emphasized the role of culture and the high relative returns to home production in explaining why FLFP is both low and declining. In addition to evaluating the response of the Indian FLFP to the influenza pandemic, our paper makes a first-order contribution in terms of data digitization and description. Ours is the first paper of which we are aware to document district-level variations in FLFP over the first three decades of the twentieth century for the Indian subcontinent.
The second strand of literature to which we contribute studies the impact of demographic shocks on women’s labor supply. Existing research focuses heavily on WWII, with a particular emphasis on the United States. Acemoglu, Autor, and Lyle (Reference Acemoglu, Autor and Lyle2004) and Goldin and Olivetti (Reference Goldin and Olivetti2013) use exogenous variation in mobilization rates across states and find that the impact of WWII on FLFP was still present in the 1960s. Fernández, Fogli, and Olivetti (Reference Fernández, Fogli and Olivetti2004) find an effect on female labor supply that persists through the 1980s. Rose (Reference Rose2018), by contrast, finds that the wartime increase in female employment was short-lived as women joined the labor force in war-time industry and, with the decline of these activities and the return of the veterans, many women were unemployed in 1945 and 1946, suggesting a preference for men in certain types of jobs.
Research in other contexts has shown that FLFP increases in response to a shortage of male labor due to wars and the slave trade (Alix-Garcia et al. 2020; Boehnke and Gay Reference Boehnke and Gay2022; Fogli and Veldkamp Reference Fogli and Veldkamp2011; Luo 2017; Teso Reference Teso2019). We connect these two strands in the literature, providing novel evidence from a developing country and considering a more gender-balanced demographic shock. In this paper, we document women’s labor force participation at the district level in colonial India and study the impact of a historical epidemic, the 1918 influenza pandemic. Our setting is different from the European context in family structure and social norms. Both gender-biased and gender-neutral demographic shocks might increase FLFP, though these responses may be constrained by social norms and other factors. The paper that is most closely related to ours is Donaldson and Keniston (Reference Donaldson and Keniston2016). They show that the 1918 pandemic in India led to a rise in land-labor ratio, an increase in fertility in affected districts, and better health and education outcomes for children born in these districts after the pandemic.
The rest of this paper proceeds as follows. The second section outlines the historical context and identification strategy. The third section describes our data sources. The fourth section presents our main results.
The fifth section evaluates the empirical evidence for the mechanisms explaining our results. The sixth section examines the robustness of our results. In the seventh section, we conclude.
CONTEXT AND IDENTIFICATION
Context
WOMEN AND WORK IN INDIA
The literature on FLFP finds a U-shaped relationship between women’s labor market participation and development (Boserup Reference Boserup1970; Goldin Reference Goldin and Paul Schultz1995). In the early stages of economic development, agriculture is the dominant sector, income is low, and women work in agriculture within a household-based production process. With industrialization, rising income, and the marketization of work, fewer women work in factories outside the home. Women’s labor force participation increases again with further increases in income, expansion of education, and a structural shift towards service sector white-collar jobs (Mammen and Paxson Reference Mammen and Paxson2000).
In present-day India, the trend has been quite different. Despite economic growth, rising literacy, and a structural shift to services, FLFP has declined in recent decades. The decline is seen in both urban and rural India, but it is larger in rural India among women with secondary education (Fletcher, Pande, and Moore 2017). Returns to education are high in the marriage market (Klasen and Pieters Reference Klasen and Pieters2015). Women with more education marry more educated men and have higher family incomes, which reduces the incentives for female labor market participation. Staying out of the labor market signals social status (Chen and Drèze Reference Chen and Drèze1992). While participation of married women has declined, participation of widows in the labor market has increased (Afridi, Dinkelman, and Mahajan Reference Afridi, Dinkelman and Mahajan2016). Unlike in western countries, the expansion of employment in white-collar services has not absorbed the growing female population of working age (Klasen and Pieters Reference Klasen and Pieters2015). There is a preference for men in clerical jobs in India (Chatterjee, Desai, and Vanneman 2018).
What were the occupations of women in nineteenth-century India? Spinning was largely done by rural women as a part-time activity (Dutt Reference Dutt1906). This declined with the rise in imports of yarn from Britain (Bagchi Reference Bagchi1976). Rice processing at home accounted for a larger share of women’s time than spinning (Krishnamurty Reference Krishnamurty1985). In several other activities, including rice husking, wheat grinding, extracting oil, making shoes, rope, and pottery, women were displaced by the introduction of modern
machines such as rice threshers and oil processers in the first decades of the twentieth century (Forbes Reference Forbes1996). Women’s work was concentrated in specific industries and services, such as bidi rolling, hand spinning, basket weaving, grain processing by hand, and stone cutting. Other sectors where women were employed included domestic service, dress and toilet, petty trading, and sweeping and scavenging. As rice milling and oil processing moved to the factory sector, many women began to work in these factories (Sen Reference Sen2008). Some industries employed both men and women, though specific tasks were largely segregated by gender, as in mining, cotton textiles, and quarries (Roy Reference Roy2005). New industries such as cotton and jute textiles employed women, typically in unskilled jobs. Forbes (Reference Forbes1996) has outlined the segmentation of occupations by gender within industries. Women in cotton textiles were employed in cleaning cotton, reeling, and winding, but not in weaving. Morris (Reference Morris1965) points to the low share of women workers in Bombay textile mills compared to other countries. In jute mills, women worked in carding and spinning, but not in jute presses. In jute mills, labor shortages often required women workers to do tasks that were typically done by men (Sen Reference Sen1999, pp. 992–3). Some industries, such as metalworking, chemicals, and printing, rarely hired women (Roy Reference Roy2005). In mining, women’s jobs were on the surface rather than in the mines themselves. In the tea industry, women were equally represented. Here too, the tasks were defined by gender. Tea picking was always done by women, but preparing the plantation and processing tea leaves was a male domain. Women formed a large part of workers in domestic service. In cities, many women were engaged in prostitution as the sector expanded. Among high-skilled sectors, demand for women doctors for treating female patients opened a door into the labor force for educated women.
The migration of men to the factories in the cities created yet another form of gendered division of labor within the family and increased women’s participation in agriculture (Chandavarkar Reference Chandavarkar2003). Women took up work when faced with destitution. Widows and single women, in particular, sought employment in the factories. All but one of the female workers in the jute mills interviewed by the Labour Commission of 1891 were widows (Sen Reference Sen2008). Single women living in male-dominated tenements were seen as symbols of the breakdown of family norms and did not command high social status (Sen Reference Sen1999). The few high-caste women who worked in industry were seen to come from “unfortunate” circumstances. Women from all castes were present in the large community of prostitutes in Bombay City. Four-fifths of them were between the ages of 20 to 40, and 51 percent were widowed (Chandavarkar Reference Chandavarkar2003, p. 97).
Women’s labor market participation in colonial India was close to 30 percent (Thorner and Thorner Reference Thorner and Thorner1962). This fits in with the general pattern of higher participation rates in agricultural societies and within the household economy. Agriculture was the main activity for most women. In 1911, 73 percent of women workers were in agriculture and related activities; 11 percent in industry, mining, and construction; 12 percent in trade, transport, and other services; and 4 percent in “insufficiently defined activities” (Thorner and Thorner Reference Thorner and Thorner1962).Footnote 1
There were strong regional differences in FLFP as well. Our data show regional variation in 1911—FLFP was relatively high in the Central Provinces, Madras, Bihar, and Orissa, and in the United Provinces. It was relatively low in Punjab and Bengal. This pattern fits with the regional variation found after independence. In 1961, for example, women’s labor force participation was 18 percent in Uttar Pradesh, 6 percent in Punjab, and 9 percent in West Bengal, while it was closer to 30 percent in Assam, 38 percent in Maharashtra, and 43 percent in Himachal Pradesh (Gulati Reference Gulati1975). From 1961, estimates by Roy (Reference Roy2005) show a sharp decline in FLFP.
INFLUENZA IN INDIA
The period between 1872 and 1921 was one of exceptionally high mortality in India, and the Influenza pandemic was the climax of this era (Arnold Reference Arnold2019). Epidemics such as cholera and plague killed millions in the late nineteenth century and the first decades of the twentieth century. Had it not been for the famines and epidemics of the period, India’s population would have grown as rapidly as in the years after 1921 (McAlpin1983). Indeed, had its survival rates been as high as in the West, India’s population would have grown faster than that of many Western countries (Klein Reference Klein1973, p. 640). Major causes of death included famine, malaria, dysentery, diarrhea, cholera, and plague, as well as diseases such as tuberculosis, pneumonia, bronchitis, and influenza (Klein Reference Klein1973, pp. 642–3). British efforts at famine relief were too limited to lead to any meaningful reduction in mortality (Klein Reference Klein1984). More generally, colonial medicine was focused on maintaining the health of Europeans and colonial troops (Harrison Reference Harrison1994).
Dyson (1989a, p. 10) describes the period from 1891 to 1921 as one of slow population growth punctuated by major episodes of malaria, cholera, and influenza. After 1901, disease mortality became a greater share of overall mortality, with mortality from famine declining in relative terms (Klein Reference Klein1989, pp. 392–3). Deeper underlying causes of mortality in this period included poverty, inadequate nutrition, lack of sanitation, and lack of access to medical care.
The influenza pandemic that began in 1918 killed perhaps 50 million people globally. Over 13 million of those who died were in India—around 5 percent of the total population (Arnold Reference Arnold2019; Chandra, Kuljanin, and Wray 2012; Hill 2011). Our data suggest that the most-affected districts of India experienced mortality rates of 15 percent during the pandemic. The pandemic in India began in Bombay, the main port of entry for military and passenger traffic, and spread to the north and east (Dyson 1989b, p. 225). Returning troops and sick industrial workers going back to their villages both spread the epidemic. Punjab, a province that provided a large share of troops in the war, saw particularly high mortality (Arnold Reference Arnold2019, p. 193). Klein (Reference Klein1973) claims that pockets of safety were in less developed regions not connected by modern transport.
During the first wave, deaths peaked in October in the Bombay Presidency, November in the center, and in December in Bengal (Dyson 1989b, p. 226). British inaction during the pandemic was in part due to the resistance the government had faced during its measures to curtail the spread of a plague a few years earlier (Arnold Reference Arnold2019).Footnote 2 Not all individuals were equally at risk. The pandemic disproportionately killed individuals of working age (Donaldson and Keniston Reference Donaldson and Keniston2016; Reyes et al. Reference Reyes, Lee, Pratha Sah, Chandra and Bansal2018; Schultz Reference Schultz1967). In the Bombay Presidency, for example, Mills (Reference Mills1986) shows that 42 percent of excess deaths were in the 20–40 age group, compared with 20 percent coming from those over 50. This was quite different from the demographic pattern of influenza mortality experienced in a typical year, in which deaths were mainly among the elderly.
Mortality was highest among those most deprived: the poor and those with poor housing (Arnold Reference Arnold2019, p. 192). Workers in urban areas and modern sectors of the economy were more exposed to contagion and were hit harder; this included workers in docks, mines, railways, trams, telegraphs, the post, and textile factories (Arnold Reference Arnold2019, p. 195). Slumdwellers and landless laborers experienced relatively high mortality, while death rates were lower for whites, Parsis, and Brahmans, groups at the top of the social hierarchy (Klein Reference Klein1973, p. 656). In Calcutta, mortality was greatest on the docks and low in the more prosperous European parts of the city (ibid). Mortality varied by caste; low-caste Hindu mortality due to influenza was greater than all-cause mortality for any other demographic group (Dyson 1989b, p. 249). Women were often exposed as caregivers but left with no one to care for them after others in their households had died (Arnold Reference Arnold2019, p. 192). In the Bombay Presidency, 9 percent of the female population died, and 20 percent of married women aged 20–39 either died or were widowed (Dyson 1989a, p. 7).Footnote 3
Importantly for our empirical analysis, there was considerable heterogeneity in how the pandemic affected different parts of colonial India. The spread of the disease depended on weather conditions. Regions that experienced less humidity compared to the seasonal average were more affected (Chandra and Kassens-Noor Reference Chandra and Kassens-Noor2014),Footnote 4 and mortality was greater where population density was greater and rainfall was lower (Chandra and Kassens-Noor Reference Chandra and Kassens-Noor2014; Reyes et al. Reference Reyes, Lee, Pratha Sah, Chandra and Bansal2018).Footnote 5 The diurnal temperature range also serves as a predictor of mortality, not because it predicts infection rates, but rather because it correlates with the propensity for the infected to develop pneumonic complications (Dyson 1989b, p. 230).
Regions in which the harvest had failed due to lack of rain experienced higher mortality (Arnold Reference Arnold2019, p. 194). Influenza was most deadly where grain stocks had already been depleted and prices were near famine levels (Dyson 1989c, p. 183). This was particularly true in parts of Gujarat, Bombay, the Deccan, Berar, the Rajputana Agency, the southern Central Provinces, Orissa, and the United Provinces (Dyson 1989b, p. 251). Requisitioning of wheat for the war had also made the populations of the country’s wheat-producing districts more vulnerable (Bagchi 2014). Mortality was also lower in towns with Indian, as opposed to British, district officers (Xu Reference Xu2021). The transport network, especially the railways, helps explain spatial variation in the incidence of the disease (Reyes et al. Reference Reyes, Lee, Pratha Sah, Chandra and Bansal2018). Patterns such as these were not unique to India; Clay, Lewis, and Severnini (Reference Clay, Lewis and Severnini2018, 2019) find that U.S. cities with initially greater levels of infant mortality, illiteracy, and pollution experienced higher mortality during the pandemic.
Identification
In order to test for short- and medium-run effects of the 1918 influenza epidemic on female labor supply in India, we compared the change in women’s employment in districts that were exposed to different levels of influenza mortality before and after the influenza epidemic. This allows us to control for unobservable characteristics of districts that do not change over time and for unobserved variables in specific time periods that affect all of India equally. In particular, we use an event-study approach. We estimate:
 $$FLF{P_{dt}} = {\beta _t}Influenz{a_d} + (x_d^\prime \times {\eta _t})\gamma + {\delta _d} + {\eta _t} + {\varphi _p} \times t + {\varepsilon _{dt}}$$
Here, FLFP dt is FLFP in district d in year t. We compute this as the ratio of women working to the population of women in the district.Footnote 6 In various specifications, we either use total FLFP or FLFP for the separate sectors of agriculture, industry, or services. Influenza d is the influenza mortality rate in district d in 1918 and 1919. β t is a separate coefficient for each year, equivalent to interacting Influenza d with year fixed effects. The omitted category is 1911, the last pre-treatment year. An insignificant coefficient for 1901 validates the parallel trends assumption. The coefficient for 1921 is our coefficient of interest, while the coefficient for 1931 is used to assess whether any short-run impacts persisted over time.
x′ d η t includes the interactions of three key district-specific variables with our year fixed effects. These are humidity, latitude, and longitude. These are selected because they are predictive of influenza mortality and ensure that there are parallel trends in FLFP between high-exposure and low-exposure districts prior to the 1918 pandemic. These controls also help avoid the possibility that our results are driven by correlates of influenza mortality rather than influenza mortality itself. In particular, previous writers have stressed that humidity helps explain the variation in the severity of the epidemic across space in India (Chandra and Kassens-Noor Reference Chandra and Kassens-Noor2014; Hill 2011). In addition, in some specifications, we control for the time-varying urbanization rate. We do not include it in our baseline set of controls, as it might both respond to influenza mortality and proxy for a critical channel through which the pandemic may have influenced women’s work outcomes, for example, in capturing the thickness of the potential labor market or the abundance of labor relative to other factors of production, most notably land. In robustness specifications, we will include additional time-invariant controls that interact with year fixed effects and additional time-varying controls. δ d and η t are district and year fixed effects, respectively. φ p × t is a province-specific time trend, that is, an interaction of province fixed effects with linear year variables. Standard errors are clustered by district.
DATA
Female Labor Force Participation
Historical data on our dependent variable, FLFP, come from the colonial censuses collected every ten years between 1901 and 1931. The data are at the district level and disaggregated into the major categories of industry, agriculture, and services. For each district in each census year, the census reports counts of men and women working in different occupations. To the best of our knowledge, we are the first to digitize the data by sub-sectors at the district level (Fenske et al. 2022). We then categorize the occupations as agricultural, industrial, or service-based (see Online Appendix A).
The data are not without error, and there are differences across censuses in how they are enumerated. The censuses of 1901 to 1921 recorded all “actual workers” as the principal worker in an occupation. This classification changed in 1931, when two separate categories were introduced: principal occupation and working dependent. In 1931, enumerators were asked to classify each enumerated person as either an earner or a dependant. For earners, they were asked to list the principal occupation and the most important subsidiary occupation (if applicable). Working dependants were recorded as having subsidiary occupations rather than as having primary occupations. The census referred to the sum of earners and working dependants as “actual workers.” The sum of earners (or principal occupation) and working dependants in 1931 should be roughly equivalent to the earlier category of workers in 1921. However, women who were likely to have been classified as actual workers in 1901–1921 could be classified as working dependents in 1931 and were more likely to be classified as non-working dependents. We can therefore expect a drop in the number of workers classified under principal occupation. Because of these differences in the 1931 data, our primary focus is on the results for 1921.
We expect that these differences will introduce measurement error into our dependent variables. This will be one motivation for our inclusion of census year fixed effects in our empirical specifications. Note, however, that the relative similarity of the instructions given in 1911 and 1921 will mean that our analysis, which is centered principally on the change in FLFP between these years, focuses on those waves of census data that are most comparable. To convert these to labor-force participation rates, we divide these counts by the total population of the district of a given gender in a given year. We exclude two districts from the analysis whose data on FLFP contained obvious errors in 1911—Garhwal and Simla.Footnote 7 In Garhwal, recorded FLFP is between 61 and 69 percent in 1901, 1921, and 1931, but is only 8 percent in 1911. For Simla, recorded FLFP is between 22 and 43 percent in 1901, 1921, and 1931, but is also only 8 percent in 1911. We show maps of FLFP in 1911 and its change from 1911 to 1921 at the district level in Figures 1 and 2, respectively. We also show provincial boundaries on these maps.
FLFP IN 1911
Note: This figure displays FLFP in each district in 1911.
Source: Census of India in 1911.

CHANGE IN FLFP FROM 1911 TO 1921
Note: This figure displays the change in FLFP from 1911 to 1921 in each district in 1911.
Source: Census of India in 1911 and 1921.

Influenza Mortality
We have collected and entered the 1918 influenza mortality data for India from the Sanitary Reports for the years 1918 and 1919. These provide deaths by cause and gender for each district in the sample. Because these Sanitary Reports are available only for the British-ruled districts of India and exclude the princely states, and because not every district reports occupational data every year, our baseline sample includes 197 districts over four periods in time, giving us a maximum of 788 observations in each regression.
The Sanitary Reports for colonial India were underpinned by a system of vital registration that was uneven in its coverage and quality over both time and space. In Assam in 1902, for example, registration was compulsory only in urban areas, though individuals were prosecuted for
failing to register births and deaths.Footnote 8 In some districts, registration was checked by the police, and vaccination staff would assist in data collection. Colonial officials estimated that 5.8 percent of births and 5.3 percent of deaths went unrecorded in Assam in 1902.
The uneven quality of colonial India’s vital registration system has been noted by past demographers. Dyson (1989c), for example, highlights the unusually high quality of Berar’s records. Respiratory diseases are particularly likely to be under-counted in standard sources (Klein Reference Klein1973, pp. 642–3). Because of cause of death misclassifications, influenza mortality figures computed using the vital registration data will likely underestimate true mortality due to the pandemic (Dyson 1989b, p. 228). Other causes of death, such as smallpox and cholera, declined during the peak epidemic months. This may be because influenza killed individuals suffering from these but also because, in some regions, vital registration was suspended and these deaths may have been later attributed to influenza (Dyson 1989b, p. 236).
Because of these shortcomings, several conflicting estimates exist of the total death toll due to the pandemic. Officials themselves recognized that influenza might be misrecorded, for example, as malaria or pneumonia.Footnote 9 Provincial Sanitary Commissioners collected detailed accounts of the epidemic, which were described in the annual report of 1918. A preliminary report was published in 1919 by Norman White, the Government of India’s sanitary commissioner, which put mortality at six million: five million in British India and one million more in the Princely States. What the numbers in the Sanitary Report of 1918 did not include was influenza-related deaths in the medium term. Nor did these numbers include the impact of other factors, such as bubonic plague, deaths from famines, and deaths due to the war. Excess mortality could only be measured after the population census of 1921. This put the figure at 12 million (Arnold Reference Arnold2019).
Questioning the reliability of vital registration records used in the Sanitary Reports, Davis (Reference Davis1951) used data from the censuses and, based on the decadal population growth rates of 1901–1911 and 1921–1931, estimated the population deficit in 1921 at 18.5 million. Reworking these numbers to take into account more rapid population growth after 1918, Chandra, Kuljanin, and Wray (2012) produced a revised estimate of influenza mortality of 13.88 million. Another estimate comes from Mills (Reference Mills1986). He constructs excess mortality from the vital statistics collected by the Provincial Sanitary Commissioners using deaths from influenza between May 1918 to June 1919 relative to the average for 1913–17. He makes additional corrections for coverage and the distribution of deaths by age, arriving at a total estimate for India of 16.8 million, or 5.5 percent of the population. Hill (2011), alternatively, uses population change in the over-five age group between 1911 and 1921 relative to its growth between 1901 and 1911 to calculate excess mortality. He does this because changes in the population under five may have been due in part to a shortfall in live births. After correcting for underreporting, he estimates mortality from influenza at 13.5 million.
Given the differences that exist between different methods of measuring mortality, we adopt influenza mortality for 1918–19 as our primary measure of pandemic exposure. Hill (2011) shows that the impact in India was almost entirely concentrated between September 1918 and early 1919. It is, then, reasonable to use 1918–19 influenza mortality figures when measuring the death rate by district due to the pandemic. We divide these deaths by the district population as of 1911 to construct our estimate of the death rate. Using excess mortality calculated from the census data may not be useful to precisely measure influenza mortality at the district level.
Because of the possible limitations of our data, we note a number of points. First, we show that our results remain if we replace our baseline mortality estimates with alternatives—all cause mortality and excess influenza deaths relative to preceding years. Second, the inclusion of district fixed effects and provincial time trends in our baseline controls both for arbitrary differences in data quality that are time-invariant across districts or that vary linearly over time across larger regions. If the main problem with the data, for example, is the uneven coverage of registration across locations, district fixed effects address this. If instead, mortality reports are simply underestimated, this would amount to a re-scaling of the treatment variable that would not affect the sign or standardized magnitude of our coefficient estimates. Third, it is not necessary that our mortality variable be measured without error for our results to be meaningful; rather, if it is a proxy that is only correlated with actual mortality, our results in terms of standardized magnitudes will still be interpretable, though they may be biased toward zero due to attenuation.
Other Data
While the inclusion of district and year fixed effects in our regressions implies that we need not, and cannot, control for time-invariant controls, we do interact three variables with year fixed effects in order to discipline
the pre-pandemic district trends in our data. These are latitude, longitude, and humidity. To compute each of these, we begin by creating a shape-file map of these districts based on the paper map in the 1931 census. Following the procedure in Fenske and Kala (Reference Fenske and Kala2021), we correspond each colonial district mapped in the 1931 census with all current sub-district units (e.g., tehsils) that intersect the erstwhile historical districts and treat the union of these polygons as the polygon corresponding to that colonial district. We use the centroid of this polygon to compute the latitude and longitude of the district. For variables originally available in a raster format, such as humidity or crop suitabilities, we average over raster points in a district. Our humidity data are taken from the Climatic Research Unit at the University of East Anglia.
In some specifications, we control for population density and urbanization rates. These are computed using the areas, populations, and populations of cities from each census wave. In robustness checks, we employ data on crop suitabilities. These are taken from the Food and Agriculture Organization of the United Nations Global Agro-Ecological Zones’s project (FAO-GAEZ), and are reported as expected yields in kilograms per hectare under low levels of inputs. We focus on crops that are important in Indian agriculture, in particular banana, chickpea, cocoa, coffee, cotton, groundnut, wet and dry rice, oil palm, onion, soybeans, sugar, tea, potato, and wheat. For robustness, we control for the areas planted with major crops during each census year. We have digitized these from the Agricultural Statistics of British India and focus on rice, wheat, sugarcane, jute, opium, tea, tobacco, and cotton.
In our analysis of possible mechanisms, we use two additional variables that we compute using the population counts by district, gender, and marital status in the colonial census. These are the fraction of the female adult population that are unmarried and the fraction that are widowed. We also test whether greater FLFP is explained by sector-specific increases in wages due to labor scarcity arising from the epidemic. To do this, we assemble an unbalanced panel of more than 6,500 wage observations from a number of sources, the most important of which are Wages and Prices in India and the wage censuses of each province. We classify these by sector (agriculture, industry, and services) and by skill intensity (skilled or unskilled).Footnote 10
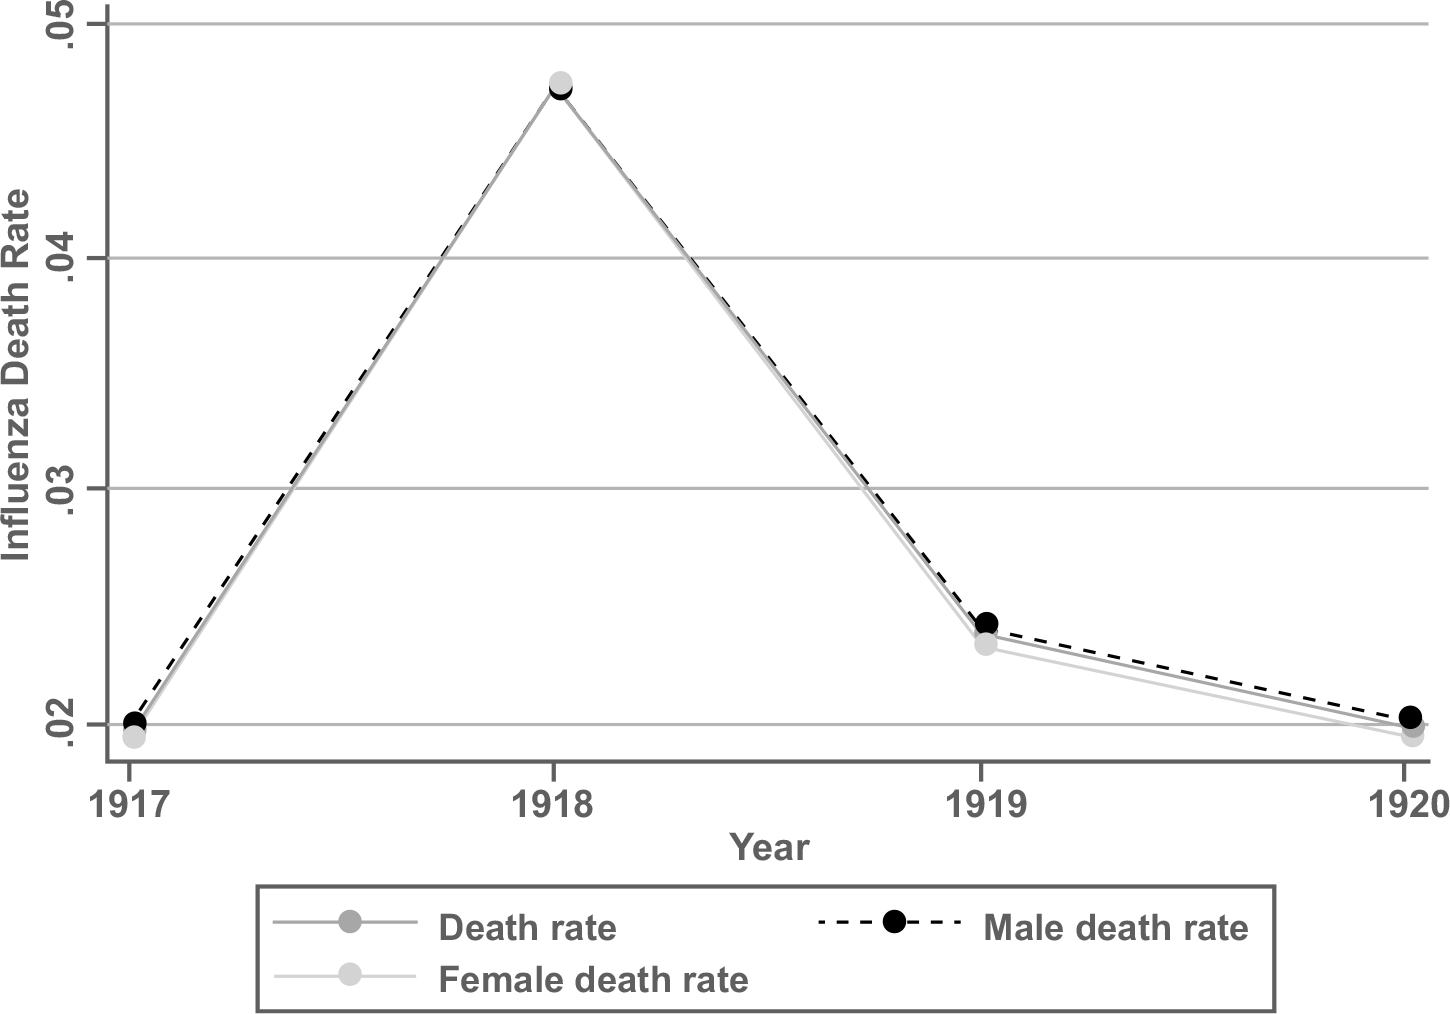
In Figures 3 and 4, we show the timing and geographical distribution of the influenza pandemic. The first figure depicts mortality rates (deaths as a share of the total population). The second figure is a map of the death rate by district. Two patterns are clear immediately. The first is the sharp concentration of mortality in 1918; influenza deaths spiked in that year but had largely returned to their pre-pandemic levels by 1919 and were back at their 1917 levels by 1920. Second, while mortality rates were lower in southern India and in Assam than elsewhere, there was geographic dispersion in mortality rates both within and across provinces.
INFLUENZA MORTALITY RATES
Notes: This figure depicts the total influenza mortality and influenza mortality by gender from 1917 to 1920.
Source : Sanitary Reports for the years 1917 to 1920.
INFLUENZA MORTALITY: GEOGRAPHICAL DISTRIBUTION
Source: Sanitary Reports for the years 1918 to 1919.

We present summary statistics for our results in Table 1. Looking at the mean FLFP by year, the rate of women working fell roughly from 31 percent in 1901 to 29 percent in 1911, where it remained in 1921. By 1931, it had fallen below its 1901 value. The decline in 1931 had several causes. Partly, this is about how the census counted secondary occupations, which we expect to have a uniform level effect across the districts in our data and that we expect to be uncorrelated with the extent of influenza mortality. We expect that measurement differences would be accounted for by a year fixed effect. To the extent that the drop was due to the Great Depression, we account for this in our robustness exercises by allowing for flexible time trends by crop suitabilities (accounting flexibly for possible shocks to global commodity markets).
SUMMARY STATISTICS

Sources: Censuses of India and Sanitary Reports (see text).
RESULTS
Graphical Analysis
Before presenting our main event study results, we document that the same trends we will uncover in these specifications are also apparent in the raw data. In Figure 5, we show four scatterplots. In each scatterplot, each dot represents a district in our data. The x axis of each plot is the same: the death rate due to influenza during the pandemic. The y axis in each figure is a different measure of the change in FLFP between 1911 and 1921, that is, through the pandemic. It is clear from the figure that there is a positive correlation between influenza mortality and the change in overall FLFP from 1911 to 1921. Modest upward-sloping relationships are also apparent for the agricultural and services sectors, and there appears to be no correlation for industrial FLFP. Our event study results will verify the relationships between overall FLFP and services.
SCATTERPLOTS: INFLUENZA MORTALITY AND CHANGES IN FLFP ACROSS DISTRICTS, BY SECTOR
Notes: This figure depicts the scatterplots between change in FLFP and total influenza death rate. The x axis of each plot is the death rate due to influenza during the pandemic, and the y axis in each figure is a different measure of the change in FLFP between 1911 and 1921.
Sources: Censuses of India and Sanitary Reports (see text).

Main Results
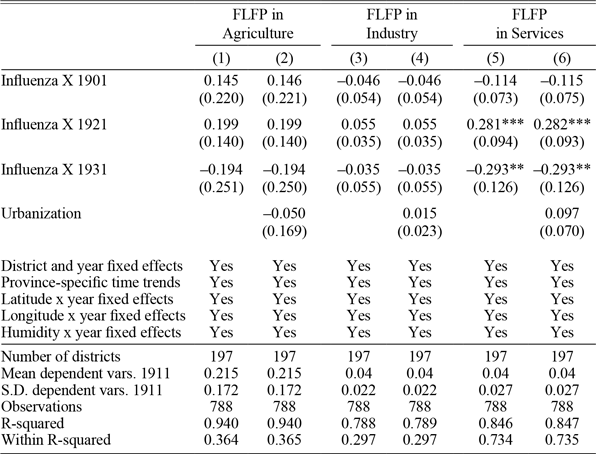
We present our main results in Table 2. In Column (1), we report a sparser specification with only district fixed effects, year fixed effects, and influenza mortality interacted with the year fixed effects. We find a statistically significant increase in FLFP in more influenza-affected districts in 1921, followed by a decline in 1931. In Column (2), we add province-specific linear time trends. In Column (3), we control as well for variables that help discipline the differences in pre-trends across districts: latitude, longitude, and humidity, each interacted with year fixed effects. Finally, in Column (4), we control for time-varying urbanization. Across columns, we continue to find a statistically significant increase in FLFP in 1921 in districts that experienced greater mortality during the pandemic, and that this was reversed in 1931.
MAIN RESULTS

*** p<0.01, ** p<0.05, * p<0.1. Standard errors clustered by district in parentheses. Sources: Censuses of India and Sanitary Reports (see text).
To put the magnitude of these results in context, the influenza death rate has a mean of 0.0801 across districts and a standard deviation across districts of 0.031. The coefficient of approximately 0.344 implies that a typical mortality shock increased FLFP by 2.8 percentage points in 1921. Alternatively, a one-standard deviation increase in mortality led to a 1.1 percentage point increase in FLFP in 1921.
A number of factors help explain why we find a negative coefficient in 1931. First is the shock of the Great Depression.Footnote 11 Second, the demographic effects of the pandemic, including the fertility response documented by Donaldson and Keniston (Reference Donaldson and Keniston2016), help account for this later decline in FLFP in high-mortality districts. Third, the Mandla district is an outlier that experienced both high mortality and a large drop in FLFP in 1931 and exerts substantial influence on this coefficient. Lastly, the changes we describe in how census data were collected in 1931 make the coefficient magnitudes in that year less directly comparable to the others.
Results by Sector
We show results by sector in Table 3. That is, we now compute FLFP for agriculture, industry, and services. In 1921, FLFP in services increased in the most adversely affected districts. In 1931, it fell relative both to its baseline mean and to other districts where the mortality rate was lower. We find no significant pattern of response in industry. In agriculture, neither the coefficients for 1921 nor 1931 are statistically significant, though the negative coefficient for 1931 is quantitatively large.
RESULTS BY SECTOR
*** p<0.01, ** p<0.05, * p<0.1. Standard errors clustered by district in parentheses. Sources: Censuses of India and Sanitary Reports (see text).
What are the most quantitatively important sectors in which women work and that have the potential to drive our results? We consider the five sub-sectors that each accounted for at least 1 percent of the female population in 1911: cultivators, farm servants, textiles, trade, and domestic service. There is a significant, though small, differential increase in FLFP in textiles and trade in more pandemic-affected districts in 1921. There is a large differential increase in female participation in domestic service as well, but we cannot rule out violations of the parallel trends assumption. We consider a category of FLFP that can be interpreted as “distress” participation: that of beggars and prostitutes. We find no evidence that FLFP in this category rose differentially in 1921 in districts that experienced greater influenza mortality (see Online Appendix Table A1).Footnote 12
For robustness, we investigated whether there was any response of MLFP to influenza mortality and did not find evidence of such an effect (see Online Appendix Table A2).
MECHANISMS
To evaluate the mechanisms that could potentially explain our results, we begin by considering three possible mediating variables: the share of widows in the female population, the share of never-married women in the female population, and population density. In addition to these variables, other possible channels have been suggested by the previous literature. Fertility, for example, fell during the pandemic. Stillbirths tripled, the crude birth rate declined, and marriages were postponed (Dyson 1989b). The drop was less than after previous famines because the migration of men seeking work was less during the pandemic than during prior famines (Dyson 1989c, p. 184). This was followed by a peak in births in late 1919 (Dyson 1989b, p. 242). Donaldson and Keniston (Reference Donaldson and Keniston2016) have previously noted a rise in fertility in the most-affected districts after the pandemic ended, which may help explain why we do not find a rise in FLFP that is sustained after 1921.
The share of widows is likely to capture distress labor by women who have lost husbands and other relatives during the pandemic. The share
of what the census refers to as “single” women may capture a similar effect, working through the unavailability of potential husbands. In 1921, there was an increase in the prevalence of widows and widowers. In the Bombay presidency, for example, while the share of men aged 30–34 who were widowers rose from 5.5 percent in the 1911 census to 8.0 percent in 1921, for women of the same age group, the increase was from 16.9 to 18.8 percent (Mills Reference Mills1986). The number of widows remained high in 1931 due in part to taboos on widow remarriage.
Population density is interpreted here as a measure of the overall availability of labor. In a more competitive labor market, employers may give priority to male workers, leading women to withdraw from the labor force. The increase in FLFP may have been driven by an aggregate shortage of labor in the economy and a corresponding rise in wages.
We begin by testing whether these variables respond to the influenza pandemic in Table 4. In Columns (1) and (2), we show there was indeed a significant increase in the prevalence of widows in the female population in 1921 in districts that experienced higher mortality rates during the pandemic. Though the coefficient for 1931 suggests that there were still more widows in these districts more than a decade later, this is not statistically significant. In Columns (3) and (4), by contrast, we see no change in the share of never-married women. In Columns (5) and (6), we do show that there was a statistically significant decline in 1921 in population density in districts with more mortality. In addition to suggesting that labor became more scarce in these districts, it also validates the mortality data, which are taken from the Sanitary Reports, and not from the census.
INFLUENZA AND POSSIBLE MEDIATORS
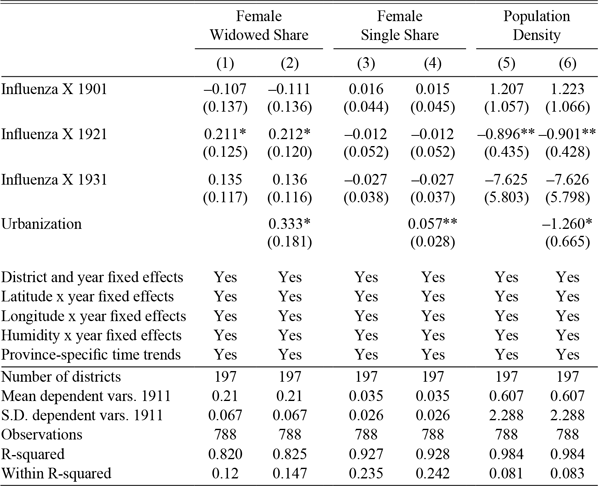
*** p<0.01, ** p<0.05, * p<0.1. Standard errors clustered by district in parentheses. Sources: Censuses of India and Sanitary Reports (see text).
In Table 5, we then ask the degree to which these variables mediate our main results, including them as additional controls. In this table, we also report, following Imai, Keele, and Tingley (Reference Imai, Keele and Tingley2010) and Hicks and Tingley (2011), the percentage of the short run (1921) response to the pandemic that can be explained by these mediators. These analyses should be taken as descriptive since all mediation analyses rely on the sequential ignorability assumption that mediators are independent of potential outcomes conditional on treatment assignment and controls (Imai et al., Reference Imai, Keele, Tingley and Yamamoto2011). Columns (1) and (2) are analogous to Columns (3) and (4) of Table 2. In Panel A, districts with a higher share of widows in the population have greater FLFP, though the magnitudes of the coefficients on the interactions of the influenza death rate and the year fixed effects have only fallen slightly. The same is true in Columns (7) and (8), which are analogous to Columns (5) and (6) in Table 3. Mediation analysis results suggest that the share of widows in the population explains between 6.75 and 16.50 percent of the impact of influenza mortality on FLFP in 1921. So, while distress labor by widows may help explain the temporary increase in FLFP in more influenza-affected districts, it is not a complete explanation.
MEDIATION ANALYSIS

All columns include district and year fixed effects, latitude x year fixed effects, longitude x year fixed effects, humidity x year fixed effects, and province- specific time trends. *** p<0.01, ** p<0.05, * p<0.1. Standard errors clustered by district in parentheses.
Sources: Censuses of India and Sanitary Reports (see text).
In Table 5, Panel B, we perform a similar exercise, but for population density. In Columns (1) and (2), we find no evidence that the overall supply of potential labor drives aggregate FLFP. In Columns (7) and (8), we do find a negative coefficient on population density, suggesting that female participation in services grew when labor was more scarce generally. Again, however, this does little to diminish the magnitudes of the coefficients on the interactions between the influenza death rate and the year fixed effects. The labor scarcity induced by the pandemic is, then, only a partial explanation and a sector-specific one. As in Table 5, we again report the share of the 1921 response that is mediated by population density. The role of population density here is much smaller than for the share of widows; it can explain a bit less than 3 percent of the effect in services, but works against it in agriculture and has negligible contributions in industry and overall FLFP.
In a related exercise in Table 6, we show that greater mortality did increase wages. Higher wages may have drawn women into the labor force. Following a procedure similar to that in Donaldson and Keniston (Reference Donaldson and Keniston2016), we estimate the following event study specification using our unbalanced panel of wage data:
 $$\eqalign{
& {\rm{ln}}({w_{odpt}}) = {\beta _{\rm{l}}}Influenz{a_d} \times Yea{r_{{\rm{19}}0{\rm{1}}}} + {\beta _{\rm{2}}}Influenz{a_d} \times Yea{r_{{\rm{19}}0{\rm{2}} - {\rm{11}}}} \cr
& + {\beta _{\rm{3}}}Influenz{a_d} \times {\rm{Yea}}{{\rm{r}}_{{\rm{1919}} - {\rm{21}}}} + {\beta _{\rm{4}}}Influenz{a_d} \times {\rm{Yea}}{{\rm{r}}_{{\rm{1922}}}}_{ - {\rm{28}}} \cr
& \, \, \, \, \, \, \, \, + {\rm{z}}_{{\rm{ot}}}^\prime \rho + (x_d^\prime \times {\eta _{\rm{t}}})\gamma + {\delta _d} + {\eta _{\rm{t}}} + {\varphi _p} \times t + {\varepsilon _{dt}} \cr} $$
$$\eqalign{
& {\rm{ln}}({w_{odpt}}) = {\beta _{\rm{l}}}Influenz{a_d} \times Yea{r_{{\rm{19}}0{\rm{1}}}} + {\beta _{\rm{2}}}Influenz{a_d} \times Yea{r_{{\rm{19}}0{\rm{2}} - {\rm{11}}}} \cr
& + {\beta _{\rm{3}}}Influenz{a_d} \times {\rm{Yea}}{{\rm{r}}_{{\rm{1919}} - {\rm{21}}}} + {\beta _{\rm{4}}}Influenz{a_d} \times {\rm{Yea}}{{\rm{r}}_{{\rm{1922}}}}_{ - {\rm{28}}} \cr
& \, \, \, \, \, \, \, \, + {\rm{z}}_{{\rm{ot}}}^\prime \rho + (x_d^\prime \times {\eta _{\rm{t}}})\gamma + {\delta _d} + {\eta _{\rm{t}}} + {\varphi _p} \times t + {\varepsilon _{dt}} \cr} $$
INFLUENZA AND WAGES

***p<0.01, ** p<0.05, * p<0.1. Standard errors clustered by district in parentheses.
Sources: Censuses of India and Sanitary Reports (see text).
Here, w odpt is the log wage for occupation o in district d in province p in year t. As in Equation (1), Influenza d is the mortality rate from influenza in district d during the pandemic. Because the wage data come as an unbalanced panel, we collapse our time periods together into broader groups: 1901 and earlier, 1902 to 1911, 1919 to 1921, and 1922 to 1928. The omitted base period is 1912 to 1918, the last interval prior to the pandemic. Insignificant estimates of the coefficients β 1 and β 2 validate the parallel trends assumption. β3 is an estimate of the immediate impact of influenza mortality on wages, while β4 estimates whether this impact persisted throughout the 1920s.
z ot includes occupational characteristics—whether the wage is urban or rural, whether it is paid in cash or kind, and fixed effects for occupation. Other terms in Equation (2) are defined as in Equation (1); x′ d × η t is the interaction of district-specific controls with year fixed effects, δ d is district fixed effects, η t is year fixed effects, and φ p × t is province-specific time trends. As before, we cluster standard errors by district.
Pooling all wage observations together in Column (1) of Table 6, we confirm the results from Donaldson and Keniston (Reference Donaldson and Keniston2016)—greater influenza mortality created a scarcity of labor, increasing wages throughout the 1920s. Our results allow us to show results by sector that Donaldson and Keniston (Reference Donaldson and Keniston2016) do not report. We find no wage effects in agriculture. Rather, it is in industry, services, general labor, and the labor of skilled workers that wage increases are apparent. For industry and skilled work, these increases persisted throughout the 1920s. Because our wage data form an unbalanced panel, we cannot control for wages in a mediation analysis similar to Table 5.
To put the magnitude of these results in perspective, consider wages across all occupations in 1919–21. The coefficient estimate (1.095) implies that a district with the mean death rate (0.0796) saw wages rise by approximately (e1.095 × 0.0796 − 1) 9.1 percent in the immediate post-pandemic years. Across specific sectors and including estimates that are not statistically significant, the percentage effects of a mean mortality shock are −0.9 percent in agriculture, 11.5 percent in industry, 23.1 percent in services, 27.5 percent for general labor services, 11.8 percent for skilled occupations, and 12.6 percent for unskilled non-agricultural occupations. This rise in wages may help explain the rise in FLFP in 1921, particularly in services.
Finally, to evaluate whether the impact of the influenza pandemic was greatest in districts where there was a greater pent-up supply of underutilized female labor, Table 7 separates the sample by initial FLFP. That is, we divide the sample into districts with above and below median levels of FLFP in 1901. We do this because the literature on FLFP in the Indian context has emphasized the role of social norms as a constraint (Jayachandran Reference Jayachandran2021). We use 1901, the first year in our sample, since these initial values are predetermined with respect to any later events in the data. We find that FLFP response was, rather, driven by districts with initially greater levels of FLFP. Rather than the influenza pandemic working to break the constraints imposed by social norms on FLFP, these results suggest that the response itself was constrained by the presence of these norms or by the prevalence of activities in which women did not work.
HETEROGENEITY BY INITIAL FLFP

*** p<0.01, ** p<0.05, * p<0.1. Standard errors clustered by district in parentheses. Sources: Censuses of India and Sanitary Reports (see text).
ROBUSTNESS
In this section, we outline the robustness exercises that we report in the Online Appendix. We begin by showing that our results survive controlling for cholera mortality in 1918, interacted with year fixed effects, in Online Appendix Table A3. We do this to demonstrate that our results are not driven by differential trends in districts that have high levels of mortality for reasons unrelated to the pandemic.
Because of the possibility that our results for 1931 are confounded with India’s exposure to the Great Depression, we add as controls the interactions of suitabilities for major crops in India with year fixed effects. Note that this is equivalent to controlling flexibly for how the world prices of these crops affect these districts based on an exogenous determinant of their propensity to produce them. These results are reported in Online Appendix Table A4. The general result remains: districts that were most affected by the influenza pandemic saw an increase in FLFP in services that was reversed by 1931.
For similar reasons, we control in Online Appendix Table A5 for the time-varying areas planted to major crops recorded in the Agricultural Statistics of British India in our census years. In particular, we consider rice, wheat, sugarcane, jute, opium, tea, tobacco, and cotton. Results remain similar to our baseline analysis.
Because it is possible that influenza mortality during the pandemic was correlated with geographical characteristics that might predict differential trends in FLFP even in the absence of the pandemic, we use Online Appendix Table A6 to show that our results survive controlling for a number of additional geographic controls interacted with year fixed effects: temperature, precipitation, and altitude, all computed using data from the FAO-GAEZ data, the Nunn and Puga (Reference Nunn and Puga2012) ruggedness index, and the Kiszewski et al. (Reference Kiszewski, Andrew Mellinger, Malaney, Ehrlich Sachs and Sachs2004) index of the stability of malaria transmission.
So far, we have considered the overall rate of influenza mortality when the genders are combined. Gender-specific mortality rates were strongly correlated across districts during the pandemic; the male and female death rates have a correlation coefficient of 0.97, and each has a correlation coefficient of at least 0.99 with the overall death rate. Although this gives us limited scope to evaluate whether FLFP responded differently to male mortality, we replace the overall death rate with male mortality in Online Appendix Tables A7, A8, and A9. The table analogous to our main results, Online Appendix Table A7, shows patterns similar to our baseline. In Online Appendix Table A8, which is analogous to Table 4, we show that the share of widows in the female population rises in response to male influenza deaths, as it has to overall mortality. In Online Appendix Table A9, which is analogous to Table 5, we again show evidence that the increase in widowhood due to the pandemic helps explain FLFP response but does not completely mediate it. In Online Appendix Table A10, we show that using the female death rate gives results that are similar in size to our baseline but only significant at conventional levels for FLFP in services.
In Table Online Appendix A11, similarly, we show robustness to the use of two alternative measures of influenza mortality. In Panel A, we replace the numerator of our death rate estimate with deaths due to all causes in 1918–1919. In Panel B, we use an estimate of “excess” influenza mortality. That is, we replace the numerator of our death rate esti-mate with the difference between the average number of influenza deaths in 1918 and 1919 and the average number of annual influenza deaths in the years immediately preceding the pandemic, 1913 through 1917. Both panels reveal the same qualitative pattern as our main results. There is a temporary increase in FLFP in the most-affected districts, but this increase is not sustained to 1931.
Finally, we demonstrate that the smaller categories of beggars and prostitutes and inmates of jails, asylums, and alms houses do not drive our results. In Online Appendix Table A12, we show that excluding these categories from the numerators of both total FLFP and FLFP in services does not change our main results. In Online Appendix Table A13, we do the same for our potential mediating variables.
CONCLUSION
In this paper, we ask whether the influenza pandemic in India led to an increase in FLFP. Our answer is yes, but that the increase is temporary. We observe a short-lived increase, concentrated in services, which is reversed within a decade. Population density (the aggregate land-labor ratio) is not a sufficient statistic for these results. Influenza increased the share of widows in the population. This explains part of the short-run effect, but not all of it. Mortality also raised wages, including in services. FLFP’s response to a major demographic shock in India was confined to services and was not durable. This contrasts with other historical cases. One possible explanation for this contrast is cultural norms. It may be that the ability of women to increase their participation in the labor market is limited in this context to periods of economic distress.


 Open access