Introduction
Columbia Glacier, located about 30 km west of Valdez, Alaska, is a large temperate tidewater glacier that calves into Columbia Bay, one of the inlets of Prince William Sound. Changes on the glacier began in the late 1970s and greatly increased beginning in 1982. During the early 1980s the glacier terminus retreated, the entire lower reach thinned, and speed and strain rate increased.
The causes of the rapid retreat of Columbia Glacier arc not well understood. According to the commonly accepted model, retreat of a glacier snout into deeper water leads to larger calving rates and accelerated retreat (Brown and others. 1982). However, this view is challenged by Van der Veen (1996) who proposes that terminus position is controlled by the ice thickness in excess of flotation, which is maintained at about 50 m. The implication is that the rapid retreat of Columbia Glacier was initiated and sustained by thinning of the glacier, rather than by increased calving rates as the terminus retreated into deeper water. The distinction between these interpretations bears on the process by which tidewater glaciers calve and retreat.
A second issue is the role of longitudinal compressive stress. Backstress originating at the terminal moraine has been suggested as an important control on the speed of tidewater glaciers. Meier and Post (1987) argue that the dramatic speed-up of Columbia Glacier in 1982 is partially due to the release of backstress as the ice front retreated from the terminal moraine and lost contact with Heather Island, at the mouth of the fjord. Backstress is also suggested as a model for the linkage between seasonal speed and terminus-position cycles (Krimmel and Vaughn, 1987).
The critical-buoyancy and backstress models are tested in this contribution by considering the time evolution of extension rate and ice speed on the lower reach of Columbia Glacier.
Calculation Procedure
Repeat aerial photogrammetry of Columbia Glacier has been conducted since the summer of 1976. Surface features (mainly crevasses) are traced on successive photographs (Fountain, 1982; Krimmel, 1987, 1992). Data from 52 flights. typically spaced 1–3 months apart, covering the period 1977–87 are used in the present study. Increased time separation of later flights hampers detection of seasonal variations. Width-averaged terminus positions used in this study are from Krimmel (1992).
To facilitate finite-difference calculations, the irregularly spaced velocity determinations were interpolated to a regular grid using a Kriging procedure contained in Surfer ® software (Golden Software, 1994). The grid interval used in prior studies (762.5 m) is chosen, as it is reasonably close to the average data-point spacing and ice thickness. Gridded results from Surfer ® are very similar to those of the more complex gridding method of Rasmussen (1989). Erroneous data for each epoch were identified by comparing velocity vectors with neighbors. Suspect data were identified and discarded after consultation with R. Krimmel (who had done most of the measurements). Less than 1% of the position determinations were discarded.
Error Propagation
Errors in velocity arise from point identification on the photographs and from interpolation of the irregularly spaced velocity data to grid nodes.
The error in the horizontal position of well-defined points is estimated to be 2 m (Meier and others, 1985). For a time spacing of 0.115 a (the average summer spacing, ignoring large (4 month) winter gaps), the resulting error in a component of velocity is 25 m a−1. This is small compared to speed cycle amplitudes (500–2000 m a−1).
Error introduced in interpolating velocities to regular grid nodes is determined by calculating the standard deviation of differences between the interpolated and uninterpolated values (called a residual). For the Columbia Glacier data set, the standard deviation of all residual values calculated over the entire grid ranges between 35 and 45 m a−1, depending on the epoch pair. The largest residuals are due to excessive smoothing by the gridding routine where there are large gradients in velocity. This occurs mainly toward the sides of the glacier. The interpolation error is much smaller (10 m a−1), near the central flowline considered here. This smaller error is relevant to the present calculations.
Error in strain rate follows from error in velocity. We assume that the two error sources (point identification, 25 m a−1, and interpolation, 10 m a−1) are independent and quadratically additive (net uncertainty: 27 m a−1). The uncertainty in calculated strain rate for a typical epoch pair is then 0.05 a−1 (time span of 0.115 a, grid spacing 762.5 m). This estimated uncertainty is small compared to the seasonal variation in strain rate near the icefall and at the terminus (0.2 a−1).
Time Changes In Speed
The motion of Columbia Glacier in the studied reach (Fig. 1) is mainly by basal sliding. Even at minimum speed, 90% of surface speed is due to sliding (Meier and Post, 1987). Internal deformation may be neglected as a major contributor to speed.
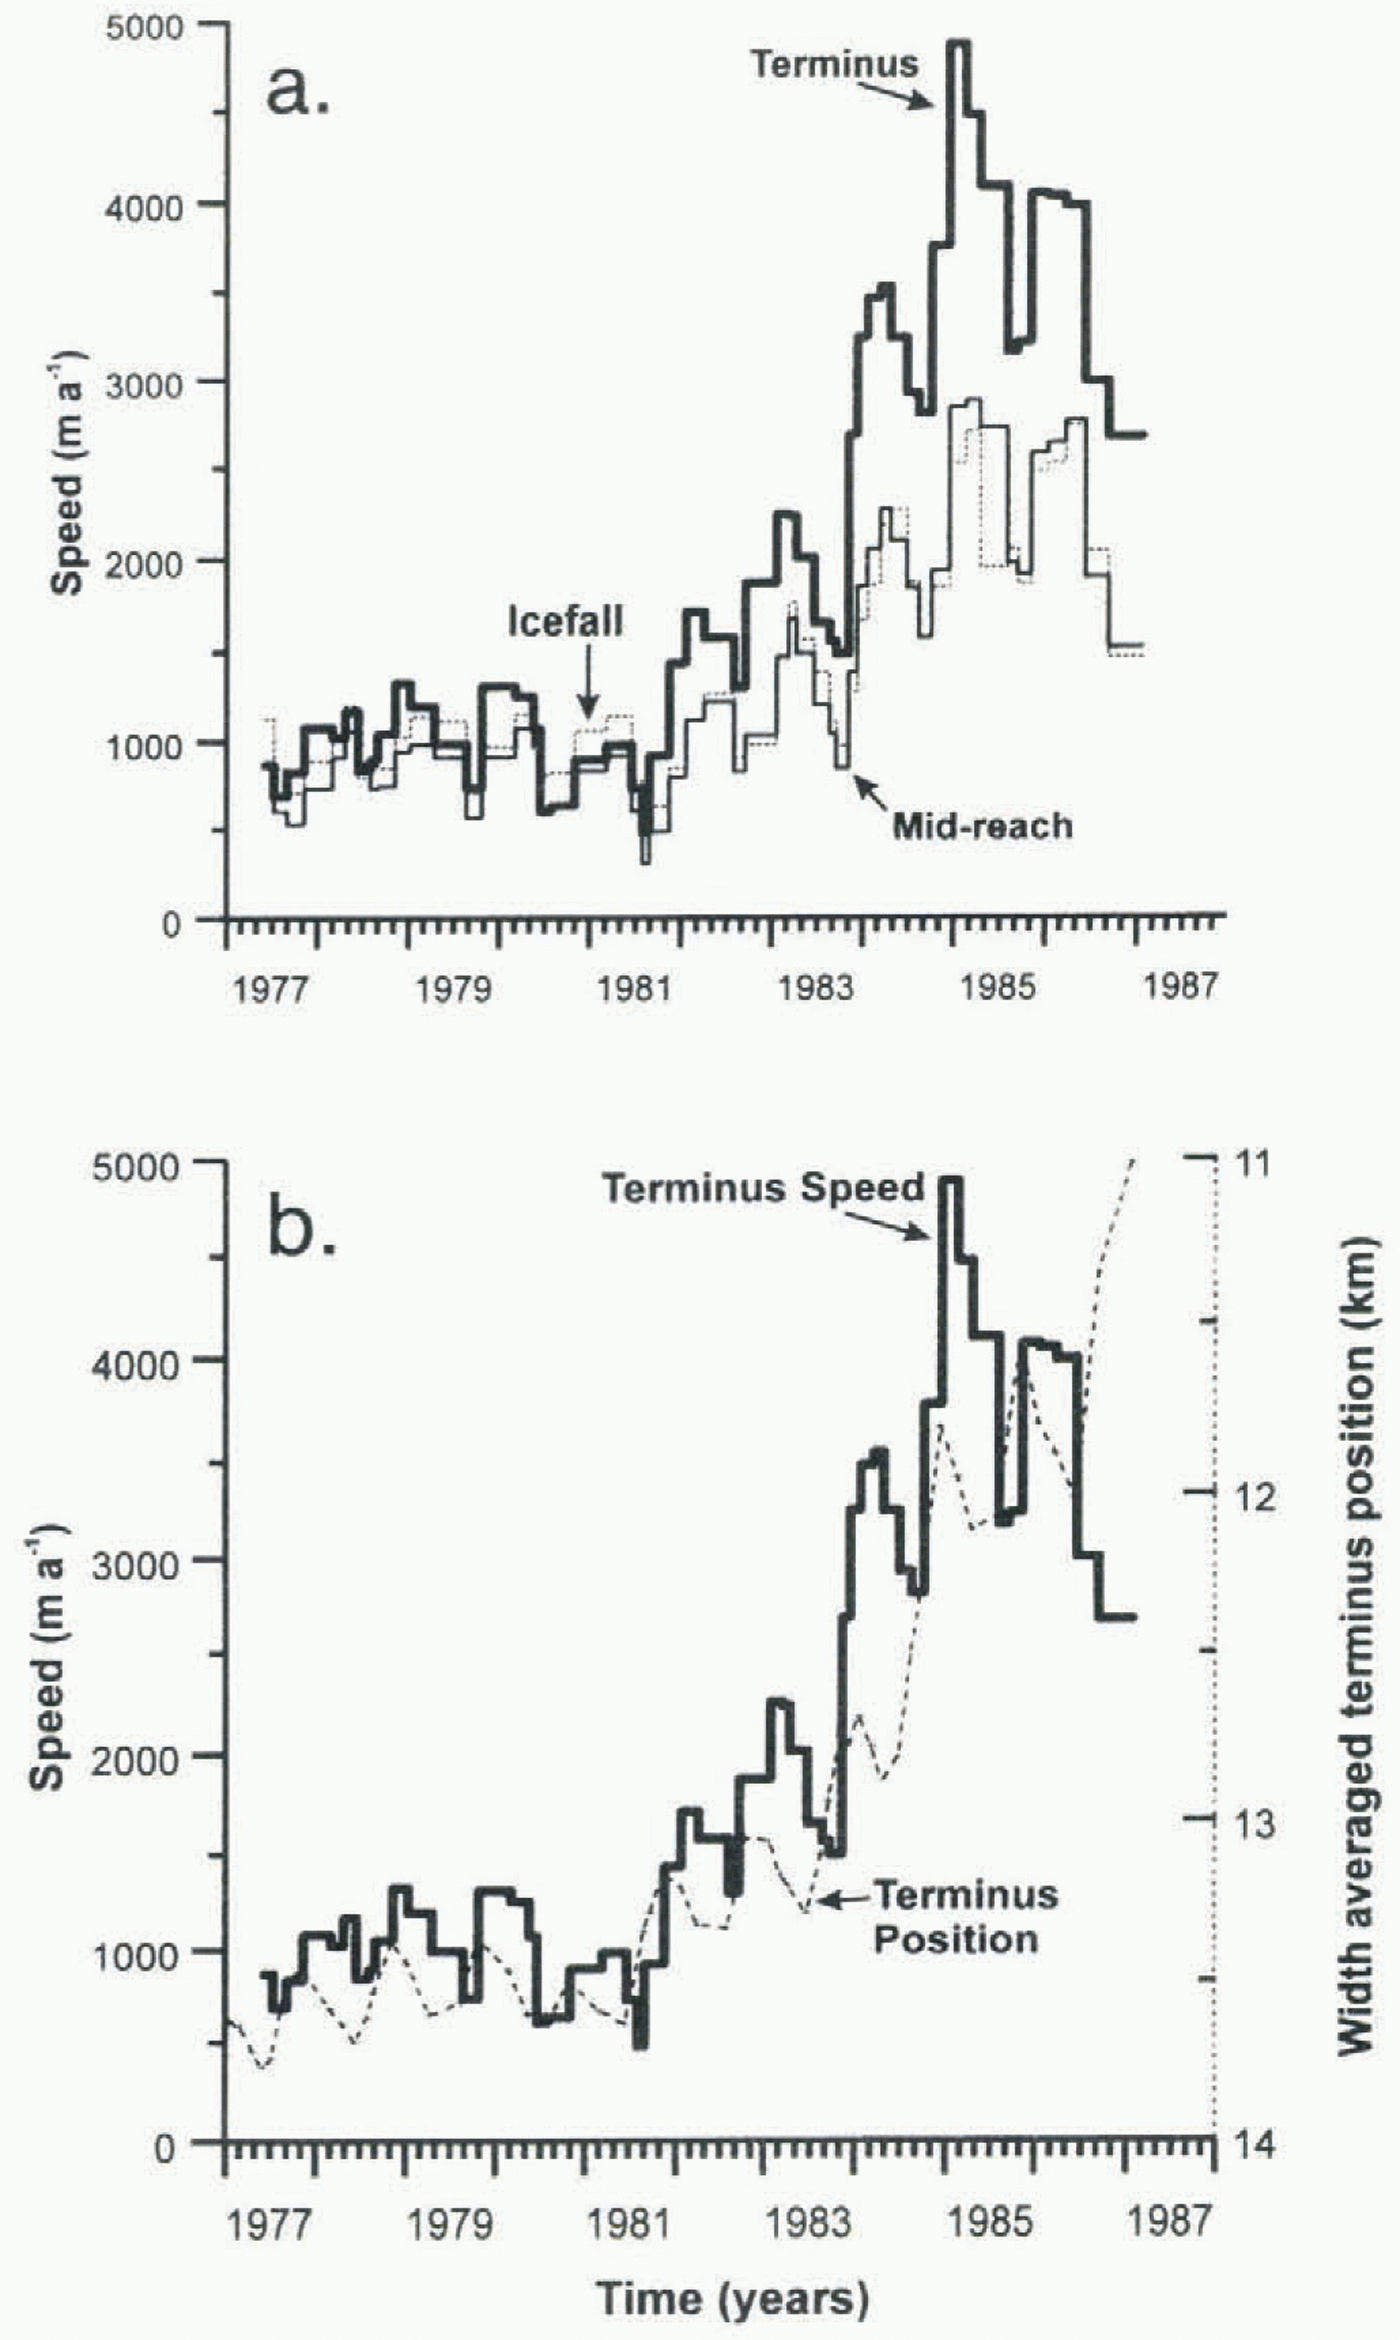
Changes in speed are shown in figure 2a for the three sites identified in Figure 1. Speeds triple in magnitude between 1981 and 1987. Superimposed on this long-term trend are seasonal variations, with speeds reaching maxima from mid-winter in spring, depending on the position along
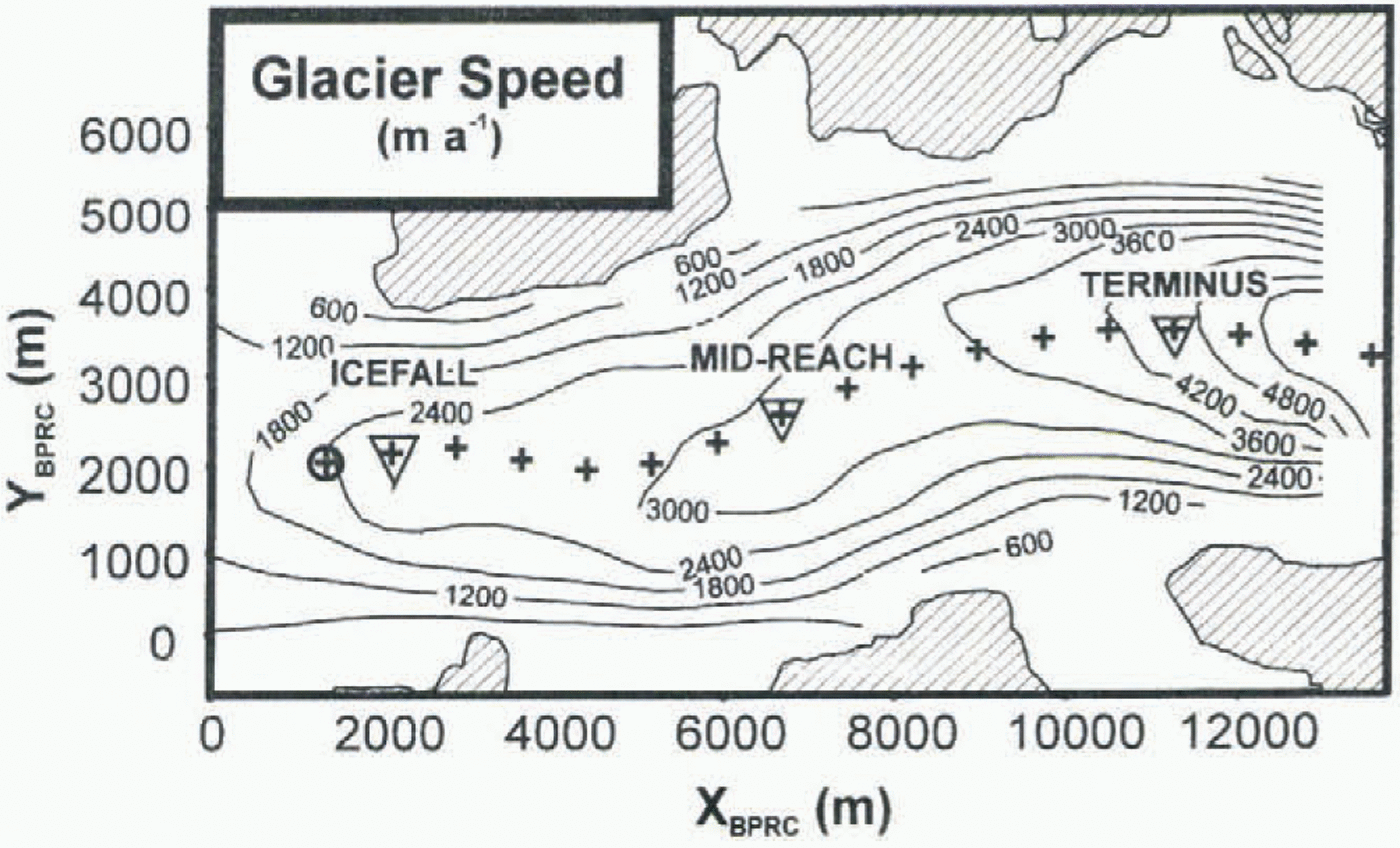
Map of lower reach of Columbia Glacier. Isotachs show ice speed (interval 600 m a−1) for the time span 18 February–18 April 1985. Motion is from left to right. Plus signs delineate points along renter line defined by Sikonia (1982). This trajectory is close to the average dynamic center line of the glacier. The plus sign in a circle is the origin for the along-center-line trajectory. The plus signs with triangles are the sites used in

subsequent figures. The terminus is near XBPRC = 14 000 (m). An icefall is at XBPRC = 1000 (m). Coordinates are tied to the system employed by the U.S. Geological Survey (USGS) such that XBPRC = 27 523 (m) – YUSGS and YBPRC = XUSGS − 4029.5 (m).
(a) Ice speed at three sites along the glacier. The heavy dark line is for along-flow position 10.17 km, near the terminus. The thin line is for along-flow position 5.46 km, in the mid-lower reach. The dashed line is for along-flow position 0.77 km, below the icefall. Average error in speed is 27 m a−1. (b) Glacier speed at position 10.17 km and terminus position. Terminus position is the width average over the central 2.5 km (Krimmel, 1992). Terminus location is given as along-center-line position.

the glacier. The amplitudes of these seasonal cycles increase over the period considered.
Terminus cycles in speed are out of phase with the rest of the lower reach. This relative timing is best described using along-flow stretching rate because of the coarse time resolution (up to 4 months between flights).
Along-Flow Extension Rate
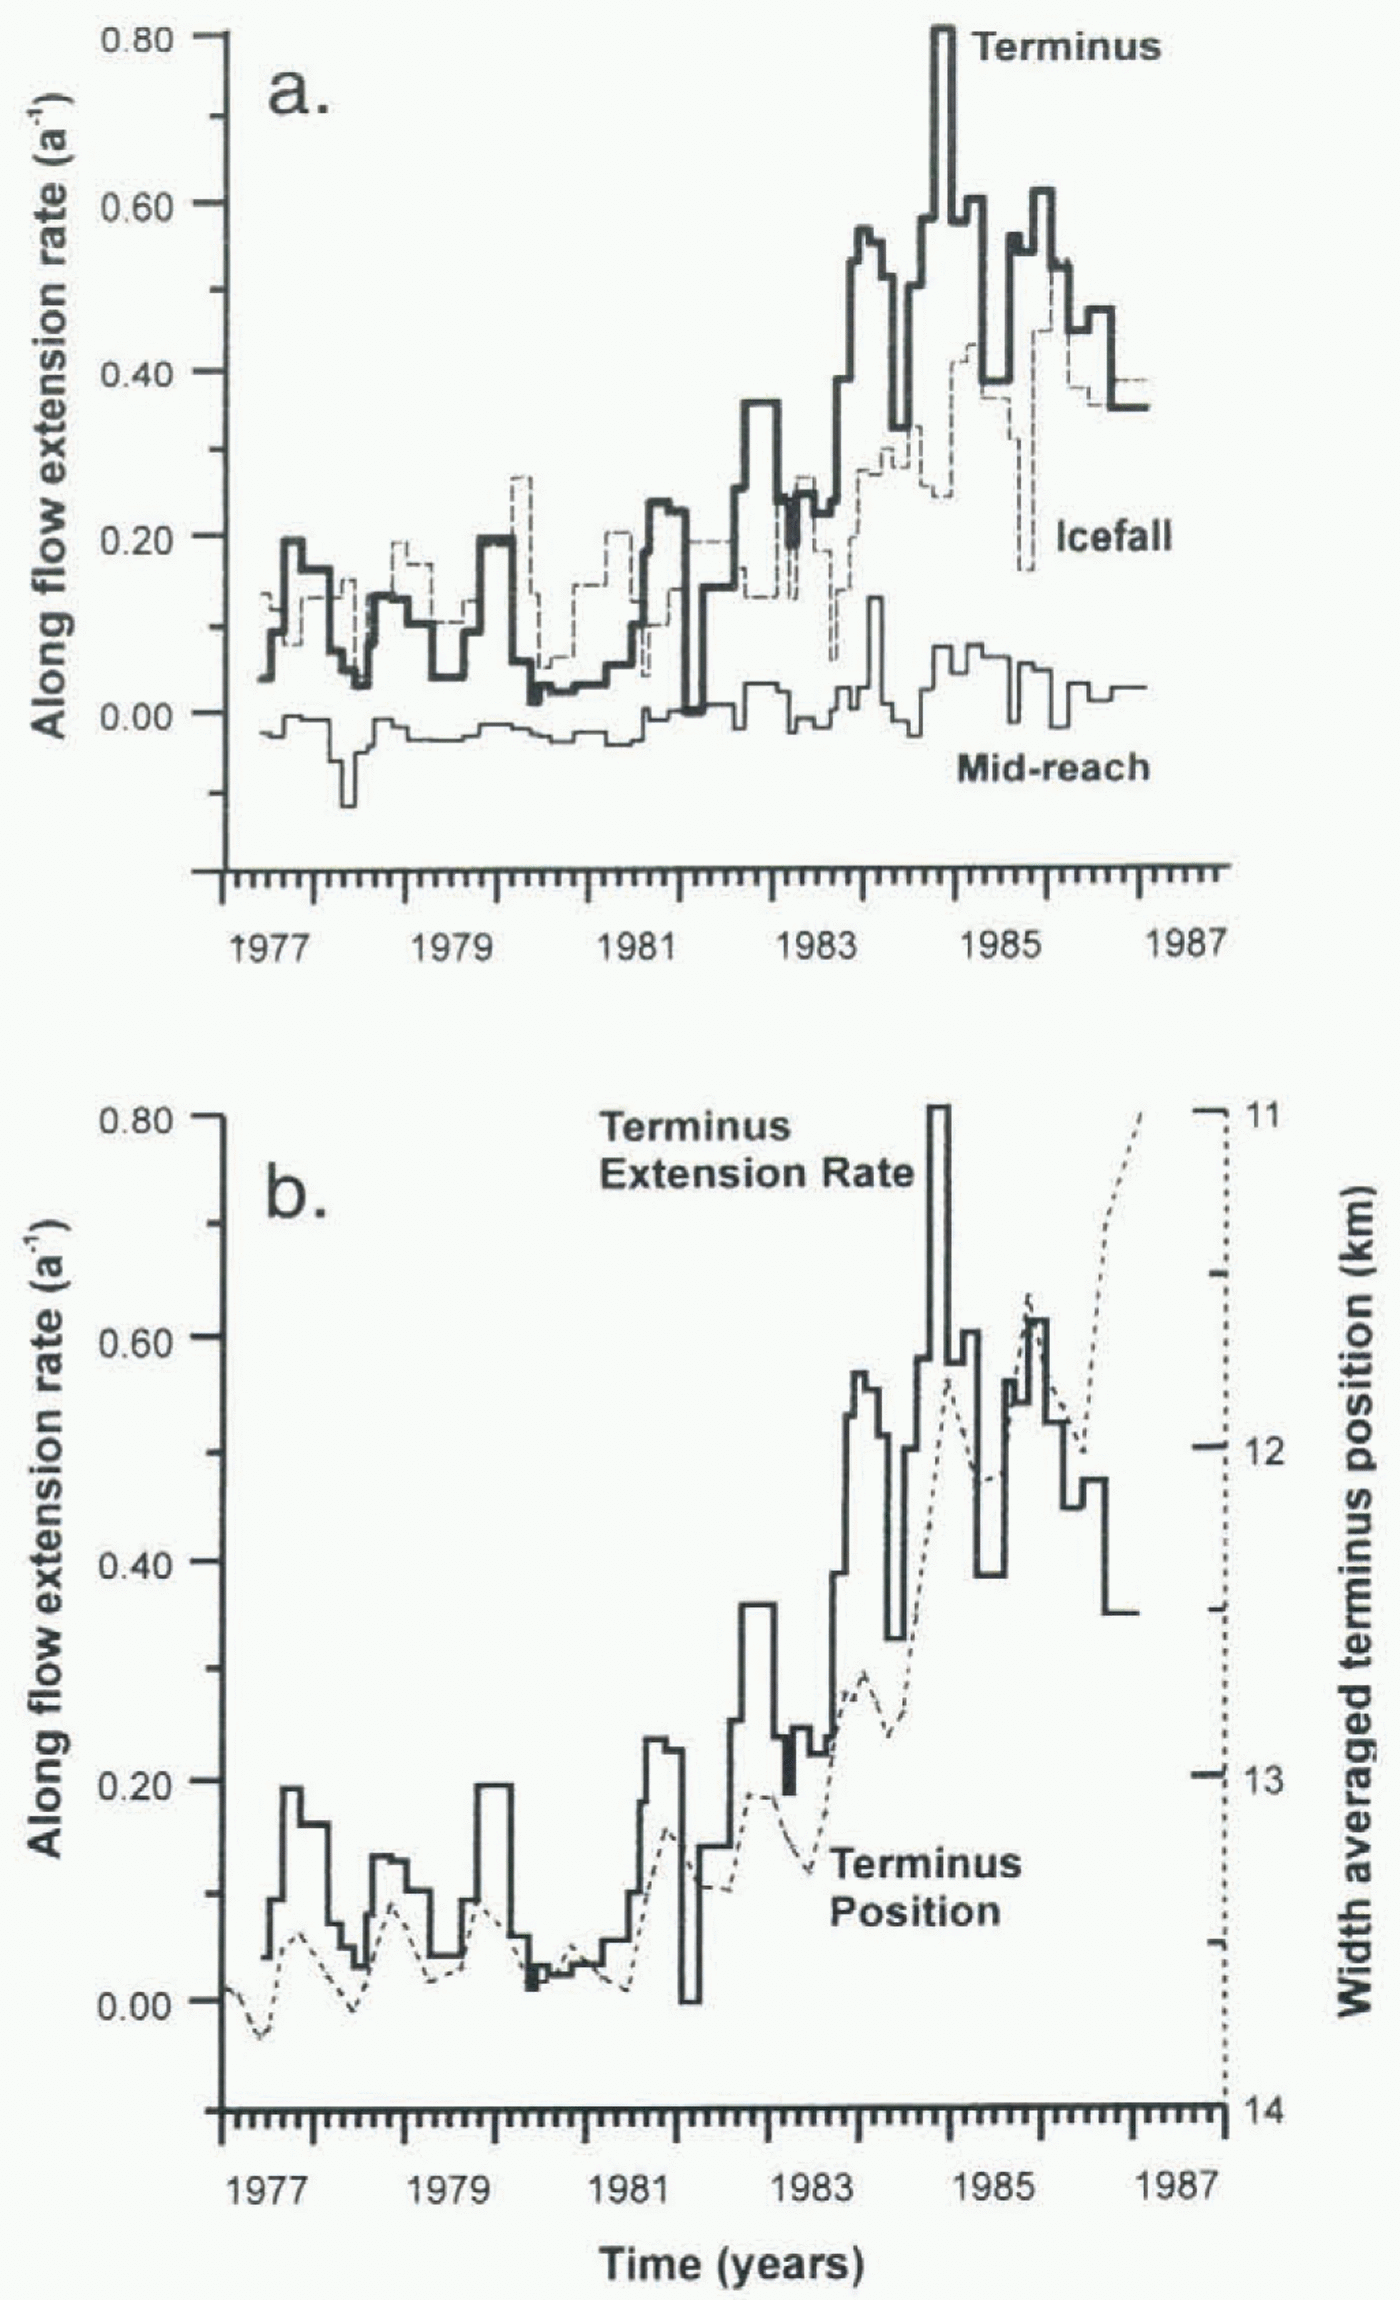
The largest values in along-flow extension rate occur below the icefall between 0 and 2 km, and near the terminus between 7 and 12.5 km (figs 3 and 4a), Stretching rates are nearly zero in the central portion.
Extension rate varies seasonally (Fig. 4a). The maximum (minimum) in extension rate is reached between September and early January (July, August). These cycles in extension rate are due to the terminus region speeding up
Along-flow stretching rate. The flow-following coordinate system (Whillans and others, 1993) is used, in which the axes are in the direction of the velocity vector and transverse to this direction. Velocity gradients are calculated over neighboring grid lengths in the x and y system, then are interpolated to the calculation points (17 points used; Fig. 1) and converted to flow-following coordinates using standard transformation matrices. Isoline interval is 0.10 a−1. Estimated error is 0.05 a−1. Terminus positions as in figure 2b. Triangles indicate the positions used in other figures.

(slowing down) earlier and by a larger amount than the mid-reach.
Backstress
The baekstress model holds that seasonal cyclicity in speed and stretching rate near the terminus is due to changing horizontal compressive stress as the terminus presses more or less firmly against Heather Island and its neighboring shoal. According to Krimmel and Vaughn (1987), the relative timing of speed with glacier length supports this model, as do changes in the phase of maximum speed as the glacier undergoes a net retreat from the island and shoal.
The time series of seasonal cycles in speed and extension rate do not support the backstress model. If backstress causes seasonal cycling, the annual amplitude in speed and stretching rate should decrease as the glacier recedes off the shoal, and end altogether in 1984, when the glacier lost contact with the shoal. Instead, the glacier shows seasonal cycling in speed (Fig. 2a) and extension rate (Fig. 4a) at least to the end of 1986. Also, if backstress is important, the seasonal maxima would occur progressively later in the year as the glacier retreats off the shoal (Krimmel and Vaughn, 1987). However, there is no systematic change in velocity-maxima phasing at the terminus over the study period. The simple interpretation is that controls on speed are constant throughout the study period and that processes other than backstress are responsible for the seasonal cycles.
Along-flow extension rate for the three sites displayed in Figure 1. (b) Along-flow extension, rate at position 10.17 km and width-averaged terminus position.

Height Above Buoyancy
The second model tested is that terminus position on Columbia Glacier is controlled by the height above buoyancy at the terminus (Van der Veen, 1996). Height above buoyancy is the thickness of ice in excess of flotation. As the glacier thins, the position of the critical height above buoyancy moves up-glacier and the rate of calving adjusts to keep the ice front at the critical height. The critical-buoyancy model includes both thickness and water depth, but for Columbia Glacier changes in water depth with terminus position are smaller than thickness changes.
Thickness change on the glacier is estimated from extension rate. From considerations of continuity, the thinning rate at the terminus is nearly proportional to along-flow extension rate. Other terms in the continuity equation (speed, thickness gradient, transverse flow stretching and surface melting) have much smaller contributions. Also, secondary strain rates associated with the curvature of the calving front are minor. This proxy of extension rate for thinning is more precise than direct measurements of surface elevation.
The model is tested by comparing ice-thickness change estimated from extension rate with terminus position (Fig. 4b). There is a close in-phase relation between seasonal ice thinning (extension rate) and minimum terminus position. Furthermore, in 1983 the time duration and up-glacier extent of near-terminus extension rate (thinning) increases, causing additional terminus retreat (Fig. 3).
Conversely, ice speed is often out of phase with terminus position and stretching rate (Fig. 2b). Minimum terminus positions precede the maximum speed by 1–3 months in five of the nine years studied. Speed has a smaller effect than thinning on terminus position.
Unusual Year
The year 1980–81 is special because seasonal cycles are much reduced near the terminus, and the glacier retreats half the usual seasonal distance. At the terminus, the amplitude in speed (Fig. 2b) is half that in adjacent years and there is no extension rate maximum (Fig. 4b).
The small terminus retreat is interpreted as a lack of extension-induced thinning (Fig. 3). Terminus retreat that does occur in this year is likely the result of thinning due to secondary processes such as ablation and non-buoyancy-dominated calving. The lack of extension rate is probably due to a change in the usual seasonal subglacial water cycle that greatly reduced the seasonal extra speed-up of the terminus region.
In contrast, seasonal cycles for 1980 and 1981 are normal near the icefall and mid-reach. This applies to both extension rate (Fig. 4a) and speed (Fig. 2a). The year 1980–81 is unusual only near the terminus.
Discussion And Conclusions
This investigation of the time evolution of speed and stretching rate has led to a better understanding of processes acting on the lower reach of Columbia Glacier. Backstress seemed to be a viable model for accounting for the annual terminus position cycle while the glacier was in contact with the terminal moraine. However, seasonal cycles in speed and extension rate continued after the glacier retreated off the moraine, indicating that backstress is not a primary control on flow.
A model that fits the observations is the requirement that the terminus maintain an ice-front thickness of 50 m in excess of flotation (Van der Veen, 1996). According to this view, the calving rate is a slave to processes that decrease ice thickness and increase water depth at the ice front. For Columbia Glacier, changes in ice thickness occur at a rate faster than the glacier can retreat into deeper water. Hence, ice-thickness changes are the prime determinant of terminus position.
A deeper question is what controls the thickness of the glacier. The seasonal cycle of thickness change for the lower reach is largely controlled by along-flow stretching rate. Stretching rate in turn is controlled by a longitudinal increase in basal sliding toward the terminus.
Following conventional models on sliding controls, we suppose that speed cycles are due to changes in the sub-glacial plumbing system. Kamb and others (1994) demonstrate that increases in basal water storage on the days-to-weeks time-scale cause larger speeds on Columbia Glacier. It is likely that seasonal water-input changes on Columbia Glacier also cause speed cycles as they do on other glaciers (Hodge, 1974; Iken and others, 1983). Speed on Columbia Glacier is fastest in winter. At this time, water throughput is small and drainage inefficient, which likely results in large basal water pressures and storage. In summer to late autumn, drainage is probably by tunnels and conduits as needed to evacuate the summer ablation and extra rainfall of autumn. This efficient drainage system decreases the distribution and magnitude of water pressure and subglacial storage, and accounts for slower summer and autumn ice speeds.
Seasonal increases in sliding near the terminus lead to extensional thinning. Extra stretching near the terminus reaches a maximum during autumn, the time of maximum rainfall in southeast Alaska (Burrell, 1983). The autumn increase in precipitation likely leads to an extra increase in water pressure and/or distribution in the near-terminus region. The seasonal increase in precipitation may then be ultimately responsible for the annual terminus-position cycles.
Extra terminus stretching is likely linked to special hydraulic effects on sliding in the near-terminus region. Extra stretching may be the result of important effects on water pressure/storage due to connectivity with the ocean. Alternatively, the very small slopes near the terminus may lead to R-channel instability and a distributed drainage system as suggested by Bindschadler (1983). Extra terminus stretching may also be linked to a near-terminus deformable bed. A thick layer of sediment could cause formation of a distributed channel system of the type discussed in Walder and Fowler (1994). A deformable bed would also help explain the early slow-down of the terminus region. The early slowdown may be linked to the development of effective drainage channels in the sediment, resulting in an early decrease in water storage. Whatever the precise model, clearly a special change in basal hydrology near the terminus has an important role in seasonal thinning and terminus position.
It is important to note that changes in ice thickness initiated at regions other than the terminus can also contribute to retreat. For example, beginning in 1983, there is a large increase in along-flow extension rate at the icefall (Fig. 3). Consequent thinning will eventually reach the terminus and cause additional retreat.
Because processes that control ice thickness are global in nature, studies of calving confined to the ice front are of limited value in determining the mechanisms responsible for rapid retreat. In order to obtain accurate predictions of tidewater glacier stability, future studies must take into account drivers of thickness change (ice flow, mass balance) throughout the glacier, as well as possible changes in water depth as the terminus retreats into the fjord.
A further question concerns the physics behind the critical-buoyancy model, which at present is not understood. However, deducing this physics seems to be less critical to understanding the collapse of the glacier than determining the causes of thinning.
Acknowledgements
Thanks are extended to R. Krimmel for sending digital values and providing corrections to the data. Helpful comments from N. Spedding and an anonymous reviewer resulted in significant improvement to the manuscript. Figures were drafted by J. Jaros. S. Na conducted first-level data organization and quality checks. This work was supported by U.S. National Science Foundation grant No. OPP-9321556. This is Byrd Polar Research Center contribution No. C1014.