


Introduction
Cover crops provide many benefits to producers (Abdul-Baki et al., Reference Abdul-Baki, Morse, Devine and Teasdale1997; Burket et al., Reference Burket, Hemphill and Dick1997; Wang et al., Reference Wang, Ngouajio, McGiffen and Hutchinson2008; Coombs et al., Reference Coombs, Lauzon, Deen and Van Eerd2017). Nitrogen (N) supply for the subsequent cash crop is one of the most important (Hargrove, Reference Hargrove1986; Wilson and Hargrove, Reference Wilson and Hargrove1986; Wagger, Reference Wagger1989b; Torbert et al., Reference Torbert, Reeves and Mulvaney1996; Kuo et al., Reference Kuo, Sainju and Jellum1997). Nitrogen mineralized from legume cover crop residue can improve yields in row crops (Touchton et al., Reference Touchton, Rickerl, Walker and Snipes1984; Torbert et al., Reference Torbert, Reeves and Mulvaney1996; Gentry et al., Reference Gentry, Snapp, Price and Gentry2013). Cover crop effects on yield in vegetable production systems are less clear. Yields may be increased or decreased depending on the cover crop species and quality (Wyland et al., Reference Wyland, Jackson, Chaney, Klonsky, Koike and Kimple1996; Burket et al., Reference Burket, Hemphill and Dick1997; Muramoto et al., Reference Muramoto, Smith, Shennan, Klonsky, Leap, Ruiz and Gliessman2011; Brennan and Boyd, Reference Brennan and Boyd2012; Brennan et al., Reference Brennan, Boyd and Smith2012; Luna et al., Reference Luna, Sullivan, Garrett and Xue2020), soil fertility (Muramoto et al., Reference Muramoto, Smith, Shennan, Klonsky, Leap, Ruiz and Gliessman2011), cover crop management such as surface residue vs incorporation (Wang et al., Reference Wang, Ngouajio, McGiffen and Hutchinson2008; Finney et al., Reference Finney, Creamer, Schultheis, Wagger and Brownie2009; Jahanzad et al., Reference Jahanzad, Baker, Hashemi, Eaton, Sadeghpour and Weis2016) as well as synchronization of N release with the N demand of the crop (Griffin and Hesterman, Reference Griffin and Hesterman1991; Schellenberg et al., Reference Schellenberg, Morse and Welbaum2009). It is difficult to meet the entire N requirement for high N demand crops with N derived from cover crops (Schellenberg et al., Reference Schellenberg, Morse and Welbaum2009); however, particularly in certified organic production systems, cover crops are an economically important source of N (Muramoto et al., Reference Muramoto, Smith, Shennan, Klonsky, Leap, Ruiz and Gliessman2011).
One barrier to cover crop use is the uncertainty of how much N will be available and the timing of its release (Muramoto et al., Reference Muramoto, Smith, Shennan, Klonsky, Leap, Ruiz and Gliessman2011; Brennan et al., Reference Brennan, Boyd and Smith2012). The amount of N available to the following cash crop varies with cover crop biomass, C:N ratio, quality such as the amount of carbohydrates and lignin (Vigil et al., Reference Vigil, Kissel and Smith1991), residue management, soil physical and chemical properties, as well as environmental conditions such as soil moisture, soil temperature (ST) and relative humidity (Vigil and Kissel, Reference Vigil and Kissel1991; Odhiambo and Bomke, Reference Odhiambo and Bomke2000; Seiter and Horwath, Reference Seiter, Horwath, Magdoff and Weil2004).
There are several methods for estimating the available N from cover crops. Clark (Reference Clark2007) gives guidelines for estimating N mineralization based on the aboveground biomass of the cover crop and the approximate N concentration for legumes, grasses and some broadleaf cover crops. The method is user-friendly and provides a rough estimate of the amount of available N, but it does not give the rate or timing of release. Sullivan and Andrews (Reference Sullivan and Andrews2012) developed a farmers' guide to predict the plant available N (PAN) for cover crops (Oregon State Organic Fertilizer and Cover Crop Calculator—http://smallfarms.oregonstate.edu/calculator). The PAN prediction is based on a linear relationship between the N content of the cover crop and PAN over time (Vigil and Kissel, Reference Vigil and Kissel1991). White et al. (Reference White, Finney, Kemanian and Kyle2016) used a model-data fusion approach to predict corn yield response to cover crops. The model uses a humification coefficient based on the C:N ratio of the cover crop residue to predict net mineralization/immobilization for conditions in Pennsylvania.
Several models simulate the complex processes of N cycling in agricultural systems (Cabrera et al., Reference Cabrera, Kissel and Vigil2005). Complex process-based models have not been suitable for use on-farm, although the Precision Nitrogen Management model is the basis for the Adapt N tool used by farmers (Melkonian et al., Reference Melkonian, Poffenbarger, Mirsky, Ryan and Moebius-Clune2017). Better tools could reduce the uncertainty for farmers regarding the N mineralized from cover crops. For tools to be useful, they need to make information rapidly available and be user-friendly. Our approach uses the N subroutine from the CERES crop models that combine the complex N processes into a single set of calculations to estimate N mineralization from cover crop residues (Vigil et al., Reference Vigil, Kissel and Smith1991; Bowen et al., Reference Bowen, Jones, Carsky and Quintana1993; Quemada and Cabrera, Reference Quemada and Cabrera1995). Recent updates of the model, including its linkage to weather station data and to specific cover crop chemistry, along with field-testing are described by Woodruff et al. (Reference Woodruff, Kissel, Cabrera, Hitchcock, Gaskin, Vigil, Sonon, Saha, Habteselassie and Rema2018). Briefly, the model uses cover crop biomass and quality (percent of total N, carbohydrates, cellulose and lignin) along with a 5-yr average of daily soil moisture and ST from local weather stations to predict the amount and rate of available N. This model has been converted into a web-based calculator, the Cover Crop N Availability Calculator (Calculator), that farmers can use to predict N credits or debits to better manage N fertilizer applications.
Several advances have made this approach practical. First, because many cover crops are used as forages, work by the Near Infrared Reflectance Spectroscopy (NIRS) Forage and Feed Consortium can be used to predict the cover crop quality by NIRS [e.g., crude protein (CP), acid detergent fiber (ADF), etc.; http://nirsconsortium.org]. Results of cover crop analysis by NIRS are available within a week compared with several weeks for wet chemistry analysis. Based on the prices at the UGA Agricultural and Environmental Services Laboratories (AESL), the cost of NIRS is seven times less than comparable wet chemistry analysis.
Secondly, Georgia has developed an automated weather network (University of Georgia Weather Network—www.weather.uga.edu) with 85 locations throughout the state that record soil water content (SWC) (0–30 cm) and ST (0–10 cm) so that 5-yr average daily values can be input to the model for specific geographic and time-of-year conditions. The farmer or county agent can select the nearest weather station to their farm to provide these data for the Calculator.
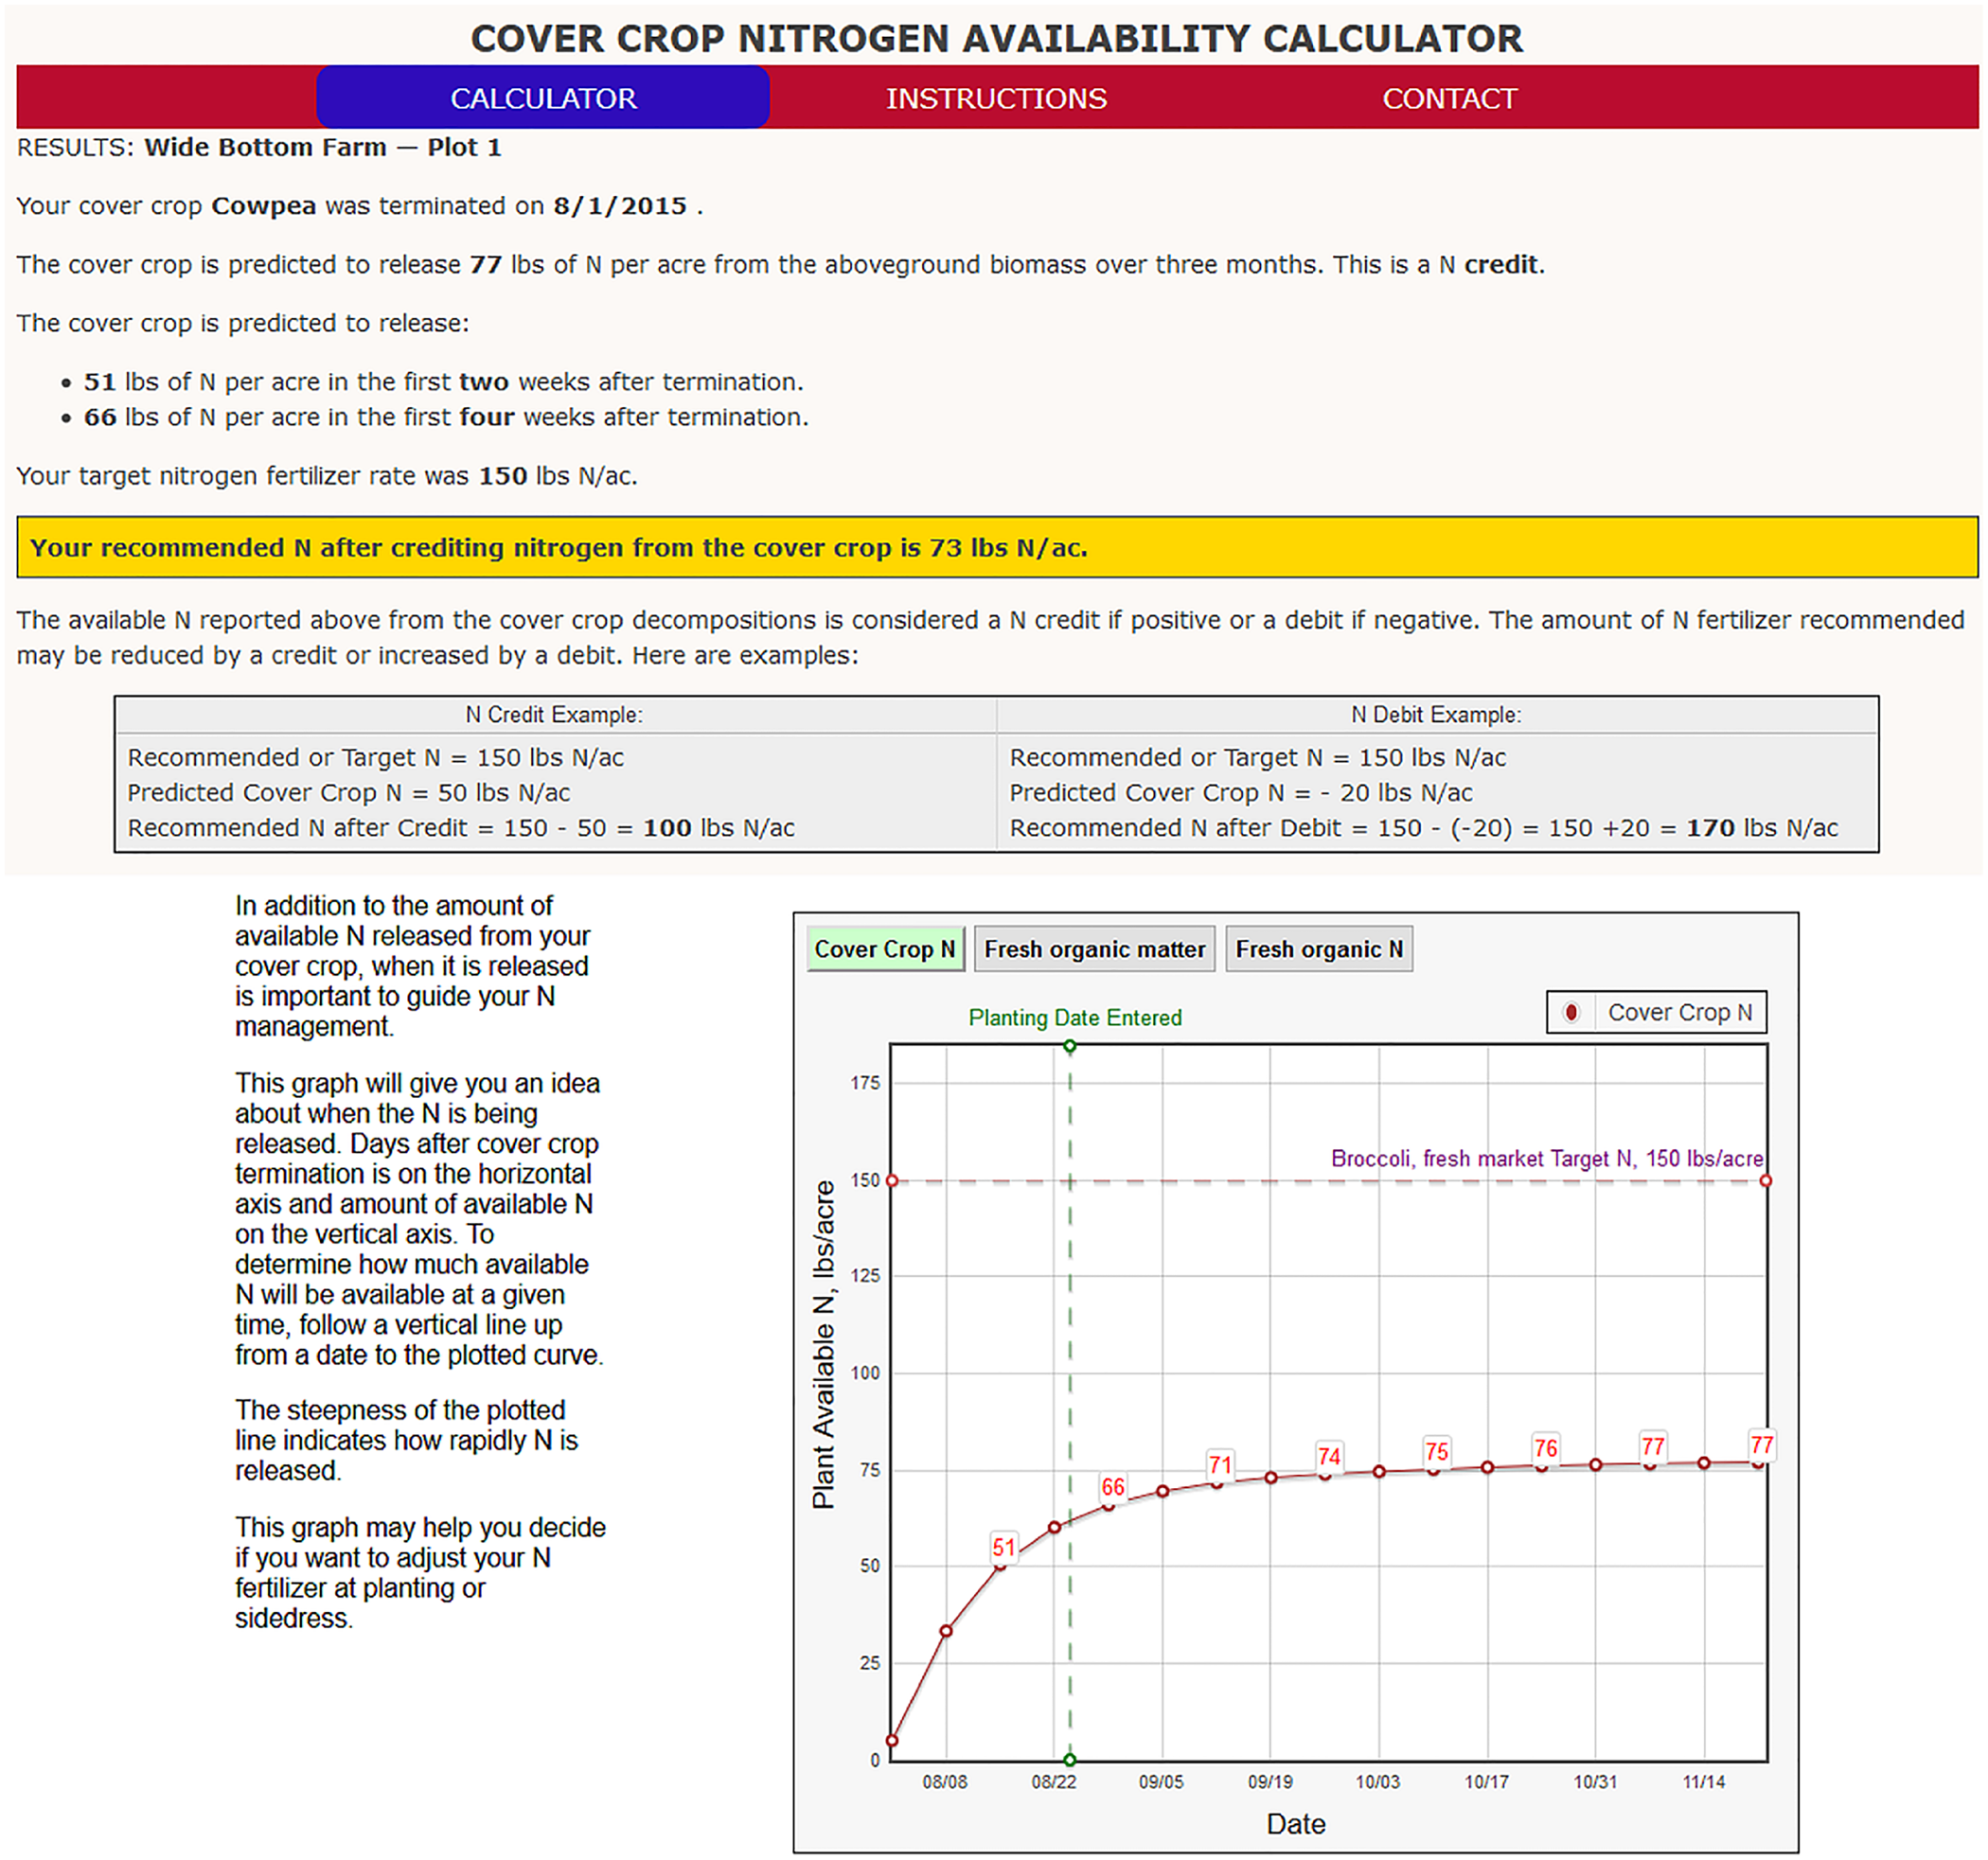
To use the Calculator, county agents, working with farmers, measure fresh cover crop biomass from the field and submit a fresh cover crop sample to the AESL for analysis (Gaskin et al., Reference Gaskin, Hancock, Saha and Chatam2015). The sample submission form asks for: location (to determine the nearest weather station), fresh weight biomass, whether the cover crop will be left on the surface or incorporated, when the cover crop will be terminated, the expected cash crop planting date and whether legumes are greater than 40% of the sample (to select the correct NIRS calibration equation). The laboratory analyzes the sample, calculates dry biomass weight from NIRS percent moisture, pulls the weather data from the selected station, runs the Calculator and sends the results to the county extension office for the farmer (Fig. 1).
Output from the Cover Crop N Availability Calculator showing results from a cowpea cover crop sample. Results are in English units because the Calculator is dominantly used by farmers.
Our work indicated that the underlying CERES-N model provided a good estimate of N mineralization, particularly when cover crops are incorporated (Woodruff et al., Reference Woodruff, Kissel, Cabrera, Hitchcock, Gaskin, Vigil, Sonon, Saha, Habteselassie and Rema2018). However, there were no studies evaluating the effect on cash crop yield if the Calculator prediction of credits or debits was used. Our objective was to test the effect of adjusting N fertilizer rates based on N credits predicted by the Calculator on yield using fall broccoli as a high N demanding model crop.
Methods
Site description
Research farm studies were conducted on the University of Georgia Durham Horticulture Farm (HortFarm) certified organic land (lat 33o55′N, long 83o25′W). There were two on-farm experiments: Crystal Organics Farm (CFarm)—a certified organic farm located in Newton County, Georgia (Piedmont physiographic region) and Wide Bottom Farm (WBFarm)—a small-scale, conventional truck farm located in Habersham County, Georgia in the foothills of the Appalachian Mountains. Soils are fine, kaolinitic, thermic Typic Kanhapludults and were moderately to strongly acid (Table 1). Baseline soil samples (0–15 cm) for Mehlich I P and K (Mehlich, Reference Mehlich1953), pH (1:1 soil: 0.01 M CaCl2) and soil organic carbon (SOC) by combustion (Nelson and Sommers, Reference Nelson, Sommers, Page, Baker, Ellis, Keeney, Miller and Rhoades1982) were collected from each site by compositing seven subsamples from each plot (HortFarm) or from the field (on-farm) in the spring before summer cover crop planting. Phosphorus and K fertilizers as well as lime were applied based on the University of Georgia soil test recommendations (Kissel and Sonon, Reference Kissel and Sonon2008) at the HortFarm and farmer practice at on-farm sites.
Selected soil characteristics for fields used in the experiments to evaluate the Cover Crop N Availability Calculator at the Durham Horticulture Farm (HortFarm) and on-farm sites—Crystal Organics (CFarm) and Wide Bottom Farms (WBFarm)
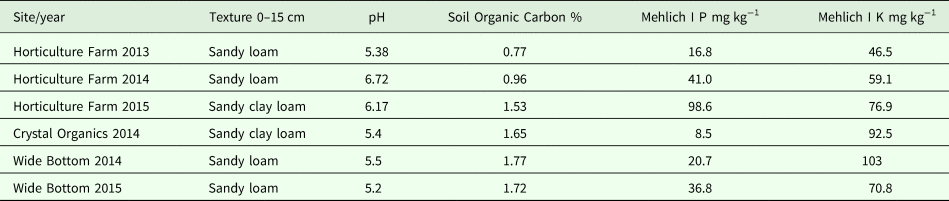
At the HortFarm, the experiment was rotated between two fields to prevent potential disease build up. The field used in 2013 and 2014 (organic management—3/4 yr) had lower SOC than the field used in 2015 (organic management—8 yr). The 2015 field had relatively high SOC for the southeastern USA, where agricultural soils typically range from 0.5 to 1% (Causarano et al., Reference Causarano, Franzluebbers, Shaw, Reeves, Raper and Wood2008; Table 1).
Experimental design and production details
At the HortFarm, a cowpea (Vigna unguiculata L. Walp. var. ‘Iron & Clay’) summer cover crop was grown before fall broccoli [Brassica oleracea L. (Italica group) var. ‘Pakman’]. Cowpeas are a cover crop used in the southern USA (Clark, Reference Clark2007) and one of the most widely used summer-planted legume cover crops. Two treatments, no cover (N FERT) and cover crop treatments (CC CREDIT), each with four levels of N fertilizer application (0N, 0.5N, 1N and 1.5N) were used in a randomized complete block design with three replicates. A target N fertilizer rate (1N) was chosen based on the low end of fertilizer recommendations for fresh market broccoli in Georgia (Kissel and Sonon, Reference Kissel and Sonon2008). In 2013, the target rate was 112 kg N ha−1. It was increased to 168 kg N ha−1 in 2014 and 2015 to increase yield. The CC CREDIT 0N represents N solely supplied by the cover crop, while CC CREDIT 1N represents N predicted to be available by the cover crop (a cover crop credit) and supplemented with N fertilizer to reach to the target rate. Similarly, N FERT 0N represents the no cover treatment with no N fertilizer and N FERT 1N represents N fertilizer applied at the target rate. In 2015, the cover crop N credit was greater than the pre-assigned 0.5N fertilizer rate in several plots; consequently, plots were randomly assigned within the constraint that the N credit was not greater than the target N fertilizer rate.
The design was simplified and adapted for the conditions on-farm. We used a cover crop treatment (CC CREDIT) with four levels of N fertilizer application (0N, 0.5N, 1N and 1.5N) to determine if there was an N response. A no cover crop treatment (N FERT) at the target N rate (168 kg N ha−1, 1N) was used to determine if there were yield differences compared with the CC CREDIT 1N. The study had three replicates in a completely random design. The farmer at CFarm chose a sunn hemp (Crotolaria juncea L. var. ‘AU Golden’) cover crop before ‘Gypsy’ broccoli in 2014 and 2015. There was a broccoli crop failure at CFarm in 2015 and data are not presented for this site-year. The farmer at WBFarm chose a cowpea cover crop with ‘Pakman’ broccoli in 2014 and 2015. At all sites, the cover crop was mowed and incorporated at least 2 weeks before planting the cash crop. Production details are summarized in Tables 2 and 3.
Cover crop planting and termination methods at the Durham Horticulture Farm (HortFarm) and on-farm sites—Crystal Organics (CFarm) and Wide Bottom Farms (WBFarm)

Cash crop planting, management and harvest practices at the Durham Horticulture Farm (HortFarm) and on-farm sites—Crystal Organics Farm (CFarm) and Wide Bottom Farms (WBFarm)

Biomass sampling and analysis
Cover crop biomass was determined using a well-mixed composite of three randomly selected 0.09 m2 quadrats per plot. Cover crop and weeds were separated and identified to genus. The cover crop and weed fractions were dried at 60°C until the weight was stable, then weighed to determine dry weight biomass. The entire sample (cover crop + weeds) was ground in a Thomas–Wiley Mill (Arthur H. Thomas Company, Philadelphia, PA, USA) and samples were submitted to the AESL for NIRS analysis of CP, non-fibrous carbohydrates (NFC), ADF, neutral detergent fiber (NDF), fat, lignin and ash. Cover crops consisting of <40% legumes were analyzed using the ‘Grass Hay 13GH50-2.eqa’ equation developed by NIRS Forage and Feed Testing Consortium (http://nirsconsortium.org). Sunn hemp and cowpeas were analyzed using the ‘Mixed Hay 12MH50-2.eqa’ equation. The percent N, carbohydrates and cellulose used in the N Calculator were calculated from the NIRS results as follows:
 $$\eqalign{& \%\ {\rm N} = \%\ {\rm CP}/{\rm 6}.{\rm 25} \cr & \%\ {\rm Carbohydrates} = \%\ {\rm CP}\, + \,\%\ {\rm Fat} + \%\ {\rm NFC} \cr & \%\ {\rm Cellulose} = \%\ {\rm Cellulose} + \%\ {\rm Hemicellulose}} $$
where:
% Cellulose = % ADF – (% Lignin + % Ash), and
% Hemicellulose = % NDF – % ADF
The % Lignin is determined directly from NIRS calibration. The values for % Carbohydrates, % Cellulose and % Lignin are normalized to equal 100%.
Nitrogen credit/debit prediction
The measured cover crop biomass and quality from NIRS analysis were used in the Calculator to predict the available N for 90–110 days after termination, and an N credit for each plot. The CERES-N submodel divides fresh organic matter (aboveground cover crop residue) into carbohydrates, cellulose plus hemi-cellulose (cellulose) and lignin to reflect different decomposition rates. First-order decay constants for these materials under optimal conditions are 0.14, 0.00255 exp(−12*lignin content), and 0.00095 day−1, respectively. The decay rates are modified by a C:N ratio factor and factors based on the 5-yr average daily soil moisture (0–30 cm) and ST (0–10 cm). Twenty-five percent of the mineralized N is partitioned into SOC when the residue is incorporated into the soil and 12.5% when the residue is left on the surface. The predicted available N only includes the N mineralized from the aboveground cover crop biomass and does not include N mineralized from soil organic matter or from cover crop roots. A detailed discussion of the model and its history is found in Woodruff et al. (Reference Woodruff, Kissel, Cabrera, Hitchcock, Gaskin, Vigil, Sonon, Saha, Habteselassie and Rema2018).
The Calculator predicts available N on a daily basis. Cumulative mineralized N in table form is the output for longer time intervals, typically 2 weeks, with a graph of cumulative available N vs time (Fig. 1).
Yield
At the HortFarm, a one-time harvest of broccoli was conducted by marking a 6-m section of an inner plot row. All broccoli heads were harvested and weighed. At the on-farm sites, the inner row harvest length of broccoli at these sites was reduced to 3-m to leave as much crop as possible for the farmer to sell. At WBFarm in 2014, we harvested twice due to large variations in the maturity of the plots. Reported yields are a sum of the two harvests for this site-year. All yields are total kilograms of broccoli produced.
Equivalent N fertilizer
The equivalent N fertilizer is an estimate of the amount of PAN provided by the cover crop. The yield response to N in no cover crop treatments is used to develop an N response curve. The yield in a cover crop treatment with no N fertilizer (y) is used to solve for the equivalent amount of fertilizer (x) from N fertilizer. At the HortFarm, we fit the broccoli yield as a function of applied N fertilizer to a quadratic or quadratic plateau equation for the N FERT treatments at the four N rates using PROC REG or PROC NLIN in SAS 9.4. The N fertilizer equivalent was calculated by inserting the average yield from the CC CREDIT 0N into the N FERT response equation and solving for the N fertilizer rate predicted for that yield (McVay et al., Reference McVay, Radcliffe and Hargrove1989).
Statistics
Cover crop quality was analyzed using PROC MIXED in SAS 9.4 with Site, Year and Site × Year as fixed effects. Least square means were separated using pairwise differences if the treatment means were significant. Residuals met assumptions for normality. Variances were similar for year but differed by site. Results were considered significant at P = 0.05.
At the HortFarm for each year, PROC GLM was used to determine at what N fertilizer rate there was an N response. Then PROC GLM was used to compare CC CREDIT to N FERT at that N fertilizer rate to determine yield differences. LSMeans was used for means separation at P = 0.05.
For each year and site of the on-farm trials, we used PROC GLM to compare the yields between the CC CREDIT 0N, CC CREDIT 1N and the N FERT 1N. Mean separations were with LSMeans at P = 0.05. A significant difference between the CC CREDIT 0N and CC CREDIT 1N was considered the evidence of an N response. No significant difference between the CC CREDIT 1N and N FERT 1N indicated that the use of the N Credit from the N Calculator did not affect the yields.
Results and discussion
Environmental conditions
In 2013, volumetric SWC and ST immediately after cover crop termination were similar to the 5-yr average (Figs. 2a and 3a). During broccoli growth, SWC was drier, but rainfall was supplemented with irrigation. In 2014, the SWC was lower than the 5-yr average for the broccoli growing seasons (Fig. 2b) and ST was similar to the 5-yr average (Fig. 3b). The cover crop was irrigated during establishment, but not after termination. Broccoli was irrigated after transplanting, which would have ameliorated the lower SWC. During 2015, SWC conditions were periodically dry during cover crop growth, but quite wet after cover crop termination and during broccoli production (Fig. 2c). The ST fluctuated around the 5-yr average (Fig. 3c).
Actual volumetric soil water content recorded at the Durham Horticulture Farm weather station compared to the 5-yr average used in the Cover Crop N Availability Calculator for the 3-yr study. Green arrows indicate cowpea cover crop planting (down) and termination (up). Red arrows indicate broccoli transplanting (down) and harvest (up). (a) 2013, (b) 2014, (c) 2015.

Actual soil temperature recorded at the Durham Horticulture Farm weather station compared to the 5-yr average used in the Cover Crop N Availability Calculator for the 3-yr study. Green arrows indicate cowpea cover crop planting (down) and termination (up). Red arrows indicate broccoli transplanting (down) and harvest (up). (a) 2013, (b) 2014, (c) 2015.

Cover crop biomass and quality
Cover crop biomass differed by year (P ≤ 0.0001) but not by site (P = 0.0890) with a significant site × year interaction (P = 0.0293). Biomass at the HortFarm increased over the 3 yr of the study with the greatest biomass occurring in 2015 (Table 4), most likely due to a greater number of growing days and greater seeding rate (Table 2). Cover crop biomass was greater in 2015 than 2014 at WBFarm, again likely due to greater number of days before termination in 2015 (Table 2). The lowest biomass occurred with the sunn hemp at CFarm and cowpeas at WBFarm in 2014. The conditions were dry during this period and the farmers were not able to irrigate the cover crops.
Average input with standard deviation (in parentheses) for each site-year to the Cover Crop N Availability Calculator at the Durham Horticulture Farm (HortFarm) and the on-farm sites—Crystal Organics (CFarm) and Wide Bottom Farms (WBFarm)

All cover crop residues were incorporated. Letters in columns represent significant differences at P = 0.05.
The average cowpea biomass at our sites was similar to the average reported in the southeastern Coastal Plain of 5618 kg ha−1(Creamer and Baldwin, Reference Creamer and Baldwin2000; Vollmer et al., Reference Vollmer, Creamer, Reberg-Horton and Hoyt2010). The variability among plots on the HortFarm and at WBFarm was high with CVs ranging from 16 to 38%. Some of the variability in biomass was due to weed pressure (data not shown). The high variability in biomass could also be due to establishment through broadcast and raking in the seed; however, variability was still high at the HortFarm 2013 when plots were drilled.
At CFarm, sunn hemp biomass was lower than reported for 60-day sunn hemp planted in June in the Georgia Piedmont (7498 kg ha−1; Schomberg et al., Reference Schomberg, Martini, Diaz-Perez, Phatak, Balkcom and Bhardwaj2007), but similar to values for late-summer-planted sunn hemp in Alabama (5600 kg ha−1; Mansoer et al., Reference Mansoer, Reeves and Wood1997).
Average N concentrations varied less than biomass. In the cowpeas, N ranged from 2.51 to 3.34% (Table 4), which is greater than the reported N concentrations for cowpeas of 1.8–1.9% (Vollmer et al., Reference Vollmer, Creamer, Reberg-Horton and Hoyt2010) and 2.44% (Creamer and Baldwin, Reference Creamer and Baldwin2000). Plant N concentration did not differ by site (P = 0.3125), but did differ by year (P = 0.0004). There was a site × year interaction (P = <0.0001) with large differences in N seen at the WBFarm between 2014 and 2015. This difference is unlikely to be due to growth stage because the cowpeas had not flowered before termination either in 2014 or 2015.
Calculator predictions
Average predicted N credits ranged from 53 to 90 kg N ha−1 (Table 5). At the HortFarm, the greatest N credit was seen in 2015, due to the greater biomass production during that growing season. The predicted available N at transplanting averaged 38% of the average N credit in 2013 (2.1 weeks after termination), 50% in 2014 (3.4 weeks after termination) and 54% in 2015 (3 weeks after termination, Table 5). At 4 weeks after transplanting (6–7.5 weeks after termination), an average of 77% (2013), 81% (2014) and 83% (2015) of the N credit was predicted to be available. These rates are similar to values reported for legumes that typically mineralize most N in the first 4 weeks after termination due to a low C:N ratio (8:1 to 15:1; Wagger, Reference Wagger1989a; Ranells and Wagger, Reference Ranells and Wagger1996).
Average predicted available N with standard deviation (in parentheses) from the Cover Crop N Availability Calculator at the Durham Horticulture Farm (HortFarm) and the on-farm sites—Crystal Organics (CFarm) and Wide Bottom Farms (WBFarm).

The cumulative N was used as an N Credit to reduce the target N fertilizer in the cover crop treatments. WAP indicates weeks after transplanting.
The N credits from the cowpea cover crop at WBFarm were similar to those at the HortFarm (Table 5). The predicted N credit from the sunn hemp cover crop at CFarm was lower due to the relatively low biomass production (Tables 4 and 5).
The greatest demand for N by a broccoli crop is mid-season (Fig. 4). Thompson et al. (Reference Thompson, Doerge and Godin2002) indicate N uptake rates for broccoli are greatest 4–7 weeks before harvest with the greatest uptake rate occurring as broccoli heads begin to form (first bud). In our trials, broccoli was harvested 7–9 weeks after transplanting at the HortFarm and WBFarm. The greatest N demand would have been 3–4 weeks after transplanting. Generally, 80% of the cover crop N was predicted to be mineralized by 4 weeks after transplanting (WAP). The Calculator-predicted N from the cover crop would be available as the transplants began to grow and during the beginning of the period of greatest demand. The predicted available N from the cover crop during a 2-week period would be declining as the broccoli heads were maturing. Harvest at CFarm was much later (13 weeks WAP). Most of the available cover crop N was predicted to have been released by the time heads were maturing at this site, which may have contributed to the generally lower yields at this site.
Hypothetical N uptake in broccoli and cover crop N mineralization. The N uptake curve is based on data from Hemphill and Hart (Reference Hemphill and Hart1991) for June planted broccoli from one field in the Willamette Valley. Note the greatest N uptake occurs 4–7 weeks before harvest. At this point, most of the cover crop N may be mineralized.

Yields
Broccoli yields at the target N rate averaged 3568 kg ha−1 at the HortFarm, 4356 kg ha−1 at WBFarm and 3535 kg ha−1 at CFarm. These yields were lower than for those reported for organic broccoli production (6958 kg ha−1; Boyhan et al., Reference Boyhan, Gaskin, Little, Fonsah and Stone2016). The lower yields are likely due to the one-time harvest. Many organic growers harvest several times and cut only heads that meet certain diameter criteria at any given time, and then harvest sideshoots after the first cutting. Because many factors affect the yield and we were interested in the N response, we chose a one-time harvest that cut all heads within the plot section. Alternatively, the lower average yields may be due to poor synchronization of N with broccoli head development. We used the lower end of the recommended N fertilizer rate for this study to ensure an N response on the organically-managed soils. The N supplied by the cover crop and the fertilizer (feathermeal in organic sites and urea in conventional) may have been depleted by the time heads were maturing, and for this study, broccoli was not sidedressed with N. Sidedressing N is not a typical practice for small organic growers in Georgia.
At the HortFarm, the N FERT 0.5N treatment had significantly greater yield than the 0N treatment in 2013 (56 kg N ha−1; P = 0.0260), 2014 (84 kg N ha−1; P = 0.0021) and 2015 (84 kg N ha−1; P = 0.0013), but there was no difference in broccoli yield among the 0.5N, 1N and 1.5N rates. Therefore, we compared the yield between the N FERT 0.5N and CC CREDIT 0.5N treatments to determine if the use of the predicted cover crop credit affected the yields. There was no difference in yield between the N FERT 0.5N and the CC CREDIT 0.5N in 2013 (P = 0.7105), 2014 (P = 0.7396) or 2015 (P = 0.3045), indicating the cover crop credit predicted by the Calculator did not reduce the yields (Table 6).
Broccoli yield at the Durham Horticulture Farm (HortFarm) as affected by fertilizer N and cowpea cover crop residue. The no cover crop treatment is designated by N FERT

The cover crop treatment is designated by CC CREDIT. N rate represents the fraction of the target N rate of 112 kg N ha−1 in 2013 and 168 kg N ha−1 in 2014 and 2015.
Letters in the yield column indicate significant difference for a particular year at P = 0.05.
In 2013 and 2014, the CC CREDIT 0N had similar yields to the N FERT 0.5N treatment (P = 0.3998, P = 0.2723, respectively; Table 6). In 2013, the cover crop residue without the addition of fertilizer (CC CREDIT 0N) was estimated to provide similar available N (73 kg ha−1) compared with the N FERT 0.5N of 56 kg ha−1. In 2014, yields were similar despite a lower amount of predicted N from the cover crop residue (48 kg ha−1) than the 0.5N rate of 84 kg ha−1. In 2015, yields from the CC CREDIT 0N were similar to the N FERT 0N despite a predicted cover crop credit of 89 kg ha−1. October 2015 received 51 mm of rainfall above normal during the period when broccoli heads were developing (7 WAP). It is possible that the N mineralized from the cover crop was lost from the system through leaching or denitrification since 82% of the total N was predicted to have mineralized by 4 WAP, while plots that received some N fertilizer as feathermeal (moderately-fast release fertilizer) still had available N at the heading stage. If this was the case, we would expect to have an inverse relationship with yield and cover crop credit because the greater the N provided by cover crop the less feathermeal fertilizer was applied. Linear regression indicated a slight negative slope (y = −6.3575x + 4256) but only explained 4% of the variability (R 2 = 0.0396). In addition, CC CREDIT and N FERT at the 1N were similar (Fig. 5c). Consequently, we cannot explain the low yields in the CC CREDIT 0N treatment during 2015.
Fall broccoli yield in the cowpea cover crop and no cover crop treatments at different nitrogen fertilizer rates at the Durham Horticulture Farm. In the cover crop treatments, the N rate is the sum of the predicted nitrogen credit for the cover crop and nitrogen fertilizer to reach each specified rate. The no cover crop treatment received the full specified nitrogen fertilizer rate. The modeled nitrogen response equation for the no cover treatment was used to calculate nitrogen fertilizer equivalent from the cover/no nitrogen (CC CREDIT 0N) treatment, which is labeled 0N on the graph. A dashed line indicates the nitrogen fertilizer equivalent. (a) 2013. The target N rate (1N) was 112 kg ha−1. (b) 2014. The target N rate (1N) was 168 kg ha−1. (c) 2015. The target N rate (1N) was 168 kg ha−1.

Yields for CC CREDIT using the predicted N credit were similar to the N FERT at the 1N in 2014 and 2015 (Figs. 5b and 5c). In 2013, CC CREDIT was much greater than N FERT at the 1N (Fig. 5a). For all years at the 1.5N, the CC CREDIT yields were greater than the N FERT (Figs. 5a–5c). This is further evidence that the use of the predicted N credit did not adversely affect the yields.
On-farm, we saw an N response at CFarm in 2014 (P = 0.0132) and at the WBFarm in 2015 (P = 0.0271; Table 7). In these site-years, there was no difference between the CC CREDIT 1N and the N FERT 1N (P = 0.2774, P = 0.3156, respectively), indicating the use of the predicted N credit did not significantly decrease the yields. There was no N response seen in 2014 at WBFarm. Without an N response, we cannot evaluate the performance of the Calculator, but we note that there was also no difference in the yields when the predicted N credit was used (Table 7), indicating there was no negative effect on the yield from using the credit.
Average broccoli yields with standard deviation (in parenthesis) at the on-farm sites—Crystal Organics Farm (CFarm) and Wide Bottom Farm (WBFarm) for the cover crop treatment with no additional N fertilizer (CC CREDIT 0N), cover crop treatment with N credit given and additional N fertilizer to reach the target N rate of 168 kg N ha−1 (CC CREDIT 1N), and no cover crop treatment with N fertilizer at target N rate (N FERT 1N)

Letters in the columns indicate significant difference at the P = 0.05 level.
Fertilizer equivalent
In 2013, the quadratic equation to model N response in the N FERT at the HortFarm explained only 23% of the variability in the yields (Fig. 5a). The 2013 model predicted the cover crop supplied 87 kg N ha−1, which was greater than the average N credit (58 kg N ha−1), but within the range of N credits predicted (41–90 kg N ha−1). In 2014, a quadratic plateau model provided a better fit and predicted the cover crop supplied 46 kg N ha−1 (Fig. 5b), which was lower than the average credit (69 kg N ha−1), but within the range of the predicted N credit (42–94 kg N ha−1). During 2015, the quadratic equation accounted for 55% of the variability, but the equivalent N fertilizer was zero, whereas the Calculator predicted an average of 90 kg N ha−1 from the aboveground biomass. As discussed above, average yields for the N FERT 0N (2478 kg ha−1) and the CC CREDIT 0N (2550 kg ha−1) were similar, indicating in the absence of fertilizer, the aboveground cover crop was not supplying the nitrogen needed to increase the yields.
Equivalent N fertilizer is not a direct measurement of the amount of N the cover crop can provide. A cash crop uses N mineralized from the above- and belowground cover crop biomass, as well as from soil organic matter. The difference between the equivalent N fertilizer value and the Calculator predictions in 2015 could be due to wetter SWC conditions than modeled (Fig. 2c) and/or different inherent fertility and biological activity (Table 1), which is likely due to the longer time under organic management (8 yr in 2015 vs 3–4 yr in 2013–2014).
Discussion
The Calculator is a process-based tool. Because it incorporates local SWC and temperature conditions, it may be transferable to other regions of the USA if this type of data is available. The capacity to capture weather conditions is important. Some researchers have suggested that weather conditions can have as great an effect on cover crop N mineralization as residue quality (Brennan et al., Reference Brennan, Boyd and Smith2012). We may have seen this in 2015, where the greatest difference between the SWC 5-yr average data used for prediction and actual conditions occurred (Fig. 2c). We hope to improve the Calculator by using 5-yr average data for prediction and initial farmer planning, then revising the predicted available N during the growing season with actual SWC and ST data. The Calculator could also be improved by more localized SWC and ST data.
The rate of release provided by the Calculator increases its value. In our study, most of the available N was released during a period when the broccoli transplants could initially utilize it. If broccoli had been direct seeded, the N mineralization would not have been well synchronized with crop demand. The visualization of N release in the graph showing the target N rate and planting date allows farmers to quickly understand whether additional N fertilizer should be applied at planting or sidedressed. Many studies have shown that cover crops can provide N within a 1–6 week window, but supplemental fertilizer is often needed (Schonbeck et al., Reference Schonbeck, Herbert and Degregorio1993; Delate et al., Reference Delate, Cambardella and McKern2008; Schellenberg et al., Reference Schellenberg, Morse and Welbaum2009). Our experience using the Calculator on-farm in Georgia has indicated its use can help farmers better understand this process.
One drawback of the approach is the need for field measurement of dry biomass, which is the main driver for total N. Biomass is difficult to measure and variability is high. It is unlikely that farmers will take multiple biomass samples. This may reduce the effectiveness of the Calculator. We have found that better measurements are made when county agents work with farmers to measure biomass. Automated biomass measurement to provide an accurate biomass for a field would alleviate this problem.
Recent work by Woodruff et al. (Reference Woodruff, Kissel, Cabrera, Hitchcock, Gaskin, Vigil, Sonon, Saha, Habteselassie and Rema2018) indicates the Calculator predictions match actual N mineralization measurement best when cover crops are incorporated. The Calculator tends to over-predict N mineralized from residues left on the surface. Ongoing work is modifying the model for surface residue to improve the performance.
Conclusions
Our data indicate the Calculator can be a useful tool for adaptive N management. Yield is affected by many factors other than N, but our results indicate a farmer can use the Calculator to help manage N without significant yield reduction.
Cover crop adoption rates remain low. A useable method for farmers to understand the short-term benefit of N supply from cover crops may help encourage adoption. Hopefully, these types of decision support tools will help increase the adoption of this important practice to increase the sustainability of agricultural production systems.
Author ORCIDs
Julia W. Gaskin, 0000-0003-2131-6824
Acknowledgements
The research was supported by USDA NRCS Conservation Innovation Grant 69-3A75-13-233. We would like to thank the farmers that participated in this study—Nicolas Donck and Phil Franklin. Travis Brown and Katie Chatham provided field management and helped with data collection.


 Open access