


Canada has been at the forefront of important food policy and planning efforts(Reference Vanderlee, McLaughlin and Vaillancourt1). As highlighted by the most recent version of the FOOD-EPI Canada report, a document benchmarking Canada’s food policy efforts in comparison to best practices observed globally, the Canadian government has notably been paving the way in terms of food labelling policies and food policies banning the use of partially hydrogenated oils in foods. Despite these accomplishments, the FOOD-EPI Canada report emphasises the need for additional policy to regulate the restaurant food environment (RFE). To this effect, currently, there are limited Canadian regulations controlling the availability and nutritional quality of restaurant food offerings(Reference Vanderlee, McLaughlin and Vaillancourt1,Reference Yang, Weippert and Ahmed2) .
Greater public acceptability of policies aiming to render the RFE more conducive to health may be a pivotal factor in promoting restaurant policy action in Canada. Indeed, within democratic societies, high public acceptability of proposed policies has been shown to increase policymakers’ will for policy change, increasing political feasibility(Reference Kwon, Cameron and Hammond3,Reference Grelle and Hofmann4) . Additionally, high levels of policy acceptability provide insights as to the collective desire to adhere to the policy, favouring policy effectiveness(Reference Grelle and Hofmann4,Reference Proctor, Silmere and Raghavan5) .
Despite the importance of RFE policy acceptability for both political will and policy compliance, limited research has examined public acceptability of RFE policies(Reference Lambert-De Francesch, Saint-Onge and Muhajarine6). Furthermore, whether it be RFE policies (specifically) or food policies (more broadly), previous research has mainly focused on assessing policy- and person-related correlates of food policy acceptability(Reference Scheidmeir, Kubiak and Luszczynska7,Reference Diepeveen, Ling and Suhrcke8) . Regarding the latter, previous studies have indicated that select sociodemographic and select health-related characteristics are associated with acceptability of specific RFE policies(Reference Lambert-De Francesch, Saint-Onge and Muhajarine6,Reference Bhawra, Reid and White9–Reference Ramamoorthy, Gauvin and Muhajarine11) . However, limited research has been directed towards exploring environmental correlates of food policy acceptability(Reference Lambert-De Francesch, Saint-Onge and Muhajarine6).
Ecological approaches in food environment research, which notably focus on the interlinkages between surrounding retail food environments and food behaviours, have significantly improved our comprehension of eating behaviours and have facilitated the implementation of strategies to modify them(Reference Story, Neumark-Sztainer and French12–Reference Bel-Serrat, von der Schulenburg and Marques-Previ14). From this perspective, examining the retail food environment correlates of food policy acceptability may help enhance our general comprehension of food policy acceptability and may serve as a lever to promote the implementation of healthy RFE policies.
Recognising the benefits associated with better knowledge of food policy acceptability, the current study aims to examine the associations between the characteristics of urban Canadians’ local retail food environment and their acceptability levels of distinct evidence-based RFE policies. These specifically regard changing the default side dish option for a healthier choice in restaurant settings, restricting the establishment of fast-food outlets (FFO) near schools and eliminating unhealthy foods from municipal buildings’ food outlets. As all Canadian communities could benefit from advancements on the RFE policy front, links are explored across Canada’s seventeen most populated census metropolitan areas. These include, in a decrescendo order of population density, (1) Toronto, (2) Montreal, (3) Vancouver, (4) Calgary, (5) Ottawa-Gatineau, (6) Edmonton, (7) Quebec City, (8) Winnipeg, (9) Hamilton, (10) London, (11) Halifax, (12) Victoria, (13) Fredericton, Moncton and Saint John, (14) Saskatoon, (15) Regina, (16) Sherbrooke and (17) Saint-John’s.
Methods
This study links data from two pan-Canadian datasets: the Targeting Healthy Eating and Physical Activity (THEPA) survey dataset and the Canadian Food Environment Dataset (Can-FED).
Dataset description
The Targeting Healthy Eating and Physical Activity survey dataset: a focus on intervention acceptability
The pan-Canadian THEPA survey dataset offers insight into urban Canadians’ acceptability levels of forty-five built environment and policy interventions. The THEPA survey dataset also provides, among other data, sociodemographic and health-related characteristics of survey participants. Eligibility criteria for the THEPA study entailed residing in one of Canada’s seventeen most densely populated census metropolitan areas, minimally providing residential forward sortation area information (i.e., first three digits of six-digit postal code), speaking or reading English or French and being aged 18 years and over.
Participants were recruited either through random digit dialling or through personal email (containing the survey link). Participants’ emails were obtained thanks to their former participation in online polls, conducted by international survey firms. Target sample size aims were of 1200 participants per census metropolitan area, with larger sample size aims established for Canada’s three most densely populated census metropolitan areas. The actual sample size ranged from 1199 participants in Winnipeg to 4801 participants in Toronto. The THEPA survey dataset is representative of the urban Canadian population, as not only did this survey have large jurisdictional coverage and an important total sample size (n 27 162), but weights were also applied to create a dataset with characteristics that were commensurate with those of the population; see Lambert-De Francesch et al. (2024)(Reference Lambert-De Francesch, Saint-Onge and Muhajarine6) for the weighting procedure. Survey data collection occurred between October and December 2020.
Among acceptability ratings of the forty-five built environment and policy interventions, three touched upon the RFE and were used as the outcome variables in this study. The three interventions were formulated as follows: (1) change the usual side dish in restaurants for a healthier option like salad instead of fries, (2) impose municipal regulations to limit fast-food outlets around schools and (3) eliminate the offer of chips, candy and other unhealthy foods in restaurants, cafeterias and vending machines in municipal buildings like arenas and recreation centres. Participants were asked to indicate their acceptability levels for the implementation of each intervention within their residential neighbourhood using the following ordinal scale: completely agree, somewhat agree, somewhat disagree, completely disagree and do not know/prefer not to respond. Residential neighbourhood was defined as the area within a 15-min walking distance from their home address. Acceptability responses were then recoded into complete agreement v. other. The rationale underpinning the dichotomisation of the outcome variable was based on the fact that greater levels of acceptability with RFE policies are more likely to translate into policy enactment, contrary to lower levels of agreement(Reference Sharp, Bellis and Hughes15). As for the do not know/prefer not to respond case option, these responses were recoded as missing. Across the three RFE policies, the latter case option represented 5·29 % to 6·77 % of responses.
THEPA sociodemographic and health-related questions notably pertained to gender, age, highest level of educational attainment, income, country of birth, Indigenous status, frequency of consuming restaurant-prepared foods and perceived health status. The formulation of sociodemographic and health-related questions is available elsewhere(Reference Lambert-De Francesch, Saint-Onge and Muhajarine6,Reference Lambert-De Francesch, Saint-Onge and Muhajarine16) .
The general use Canadian Food Environment Dataset: a portrait of the retail food environment
The general use Can-FED is a pan-Canadian dataset. It covers both urban and rural areas(17). Developed by Stevenson et al. (2022), Can-FED specifically provides data on retail food environment access according to each Canadian dissemination area, n 56 312(Reference Stevenson, Kaufmann and Colley18). A dissemination area is the smallest geographical unit of analysis in the Canadian census data(19) and encompasses forward sortation areas (described above)(20).
As individuals may consume foods outside their respective dissemination area, all retail food environment indicators provided by Can-FED distinctively include a 1 and a 3-km buffer zone, calculated from each dissemination area’s centroid. In the present study, two relative density retail food environment indicators (both with a 1- and 3-km buffer zone) were selected. The two relative density indicators’ respective formula, extracted from Stevenson et al.’s paper (2022)(Reference Stevenson, Kaufmann and Colley18), are shown in Table A1 of the Additional files section and briefly described below.
The first relative density indicator pertained to the proportion of healthy food outlets (HFO) compared to all food outlet types within each dissemination area and its buffer zones(Reference Stevenson, Kaufmann and Colley18). HFO include chain supermarkets, grocery stores, as well as fruit and vegetable markets, whereas all food outlet types include HFO, FFO, convenience stores and convenience stores at a gas station. The second relative density indicator concerned the proportion of FFO among all full service and FFO within each dissemination area and its buffer zones. In this case, FFO are understood as ‘eating places that sell pre-prepared or quickly prepared food at a counter that is likely highly processed’(Reference Stevenson, Kaufmann and Colley18), whereas full-service restaurants are understood as ‘eating places where patrons typically order from a waiter, can be seated for dine-in, and pay after eating’(19), (p. 5).
Stevenson et al. (2022) created HFO and FFO indicators for each dissemination area and its buffer zones by entering Statistics Canada’s 2018 business register data into each indicator’s respective formula(Reference Stevenson, Kaufmann and Colley18). Using the results obtained from each indicator’s formula, a k-medians cluster approach was undertaken by the authors to form clusters (classes 0–4). A class of 0 indicates that no targeted food outlet (e.g. HFO) is accessible in the given dissemination area and its buffer zone. As for non-zero indicators, a value of 4 represents the greatest access to the targeted food outlet, whereas a value of 1 reflects the lowest access to the targeted food outlet.
Linking datasets, recoding retail food environment variables and developing parsimonious clusters
To examine the relationships between THEPA participants’ acceptability levels of RFE policies and the characteristics of their local retail food environment, several steps, conducted on SPSS version 28.0, were undertaken to link together the THEPA dataset and the Can-FED. The merging process’ primary challenge pertained to the absence of congruent geographic units that would enable the direct linkage. To this effect, the smallest geographical unit of analysis in the THEPA dataset regarded postal code information, whereas the smallest unit in the Can-FED related to dissemination area information. The absence of a common geographical variable, enabling the direct merging of both datasets, called for the introduction of an intermediary dataset, that is, the November 2020 Postal Code Conversion File (PCCF)(21). The latter file contains information on approximately 900 000 Canadian postal codes, including their corresponding dissemination areas.
In terms of the merging process, the initial step consisted of extracting all unique postal codes located in the seventeen targeted census metropolitan areas from the nationwide PCCF dataset. This was carried out by extracting the statistical area classification codes belonging to each census metropolitan area. The second step consisted of taking the Can-FED and merging it with the newly created seventeen census metropolitan area datasets. This merge was done based on dissemination area information and led to the creation of a dataset encompassing the postal codes, dissemination areas and Can-FED indicators of Canadians living in the specified census metropolitan areas.
To ensure sufficient representation of all FFO and HFO indicator classes (0–4) within the newly created dataset, both indicator classes were consolidated into broader categories. Based on distribution patterns of the targeted indicators within the newly created seventeen census metropolitan area datasets, all 1- and 3-km HFO and FFO indicators were recoded into the following: no access (encompassed of class: zero), typical access (encompassed of classes: one and two) and highest access (encompassed of classes: three and four).
Once retail food environment variables were recoded, clusters characterising the different retail food environments present within the seventeen census metropolitan areas were created. Clusters were developed via cluster analysis and equally encompassed both HFO and FFO data. Distinct clusters were created for the 1- and 3-km buffer zones, as the food environment proximally surrounding a dissemination area centroid (1 km) can differ from the characteristics observed at a more distal distance from the centroid (3 km). To be retained, established clusters had to show pronounced intra-group homogeneity and pronounced inter-group heterogeneity(Reference Mooi and Sarstedt22).
Developing retail food environment clusters first required assessing the relationship between all environmental variables (recoded HFO variables for 1- and 3-km buffer zones and recoded FFO variables for 1- and 3-km buffer zones). Spearman’s rank order correlations were used to assess the extent to which environmental variables were overlapping(Reference Bezerra, Andrade and Monteiro23). As the correlation coefficients remained low, it was deemed appropriate to input all variables belonging to the same buffer zone simultaneously into a two-step clustering method.
The two-step clustering method, available on SPSS version 28.0, used an algorithm to first compress the data into subclusters and then used a hierarchical clustering method to merge the latter subclusters into larger clusters(Reference Hu, Zhang and Zhong24). The latter method was selected as, contrary to other clustering methods, it was appropriate for ordinal variables, did not require variables to be normally distributed, was adequate for a large dataset and provided information regarding cluster quality(Reference Benassi, Garofalo and Ambrosini25). Cluster quality was presented as the silhouette coefficient, ranging from –1·0 to 1·0(Reference Harantová, Mazanec and Štefancová26). To be designated as final clusters, clusters had to have the greatest silhouette coefficient (i.e., signifying good cluster quality) and make qualitative sense (i.e., signifying real-life feasibility).
Once all postal codes located in Canada’s seventeen most densely populated census metropolitan areas were attributed respective clusters, the latter data were merged with the THEPA dataset via postal code linkage. Of the 27 162 participants of the THEPA study, 4696 participants were not attributed cluster information. On the one hand, this was partially due to the fact that not all participants provided postal code information (only forward sortation area information was minimally required to participate). On the other hand, a slight misalignment was noticed between the broader sampling frame of the THEPA survey study, which included participants residing just beyond the targeted census metropolitan areas, and the narrower geographical data extracted from the PCCF (based on statistical area classification codes). In all, 22 466 THEPA participants were attributed cluster information.
Addressing missing data in the newly merged Targeting Healthy Eating and Physical Activity dataset
Whether it pertains to retail food environment characteristics, sociodemographic characteristics, health-related characteristics or acceptability levels, missing data in the newly merged THEPA dataset were imputed using predictive mean matching methods. The latter method assigns a value to a missing case based on random allocation of one of the five closest participant cells(Reference Austin and van Buuren27). Comparatively to other imputation techniques, predictive mean matching methods have the distinct advantage of solely introducing plausible values to the imputed datasets(Reference Allison28). A total of ten imputed datasets were created.
Descriptive and statistical analyses
Descriptive analyses were used for all acceptability correlates (i.e., sociodemographic characteristics, health-related characteristics and retail food environment characteristics) and reported across select datasets. All descriptive analyses were conducted using SPSS version 28.
As for statistical analyses, multilevel logistic regression analyses were conducted using HLM 8.0 software. These analyses were performed on the weighted data derived from the pooled ten imputed datasets (n 27 162). Conducting multilevel analyses enabled the respect of the multilevel structure of the THEPA sampling frame, that is, lower-order units (individuals) nested within different higher-order units (census metropolitan areas)(Reference Leyland, Groenewegen, Leyland and Groenewegen29). Supporting this conceptual distinction is the work by Lambert-De Francesch et al. (2024)(Reference Lambert-De Francesch, Saint-Onge and Muhajarine6) who found statistically significant differences in the likelihood of completely agreeing with RFE policies across the seventeen census metropolitan areas.
For each of the three policies, two statistical models were created. The first model solely examined the associations between the targeted retail food environment variables and complete agreement levels, whereas the second model adjusted for select sociodemographic and health-related characteristics. The decision to adjust for these sociodemographic and health-related variables was underpinned by their pre-established association with complete agreement levels of RFE policies(Reference Lambert-De Francesch, Saint-Onge and Muhajarine6,Reference Lambert-De Francesch, Saint-Onge and Muhajarine16) and their ability to accurately predict access to retail food environments(Reference Amin, Badruddoza and McCluskey30). For each model, the OR and 95 % CI were reported.
Results
Participant sociodemographic and health-related characteristics
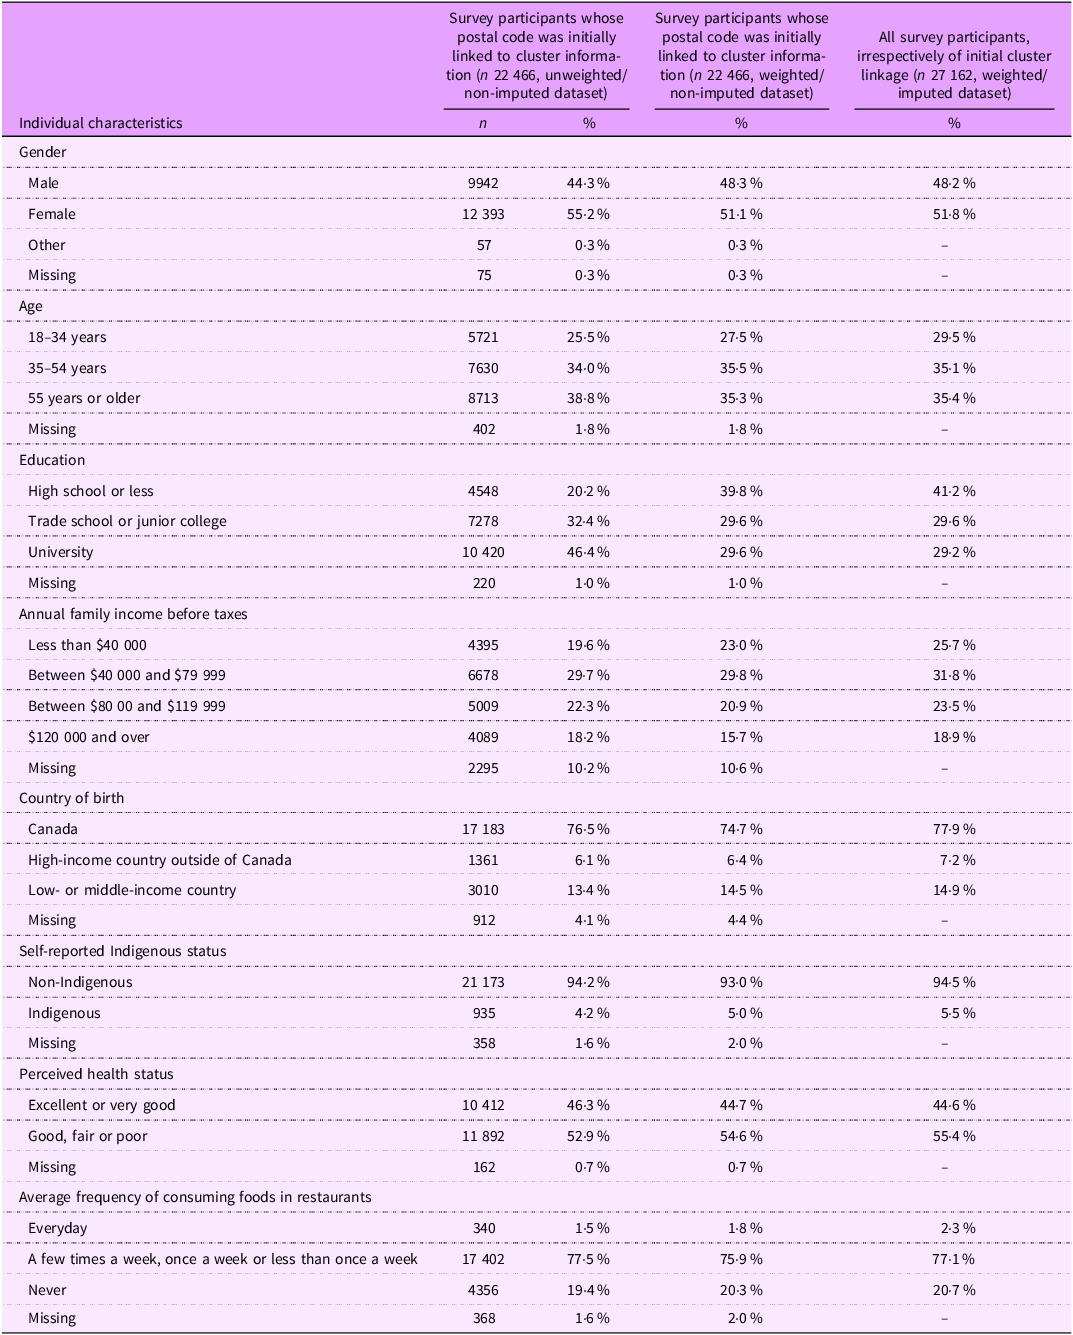
Participant sociodemographic and health-related characteristics are presented for two datasets: one comprising only those who initially received retail food environment cluster information (n 22 466, further subdivided into unweighted/non-imputed data and weighted/non-imputed data) and the other dataset comprising all study participants, irrespective of initial retail food environment cluster attribution (n 27 162, weighted/imputed data).
According to Table 1, compared to the unweighted/non-imputed THEPA dataset consisting solely of those who were initially attributed cluster information (n 22 466), the weighted/non-imputed dataset mainly adjusted for the underrepresentation of those with a high school level diploma or less, compared to those with a university degree. In the full weighted/imputed dataset (n 27 162), the sample predominantly consisted of women (51·8 %), Canadian-born individuals (77·9 %) and non-Indigenous persons (94·5 %). The majority of participants described their health status as either good, fair or poor (55·4 %) and consumed restaurant-prepared food either a few times a week, once a week or less than once a week (77·1 %). Across the full dataset, the most prevalent age category was 55 years and over (35·4 %), the most prevalent educational attainment category was university level (29·2 %) and the most prevalent gross household income category was $40 000–$79 999 (31·8 %).
Sociodemographic and health-related characteristics of Targeting Healthy Eating and Physical Activity (THEPA) survey study participants

Characteristics are presented for the partial dataset (exclusively consisting of those whose postal code was initially linked to cluster information, n 22 466) and according to the full dataset (consisting of all participants, irrespectively of initial cluster linkage, n 27 162). The partial dataset consists of both unweighted/non-imputed and weighted/non-imputed data, whereas the full dataset consists of weighted and imputed data. Survey data were collected between October and December 2020.
Stevenson et al.’s (2022) healthy food outlet and fast-food outlet cluster class distribution
Distribution patterns of Stevenson et al.’s (2022) HFO and FFO clusters (classes 0–4) are available in Table A2 in the Additional files section. These distribution patterns are presented across 1- and 3-km dissemination area buffer zones and across select datasets. A brief description regarding Table A2 is also provided in the Additional files section.
Identification of final clusters
As mentioned previously, Stevenson et al.’s (2022) HFO and FFO clusters (classes 0–4) were recoded into broader categories (i.e., no access, typical access and highest access), forming the basis of this study’s retail food environment clusters.
1-km retail food environment access clusters were named the following way:
-
1) proximal absence (no HFO nor FFO)
-
2) proximal healthiest (highest HFO and no FFO)
-
3) proximal least healthy (no HFO and highest FFO)
-
4) proximal typical (typical HFO and typical FFO)
-
5) proximal food swamp-like environment Footnote 1 (typical HFO and highest FFO).
3-km retail food environment clusters were named as:
-
1) distal absence (no HFO nor FFO)
-
2) distal healthiest (highest HFO and typical FFO)
-
3) distal greatest relative density (highest HFO and highest FFO)
-
4) distal typical (typical HFO and typical FFO)
-
5) distal food swamp-like environment (typical HFO and highest FFO).
Cluster centre homogeneity and distribution of clusters
The level of homogeneity within the retail food environment cluster centres is available in Table A3 in the Additional files section. The distribution patterns of the clusters across select datasets are also available in Table A3. A brief description of both cluster centre homogeneity and cluster distribution is provided alongside Table A3 in the Additional files section.
Results of multilevel logistic regression analyses
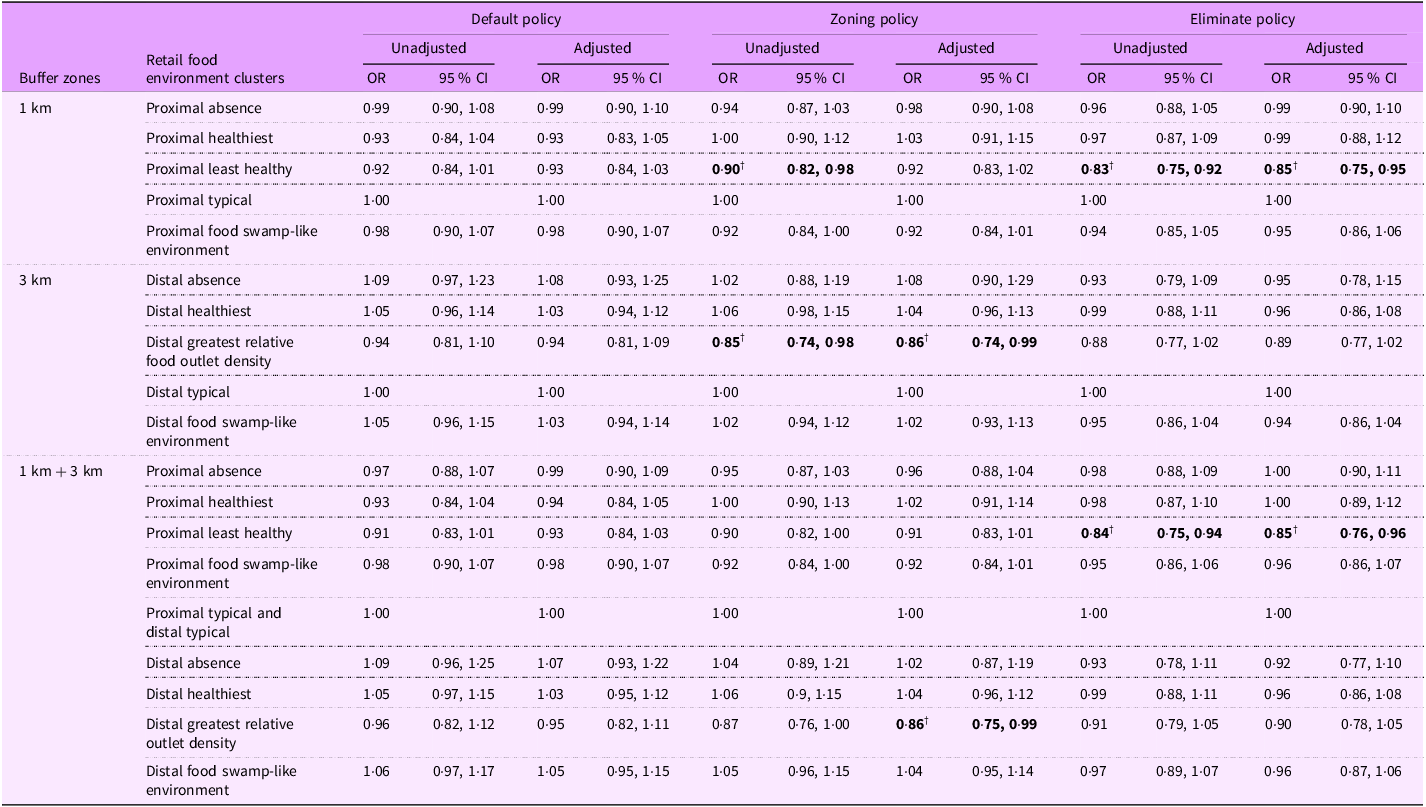
Table 2 illustrates the OR and 95 % CI for being in complete agreement with the three RFE policies according to THEPA participants’ residential retail food environment clusters (based on weighted/imputed dataset, n 27 162). Reference categories were proximal typical (typical HFO and typical FFO) for the 1-km buffer zone and distal typical (typical HFO and typical FFO) for the 3-km buffer zone. Results are shown for unadjusted and adjusted models (i.e., adjusted for sociodemographic and health-related characteristics).
OR and 95 % CI for being in complete agreement with each policy

OR and 95 % CI are presented according to retail food environment clusters present within 1- and 3-km buffer zones from the residential dissemination area centroids of those partaking in the Targeting Healthy Eating and Physical Activity (THEPA) survey study. Data are presented according to unadjusted and adjusted results. Adjusted results account for participants’ sociodemographic and health-related characteristics. The sociodemographic reference categories were Canadian-born male individual, aged 55 years or older, holding a university degree, reporting an annual household income of $40 000–$79 999 and not identifying as Indigenous. Health-related reference categories were as follows: reporting excellent or very good perceived health, and consuming restaurant-prepared foods a few times per week, once per week or less than once a week. All acceptability levels stem from the full dataset (weighted and imputed data, n 27 162), where data collection occurred between October and December 2020. Retail food environment data were extracted from the Canadian Food Environment Dataset (Can-FED). Bolded results with †symbol are statistically significant.
For the default choice policy, irrespectively of the targeted buffer zone, no significant association was detected between complete agreement levels and environmental variables.
For the zoning policy, for analyses conducted using only 1-km data, in the unadjusted model, participants surrounded by the proximal least healthy food environment (no HFO and highest relative density of FFO) were less likely to be in complete agreement with the policy than those with typical relative densities of HFO and FFO (OR: 0·90, 95 % CI: 0·82, 0·98). The statistical significance observed in the latter association became non-significant in the adjusted model (OR: 0·92, 95 % CI: 0·83, 1·02). As for analyses conducted using only 3-km data, we observed that participants not only exposed to the highest relative density of FFO but also the highest relative density of HFO (cluster: distal greatest relative food outlet density ) were less likely to be in complete agreement with the zoning policy than those in the reference category, and this for both unadjusted and adjusted models (ORunadjusted: 0·85, 95 % CI: 0·74, 0·98; ORadjusted: 0·86, 95 % CI: 0·74, 0·99). Tying in with the latter observation are results derived from the combined 1- and 3-km retail food environment clusters. According to the latter examination, participants whose food environment was categorised as distal greatest relative food outlet density were also less likely to be in complete agreement with the policy. This was, however, only observed in the adjusted model (OR: 0·86, 95 % CI: 0·75, 0·99).
The most consistent links between environmental variables and complete agreement levels were observed for the eliminate choice policy. Unlike most associations reported for the previous policy, links remained statistically significant before and after adjustments were made for sociodemographic and health-related variables. Indeed, for all analyses conducted with 1-km buffer data (i.e., analyses with only 1-km data and analyses with both 1- and 3-km data), those surrounded by the least healthy food environments were consistently less likely to be in complete agreement with the eliminate choice policy compared to the reference category (i.e., ORunadjusted 1 km: 0·83, 95 % CI: 0·75, 0·92; ORadjusted1 km: 0·85, 95 % CI: 0·75, 0·95; ORunadjusted 1 and 3 km: 0·84, 95 % CI: 0·75, 0·94; ORadjusted 1 and 3 km: 0·85, 95 % CI: 0·76, 0·96).
Results showcasing complete analyses, that is, those including the OR and 95 % CI for sociodemographic characteristics, health-related characteristics and 1- and 3-km clusters combined, are available in Table A4 in Additional files.
Discussion
This study examined the associations between urban Canadians’ retail food environment characteristics and their acceptability levels of three distinct RFE policies. Our findings indicated that likelihood of being in complete agreement with the healthier default choice policy was independent of examined environmental variables. Statistically significant associations were, however, observed for the other two RFE policies. For the policy restricting the establishment of fast-foods near schools, according to analyses jointly examining 1- and 3-km data, after adjustments, it was shown that residing in dissemination areas where there was the greatest relative density of HFO and FFO within a 3-km buffer zone was linked to a lower likelihood of expressing complete agreement with the policy. As for the policy aiming to eliminate unhealthy foods in selected settings, according to analyses jointly examining 1- and 3-km data, both before and after adjustments, individuals whose retail food environment was exempt from HFO and had the highest relative density of FFO (i.e., least healthy food environment cluster) in a 1-km buffer zone were also less likely to be in complete agreement with the policy.
Although the literature on retail food environment characteristics and RFE policy acceptability is extremely limited, some comparisons regarding the FFO zoning policy can be drawn from Keeble et al.’s (2024) study(Reference Keeble, Adams and Amies-Cull31). These authors examined the association between support for a regulation stopping new FFO from opening near schools and neighbourhood food outlet access. Despite not finding any statistically significant association, many differences limit its comparability with the present study, notably the level of intrusiveness of the proposed policy (‘stop’ v. ‘limit’ FFO), the measurement instrument used and the target population.
Given the dearth of research on environmental exposures and FFO zoning policy acceptability, comparing this study’s results to previous work requires drawing insights from other fields. One anchor for comparison may be studies assessing the determinants of pro-environmental public attitudes. In this research area, it has, for example, been shown that those who are most exposed to nature tend to hold more positive attitudes towards the natural environment(Reference DeVille, Tomasso and Stoddard32,Reference Rosa and Collado33) . Somewhat mirroring the latter observation are our results regarding fast-food zoning policies, where higher exposure to FFO translated into a lower likelihood of being in complete agreement with a policy aimed at limiting FFO availability. More research is, however, needed to comprehend why the simultaneous exposure to a high relative density of both FFO and HFO is linked to a lower likelihood of being in complete agreement with the zoning policy.
As for the eliminate unhealthy food policy, our results also tie in with observations derived from pro-environmental attitude studies(Reference DeVille, Tomasso and Stoddard32,Reference Rosa and Collado33) , as greater exposure to unhealthy food environments in a 1-km buffer zone correlated with less favourable attitudes towards policies aiming to ban unhealthy foods. Other than mirroring trends observed in a different field of study, our results regarding the eliminate choice policy are intuitively coherent. To this effect, it could be hypothesised that in areas where FFO are the predominant food source and where healthy food options are not readily available, the elimination of unhealthy food offerings in selected settings may cut or significantly reduce food supply options. Food availability-related challenges may thus help explain the observed less favourable opinions towards this policy. Additional research would be needed to validate the latter hypothesis.
The findings from this study have significant policy implications, particularly for the enactment of RFE policies in urban Canada. The associations between specific retail food environment clusters and policy acceptability may offer insights as to a potential phased approach to policy enactment. Given that higher levels of acceptability are likely to facilitate policy enactment, urban planners and policymakers may find it advantageous to initially introduce evidence-based RFE policies in residential areas where attitudinal barriers are lower. Policy implementation may thus contribute to rendering the RFE healthier, ultimately having a positive impact on eating behaviours. In this regard, much like modifying individual food behaviours, shifting the focus from interventions targeting individuals to those aimed at transforming the retail food environment could be a much more effective strategy to attain nutrition public health goals(Reference Dixon, Ugwoaba and Brockmann34).
Despite the importance of modifying the RFE in the realm of RFE policy enactment, it is important to highlight that curbing the growth of FFO, such as is the case with fast-food zoning policies, may come with certain challenges, as international food corporations, which are at the basis of many fast-food chains, exert substantial power and influence on governments(Reference Baker, Machado and Santos35,Reference Slater, Lawrence and Wood36) . Through a multitude of actions, these corporations ensure that policies do not unduly influence their commercial endeavours. The case of the Côte-des-Neiges–Notre-Dame-de-Grâce borough in Montreal, Canada, is a prime example of the big food industry’s determination to not let public policy limit its expansion(37). In 2016, a bylaw, prohibiting the opening of new FFO in certain locations, was adopted by the borough. Much opposition was shown by the targeted restaurant food industry, as, in 2022, this bylaw was made the object of a dispute presented before Canada’s highest court. Despite possible resistance, across the country, municipalities are nonetheless slowly adopting measures to limit FFO establishment(Reference Nykiforuk, Campbell and Macridis38).
In terms of novel contributions, this study is among the first to demonstrate links between retail food environment characteristics and RFE policy acceptability. Methodological strong points include the unique development of retail food environment clusters which include both HFO and FFO indicators. The incorporation of both healthy and less HFO data into clusters enables a more holistic understanding of how different spatial contexts are associated with RFE policy acceptability. Including both HFO and FFO indicators into clusters is also an innovative approach, as few studies have created clusters composed of multiple retail food outlets(Reference Hoenink, Eisink and Adams39). Other study strong points include the weighting procedure used in this study (attenuating selection biases), the conduction of analyses on imputed data (mitigating missing data biases) and the utilisation of multilevel analyses (decreasing the risk of biases which could have been introduced by the conduction of flat analyses on a nested data structure).
Despite the innovative and methodologically robust features of this study, several limitations are to be noted. A first limitation regards the assignment of retail food environment indicators to THEPA participants. On the one hand, the assignment process entailed linking datasets which did not have identical data collection periods, leading to a potential mismatch of data. Mismatching of data may have especially concerned Can-FED indicators, as the 2020 Covid pandemic resulted in significant shifts in the opening and closing of local businesses(Reference Lafond-Cooke40). On the other hand, certain assignment inaccuracies may have happened when a single postal code straddled across more than one dissemination area with different HFO and FFO indicators. The impact of this limit was however mitigated by the fact that the PCCF allocated the most probable dissemination area for each postal code based on population size(21).
A second methodological limitation relates to the complexities of accurately capturing the retail food environment in a context of increased use of food delivery services leading to food purchases outside one’s residential area(Reference Brar and Minaker41). As individuals may consume food from outlets many kilometres away from their home, additional exploration is needed regarding consumer habits and the personal variability influencing these habits, such as financial situation, disability status and contextual factors. In regard to the last element, as the THEPA survey was distributed during the pandemic, this event contributed to many consumers’ even greater uptake of food delivery services(Reference Kifle Abebe, Charlebois and Music42), augmenting uncertainty about which retail food environment characteristics apply.
A third important limitation is the lack of full alignment between the geospatial delimitations employed in the Can-FED and the THEPA dataset. In the THEPA dataset, participants rated the acceptability of policies implemented within their residential neighbourhood, defined as the area reachable within a 15-min walk from their home. Can-FED, by contrast, notably relied on a 1-km buffer around the centroid of the dissemination area. These two units, which represent ground coverage in different ways, may therefore not align perfectly. Nonetheless, a 15-min walk can approximate 1 km depending on walking speed and walking networks, suggesting that the two measures may overlap to some extent.
As this study is among the first to examine the links between RFE policy acceptability and environmental factors, replication and extension of results are essential. Indeed, future research ought to utilise different samples and study designs to replicate and extend research findings. For example, future work could involve longitudinal studies. By following the same participants over time, researchers could reassess acceptability levels and examine whether acceptability levels shift when individuals move to dissemination areas with different retail food environment characteristics.
Conclusion
This study addresses a current gap in the literature by assessing the associations between retail food environment characteristics and RFE policy acceptability in urban Canada. Findings suggest that being surrounded by select retail food environment clusters, in particular those with the greatest distal relative density of both HFO and FFO and those deemed as being the proximal least healthy , was associated with a lower likelihood of being in complete agreement with select RFE policies. The new evidence provided by this study may help orient development efforts promoting healthier RFE. Future important steps include replication and extension of results.
Supplementary material
For supplementary material accompanying this paper visit https://doi.org/10.1017/S1368980026102341
Financial support
This work was supported by Canadian Institutes of Health Research Grants (#148919 and #IP2-150710). This funding source had no role in the design, analysis or writing of this article.
Competing interests
There are no conflicts of interest.
Authorship
J.L-D.F.: conceptualisation, data curation, formal analysis, investigation, methodology, software, validation, visualisation, writing – original draft and writing – review and editing. K.S-O.: investigation and writing – review and editing. N.M.: funding acquisition, investigation, project administration and writing – review and editing. R.B.: writing – review and editing. L.G.: conceptualisation, funding acquisition, investigation, methodology, project administration, supervision, validation and writing – review and editing.
Ethics of human subject participation
This study was conducted according to the guidelines laid down in the Declaration of Helsinki, and all procedures involving research study participants were approved by the Ethics Committee of the Centre Hospitalier de l’Université de Montréal on 28 November 2019 (protocol no.: 19.258). Written (online survey) or verbal (telephone survey) informed consent was obtained from all subjects/patients. Verbal consent was witnessed and formally recorded.


 Open access