


Introduction
Snow on the ground is a continuously evolving material, with changing density, grain-size and structure in response to atmospheric conditions. Although snow-covered area is a parameter that can be estimated globally from space in a reliable fashion from visible or passive-microwave radiometer measurements (Reference Armstrong and BrodzikArmstrong and Brodzik, 2000), the algorithms that have been developed using brightness temperatures to retrieve snow depth or snow water equivalent (SWE) are not very reliable, mostly because they assume constant snow grain-size in space (over entire regions) and in time (over the whole snow season). The brightness temperature emitted by a snowpack reflects the scattering behavior of the snow on the upwelling radiation from the soils beneath the snowpack and that emitted by the snow itself. The effects of grain-size, snow density, liquid-water content, degree of metamorphism, crust development and ice lenses combine to determine the dielectric properties of the snow layer.
The general trend for ice crystals within a snowpack is to grow with time. For air temperatures well below freezing, temperature-gradient metamorphism greatly accelerates the snow-grain growth. Reference ArmstrongArmstrong (1985) and Reference ColbeckColbeck (1987) show that temperature-gradient metamorphism occurs in snowpacks when the bulk temperature gradient through the snowpack exceeds a critical value of approximately 20°Cm–1. Under these conditions there is an upward transport of water vapor, driven by the associated relative humidity gradient through the snowpack (Reference Sturm and BensonSturm and Benson, 1997), which rapidly forms large snow grains, commonly referred to as depth hoar. These grains have characteristic length scales that can reach 5 mmby 2 mm, and are extremely convoluted in shape (Reference Rango, Wergin and ErbeRango and others, 1996).
Reference Chang, Gloersen, Schmugge, Wilheit and ZwallyChang and others (1976) used the Mie scattering theory, and Reference Tsang and PrionTsang (1992) and Reference Tsang, Chen, Chang, Guo and DingTsang and others (2000) used a dense-media radiative-transfer theory, to determine the dependence of microwave brightness temperature on grain-size. Both studies found that the brightness temperature had a strong dependence on the grain-size. The latter study found that the average snow grain-size, rather than the shape of each snow grain, was the critical factor in determining the snow-grain-scattering properties.
Reference Josberger, Mognard, Pietronero, Grangerand and PultzJosberger and Mognard (2000) proposed a dynamic algorithm where the grain-size evolution is taken into account and the microwave spectral gradient represents an integrated measurement of both the snow depth and the snow grain-size. This algorithm was applied to the northern Great Plains (NGP) region where the snowpack exhibits important variability from one year to the next. Given the extended cold temperatures of the NGP, thermal gradient metamorphismplaysa dominant role in determining the snowpack grain-size.
Linear algorithms provide near-real-time SWE maps to operational agencies in the Canadian prairies (Reference Goodison, Rubinstein, Thirkettle and LanghamGoodison and others, 1986). However, these linear algorithms fail to reproduce the interannual snowpack characteristics from the highly variable NGP. In the U.S. portion of the Red River basin, the October–April precipitation total for 1996/97 was 268 mm, the largest value ever recorded in the Red River (Reference Singh and GanSingh and Gan, 2000). For this snow season, brightness temperatures from the Special Sensor Microwave/Imager (SSM/I) on a U.S. Defense Meteorological Satellite Program satellite were used to derive regional snow-depth fields using a linear algorithm with a constant grain-size of 0.3 mm. The SSM/I results estimated the deepest snow in the northwest of the region, rather than centered along the Red River as shown by the U.S. National Weather Service (NWS) in situ measurements. In contrast, the linear algorithm yields reasonable results when applied to the 1987/88 snow season (Reference Mognard, Josberger and GloersenMognard and others, 1998), which was a milder and less snowy winter than 1996/97. For typical snow-crystal sizes, the linear algorithm is limited by saturation which begins for snow depths of >1m (Reference Chang, Foster and HallChang and others, 1987). Because the snowpack in the NGP never reached values much greater than 1m, its failure was not due to deep snow beyond its theoretical capability.
A temperature-gradient index, accumulated daily, that integrates the effects of the thermal gradient over the snow layer is found to correlate very well with the spectral gradient over the NGP region for two different snow seasons. In this paper we use the algorithm developed by Reference Josberger, Mognard, Pietronero, Grangerand and PultzJosberger and Mognard (2000) to derive a general method for computing snow-depth fields from passive-microwave observations acquired by SSM/I, and the U.S. National Centers for Environmental Prediction (NCEP) air temperature, without using any a priori knowledge on the beginning date for snow accumulation, evolving snow conditions and the date of onset of the melt season. In order to obtain a complete regional coverage with the SSM/I, we have averaged the daily SSM/I observations into pentads. The NWS stations’ measurements are used to estimate snow-depth fields to compare to satellite-derived fields for the 1996/97 snow season in the NGP region.
The Datasets
The EASE-Grid SSM/I dataset
The passive-microwave radiances (or brightness temperatures, Tb) used in this study were measured by the SSM/I. The U.S. National Snow and Ice Data Center (NSIDC) provided the data mapped to the Equal-Area SSM/I Earth Grid (EASE-Grid) for the NGP region from approximately 90° to 105°W and 43° to 50°N. The SSM/I is a seven-channel passive-microwave radiometer with vertically and horizontally polarized channels at 19.35, 37 and 85.5 GHz and a vertically polarized channel at 22.235 GHz. For these frequencies Reference Chang, Foster and HallChang and others (1987) show that the 37 GHz channel is best suited for snowpack studies, whereas the 19 GHz channel can be used to reduce the effects of ground temperature and atmospheric perturbations (such as integrated water vapor and clouds) on changes in brightness temperatures. In areas where the snowpack undergoes freezing and thawing, the horizontal polarization is better suited than the vertical polarization for detecting variations in snow depth. The ice lenses, layers and surface crust are quite transparent to the horizontally polarized data, but tend to dampen the response in the vertical polarization (Reference Foster, Hall, Chang and RangoFoster and others, 1984). The present investigation uses the horizontal spectral gradient defined as the difference between the horizontally polarized 19 and 37 GHz brightness temperatures: SG = (Tb19H - Tb37H). Note that here the term spectral gradient refers to the difference between the two brightness temperatures and that the spectral gradient is not divided by the difference between the two frequencies (37 – 19). To minimize the effects of liquid water in the snowpack, only night brightness temperatures are used (descending passes), and these data are averaged to obtain the pentad-mean fields used in this study.
For the snow season, and for each EASE-Grid pixel in the region, the maximum value of SG is plotted in Figure 1. The western regions exhibit the largest values of maximum SG, approaching 40 K, whereas the northeastern regions have much lower values of 10–15 K. The International Geosphere–Biosphere Program (IGBP) Earth surface classification, mapped to the EASE-Grid projection by the NSIDC, shows that the northeastern region contains numerous lakes and dense forests, which in part explains the weak magnitude of the signal in this region. To eliminate these complicating effects, we produced a mask from the IGBP classification and do not consider any pixel that has a combined lake and forest coverage of 45%.
Maximum value of SG from each EASE-Grid pixel in the NGP region for the snow season 1996/97. The southwestern portion of Lake Superior is located along the eastern side of our region, and the U.S.–Canada border runs along longitude 49° N. Notice that the western regions exhibit the largest values of maximum SG, approaching 40 K, whereas the northeastern regions have much lower values of 10–15 K.

The NCEP dataset
The NCEP daily air-temperature data have been processed by the Joint Institute for the Study of Atmosphere and Ocean (JISAO) into global pentad fields (Reference KalnayKalnay and others, 1996) which match the SSM/I pentad fields described earlier. The NCEP data are in a 2.5° latitude–longitude grid that we interpolated to the NGP EASE-Grid array to precisely match the SSM/I data. The NCEP air temperatures were used instead of the daily NWS temperatures because our aim is to derive an algorithm from measurements that are available globally in order to carry out retrospective studies of the 20 year satellite passive-microwave datasets. The NCEP pentad air temperatures were further averaged using a running average over four consecutive pentads to remove short-term fluctuations.
The NWS snow-depth measurements
In the NGP, approximately 285 NWS sites make daily weather observations which include snowpack thickness. We interpolated these data to the EASE-Grid projection for comparison to the satellite passive-microwave observations. The randomly spaced NWS measurements provide snow depth at a point or a small region around the site, which may or may not be representative of the snow depth within the SSM/I 25 km footprint. Hence, conventional interpolation techniques may not provide accurate grids of the snow depth.
In this study we used the spatial statistical characteristics of the data, or geostatistics, to minimize the error in the interpolation to the SSM/I grid. This process is called kriging; Reference CressieCressie (1993) gives a thorough description of the technique. Figure 2 shows the gridded NWS snow depths for the region on pentad 25, the end of January 1997, which is approximately the time of maximum snow depth for the region. A comparison of Figures 1 and 2 clearly shows that a simple linear algorithm based solely on SG cannot yield the spatial patterns observed in Figure 2.
Kriged NWS snow depths for the NGP region (pentad 25), centered on 28 January 1997, corresponding to the time of maximum in situ snow depth for the region (the NWS locations are indicated with dots).

Methodology
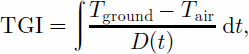
Reference Josberger, Mognard, Pietronero, Grangerand and PultzJosberger and Mognard (2000) show that the temperature-gradient index (TGI) can be used to represent the cumulative effect of the bulk temperature gradient on the snowpack, and is a cumulative index of the potential for grain-size growth through the snow season. The bulk temperature gradient, which is defined as the temperature difference between the bottom (Tground) and the top of the snow layer (Tair) divided by its thickness (D(t)), is linearly related to the spectral gradient SG:
with

where β and α are the coefficients of the linear relation determined from the scatter plots of SG as a function of TGI. The ground temperature is not a priori known and may be <0°C for shallow prairie snowpacks (Reference Goodison, Rubinstein, Thirkettle and LanghamGoodison and others, 1986). In this study we assume that the temperature at the base of the snowpack, Tground, is equal to 0°C and thus obtain the following relationship for snow depth:
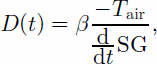
where β is a constant dependent upon the slope of the correlation between the TGI and SG (Reference Josberger, Mognard, Pietronero, Grangerand and PultzJosberger and Mognard, 2000) and will be estimated from the correlation factor with the NWS snow-depth measurements and the NCEP air temperatures. Effective utilization of this algorithm requires not only a smooth time series of air temperatures, but also a smooth time series of SG during the snow season.
Start and end of the snow season
The start of the snow season is determined from the SSM/I observations, not from the surface observations. We assume that the snow season for each EASE-Grid pixel begins on the pentad when SG is >1K. If this is too early, and there is no snow, the algorithm gives negative snow depths which are then eliminated. We determine the ending pentad for the SG time series of each pixel by searching backwards through the NCEP time series to find the pentad when the averaged NCEP air temperature becomes positive. The ending pentad is then set to the prior pentad. Before this time the snowpack may have been subject to melt events, but it also may have refrozen and there are still periods when it gives a signature that can be used in retrieving the snow depth.
Smoothing of SG
Having determined the start and the end dates, we developed a technique to fit a second-order polynomial envelope to the SG time series, bounded by the starting and ending pentads, which is then used to calculate the temporal rate of change of SG. We fit an envelope to remove low values of SG that result from liquid water in the snowpack. Reference Ulaby, Moore and FungUlaby and others (1986) showed that for a snowpack with a liquid-water content of 41%, the penetration depth decreases to about 10 cm for the 19 GHz emission and to even less for the 37 GHz emission, so the observed brightness temperatures become independent of the snow depth and SG approaches zero. For each EASE-Grid pixel, the envelope is found by twice fitting a second-order polynomial to the time series between the beginning and ending pentads. After the first fit, the time series is examined and SG values that are one standard deviation below the fitted value are removed from the time series. The second fit gives the envelope time series, which is used in the snow-depth computation. Figures 3a and 4a show examples of the raw SG and the envelope fit. In this study we find that the average temporal rate of change between the beginning pentad and the pentad in question produces the most accurate values of snow depth.
(a) Evolution of the SSM/I spectral gradient (solid line) and the fitted polynomial function (dashed curve), and (b) corresponding computed snow depth from the TGI algorithm (solid line), from the linear algorithm (dotted line) and from point measurements (diamonds) for the snow season 1996/97 in the northern part of the Red River basin.

(a) Evolution of the SSM/I spectral gradient (solid line) and the fitted polynomial function (dashed curve), and (b) corresponding computed snow depth from the TGI algorithm (solid line), from the linear algorithm (dotted line) and from point measurements (diamonds) for the snow season 1996/97 in the southern part of the Red River basin.

Snow-depth computations
For each EASE-Grid pixel, we computed a time series of potential snow depths from Equation (3), using the NCEP air temperatures and the envelope of SG as described above. We evaluated β, the proportionality constant between the NWS snow depths and the potential snow depths. The nonlinear nature of this algorithm makes it extremely sensitive to small values of dSG/dt, which physically correspond to situations where the grain-size and the snow depth are not changing and thus where SG shows little variation.
To determine the best value of β and to examine the algorithm sensitivity to dSG/dt, we computed linear correlation between the potential snow depths and measured NWS snow depths for a range of threshold values for dSG/dt. For each threshold value, we computed the potential snow-depth time series for each pixel that was not masked (using the IGBP classification) and extracted the value for each of seven pentads through the snow season where we had the kriged NWS snow depths. If dSG/dt for a given pixel on a given pentad was less than the threshold, the data pair was not used in the correlation.
Table 1 gives the results of this analysis for both the TGI algorithm and a linear algorithm, where the snow depth is proportional to the spectral gradient. As the threshold values for dSG/dt increase from 0.5 to 1.3 K per pentad, the number of points in the analysis decreases, while for both the TGI and the linear algorithm the standard deviation decreases and R2 increases. However, the TGI algorithm performs better in all cases, with greater values of R2 and smaller values for the standard deviation. In the TGI case, the regression coefficient β exhibits less variation than does the regression coefficient for the linear case. For the linear case, the regression coefficient continually decreases to a value of 2.17 cmK–1, which is considerably larger than the published value 1.59 cmK–1 that corresponds to snow grain-size of 0.3 mm (Reference Chang, Foster and HallChang and others, 1987), an indication that average snow grain-size was larger for the 1996/97 snow season in the NGP.
Variations of the number of points, and for both algorithms variations of the slope, R and standard deviation as a function of the threshold dSG/dt
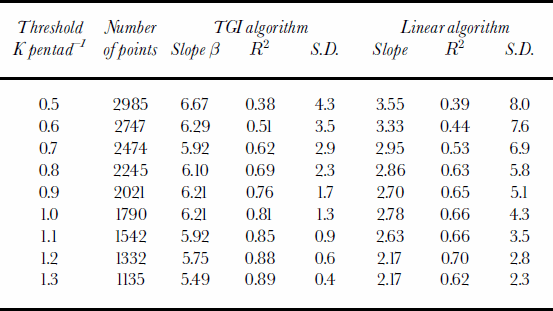
To implement this algorithm we selected a threshold and a value for β that maximize the area covered and minimize the error. In order to keep approximately 80% of the pixels, we selected a threshold value at 0.7 K per pentad and a value of 5.5 for β, corresponding to the highest R2. For comparison with the linear algorithm, we selected a proportionality constant of 2.17, corresponding also to the best R2.
Results
Seasonal evolution of computed snow depth
For the maximum snow-depth conditions at the end of January, Figure 5 displays the snow-depth field from the linear algorithm with a mask superimposed for combined lake and forest coverage of 45%. Figure 6 presents the corresponding snow-depth field derived from the TGI algorithm, where blank regions correspond to the IGBP masked region and to regions where the threshold value for dSG/dt is 50.7 Kper pentad. The masked regions are mostly located in the south and east of the NGP. In the Red River basin, located approximately along longitude 97.5° W, the linear algorithm underestimates the snow depth by a factor of 2 when compared to the NWS observations (Fig. 2), whereas the TGI computations yield a range of values similar to the NWS snow-depth values. The snow depth according to the in situ measurements was >1m over large areas in the Red River basin where the flooding took place. Figures 3b and 4b show the time series (for water year 1996/97 where pentad 1 is centered on 30 September 1996) of snow accumulation for two sites located in the Red River basin at 96.93° W and respectively at 47.9° N and 46.0° N, where for pentad 25 (corresponding to the kriged map Figure 2), the two stations represented with dots in Figure 2 can be located using the given longitude and latitudes.
SSM/I estimate of snow-depth field using a linear algorithm with a proportionality constant of 2.2 corresponding to the best R2 (Table 1).

SSM/I estimate of snow-depth field obtained with the TGI algorithm using a threshold dSG/dt of 0.7, and a slope of 5.5 corresponding to the best R2 (Table 1).

Evolution of snow depth and flooding
We selected two SSM/I pixels in the Red River basin, located at latitudes 48° N and 46° N, that depict the temporal evolution of the satellite spectral gradient, the computed snow depths using both algorithms and the available NWS snow depths. Figures 3 and 4 show the behaviour from the beginning of the water year (1 October, pentad 1) through the onset of the snow season, to the end of the flooding period (early June 1997, pentad 50). Figures 3a and 4a present the evolution of the SSM/I SG and the corresponding second-order polynomial fit. Figures 3b and 4b show the derived snow depths obtained with the linear algorithm and the TGI algorithm, along with the corresponding kriged NWS snow depths for the seven pentads used in this study. Both locations show good agreement between the TGI snow-depth estimates and the NWS measurements, while the linear algorithm consistently greatly underestimates the snow depth through the entire snow season (Fig. 3 and 4).
For both pixels, the end of the snow season, when melting begins, is clearly shown by the rapid decrease of SG to values near zero as a result of liquid water in the snowpack. This occurred after pentad 37 (29 March) for the northern location and pentad 36 (24 March) for the southern location; this behaviour is seen across the entire region as it warms from south to north. As the melting continued, the spectral gradient became negative, which corresponds to the 19H channel measuring lower brightness temperatures than the 37H channel. Reference Tanaka, Sugimura and TanakaTanaka and others (2000) show that this unusual situation is the result of liquid water in the SSM/I footprint. The rapid melting of the thick snowpack resulted in large areas of ponded water in agricultural fields and nearly saturated soils. The lowest brightness temperatures during the melt season are indicative of the maximum amount of water in the instrument footprint (Reference Tanaka, Sugimura and TanakaTanaka and others, 2000).
Inspection of the SG maps for each pentad shows that the melting and flooding began in the south and progressed northward. The maximum flooding occurred from pentad 41 to 43 (18–28 April). Figure 7 shows the spectral gradient map for pentad 41, and Figure 8 shows the spectral gradient for pentad 43,10 days later. Note that in both images a large area has a spectral gradient from –3 to –11 K (the green colours), indicating substantial liquid water. A comparison of Figures 7 and 8 shows that the region of spectral gradient less than –11 K (the blue and gray colors) expands, moves northward by 2° of latitude and becomes more negative over the 10 day interval. The most negative spectral-gradient values observed in the Red River basin were approximately –28 K, very close to the open-water values of –31 K as observed from Lake Superior in the east of the region.
Field of spectral gradient for pentad 41 (centered on 18 April1997) displaying the large region of potential flooding along the center portion of the Red River basin (SG< –11 K).

Field of spectral gradient for pentad 43 (centered on 28 April 1997) displaying the large region of potential flooding that has moved northward along the Red River basin.

Perspectives
The 1996/97 snow season in the NGP region had record snowfalls, and the area along the Red River had maximum snow depths of 1m or more. Rapid melting in April 1997 produced record flooding for the Red River. Passive-microwave observations from the SSM/I sensor are used to determine the evolution of the snowpack through the winter, detect the onset of melting and map the evolution of flooding across the region. For snow mapping, we find that a conventional linear algorithm based on the spectral gradient fails to yield accurate snow depths, particularly in the Red River basin where snow depths reached and exceeded 1m. However, a dynamic algorithm that incorporates the potential for grain-size growth, based on a cumulative index of the temperature gradient through the snowpack and calibrated to use NCEP-derived surface air temperatures, yields snow depths that are in good agreement with surface measurements. The appearance and translation of negative values of the spectral gradient are used to delineate areas with significant amounts of standing water or extremely wet soils. In this unusual case, spectral-gradient values comparable to those from open water were observed.
The results of this study are applicable to the cold snow-packs found in Alaska, Siberia and Canada, where strong snowpack temperature gradients dominate the metamorphic processes. Active microwave instruments such as radar altimeters that operate at different frequencies can be combined with the SSM/I to obtain independent estimates on snow depth and grain-size. We recommend that case-studies be carried out for these regions to further validate the algorithm. After validation, this algorithm could be implemented in an operational center to compute the evolution of the snowpack, especially towards the critical latter part of the snow season. The SSM/I data and accurate estimates of the surface temperature are both available on a near-real-time basis. Compilation of these parameters, beginning early in the snow season, and subsequent analysis would allow for near-real-time snow estimates for assimilation into hydrologic models of the region. Application of this algorithm to the 20 year global passive-microwave record from the Scanning Multichannel Microwave Radiometer (SMMR), and continuing with the SSM/I program, will yield accurate estimates of the global snowpack and its interannual variations.
Acknowledgements
We thank the NSIDC, University of Colorado, Boulder, for providing the Equal-Area SSM/I Earth Grid (EASE-Grid) brightness-temperature data and the Equal-Area Scalable Earth Grid (EASE-Grid) version of the IGBP Global Land Cover Characterization.



