


Circadian rhythms are repeating cycles of about 24 h that govern many physiological functions and allow organisms to anticipate changes in their environment. They are regulated at both the systems level, through neural and humoural communication between tissues, and at the cellular level, through transcriptional-translational feedback loops of ‘clock’ transcription factors and 24-h cycles of protein phosphorylation. In mammals, the master circadian pacemaker is located in the suprachiasmatic nucleus of the hypothalamus and is entrained by light through visual and non-visual photoreceptors in the eye(Reference Panda, Sato and Castrucci1). However, food intake can entrain circadian rhythms of peripheral tissues such as liver and adipose tissue, independent of the suprachiasmatic nucleus(Reference Casey and Plaut2). Desynchronisation of suprachiasmatic nucleus and peripheral rhythms can occur when food is restricted to times outside the animal’s normal active period and has been heavily implicated in the genesis of metabolic disorders such as obesity and insulin resistance(Reference Bass and Takahashi3).
The circadian clock of the mammary gland is responsible for generating daily rhythms of milk synthesis in lactating mammals. In cattle, humans and rodents, peak milk yield occurs in the morning, while milk fat and protein concentration peak in the evening(Reference Plaut and Casey4). This adaptation may have evolved to provide neonates with energy-dense milk at night when environmental temperature is lower and nursing and foraging activity is minimal. Furthermore, molecular evidence suggests that as much as 7 % of the human mammary epithelial cell transcriptome oscillates in a circadian manner(Reference Maningat, Sen and Rijnkels5). The molecular clock also appears to be important for the transition from gestation to lactation in dairy cows, with dramatic changes in core clock gene expression between pre- and post-parturition mammary tissue(Reference Casey and Plaut2).
While there is evidence supporting a role of the mammary clock in lactation, there is little evidence describing food entrainment of these rhythms. Rottman et al. observed that the amplitudes of milk fat and protein concentration are reduced by feeding cows four times/d compared with one time/d(Reference Rottman, Ying and Zhou6). However, the response of the mammary gland to altering the timing of nutrient intake has not been examined. Dairy cows (Bos taurus) are a robust model to measure changes in daily rhythms of milk synthesis because of their high milk yield and adaptation to frequent milk collection. Furthermore, dairy cows exhibit daily patterns of intake that are affected by the time of feed delivery, suggesting that they may be responsive to food entrainment(Reference DeVries and von Keyserlingk7). The objectives of the present study were to determine the effect of the timing of feed intake on daily rhythms of milk synthesis, the daily rhythms of plasma hormones and metabolites and body temperature, and the daily patterns of eating and lying behaviour. Our hypothesis was that restricting feed availability to 16 h over the dark period would invert the daily rhythm of milk synthesis relative to feed available for 16 h during the light period and result in a commensurate change in the daily pattern of plasma metabolites, with smaller changes in the daily rhythm of body temperature. We also expect that cows will modify feeding and lying behaviour in response to the time of feed availability. Specifically, we expect cows with feed restricted during the night will have increased feeding time and decreased lying time overnight along with an increased bout of activity prior to feed delivery signifying food anticipatory activity. Developing a better understanding of the relationship between the timing of feeding and the daily rhythm of the mammary gland may uncover opportunities to improve the efficiency of milk production by matching feed intake to the circadian clock of the nutrient metabolism in the mammary gland.
Materials and methods
Animals and treatments
All experimental procedures were approved by the Pennsylvania State University Institutional Care and Use Committee. Sixteen multiparous Holstein cows (183 (sd 103) d postpartum) from the Pennsylvania State University Dairy Research and Teaching Center were randomly assigned to one of the two treatment sequences (n 8 cows per sequence) in a cross-over design. Sample size was based on >80 % power of observing a P < 0·05 difference in milk yield by time interactions based on the variance observed in previous experiments(Reference Rottman, Ying and Zhou6,Reference Niu, Ying and Bartell8) . Treatment periods were 17 d and included 10 d of treatment adaptation with 2 times/d milking and 7 d of 4 times/d milking. Animals were housed in individual tie-stalls and had ad libitum access to water. Cows were maintained in a 19 h light–5 h dark photoperiod with lights on from 05.00 to 00.00 hours, which was confirmed with the presence of a light-sensing data logger (HOBO Pendant Temp/Light; Onset Computer Corp.). Treatments included day-restricted feeding (DRF) with feed available for 16 h/d from 07.00 to 23.00 hours and night-restricted feeding (NRF) with feed available for 16 h/d from 19.00 to 11.00 hours (Fig. 1(A)). All cows were fed the same diet offered at 110 % of the previous day’s intake, and the intake was recorded daily. Feed was mixed once daily at 07.00 hours and immediately delivered to the DRF group. The remaining feed was compressed into plastic barrels, covered with plastic and stored at ambient temperature until feeding to NRF at 19.00 hours. Feed samples were collected on days 7 and 14 of each period, composited by period and analysed for DM, crude protein, neutral-detergent fibre, acid-detergent fibre and ash concentrations according to Rico & Harvatine (online Supplementary Table S1)(Reference Rico and Harvatine9). The experiment was conducted from February to March of 2016.
Effect of day-restricted feeding (DRF) v. night-restricted feeding (NRF) on the daily pattern of feed intake. (A) Daily schedule of feed availability and milking time for DRF (feed available for 16 h/d from 07.00 to 23.00 hours) and NRF (feed available for 16 h/d from 19.00 to 11.00 hours) treatments and milking times. Cows were adapted to feeding schedules for 10 d prior to 7 d of 4× milking. (B) Effects of day v. night feed availability on the rate of feed intake (kg DM/h). Data are least square means with standard error bars for every 2 h period. Preplanned contrasts of the effect of treatment at each time point are shown (* P < 0·05). (A)  , DRF;
  , NRF; (B)
  , DRF;
  , NRF. Treatment: P = 0·61; time: P < 0·001; treatment × time: P < 0·001.

Eating behaviour observation and analysis
The daily pattern of feed intake was monitored in nine of the sixteen cows using an automated feed observation system described by Rottman et al. (Reference Rottman, Ying and Zhou10). Briefly, feed in hanging feed tubs was weighed and recorded every 10 s from days 8 to 17 of each period by an electronic load cell connected to a data acquisition system. To characterise feeding behaviour, the number, length and size of meals as well as the intermeal interval, eating time and eating rate were determined as described Niu et al. (Reference Niu, Ying and Bartell11). Hunger ratio was calculated as meal size divided by the previous intermeal interval, and satiety ratio was determined as meal size divided by the ensuing intermeal interval. To characterise the rate of feed intake across the day, the data were smoothed by calculating a running average over 180 s, the rate of feed intake was then determined over 10-min intervals before averaging across 2-h intervals as described by Rottman et al. (Reference Rottman, Ying and Zhou10).
Activity measurement and analysis
The daily pattern of standing and lying was determined on days 13 to 16 of each period using an accelerometer (HOBO Pendant G; Onset Computer Corporation) similar to that previously described by Ledgerwood et al. (Reference Ledgerwood, Winckler and Tucker12). Briefly, accelerometers were wrapped in gauze, placed on the outside of the left leg with the x-axis perpendicular to the ground and secured with a cohesive bandage (Co-Flex; Andover Healthcare). The x, y and z axes were recorded at 1-min intervals, and lying behaviour was determined using an algorithm developed in IGOR Pro 8 (WaveMetrics Inc.).
Milk sampling and analysis
Cows were milked four times/d (05.00, 11.00, 17.00 and 23.00 hours) for the last 7 d of each period to observe the daily rhythm of milk synthesis. Milk collected at each time point represented milk synthesis during previous 6 h, and data were expressed as the midpoint of the previous milking interval (3 h prior to collection). Milk yield was measured at each milking using an integrated milk metre (AfiMilk MPC Milk Meter; Afimilk Agricultural Cooperative Ltd) and corrected for the deviation of each individual stall according to Andreen et al. (Reference Andreen, Salfer and Ying13). Milk was sampled at all milkings on the last 2 d of each period. One subsample was stored at 4°C with a preservative (Bronolab-WII; Advanced Instruments, Inc.) prior to analysis of fat and protein concentration by Fourier transform infrared spectroscopy (Fossomatic 4000 Milko-Scan and 400 Fossomatic, Foss Electric; Dairy One DHIA). A second subsample was stored without preservative at 4°C and centrifuged at 2300 g within 12 h. The resulting fat cakes were stored at −20°C and analysed for concentrations of individual fatty acids (FA) according to Baldin et al. (Reference Baldin, Zanton and Harvatine14).
Plasma sampling and analysis
Blood was collected by venepuncture of a coccygeal vessel using potassium EDTA vacuum tubes (Greiner Bio-One North America, Inc.). Samples were collected at six time points on days 15 to 17 of each period to represent every 4 h across the day (03.00, 07.00, 11.00, 15.00, 19.00 and 23.00 hours). Blood was immediately placed on ice and centrifuged within 1 h at 2300 g for 15 min at 4°C. Plasma was collected and stored at −20°C for analysis of glucose, NEFA, plasma urea nitrogen and insulin concentrations according to Rottman et al. (Reference Rottman, Ying and Zhou6). Briefly, plasma glucose concentration was analysed using a glucose oxidase/peroxidase enzymatic colourimetric assay (no. P 7119, Sigma-Aldrich), NEFA concentration was measured using an acyl-CoA oxidase/peroxidase enzymatic colourimetric assay (NEFA-HR (2), Wako Diagnostics), plasma urea nitrogen was assayed using a modified Berthelot methodology (Modified Enzymatic Urea Nitrogen Procedure no. 2050; Stanbio Laboratory) and insulin was determined using a porcine 125I-insulin RIA kit with correction based on bovine insulin (PI-12 K Porcine Insulin RIA, EMD Millipore).
Body temperature recording and analysis
Core body temperature was recorded every 10 min on days 12 to 17 of each period using an intravaginal temperature data logger. A miniature plastic-coated thermometer (iBCod; Alpha Mach Inc.) was fastened to a vaginal implant (progesterone-free CIDR; Zoetis, Inc.) and placed centrally in the vagina of the cows using an insertion tool. Raw data were averaged over 2 h intervals.
Statistical analysis
All statistical analyses were performed using the MIXED procedure of SAS 9.4 (SAS Institute). Daily DM intake, milk production and FA yields were analysed using the fixed effects of treatment, period and the interaction of treatment by period and the random effect of cow. A separate model including the fixed effects of treatment, time of day and the interaction of treatment and time of day, as well as the random effects of cow and the repeated effect of time of day was used to test the interaction of treatment and time of day on milk yield and components, rate of feed intake, standing and lying behaviour, plasma metabolite and hormone concentrations, and body temperature. Pairwise comparisons of treatment at each time point were performed for rate of feed intake and standing and lying behaviour using preplanned contrasts. The model included either the autoregressive or heterogeneous autoregressive covariance structure based on convergence criteria, and denominator df were adjusted using the Kenward–Roger method.
Time course data for milk production, plasma hormones and metabolites, and body temperature were fit to the linear form of a cosine function using random regression in SAS 9.4. The model included the fixed effect of treatment, cosine terms and the interaction of treatment with the cosine terms and the random effects of cow and period. A 12-h harmonic was also tested for the daily patterns of plasma hormones and metabolites and body temperature but was removed because it did not improve model fit according to Bayesian information criterion. The fit of the 24-h cosine was determined using a zero-amplitude test, an F test comparing a full model containing the linear form of the cosine function to a reduced linear model. The acrophase (time at peak) and the amplitude (difference between peak and mean) of the 24-h rhythm were calculated, and significance was determined as described by Niu et al. (Reference Niu, Ying and Bartell8). In all analyses, points with Studentised residuals outside of ±3·5 were removed. Statistical significance was declared at P < 0·05 and trends acknowledged at 0·05 < P < 0·10. High-resolution figures were generated using an add-in for Microsoft Excel(Reference Kraus15).
Results
Eating behaviour
Total daily DM intake was not affected by the time of feed restriction (Table 1). The greatest amount of feed was consumed in the first 2 h following feed delivery in both treatments (Fig. 1(B)). However, NRF caused a greater rate of post-feed delivery intake, with NRF consuming 21·6 % (9·6 kg) of their feed/h in the first 2 h after feed delivery compared with 15·6 % (5·9 kg) in the DRF group (P < 0·0001).
Effect of day-restricted feeding (DRF) v. night-restricted feeding (NRF) on total daily DM intake, milk yield and milk composition
(Mean values with their pooled standard errors)

* Treatments were feed available for 16 h during the day (DRF; feed from 07.00 to 23.00 hours) or feed available for 16 h during the night (NRF; feed from 19.00 to 11.00 hours).
The time of feed availability had no effect on meal size, number of meal bouts/d, eating time/d, eating rate or average intermeal interval (Online Supplementary Fig. S1). However, DRF increased average meal length 5·1 min/d (P = 0·02) and increased hunger ratio 40 % (P = 0·01), while the satiety ratio was not modified.
Activity
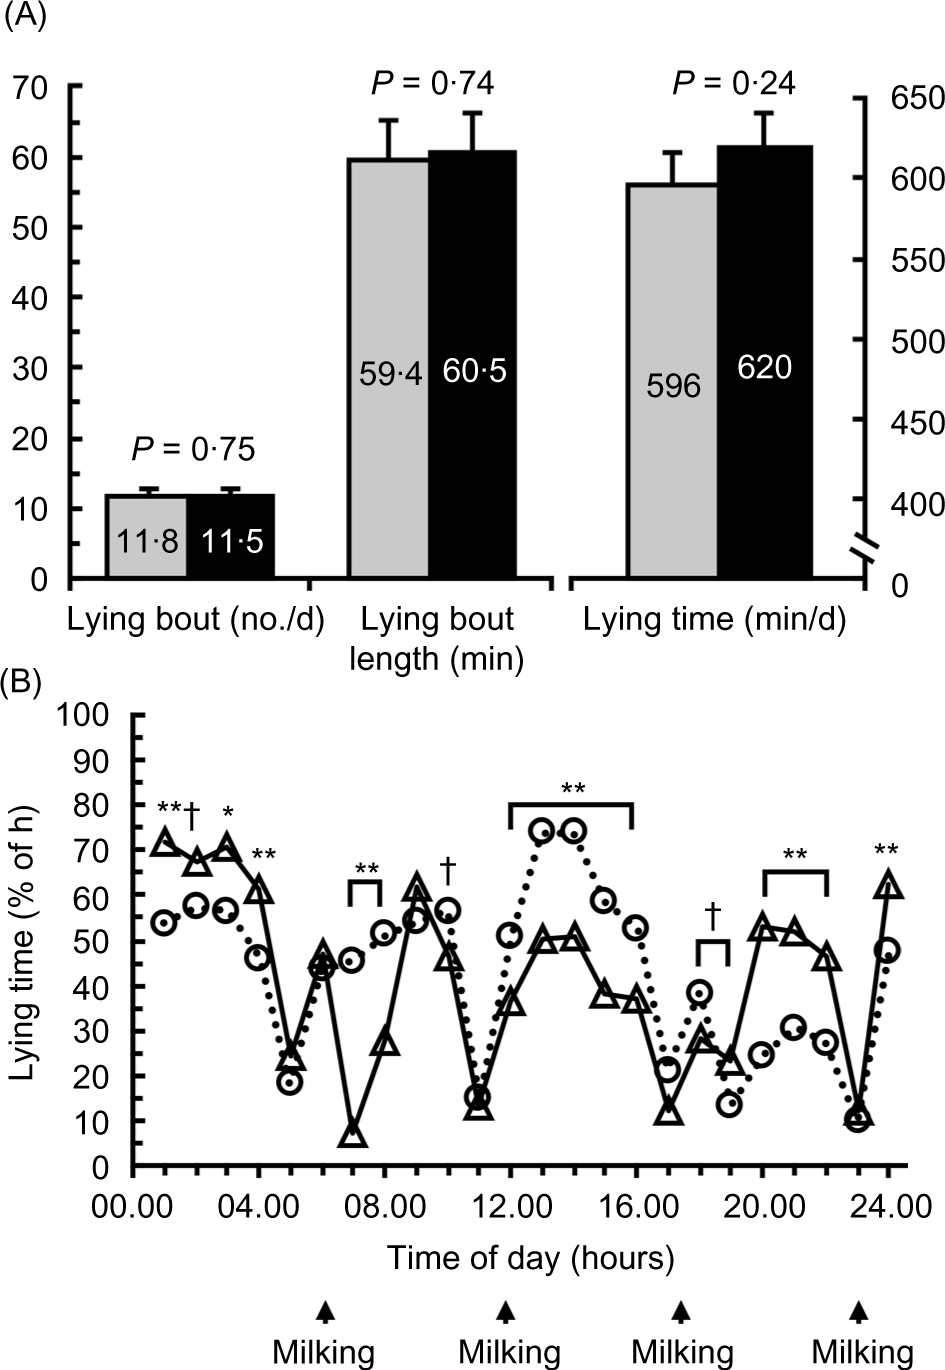
Treatment did not affect the average percent of each hour spent lying (P = 0·50), but an interaction between treatment by lying time occurred (P < 0·001; Fig. 2(B)). However, a treatment by time interaction occurred (P < 0·001). NRF caused cows to spend a greater percentage of time lying between 07.00 and 08.00 hours and from 12.00 to 16.00 hours (P < 0·01), whereas DRF caused cows to have a greater lying time from 00.00 to 01.00, 03.00 to 04.00 and 20.00 to 22.00 hours (P < 0·05). Treatment did not affect the number of lying bouts/d (P = 0·75), average lying bout length (P = 0·75) or total lying time/d (P = 0·24; Fig. 2(A)).
Effect of day-restricted feeding (DRF) v. night-restricted feeding (NRF) on lying behaviour. Treatments were feed available for 16 h during the day (DRF; feed from 07.00 to 23.00 hours) or feed available for 16 h during the night (NRF; feed from 19.00 to 11.00 hours). (A) Effect of DRF v. NRF on lying bouts (number/d), lying bout length (min/bout) and daily lying time (min/d); and (B) daily pattern of lying time (% of h spent lying). Data are least square means. Preplanned contrasts of the effect of treatment at each time point are shown († 0·05 < P < 0·10, * 0·01 < P < 0·05, ** P < 0·01). Milking times are shown in (B). (A) , DRF; , NRF; (B) , DRF; , NRF. sem: 0·05; treatment: P = 0·50; time: P < 0·001; treatment × time: P < 0·001.
Rhythm of milk and milk components
Milk yield fits a cosine function with a 24-h period in both DRF (P < 0·0001) and NRF (P < 0·0001; Fig. 3(A)). The acrophase of milk yield was delayed 8 h by NRF (P < 0·05), and the amplitude of the rhythm was 32 % greater in DRF than NRF (Fig. 3(A)). Total daily milk yield was not affected by treatment (P = 0·12; Table 1).
Effect of day-restricted feeding (DRF) v. night-restricted feeding (NRF) on daily rhythms of milk yield and milk components. Treatments were feed available for 16 h during the day (DRF; feed from 07.00 to 23.00 hours) or feed available for 16 h during the night (NRF; feed from 19.00 to 11.00 hours). Data are least square means, with their standard errors represented by bars. Panels show the effect of DRF v. NRF on the daily pattern of (A) milk yield (kg), (B) milk fat yield (g), (C) milk fat concentration (%), (D) milk protein yield (g) and (E) milk fat concentration (%).* Amplitude (Amp): difference between peak and mean. † Acrophase (Acro): time at peak of the rhythm. P values of the zero-amplitude test are shown. The black and white bars above the x-axis display the light–dark cycle. , DF; , NF. a,b Values in a column with unlike superscript letters are significantly different (P < 0·05).

NRF tended to reduce total daily milk fat yield (P = 0·08; Table 1). Milk fat yield fits a daily rhythm with an amplitude of 13·5 g and an acrophase at 07.04 hours in NRF (P < 0·0001) but did not fit a rhythm in DRF (P = 0·13; Fig. 3(B)). Milk fat concentration fits a 24-h rhythm in NRF (P < 0·0001) and tended to fit a daily rhythm in DRF (P = 0·06; Fig. 3(C)). The acrophase of milk fat concentration peaked at 12.20 hours in DRF and was phase-shifted 10·4 h earlier in NRF (P < 0·05). The amplitude of the milk fat concentration rhythm was increased by 64 % by NRF (P < 0·05). Average daily milk fat concentration was not affected by treatment (P = 0·86)
Milk protein yield fits a daily rhythm in both DRF and NRF (P < 0·001; Fig. 3(D)). The rhythm of milk protein yield peaked at 02.11 hours in DRF and was phase-shifted 5·6 h later in NRF (P < 0·05). The amplitude of the daily rhythm of protein yield was decreased 108 % by NRF with an amplitude of 19·6 in DRF and an amplitude of 9·4 in NRF (P < 0·05). Both DRF and NRF also exhibited a daily rhythm of milk protein concentration (P < 0·02; Fig. 3(E)). Treatment modified the phase of the rhythm with DRF peaking approximately 9·3 h earlier than NRF (15.41 v. 00.58 hours; P < 0·05). The amplitude of the rhythm was increased over 3-fold by NRF, which had an amplitude of 0·15 % compared with 0·04 % in DRF (P < 0·05). Average daily milk protein yield and milk protein concentration were not affected by treatment.
Milk fatty acids yield and profile
Compared with DRF, NRF decreased FA originating from de novo synthesis in the mammary gland by 5 % (Σ < 16C; P = 0·03) and decreased mixed source FA that originate both from de novo synthesis and preformed FA uptake from plasma by 9 % (Σ 16C; P = 0·001; Fig. 4(A)). However, no difference in yield of preformed FA (Σ > 16C) was observed between treatments.
Effect of day-restricted feeding (DRF) v. night-restricted feeding (NRF) on the daily production and daily pattern of milk fatty acids (FA). Treatments were feed available for 16 h during the day (DRF; feed from 07.00 to 23.00 hours) or feed available for 16 during the night (NRF; feed from 19.00 to 11.00 hours). Panels show the effect of DRF v. NRF on (A) total daily yield of de novo (Σ < 16C FA), mixed (Σ 16C FA) and preformed (Σ > 16C FA) FA (g/d), (B) daily average milk fat concentration of trans-10 C18 : 1 (t10) trans-11 C18 : 1 (t11; % of total C18 FA), (C) daily patterns of milk de novo FA yield (g/d), (D) daily patterns of milk t10 concentration (% of total C18 FA), (E) daily patterns of milk mixed source FA yields (g/d), (F) daily patterns of milk t11 concentration (% of total C18 FA) and (G) daily patterns of milk preformed FA yields (g/d). * Amplitude (Amp): difference between peak and mean. † Acrophase (Acro): time at peak of the rhythm. P values of the zero-amplitude test are shown. Data are least square means, with their standard errors represented by bars. The black and white bars above the x-axis display the light–dark cycle. (A,B) , DRF; , NRF; (C–G) , DRF; , NRF. a,b Values in a column with unlike superscript letters are significantly different (P < 0·05).

Both de novo and mixed source FA fit a cosine function with a period of 24 h in both treatments, but preformed FA only fit a cosine function in DRF (P < 0·05; Fig. 4(D)–(F)). The acrophase of the de novo FA rhythm was delayed 6·7 h by NRF (01.08 v. 07.50 hours; P < 0·05) and DRF increased the amplitude of the rhythm by 38 % (P < 0·05). The acrophase and amplitude of the mixed FA yield rhythms were also altered by treatments, with NRF delaying the rhythm 6·1 h compared with DRF (01.28 v. 07.36 hours; P < 0·05), and NRF having a 34 % greater amplitude than DRF (P < 0·05). Similar to the de novo FA rhythm, NRF increased the robustness of the mixed FA yield rhythm, increasing its amplitude 34 % compared with DRF (P < 0·05).
To assess the potential cause of the reduced de novo FA synthesis, milk fat concentrations of trans-10 C18 : 1 (t10) and trans-11 C18 : 1 (t11) were determined. trans-10 C18 : 1 is produced by the alternate biohydrogenation pathways and is elevated during biohydrogenation-induced milk fat depression, and t11 is a product of the normal biohydrogention pathway and is increased with slowing of the normal biohydrogenation pathway(Reference Griinari, Dwyer and McGuire16). The concentrations of t10 and t11 were analysed as a percent of 18 carbon FA, rather than as a percent of total FA to avoid bias of changes in de novo and mixed FA. NRF increased t10 by 32·8 % (P = 0·01) and t11 by 16·3 % (P = 0·001) compared with NRF (Fig. 4(B)). Both t10 and t11 fit daily rhythms in both treatments (P < 0·0001; Fig. 4(G) and (H)). Milk fat t10 was phase-delayed 12·1 h by NRF compared with DRF (10.38 v. 22.34 hours; P < 0·05). The amplitude of t10 was increased by NRF compared with DRF (0·08 v. 0·06 %; P < 0·05). Like t10, NRF caused a complete inversion of the daily rhythms of t11 concentration, shifting the peak from 18.16 hours in DRF to 06.04 hours in NRF (P < 0·05). The amplitude of t11 was not affected by treatment (P > 0·10).
Plasma hormones and metabolites
Plasma glucose fits a 24-h cosine in both the DRF (P < 0·03) and NRF (P < 0·001), with NRF increasing the amplitude of the rhythm by 149 % (P < 0·05; Fig. 5(A)). NRF also phase-shifted plasma glucose, with the acrophase occurring 10·2 h later in DRF than NRF (P < 0·05).
Effect of day-restricted feeding (DRF) v. night-restricted feeding (NRF) on daily rhythms of plasma hormones and metabolites. Treatments were feed available for 16 h during the day (DRF; feed from 07.00 to 23.00 hours) or feed available for 16 h during the night (NRF; feed from 19.00 to 11.00 hours). Panels show the effect of DRF v. NRF on (A) daily patterns of plasma glucose concentration (mg/dl), (B) daily patterns of plasma insulin concentration (μIU/ml), (C) daily patterns of plasma NEFA concentration (μEq/l) and (D) daily patterns of plasma urea nitrogen concentration (mg/dl). Data are least square means, with their standard errors represented by bars. * Amplitude (Amp): difference between peak and mean. † Acrophase (Acro): time at peak of the rhythm. P values of the zero-amplitude test are shown. The black and white bars above the x-axis display the light–dark cycle. , DRF; , NRF. a,b Values in a column with unlike superscript letters are significantly different (P < 0·05). To convert glucose in mg/dl to mmol/l, multiply by 0·0555.

Plasma insulin concentration fits a 24-h cosine function in both treatments (P < 0·001), with no difference in mean insulin concentration between DRF and NRF (P = 0·69; Fig. 5(B)). NRF shifted the acrophase of insulin production 8·0 h and increased the amplitude 0·9 μIU/ml compared with DRF (P < 0·05).
Concomitant with the shift in plasma insulin rhythms, the rhythms of plasma NEFA concentration were dramatically altered by treatment (Fig. 5(C)). Both treatments exhibited 24-h rhythms of plasma NEFA (P < 0·01), but the acrophase of the rhythms was markedly different, with DRF rhythms peaking at 06.14 hours and NRF peaking at 16.57 hours (P < 0·05). Additionally, NRF increased the amplitude of the NEFA rhythm 3·3-fold (P < 0·05). This increase in amplitude in the NRF treatment was partially attributed to a dramatic rise in NEFA concentration to 214 μEq/l at 19.00 hours, 6 hours into the fasting period.
Plasma urea nitrogen fits a 24-h rhythm in DRF (P = 0·001) and NRF (P < 0·001; Fig. 5(D)). Altering the timing of time-restricted feeding nearly completely inverted the phase of the daily rhythm with NRF peaking 11·2 h earlier than NRF (P < 0·05). Moreover, the amplitude of the plasma urea nitrogen rhythm was 58 % greater in NRF than DRF (P < 0·05).
Body temperature
Body temperature fits a 24-h cosine function in both treatments (P < 0·05) and was modified by timing of feed restriction (Fig. 6). NRF delayed the phase of the rhythm 15·50 hours (P < 0·05) and increased the amplitude 75 % compared with DRF (P < 0·05). Average body temperature was not affected by treatment.
Effect of day-restricted feeding (DRF) v. night-restricted feeding (NRF) on the circadian rhythm of body temperature in dairy cows. Treatments were feed available for 16 h during the day (DRF; feed from 07.00 to 23.00 hours) or feed available for 16 h during the night (NRF; feed from 19.00 to 11.00 hours). Data are 2 h means and standard error bars of body temperature collected every 10 min by a vaginal temperature data logger. * Amplitude (Amp): difference between peak and mean. † Acrophase (Acro): time at peak of the rhythm. P values of the zero-amplitude test are shown. The black and white bars above the x-axis display the light–dark cycle. Treatment: P = 0·97; time: P < 0·001; treatment × time: P < 0·001. , DRF; , NRF. a,b Values in a column with unlike superscript letters are significantly different (P < 0·05).

Discussion
The rate of feed intake was greater after food delivery in the NRF compared with DRF, which is consistent with previous results reporting that feed delivery 1 time/d at night increases intake in the first 2 to 3 h after feeding compared with feed delivery in the morning(Reference Niu, Ying and Bartell8,Reference Nikkhah, Furedi and Kennedy17) . Cows naturally exhibit a crepuscular pattern of intake, with greatest intake occurring at dusk and dawn and lowest intake occurring overnight. Cows fed TMR normally have high intake at feed delivery and the late afternoon and low intake in the overnight period(Reference DeVries and von Keyserlingk7). In NRF, feed was withheld during the high-intake afternoon period of the day (11.00–19.00 hours), whereas DRF cows were without feed during the low-intake night. The greater rate of intake immediately after feeding in NRF suggests greater hunger signalling presumably due to the circadian pattern of hunger and satiety. Other species display 24-h rhythms of hunger. Humans, for example, exhibit the greatest appetite in the evening and lowest in the morning, independent of sleeping time or food intake(Reference Scheer, Morris and Shea18). Moreover, rats display circadian rhythms of meal size and meal frequency under constant illumination(Reference Rosenwasser, Boulos and Terman19). Despite the difference in the daily pattern of feed intake, total DM intake did not differ between treatments because DRF compensated by increasing intake in the afternoon compared with the corresponding period in NRF (01.00–07.00 hours).
The change in the daily pattern of feed intake was accompanied by a change in standing and lying behaviour. Cows under NRF spent less time lying and more time standing overnight (00.00–04.00 hours), which is consistent with their increased rate of feed intake. Meanwhile, cows under DRF spent less time lying during the afternoon (12.00–16.00 hours) when their feed intake was greater. Similar to the present study, Niu et al. previously demonstrated that feeding cows at night without time-restricted feeding decreased lying time during the overnight period relative to day feeding(Reference Niu, Ying and Bartell8). In rodent models, time-restricted feeding entrains circadian rhythms of food anticipatory activity, which is an increased bout of activity prior to scheduled feeding time(Reference Stephan20). Contrary to our hypothesis, cows did not appear to exhibit food anticipatory activity, with no increased activity in the hours leading up to feed delivery.
Dairy cows in commercial settings are usually fed in the morning and typically have greatest milk yield in the morning and greatest fat and protein concentration in the evening(Reference Rottman, Ying and Zhou6,Reference Quist, LeBlanc and Hand21) . Our results corroborated these findings in cows under DRF but demonstrated that NRF shifts this daily pattern 8 h later in the day. These results are novel and demonstrate that feeding time has a profound effect on the daily rhythms of milk synthesis. The change in the rhythms of milk and milk component synthesis in response to NRF is either due to a change in available substrate for milk synthesis or entrainment of circadian clock of the mammary gland. In mice, time-restricted feeding shifted the rhythms of clock genes in the mammary gland and affects the rhythmic gene expression of transcription factors (SREBP1c, Spot 14) and enzymes (SCD1 and FASN) related to milk fat synthesis(Reference Ma, Ying and Clarke22). These results suggest that alterations in the mammary molecular clock may mediate the response of feeding time on rhythms of milk synthesis, but further research must be conducted to evaluate this effect.
The tendency for a decrease in total fat yield in NRF appeared to be more influenced by a reduction in de novo FA synthesis compared with preformed FA uptake because NRF decreased de novo and mixed FA yields but not preformed FA. Notably, the tendency for decrease in milk FA yields appears to be due to the cumulative effects of reductions in milk yield and milk fat concentration because neither milk yield nor milk fat yield was significantly reduced by NRF. The potential decrease in de novo FA synthesis in NRF may be related to an increase in trans-10 C18:1, a FA isomer that is highly correlated with reduced de novo FA synthesis. Notably, t11C18 : 1 was also increased in NRF indicating that overall rumen biohydrogenation was increased, rather than a shift to the alternate biohydrogenation pathway(Reference Rico and Harvatine9).
The decrease in apparent ruminal biohydrogenation in NRF may be because they consumed a larger percentage of their feed during the first 2 h after than DRF. Previous research demonstrated that stabilising feed intake through 4 times/d feeding increased milk fat yield and decreased t10 C18 : 1(Reference Rottman, Ying and Zhou6). The changes in daily patterns of de novo, mixed source and preformed FA yield closely reflected the daily pattern of milk yield. The daily pattern of t10 C18 : 1 appeared to be highly impacted by time of feed restriction, peaking at the start of the fasting period in both treatments. Trans-11 C18:1, meanwhile, peaked in the middle of the feeding period, 13 h after feed delivery in both treatments.
Similar to previous reports in dairy cattle(Reference Giannetto and Piccione23), rodent models(Reference Rudic, McNamara and Curtis24) and humans(Reference Poggiogalle, Jamshed and Peterson25), plasma glucose concentration fits a 24-h rhythm. Furthermore, both glucose and insulin concentrations were phase-shifted by NRF compared with DRF. Circadian control over glucose metabolism in experimental models has been well-established. In mice, a functioning circadian clock in pancreatic β-cells is required for maintenance of insulin sensitivity(Reference Sadacca, Lamia and DeLemos26). The amplitude of NEFA concentration was greatly increased in NRF compared with DRF. This is likely a consequence of the daily pattern of hunger and satiety. Cattle typically increase feed consumption during the afternoon, suggesting greater hunger signalling during this time(Reference Ray and Roubicek27). The results of the current experiment suggest that fasting during the high-intake afternoon period of the day causes greater lipid mobilisation than fasting during the low-intake overnight period. These results were similar to those reported in rats, which displayed a shift in the daily pattern of insulin release when they were fasted during the early part of their active period(Reference Shimizu, Hanzawa and Kim28). Insulin in a potent inhibitor of hormone-sensitive lipase, the enzyme responsible for causing lipid mobilisation from adipose tissue(Reference Locher, Meyer and Weber29). Expectedly, peak NEFA concentration in both treatment groups coincided with the nadir of insulin release. Shostak et al. reported that lipolysis from white adipose tissue follows a daily pattern and showed using ClockΔ19 and Bmal -/- mice that these patterns were controlled by the molecular circadian clock(Reference Shostak, Meyer-Kovac and Oster30). The present study provides evidence suggesting a similar mechanism may occur in dairy cows.
The shift in the daily rhythm of body temperature by the time of time-restricted feeding likely demonstrates a change in the central circadian rhythm. This result of the present study showed a more extreme shift in the rhythm of body temperature than that previously observed by Niu et al., who reported a 3-h phase delay after feeding at 20.30 hours compared with 08.30 hours, without restricting the time of feed availability(Reference Niu, Ying and Bartell8). Our results also agree with research performed in mice which showed shifts in the body temperature rhythms when food was restricted to the inactive period(Reference Damiola, Le Minh and Preitner31). Interestingly, body temperature began to decline after feed the time of feed delivery and remained low during the period of the day when rumen temperature would be expected to increase due to increased fermentation. Shifts in the rhythm of body temperature are capable of entraining peripheral circadian clocks in mammals(Reference Brown, Zumbrunn and Fleury-Olela32). The phase shift in the body temperature due to altering the time of time-restricted feeding may differentially entrain the daily rhythms of organ systems throughout the animal. Future research should examine the role of temperature entrainment in the dairy cow.
In conclusion, timing of feed intake shifted the daily rhythms of milk synthesis, plasma hormones and metabolites, and body temperature. Modification of the phase of milk synthesis by temporal changes in absorption of nutrients indicates possible changes in the mammary molecular clock. Timing of nutrient intake also influences the central circadian clock, evidenced by the shift in the body temperature rhythm. These results support the hypothesis that timing of nutrient absorption modified the daily rhythms of milk synthesis, perhaps due to entrainment of the mammary circadian clock. Additionally, the fasting response was more dramatic for cows on the NRF treatment, having a greater post-feeding feed consumption rate, and greater pre-meal NEFA concentrations. Moreover, milk fat yield, particularly the yield of de novo synthesised FA, was reduced by NRF, which we speculate was because the greater rate of feed intake caused an increase in total ruminal biohydrogenation in NRF. These results reinforce the importance of not limiting the access of dairy cows to feed during the high-intake afternoon period of the day.
Acknowledgements
The authors gratefully acknowledge the technical assistance of Dr Paul Bartell, Dr Michel Baldin, Dr Natalie Urrutia, Y. Ying and Rebecca Bomberger (Penn State University, University Park, PA). Gratitude is also expressed to the Pennsylvania State University Dairy Cattle Research and Education Center for care of animal subjects.
This research was supported in part by US Department of Agriculture (USDA) Agriculture and Food Research Initiative Competitive Grant no. 2015-67015-23358 from the USDA National Institute of Food and Agriculture (principal investigator K. J. H.), National Institutes of Health Training Grant no. GM108563 (I. J. S.), and Penn State University including USDA National Institute of Food and Agriculture Federal Appropriations under Project number PEN04539 and accession number 1000803.
K. J. H. and I. J. S. formulated the research question. I. J. S. conducted the study and completed all sample analyses. K. J. H. supervised the research project. I. J. S. wrote the paper. K. J. H. revised the paper. All authors read and approved the final version of the manuscript.
The authors declare no conflicts of interest.
Supplementary material
For supplementary material referred to in this article, please visit https://doi.org/10.1017/S0007114520000057


