

Vitamin A is critically important for the maintenance of health. Vitamin A deficiency has been a major nutritional disorder in low- and middle-income countries including Bangladesh. Vitamin A disorder predisposes children to increased risk of a range of problems, including respiratory diseases, diarrhoea, measles and vision problems, and can lead to death( Reference Imdad, Herzer and Mayo-Wilson 1 ). Vitamin A deficiency alone is responsible for almost 6 % of deaths among children under the age of 5 years in Africa and 8 % in South-East Asia( 2 ). Vitamin A disorder has vital risks beyond mortality; these are anaemia, intra-uterine development and birth outcomes, and cognitive development( Reference Rice, West and Black 3 ). The importance of vitamin A in health comes from its widespread role in maintaining the integrity of epithelia, its multidimensional role in the immune system, its hormone-like action and its role in gene expression( Reference Jason, Archibald and Nwanyanwu 4 – Reference Stephensen 6 ). Thus reducing the prevalence of subclinical vitamin A disorder could be expected to have a profound benefit to the health of populations in low- and middle-income countries, especially women and children( Reference Grotto, Mimouni and Gdalevich 7 , Reference Ramakrishnan, Latham and Abel 8 ).
Bangladesh has long been a country with a problem of vitamin A deficiency. Prevalence of night blindness (clinical vitamin A disorder) in children under 6 years was 3·6 % in 1982–1983 and 1·8 % in 1989( Reference Jamil, Rahman and Bardhan 9 ). Since then the problem of night blindness in children has decreased significantly to 0·6 %, concurrent to a successful vitamin A supplementation programme in the country( 10 ). The WHO redefined vitamin A deficiency as low serum retinol in 2002( Reference Sommer and Davidson 11 ), thus highlighting that the problem of subclinical vitamin A disorder is much broader than clinical vitamin A disorder (night blindness) which now has a prevalence of less than 1 % in children( 12 ). Despite the fact that the national programme of vitamin A supplementation in Bangladesh has been operational for decades, the prevalence of vitamin A deficiency (percentage with low serum retinol) in pre-school children estimated through a nationally representative survey remained high at 21·7 %( 10 ). Since then more than a decade has elapsed and the country is in need of updated national data on vitamin A status. The current study from the national micronutrient survey 2011–2012 attempts to present national data on the current status of vitamin A in Bangladeshi populations (pre-school age children, school age children and non-pregnant, non-lactating women) and its underlying determinants in order to inform the national policy and action.
Methods
Sampling and study population
A multistage random sampling procedure was used to select study participants from rural, urban and slum strata, dispersed all over Bangladesh. The detailed method of multistage sampling is provided in Rahman et al.( Reference Rahman, Ahmed and Rahman 13 ). In the final stage, twenty households were selected randomly in each cluster, which provided the definitive sampling frame in order to select the study participants systematic randomly for household interview and biological specimen collection. The number of twenty households in the final stage was fixed based on our field-testing experiences prior to the survey, and was compatible with the required number of study participants from all population groups. Data were collected in three population groups: (i) pre-school age children (PSAC; 6–59 months); (ii) school age children (SAC; 6–14 years); and (iii) non-pregnant, non-lactating women (NPNLW; 15–49 years).
Sample size
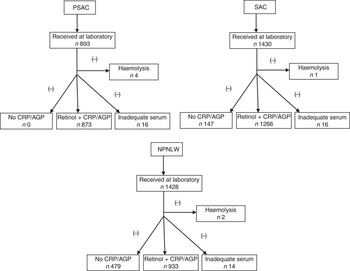
In 1997 a nationally representative survey in Bangladesh estimated the prevalence of vitamin A deficiency in pre-school children to be 22 %( Reference Grotto, Mimouni and Gdalevich 7 ). The present study considered the national estimates of that survey to calculate sample size, taking into consideration that the national programme of fortification of edible oil with vitamin A would decrease the prevalence of vitamin A deficiency by 5 percentage points. We considered a rounded-off estimate of 25 % (22 % was rounded off to 25 %) as the then (2011) available estimate of vitamin A deficiency in PSAC. Similarly, the then (2011) existing status of vitamin A deficiency (i.e. the 1997 survey estimates) for SAC (rounded off to 25 %) and NPNLW (5 %) were considered to calculate sample size, taking consideration that the oil fortification programme would result in a 5 and 3 percentage points reduction of vitamin A deficiency, respectively. With 80 % power to detect the anticipated change in subclinical vitamin A deficiency, a design effect of 2 and non-response of 1·2, the calculated sample number in PSAC at the national level was 1176. Similarly, the calculated sample size for SAC and NPNLW was 1455 and 954, respectively (see online supplementary material, Supplemental Table 1). However, the final analytic sample number was 873, 1266 and 933 in PSAC, SAC and NPNLW, respectively, after excluding samples in which retinol was not accompanied by corresponding C-reactive protein (CRP) and α1-acid glycoprotein (AGP) values, samples with inadequate serum in aliquots and samples exhibiting haemolysis (Fig. 1).
Profile of serum retinol analyses among pre-school age children (PSAC; 6–59 months), school age children (SAC; 6–14 years) and non-pregnant, non-lactating women (NPNLW; 15–49 years), Bangladesh, 2011–2012 (CRP, C-reactive protein; AGP, α1-acid glycoprotein)
Data and biological specimen collection
Data on socio-economic status (SES), household possession of assets, household construction material, household food insecurity, morbidity of children and food consumption were analysed. SES was assessed by constructing the wealth index( Reference Gwatkin, Rustein and Johnson 14 ). Household food insecurity was assessed by the Household Food Insecurity Access Scale (HFIAS) for measurement of food access( Reference Coates, Swindale and Bilinsky 15 ). In order to assess food consumption, a 7 d semi-quantitative FFQ recall was used, taking into consideration the commonly consumed Bangladeshi foods (forty-three food items). Standardized food photographs indicating the portion size (grams) were used to assess the quantity of consumption. Number of portions consumed over the past 7 d was multiplied by the average size of the portions, to yield the total weekly consumption of a particular food (grams, millilitres). Raw food weight was calculated by using appropriate conversion factors( Reference Ali 16 ). Nutrient values for vitamin A were calculated per 100 g of raw food consumed through use of an updated food composition table on Bangladeshi foods( Reference Islam, Khan and Akhtaruzzaman 17 ). A β-carotene to retinol (in μg retinol activity equivalents (RAE)) conversion rate of 12:1 was used to account for intake of plant-origin vitamin A; while for animal-origin vitamin A, a 1:1 conversion rate was used( 18 ). PSAC were considered to fall under vitamin A supplementation coverage if the supplementation had taken place within the previous 6 months from the date of data collection( 19 ). Venous blood was collected from each participant into a trace-element-free Venoject tube, which was immediately wrapped in dark opaque paper and placed in a cool box, to allow blood to clot. Each whole blood sample was centrifuged (portable centrifuge at 3000–3500 rpm) at the field collection centre and the serum was aliquoted into a cryovial using a disposable pipette. The cryovials were stored in a freezer at −20°C. Aliquoted serum samples were transferred on dry ice to the nutritional biochemistry laboratory at icddr,b (Dhaka, Bangladesh) and stored at −70°C in a freezer. Serum retinol was determined using HPLC (Prominence HPLC System; Shimadzu Corp., Kyoto, Japan). Hb was assessed on venous blood using a HemoCue® Hb 301 System (HemoCue AB, Ängelholm, Sweden). CRP and AGP were analysed by sandwich ELISA (Dynex Technologies Inc., Chantilly, VA, USA).
Quality control of biochemical assays
All biochemical analyses were done in the nutritional biochemistry laboratory of icddr,b. To control quality of the laboratory analyses, pooled serum quality control material was used for retinol and a CV of 1·5 % was estimated. Precinorm protein and Precipath protein (Roche Diagnostics GmbH, Mannheim, Germany) were used as quality controls to check the accuracy and precision of CRP and AGP assays. The CV for CRP and AGP measurement was 3·9 and 5·9 %, respectively. External quality assurance was conducted with MMQAP (Micronutrients Measurement Quality Assurance Program; National Institute of Standards and Technology, Gaithersburg, MD, USA) for retinol and VITAL-EQA (Vitamin A Laboratory – External Quality Assurance; Center for Disease Control and Prevention, Atlanta, GA, USA) for CRP and AGP.
Adjusting for infection
Serum level of retinol was adjusted for infection by estimating biomarkers of infection: CRP and AGP. The adjustment of serum retinol for elevated CRP (>10·0 mg/l) and AGP (>1·0 g/l) was done by deriving the correction factors following the methods described by Thurnham et al.( Reference Thurnham, McCabe and Haldar 20 , Reference Engle-Stone, Haskell and Ndjebayi 21 ).
Statistical analysis
Data analysis was done using the statistical software package Stata 10.0 SE. Proportions were calculated with 95 % confidence intervals and means were calculated with standard deviations. In 2011, there was wide difference in projected estimates of the population sorted by strata( Reference Rahman, Ahmed and Rahman 13 , 22 , 23 ). In order to compensate for the large difference in size of the strata, sampling weights were applied through the procedure described in Rahman et al.( Reference Rahman, Ahmed and Rahman 13 ). The variables showing skewed distributions underwent logarithmic transformation to convert them to a normal distribution. Statistical analyses such as proportion estimates, one-way ANOVA and multivariable regression analyses were done on weighted data. All analyses, including the regression models, were adjusted for clustering of data at the unit of the randomization level (primary sampling unit). We selected the independent variables for the multivariable linear regression taking consideration of their relevance in relation to serum retinol; such as household expenses (symbolizing the household’s economic capacity), occupation of household head, education of mother, household asset score, HFIAS score, age, sex and area of residence. We considered dietary intake variables, such as consumption of animal-source foods and leafy vegetables, considering the presence of bioavailable and poorly bioavailable vitamin A in those types of foods, respectively. We accounted for time since the last episode of vitamin A supplementation in young children as it could have an influence on serum retinol status. A variable regarding mother’s knowledge of vitamin A-rich foods was considered as it might have a relationship with children’s serum retinol. Possession of household assets is a predictor of nutritional status in children( Reference Mohsena, Massie-Taylor and Goto 24 ). Particular household assets, such as a mobile phone and refrigerator, are possessed by 80 and 12 % of households, respectively, at the national level( 25 ). Hence, lack of possession of a mobile phone and possession of a refrigerator are possible indicators of low and high SES, respectively; so much so that we were interested to see if possession or non-possession of particular household assets could have any association with serum retinol status.
All independent variables, quantitative (age, HFIAS score, household’s monthly expenses, SES measured through asset index score, food consumption, etc.) or categorical (strata, occupation of household head, mother’s knowledge of vitamin A-rich foods, child’s morbidity such as diarrhoea and fever during the 2 weeks preceding the survey, etc.), that were presumed to have an association with serum retinol were entered into univariate linear regression analyses. If there was a significant association with serum retinol at P<0·05 and it had the expected sign mark (i.e. plus or minus sign of the coefficient as per the logical expectation), the variables were selected for the multivariable regression( Reference Gelman and Hill 26 ). Standardized β (effect size) was calculated to estimate the standardized change in the outcome (serum retinol) given a 1 sd or category change in the independent variable depending on the type of the variable, quantitative or categorical. The xi command in Stata was used to enable inclusion of categorical covariates in the multivariable models. The independent variables that were assumed to have interaction were entered in the initial regression analyses as an interaction term along with the interacting predictors. If the regression coefficient for the interaction term was non-significant (P ≥ 0·05), it was omitted; otherwise, in the case that the interaction term was statistically significant, it was retained and entered into the final regression model( Reference Mason, Gillenwater and Pugh 27 ).
Cronbach’s α reliability coefficients for internal consistency of the data were calculated taking into consideration the variables of SES, dietary consumption, household food insecurity and serum levels of micronutrients. Cronbach’s α ranged between 0·80 and 0·82 over the population groups, which is indicative of strong interrelatedness of the variables measuring association with serum retinol and suggests good reliability of the data( Reference Zaontz 28 , Reference George and Mallery 29 ).
Results
Vitamin A status
The national prevalence of subclinical vitamin A deficiency in PSAC, SAC and NPNLW was 20·5, 20·8 and 5·3 %, respectively (Table 1). In PSAC the deficiency was 19·4, 21·2 and 38·1 % in rural, urban and slum strata, respectively. In SAC, the respective prevalence was 20·1, 22·1 and 27·1 %; while in NPNLW it was 5·4, 4·7 and 6·8 %. The national mean estimate of serum retinol was 0·89, 0·78 and 1·14 μmol/l in PSAC, SAC and NPNLW, respectively (Table 1). Mean serum retinol estimate of the urban stratum was higher than that of the slum stratum in all population groups: 0·94 v. 0·77 μmol/l (P<0·001) in PSAC; 0·81 v. 0·72 μmol/l (P=0·004) in SAC; and 1·67 v. 0·96 μmol/l (P=0·003) in NPNLW. The infection-unadjusted distribution of serum retinol sorted by strata was, by and large, similar to adjusted retinol (see online supplementary material, Supplemental Table 2).
Status of subclinical vitamin A nutrition and serum retinol levels, nationally and according to stratum of residence, in pre-school age children (PSAC; 6–59 months), school age children (SAC; 6–14 years) and non-pregnant, non-lactating women (NPNLW; 15–49 years), Bangladesh, 2011–2012Footnote †,Footnote ‡,Footnote §
*Rural v. urban, P=0·01; **urban v. slum, P=0·003; ***urban v. slum, P=0·004; ****rural v. urban, P=0·006; *****slum v. rural, P<0·001; ******urban v. slum, P<0·001.
† Subclinical vitamin A deficiency is defined as serum retinol level of <0·7 µmol/l( 10 ).
‡ Adjusted for elevated C-reactive protein (>10 mg/l) or elevated α1-acid glycoprotein (>1 g/l) by mathematical correction( Reference Thurnham, McCabe and Haldar 20 , Reference Engle-Stone, Haskell and Ndjebayi 21 ).
§ Estimates weighted to represent the population level.
Over half of the PSAC (56·3 %) and SAC (53·5 %) and one-third (34·3 %) of the NPNLW populations at the national level were experiencing mild grade of vitamin A deficiency (serum retinol ≥0·7–<1·05 µmol/l; Table 2). The national prevalence of severe grade of vitamin A deficiency (serum retinol <0·35 µmol/l) was very low in all study groups (1 % or less); however, in the slum stratum it was 2·4 and 2·2 % in PSAC and SAC, respectively. Serum retinol level consistent with normal status (≥1·05 µmol/l) was observed in 21·7, 30·4 and 8·5 % of PSAC and 25·9, 25·8 and 17·0 % of SAC in rural, urban and slum strata, respectively, and in 58·7–63·7 % of NPNLW according to different strata (Table 2).
Levels of subclinical vitamin A status, nationally and according to stratum of residence, in pre-school age children (PSAC; 6–59 months), school age children (SAC; 6–14 years) and non-pregnant, non-lactating women (NPNLW; 15–49 years), Bangladesh, 2011–2012

Dietary consumption of vitamin A
Table 3 provides an account of the dietary consumption of vitamin A. The median total vitamin A consumption in PSAC (aged 2–<5 years) was 209·1–213·6 µg RAE/d, while the intake of animal-source vitamin A was 32·7–53·9 µg RAE/d according to the different strata. In SAC, intakes of total and animal-source vitamin A were 272·7–281·9 and 28·2–46·1 µg RAE/d, respectively, according to different strata. In NPNLW, intakes of total and animal-source vitamin A were 311·1–431·3 and 25·3–39·3 µg RAE/d, respectively, sorted by stratum. The proportion of the population that met the RDA( 18 ) for vitamin A was 39·5 % in PSAC, 27·1–46·0 % in SAC and 29·1 % in NPNLW. Median intake of animal-origin vitamin A constituted 4·2–10·0 % of the RDA( 18 ), depending on different age and population groups. The share of plant-origin vitamin A in the diet was 73, 79 and 87 % in PSAC, SAC and NPNLW, respectively. Leafy vegetables constituted the single largest source, as it accounted for 69·6, 75·9 and 83·0 % of total vitamin A intake in PSAC, SAC and NPNLW, respectively (Table 3).
Dietary intake of vitamin A, nationally and according to stratum of residence, in pre-school age children (PSAC; 6–59 months), school age children (SAC; 6–14 years) and non-pregnant, non-lactating women (NPNLW; 15–49 years), Bangladesh, 2011–2012

RAE, retinol activity equivalents; LV, leafy vegetables.
† Among PSAC, quantitative intake data are available for children aged 2–<5 years.
‡ RDA of the US Institute of Medicine: age 4–5 years, 400 µg RAE; age 6–8 years, 400 µg RAE; age 9–13 years, 600 µg RAE; age 15–49 years, 700 µg RAE( 18 ).
Vitamin A supplementation in pre-school age children
The national coverage of vitamin A capsule supplementation for PSAC was 77·0 % (95 % CI 69·4, 84·2 %). The coverage was 77·9, 73·1 and 72·4 % in the rural, urban and slum stratum, respectively. The coverage in the ‘poorest’ and ‘richest’ quintiles was 76·4 and 87·5 %, respectively (see online supplementary material, Supplemental Table 3).
Determinants of serum retinol
Multivariable linear regression analyses (Table 4) assessing determinants for serum retinol upon controlling for SES, food consumption and morbidity covariates showed that age was associated with higher levels of retinol in SAC (standardized β=0·08, P=0·01). Intake of animal-source foods was associated with higher levels of retinol in PSAC (standardized β=0·27, P<0·001) and in SAC (standardized β=0·075, P=0·05). Non-agricultural profession of the household head was associated with higher levels of retinol in SAC compared with their peers with household heads in agricultural professions (standardized β=0·073, P=0·04). Hb was associated with higher levels of retinol in SAC (standardized β=0·20, P<0·001). Mothers lacking knowledge of vitamin A-rich foods was associated with lower levels of serum retinol in SAC (standardized β=−0·071, P=0·03). Residence in the urban stratum compared with the rural stratum was associated with higher levels of retinol in NPNLW (standardized β=0·08, P=0·004) and PSAC (standardized β=0·11, P=0·04). Vitamin A supplementation in PSAC any time between 3 and 12 months before the survey did not predict a lower status of serum retinol, compared with their counterparts who had taken the supplementation within the past 3 months (standardized β=−0·06, P=0·42; standardized β=0·046, P=0·46; standardized β=−0·006, P=0·91 in 3–6 months, 6–9 months and 9–12 months post supplementation groups, respectively).
Multivariable linear regression analysesFootnote †,Footnote ‡,Footnote § showing determinants of serum retinol in non-pregnant, non-lactating women (NPNLW; 15–49 years), school age children (SAC; 6–14 years) and pre-school age children (PSAC; 6–59 months), Bangladesh, 2011–2012

Ref., reference category; LV, leafy vegetables; HFIAS, Household Food Insecurity Access Scale.
Interaction terms (NPNLW): (possession of mobile phone×area of residence), (area of residence×intake of LV), (possession of mobile phone×marital status) and (area of residence×marital status) were considered in the initial regression analyses, along with the interacting covariates. However, none of them had significant interaction at P<0·05. Hence, all were excluded from the final multivariable regression model.
Interaction terms (SAC): (HFIAS score×sex), (asset score×sex), (intake of animal-source food×sex), (Hb×sex), (occupation of household head×intake of animal-source food), (area of residence×intake of LV), (HFIAS scale score×intake of animal-source food), (asset score×intake of animal-source food), (HFIAS×mother’s knowledge of vitamin A-rich food), (household expenses×mother’s knowledge of vitamin A-rich food), (intake of animal-source food×ownership of refrigerator), (HFIAS score×ownership of mobile phone), (asset score×ownership of refrigerator) and (intake of animal-source food×Hb) were separately assessed through initial regression analyses, along with component predictors. However, none of them reached a statistically significant interaction level at P<0·05, except for (HFIAS×sex), P=0·03, which was included in the final multivariable regression model. However, it had non-significant interaction in the multivariable model (P=0·38).
Interaction terms (PSAC): (household expenses×intake of animal-source food), (household expenses×area of residence), (household expenses×asset score), (household expenses×HFIAS score), (asset score×intake of animal-source food), (intake of animal-source food×HFIAS score), (area of residence×intake of LV), (area of residence×Hb), (intake of animal-source food×Hb) and (asset score×Hb) were separately assessed through initial regression analyses, along with component predictors. However, none of them had significant interaction at P<0·05. Hence, all were excluded from the final multivariable regression model.
† The empty fields in the table imply either not applicable or not entered in the multivariable model as the univariate analyses were non-significant (P>0·05).
‡ Units (dependent variables): household spending, Bangladeshi Taka; age, years for SAC and NPNLW, months for PSAC; intake of animal-source food or LV, grams; Hb, g/dl; HFIAS, 1 unit score; assets, 1 unit score. Units (independent variable): serum retinol, µmol/l.
§ Adjusted R 2=15·3, 1·3 and 8·5 % in PSAC, SAC and NPNLW, respectively.
║ Log-transformed for PSAC.
Figure 2 shows an interesting trend of serum retinol by the time since the most recent episode of vitamin A supplementation in PSAC, along with corresponding consumption of animal-source vitamin A and household expenses.
Serum retinol (µg/dl; ![]() ), household expenses (geometric mean, thousands of Bangladeshi Taka (BDT);
), household expenses (geometric mean, thousands of Bangladeshi Taka (BDT); ![]() ) and intake of animal-source vitamin A (geometric mean, retinol activity equivalents (RAE)/d;
) and intake of animal-source vitamin A (geometric mean, retinol activity equivalents (RAE)/d; ![]() ) sorted by time since the last episode of vitamin A supplementation in pre-school age children (PSAC; 6–59 months), Bangladesh, 2011–2012. Figure shows serum retinol levels as a function of time from the last supplementation episode of vitamin A in PSAC, along with concomitant trends in household spending and intake of animal-source vitamin A. Serum retinol remained at similar levels for <3 months and 3–6 months post supplementation groups (26·1 and 26·1 μg/dl, respectively; P=1·0), while the groups had comparable levels of household spending (geometric mean: 7800 v. 8400 BDT, respectively; P=0·56). The trend of serum retinol level tended to be higher in the 6–9 months post supplementation group (27·3 μg/dl), coupled with a sharp rise in household spending and consumption of animal-origin vitamin A (geometric mean: 10 700 BDT and 56·8 μg RAE/d, respectively). In the 9–12 months and >12 months post supplementation groups, serum retinol levels appeared to be waning (25·0 and 23·8 μg/dl, respectively) along with decreasing household spending (geometric mean: 8100 and 5400 BDT, respectively; P<0·001) and declining consumption of animal-source vitamin A (geometric mean: 26·0 and 24·8 μg RAE/d, respectively; P=0·03)
) sorted by time since the last episode of vitamin A supplementation in pre-school age children (PSAC; 6–59 months), Bangladesh, 2011–2012. Figure shows serum retinol levels as a function of time from the last supplementation episode of vitamin A in PSAC, along with concomitant trends in household spending and intake of animal-source vitamin A. Serum retinol remained at similar levels for <3 months and 3–6 months post supplementation groups (26·1 and 26·1 μg/dl, respectively; P=1·0), while the groups had comparable levels of household spending (geometric mean: 7800 v. 8400 BDT, respectively; P=0·56). The trend of serum retinol level tended to be higher in the 6–9 months post supplementation group (27·3 μg/dl), coupled with a sharp rise in household spending and consumption of animal-origin vitamin A (geometric mean: 10 700 BDT and 56·8 μg RAE/d, respectively). In the 9–12 months and >12 months post supplementation groups, serum retinol levels appeared to be waning (25·0 and 23·8 μg/dl, respectively) along with decreasing household spending (geometric mean: 8100 and 5400 BDT, respectively; P<0·001) and declining consumption of animal-source vitamin A (geometric mean: 26·0 and 24·8 μg RAE/d, respectively; P=0·03)

Discussion
National estimates of subclinical vitamin A status remain static over the decades
In Bangladesh, the prevalence of subclinical vitamin A deficiency has not changed over the last 10–15 years. The study by Faruque et al. estimated the prevalence of vitamin A deficiency in rural Bangladeshi children aged 2–6 years as 19·6 %( Reference Faruque, Khan and Malek 30 ).
The 1997 nationally representative survey( 10 ) measured the prevalence of vitamin A deficiency at 21·7 and 5·0 % in PSAC and NPNLW, respectively. The national mean estimate of serum retinol in pre-school children was 0·89 (95 % CI 0·88, 0·91) μmol/l( 10 ), matching exactly with the present national estimate of 0·89 (95 % CI 0·86, 0·92) μmol/l. The reason for stagnation in national estimates over the decades is difficult to understand; perhaps it could be linked with inadequate dietary intake of vitamin A, poor dietary diversity with a minor proportion of vitamin A coming from higher bioavailable animal sources and a high level of consumption of plant-source vitamin A, particularly leafy vegetables (Table 3). Similar dietary profile was reported in the previous national survey, when nearly 80 % of the children did not meet the RDA( 10 ). Moreover, in the present study, the multivariable linear regression showed non-association between the time lag after the most recent episode of vitamin A supplementation and serum levels of retinol in PSAC, over a 1-year period (Table 4). This perhaps can be explained in light of a study which reported that a daily episode of supplementation with 10·5 µmol (10 000 IU) of retinyl palmitate was associated with just a 2 % increment of serum retinol after 3 months( Reference Wald, Cuckle and Barlow 31 ). Ghanaian women who were supplemented with high-dose retinyl ester (210–420 µmol) did not show a change in serum retinol( Reference Tchum, Tanumihardjo and Newton 32 ). The lack of response of serum retinol concentration to vitamin A supplementation is due in part to its homeostatic control over a wide range of liver reserves, i.e. serum retinol level is not affected until the storage of vitamin A has depleted to a critical level. For example, in animal models given three different levels of daily vitamin A supplements, serum retinol concentrations did not change despite a sixfold difference in liver reserves of vitamin A( Reference Tanumihardjo 33 ). This perhaps explains the lack of change in subclinical retinol levels in Bangladeshi children through administration of vitamin A capsules. Underlying this, it may be assumed that vitamin A capsule supplementation in Bangladeshi children over the decades might have worked perhaps just to top up and maintain the base storage of retinol at a steady level, and thus no significant positive change in serum level of retinol or further deterioration in the existing level has occurred at the population level.
Animal-source v. plant-origin foods and subclinical vitamin A status
Multivariable regression showed that dietary intake of animal-source foods was associated with higher serum retinol levels in PSAC and SAC (Table 4). The higher proportion of animal-source vitamin A in young children’s diet perhaps contributed to the positive association (Table 3). This is an important policy message highlighting the importance of consumption of animal-source foods in improving vitamin A status. This is further complemented by the observation that higher amounts of animal-source vitamin A were consumed by increasingly well-off households with concomitant reflection in retinol levels (see online supplementary material, Supplemental Table 4). Leafy vegetables are consumed universally in the traditional diet( Reference Islam, Khan and Akhtaruzzaman 17 , 34 ), being the largest dietary source of vitamin A in the Bangladeshi population (Table 3). Despite a consistent and fair level of intake (43·7, 56·1 and 63·2 g/d, respectively, in PSAC, SAC and NPNLW; data not shown), leafy vegetables were not positively associated with serum retinol; albeit the coefficient was negative but statistically non-significant in PSAC and NPNLW (Table 4). However, in SAC, leafy vegetable intake was linked with lower levels of serum retinol (Table 4). This is perhaps explained in light of the findings of an experimental study( Reference Novotny, Harrison and Pawlosky 35 ) which concluded that plant-origin vitamin A (β-carotenes) is inefficient at bioconversion into active vitamin A (retinol) with increasing levels of consumption. In Bangladesh, the national production of two major varieties of leafy vegetables (spinach, red amaranth) more than doubled between 2007/08 and 2011/12( 36 ). High level of consumption of plant-origin vitamin A, especially leafy vegetables (Table 3), can be intractable or even counterproductive to subclinical vitamin A level, which has hardly shown any changes between 1997 and 2011–2012. We recognize the importance of oil and fat consumption in relation to the absorption of vitamin A. Data from a national survey suggested that consumption of oil was 15·2, 22·0 and 22·7 g/d in PSAC, SAC and NPNLW, respectively( Reference Leyvraz, Laillou and Rahman 37 ). This level of consumption is higher than the minimum 2·4 g of fat per meal required to aid absorption of carotenoids from leafy vegetables( Reference Ribaya-Mercado, Maramag and Tengco 38 ); hence, levels of fat consumption could not be a confounder for lower retinol status in relation to intake of plant-origin vitamin A among our study population.
Serum retinol v. population characteristics, socio-economic status, Hb level and mother’s knowledge of vitamin A issues
Our multivariable regression finding, that age was a positive determinant of serum retinol in the present population (Table 4), was similarly reported in other epidemiological studies( Reference Kjolhede, Stallings and Dibley 39 , Reference Rock, Thornquist and Kristal 40 ). In SAC, female sex being positively associated with serum retinol is difficult to explain because dietary intakes of total and animal-source vitamin A were not statistically different between the sexes (Supplemental Table 5). Therefore, female sex determining a higher level of serum retinol might be a random association, since another study reported being a male child to be associated with higher levels of vitamin A( Reference Tanumihardjo 41 ).
Serum retinol appeared to be sensitive to change in the face of differing socio-economic conditions. This is exemplified in SAC by the observation of a positive relationship of retinol with the household head’s non-agricultural occupation, the latter being associated a higher capacity for household spending (Table 4); as well as in PSAC, where progressively higher level of consumption of animal-source vitamin A, coupled with the household’s increasing capacity for spending, led to higher status of retinol (see online supplementary material, Supplemental Table 4). Similarly, non-possession of a mobile phone, which is indicative of poor SES, was almost associated with lower retinol in NPNLW (Table 4). Hb being positively associated with serum retinol in SAC (Table 4) was complemented by the finding that anaemic SAC had a higher level of vitamin A deficiency with concomitant lower levels of serum retinol than the non-anaemic children (Supplemental Table 5). This was observed possibly as a result of the synergistic association between retinol and Hb which is reported in many other epidemiological studies( Reference Jafari, Heidari and Nabipour 42 , Reference Sheila, Alcides da Silva and Mayara 43 ). SAC whose mothers lacked knowledge about dietary sources of vitamin A were more likely to have lower serum retinol values (Table 4). In households with ‘knowledgeable’ mothers, despite being financially better off (Supplemental Table 5), knowledge was perhaps independently linked with better vitamin A consumption by their children and therefore was associated with higher retinol level, since the interaction of (household expenses×mother’s knowledge) to determine retinol level was statistically non-significant (P=0·6; data not shown).
Trends of serum retinol, intake of animal-source foods and household expenses v. vitamin A supplementation
The fact that the first quarter since the last episode of vitamin A supplementation in PSAC was not associated with higher retinol status compared with subsequent three quarters (Table 4) is complemented by Fig. 2, which showed that the trend of mean retinol levels appeared relatively flat over the four quarters. The lack of association of serum retinol with vitamin A supplementation is in agreement with a contemporary study by Palmer et al., which showed only a weak and transient influence of supplementation on serum retinol lasting for <2 months( Reference Palmer, West and Dalmiya 44 ).
Figure 2 further showed that the trend of serum retinol in young children at population level appeared to follow the trends of consumption of animal-origin vitamin A and household expenses; and the effect of vitamin A supplementation on serum retinol was apparently not observed. The >12 months post supplementation group had the lowest amount of household spending, the lowest intake of animal-source vitamin A (Fig. 2) and was experiencing household food insecurity at a higher level (64 % v. national prevalence of 45 %; data not shown). Concomitantly, this group was associated with the risk of having lower retinol status when compared with the <3 months post supplementation group (Table 4). This section in the population remained out of the supplementation coverage for >1 year. The group perhaps might represent underprivileged or hard-to-reach sections of the population, failing to avail of vitamin A supplementation services regularly( 45 ). Interestingly, the group with the highest household expenses and animal-source vitamin A consumption (i.e. the 6–9 months post supplementation group) also remained out of the most recent supplementation coverage. Further research is needed to elucidate why that occurred.
Does vitamin A supplementation need to continue in pre-school children?
There is a growing debate on continuation of vitamin A supplementation for children( Reference Bhutta and Baker 46 , Reference West, Sommer and Palmer 47 ) v. scaling down the supplementation( Reference Greiner, Shrimpton and Sanders 48 ), on the premise that mortality due to measles and diarrhoea have been reduced globally and that the original justification for vitamin A supplementation does not remain valid. However, from the Bangladesh perspective, the supplementation should continue until the evidence for an alternative strategy or a changing context suggests otherwise. There are several factors behind this. First, visual disturbance due to vitamin A deficiency (i.e. night blindness) decreased dramatically 27-fold (from 1·1 to 0·04 %) in just 8 years concurrent to inception of the supplementation programme in the form of the National Immunization Day in 1995, providing a massive surge of coverage to 80–90 % from 44 %( Reference Jamil, Rahman and Bardhan 9 , 49 ). In a nationwide programme setup it plausibly explains that reduction of the visual morbidity might be attributed to supplementation. Second, the prevalence of diarrhoea has been decreasing significantly over the decades, with the current estimate standing at a low of 5·7 %( 50 ) despite the fact that the population-level habit of good hygiene practice has not improved much as exemplified by the recent National Hygiene Baseline Survey 2014, which showed that only 13 % of young children (3–5 years old) use soap for hand-washing( 51 ). From these observations it is apparent that vitamin A supplementation for decades could be one of the contributory factors behind the decreasing morbidity associated with diarrhoea. Third, concurrent to a successful vitamin A supplementation programme, a steady state of serum vitamin A status in children is being maintained over the decades; if not improving. Fourth, presently dietary sources of vitamin A are heavily dominated by plant-origin vitamin A, especially leafy vegetables in which vitamin A is poorly bioavailable, and has a negative association with retinol status (Tables 3 and 4). Fifth, Bangladesh has initiated a national fortification programme of edible oil with vitamin A; however, it is in its early days and the coverage and evaluation data are not available. Finally, a natural foods-based strategy is the ultimate intervention to address the vitamin A problem. However, improving vitamin A nutrition through foods requires qualitative change in the diet with the consumption of more animal-source foods, which is conditional on the country’s capacity to produce, procure and distribute equitably such foods for a huge population and on people’s affordability to purchase them; therefore needing considerable time for its realization.
Multiple vitamin A intervention strategies v. excess intake of vitamin A
It is important to recognize the vitamin A intervention strategies for Bangladesh: supplementation for young children, oil fortification and improving diet quality through promotion of animal-source foods. With these interventions recommended, the issue of excess intake of vitamin A has a place for discussion. The recent study from the national micronutrient survey 2011–2012 modelled that if fortification of all probable food items combined is considered in Bangladesh, along with dietary sources, intake of vitamin A would reach the tolerable upper level only for PSAC, while it would remain much below this level in the case of SAC and NPNLW( Reference Leyvraz, Laillou and Rahman 37 ). In relation to supplementation in children, the present study did not observe a significant influence of supplementation on serum vitamin A status, which complements the study by Palmer et al.( Reference Palmer, West and Dalmiya 44 ). It is unlikely that all the interventions would be operational at a peak level at the same time. Presently the supplementation for young children needs to be continued along with efforts to scale up the national oil fortification programme. Promotion and availability of adequate amounts of animal-source foods for all is a long-term prospect. Apart from that, the new national micronutrient deficiency control strategy( 52 ) has a strong monitoring and evaluation component which is committed to evaluate vitamin A status and consumption and would suggest adjustment of the interventions over time. Taking into account the above issues, we do not envisage that there would be concerns of excess intake despite multiple strategies being suggested in the present paper.
Limitations
The current study has the limitation that, being an ecological study, it cannot establish the cause-and-effect relationship for serum retinol status. The semi-quantitative FFQ has been validated in other settings and reported to be adequately valid against standard dietary assessment tools( Reference Cheng, Yan and Dibley 53 – Reference Buch-Andersen, Pérez-Cueto and Toft 55 ). However, it is not validated for Bangladeshi foods; hence constitutes a limitation of the study. Although we considered commonly consumed vitamin A-rich foods including a good number of leafy vegetables, nevertheless some vitamin A-containing foods could be missed out which the respondents might have consumed, but our semi-quantitative FFQ did not capture. At the time of the survey, although consumption of fortified foods was uncommon in Bangladesh, the young children could have had access to imported fortified milk. That the study did not collect data on the consumption of vitamin A-fortified milk is another limitation.
Conclusion
In conclusion, the national prevalence of subclinical vitamin A deficiency is high in children in Bangladesh and has remained static over the decades. The underlying issue for the stagnation in subclinical vitamin A status is difficult to understand; however, a minor proportion of vitamin A coming from animal-source foods and the major proportion of plant-origin vitamin A, especially high consumption of leafy vegetables, might play a role.
Among the factors positively linked with vitamin A nutrition are consumption of animal-source foods, non-agricultural profession of the household head, higher level of Hb and living in an urban area. The issues associated with lower status of vitamin A are consumption of leafy vegetables and caregiver’s lack of knowledge on matters related to vitamin A. The vitamin A supplementation programme for the young children has been operational for decades; however, subclinical vitamin A status has neither improved nor deteriorated. Currently, vitamin A supplementation for children needs to be continued along with scaling up of vitamin A fortification through edible oil. In the long run, increased dietary diversity through adequate consumption of animal-source foods, which is connected with good status of vitamin A, may advance vitamin A nutrition in the Bangladeshi population in a sustainable manner.
Acknowledgements
Acknowledgements: The study acknowledges the support of UNICEF Bangladesh. The authors thank the national technical committee for guidance on the study design, data collection and data analysis; as well as the local government officials, field-level staff members of the Institute of Public Health Nutrition, Government of the People’s Republic of Bangladesh, and the survey participants from all over Bangladesh. Financial support: This work was supported by UNICEF Bangladesh (grant numbers SC/2008/0475 and GC/2005/6012-01). UNICEF Bangladesh was involved in the conceptualization and designing of the study and review of the manuscript, but had no role in data collection, data analysis, data interpretation and manuscript writing. Conflict of interest: None. Authorship: S.R., T.A., A.S.R., N.A., I.A.C. and A.M.S.A. conceived and designed the study. S.R., T.A., F.P.C. and S.M.M.R. acquired the data. S.R. and N.A. analysed the data. S.R., A.S.R. and N.A. interpreted the data. S.R. drafted the manuscript. S.I., A.S.R., N.A., T.A., S.M.M.R. and I.A.C. contributed to redrafting and finalizing the manuscript. S.R. has full access to all data in the study and had final responsibility for the decision to submit for publication. All authors read and approved the final manuscript. Ethics of human subject participation: The study was approved by the Institutional Review Board at icddr,b. Written informed consent was obtained from the study participants prior to data collection.
Supplementary material
To view supplementary material for this article, please visit https://doi.org/10.1017/S1368980016003049


