


Introduction
By the middle of the 20th century, truck driving had evolved into one of the highest paying blue-collar jobs in the United States (US). Since then, deregulation and de-unionisation have resulted in a dramatic reduction in driver compensation and working conditions (Belzer, Reference Belzer2000). Today, trucking is infamous in the US for low-pay and dangerous work, as it is in much of the world.
According to the National Institute of Occupational Safety and Health (NIOSH) National Survey of Long-Haul Truck Driver Health and Injury (LHTDS), the median long-haul employee driver earned 2012USD 50,000 and worked 62 hours per week (Kudo and Belzer, Reference Kudo and Belzer2019b). Since most drivers are not covered by the mandatory overtime protections of the Fair Labor Standards Act (FLSA), they typically are paid on a straight time piecework basis. Thus, at 52 weeks per year and 62 hours per week, drivers have an average hourly wage of approximately 2018USD 16.96. However, the same earnings could be achieved by similarly situated US workers at 2018USD 14.40 if drivers were paid time-and-one-half after 40 hours, as other production workers are paid. This is less than the local minimum wage in some parts of the country, and it is noticeably lower than the average wages in many occupations for which truck drivers often leave trucking (Burks and Monaco, Reference Burks and Monaco2019).
Trucking is routinely ranked among the most dangerous civilian occupations in the US (Bieber, Reference Bieber2023; Fraser, Reference Fraser2023; Toscano, Reference Toscano1997). The biggest acute threat truck drivers face is crashes. Of course, the public has a stake too. After all, non-truck motorists and non-motorist road and byway users typically bear the brunt of the damage in collisions with heavy trucks. To illustrate, according to the Federal Motor Carrier Safety Administration (2021a) and the Census of Fatal Occupational Injuries (2018), in 2018, large truck crashes claimed the lives of approximately 800 truck drivers and 4,800 other people – mostly road users.
Given the stakes, motor carrier safety is an important issue for policy makers, researchers, and the general public. However, at least in the US, contemporary motor carrier safety discourse remains fixated on downstream human factors and technology issues. While these are certainly important, we think their exclusive emphasis overlooks an important root cause of safety behaviour – industrial organisation and compensation.
Between long hours, occupational safety hazards (Chen et al Reference Chen, Sieber, Lincoln, Birdsey, Hitchcock, Nakata, Robinson, Collins and Sweeney2015), high health costs (Birdsey et al Reference Birdsey, Sieber, Chen, Hitchcock, Lincoln, Nakata, Robinson and Sweeney2015; Sieber et al Reference Sieber, Robinson, Birdsey, Chen, Hitchcock, Lincoln, Nakata and Sweeney2014), and low pay, trucking is becoming an occupation of last resort for many individuals (Belzer, Reference Belzer2000; Viscelli, Reference Viscelli2016). This is not safe.
In order to entice the best drivers to enter the industry, commercial driving needs to be an attractive occupation and, naturally, compensation is an important part of this. In fact, the United Nations International Labour Organization (ILO) has recently incorporated driver pay into its guidelines on the promotion of safe and decent work in road transport (International Labour Organization, 2020). According to the ILO, driver compensation should take into consideration the attractiveness and sustainability of the industry (International Labour Organization, 2020).
In this spirit, we explore the relationship between truck drivers’ relative pay and intrastate motor carrier crash incidence in the US. We find that, all else constant, carriers located in areas where driver earnings are high, compared to local median household incomes, tend to experience fewer crashes. This suggests that safety does in fact improve as truck driving becomes more attractive. While this study exclusively focuses on US motor carriers, as we will discuss in the literature review, similar concerns have been raised in other countries and, thus, we believe that these findings are also relevant to the broader debate on the relationship between pay rates and commercial driver safety.
Literature review
Administrative deregulation of US interstate trucking began in the late 1970s and was ultimately codified by the Motor Carrier Act of 1980 (Belzer, Reference Belzer2000). In 1994, the Federal Aviation Administration Authorization Act forbade states from enacting/enforcing laws related to the price, route, or service of any motor carrier (see England, Reference England2010). This extended deregulation to intrastate carriage. Deregulation, and de-unionisation, ultimately led to a dramatic reduction in truck driver pay and working conditions (Belman and Monaco, Reference Belman and Monaco2001; Belzer, Reference Belzer1995; Belzer, Reference Belzer2000; Belzer, Reference Belzer, Stanger, Clark and Delaney2024). At the time, this was interpreted as the effect of increased competition eroding drivers’ monopoly rents. However, empirical research suggests that the majority of earnings premia may actually have been returns to unobservable and desirable, labour characteristics – like skill and experience (Hirsch et al Reference Hirsch, Macpherson, Alexis and Peoples1998). Today, the industry is known for having persistent recruitment and retention issues and, unsurprisingly, pay is often cited as a contributing factor (Costello, Reference Costello2017, Reference Costello2021; Costello and Karickhoff, Reference Costello and Karickhoff2019). To the extent that compensation is related to safety performance and that safety costs are externalised, this has the potential to be both dangerous and inefficient.
Among other things, modelling crash costs requires data on the number of occupants involved in crashes, the details of each person’s injuries, the costs of those injuries, the number of fatalities, the cost of fatalities, the cost of property damage, and the cost of travel delays. To our knowledge, there is no persistent single database that actively records this information. However, the US Department of Transportation (DOT) Federal Motor Carrier Safety Administration (FMCSA), and National Highway Traffic Safety Administration’s (NHTSA) Large Truck Crash Causation Study did collect detailed crash data for a nationally representative sample of injury and fatal truck crashes that occurred in the US between April 2001 and December 2003 (Federal Motor Carrier Safety Administration, 2014). Unfortunately, data allowing researchers to assess the role of compensation were not collected, so only the role of work pressure could be assessed (Belzer, Reference Belzer2009; Belzer, Reference Belzer2018). Zaloshnja and Miller (Reference Zaloshnja and Miller2007) used these data to estimate the costs of crashes involving medium and heavy trucks. They found that crashes involving straight trucks had an average cost of approximately 2005USD 56,000, non-fatal injury crashes had an average cost of approximately 2005USD 195,000, and fatal crashes had an average cost of approximately 2005USD 3.6 million. In terms of 2023 USD, an average straight-truck crash costs more than USD 87,000, an average non-fatal injury crash costs more than USD 304,000, and an average fatal crash costs more than USD 5.6 million. These estimates exclude mental health care costs for crash victims, roadside furniture repair costs, cargo delays, the value of lost schoolwork, and the earnings lost by the family and friends who had to care for the injured (Zaloshnja and Miller, Reference Zaloshnja and Miller2007). Furthermore, simple inflation adjustments do not take into consideration changes in the value of a statistical life – which rose from roughly USD 6 million in 2005 to more than USD 12.5 million in 2023 (Federal Motor Carrier Safety Administration, 2016; 2021b), simply due to the effects of growth and inflation. Consequently, these figures are very conservative. Even so, the average fatal truck crash cost appears to be orders of magnitude higher than the minimum liability requirements. Thus, there is reason to believe that some of the cost of fatal crashes is externalised.
Australian research and public policy began building the foundation for studying the economic determinants of motor carrier safety. In 1989, the Transport Research Centre at Macquarie University in Sydney was awarded a grant from Australia’s Federal Office of Road Safety to fund a pilot study of the determinants of long distance truck drivers’ road-behaviour (Hensher and Battellino, Reference Hensher and Battellino1990; Hensher et al Reference Hensher, Battellino and Young1989). The primary objective of the pilot study was to collect information in order to help identify/clarify research questions for a subsequent larger study (i.e., the ‘main study’). The results of this exercise suggested that the underlying economic conditions in the trucking industry were an important determinant of driver behaviour and safety performance (Hensher et al Reference Hensher, Battellino and Young1989). The main study, which involved in-depth surveys of more than 800 Australian truck drivers, largely confirmed this suspicion (see Hensher et al Reference Hensher, Battellino and Daniels1991). To paraphrase, analysis of the main survey data suggested that economic incentives, particularly freight rates and work pressure, had a significant influence on the road behaviour of drivers and that any deviation from a fixed salary encouraged practices that were ‘not synergetic’ with safety (Hensher et al Reference Hensher, Battellino and Daniels1991; Hensher et al Reference Hensher, Daniels and Battellino1992).
Around the same time, the US Congress put a similar set of questions to the General Accounting Office (GAO) (General Accounting Office – U.S. Congress, 1991). The GAO formulated a model that linked changes in economic conditions to declining motor carrier safety performance through lower average driver quality, wage pressure discouraging driver compliance with safety regulations, less managerial emphasis on safety practices, deferred truck maintenance, and the introduction of larger/multi-trailer trucks. In general, the data seemed to agree with the GAO’s model and, indeed, firms in the weakest financial position were found to have the highest accident rates (General Accounting Office – U.S. Congress, 1991). However, the Department of Transportation (DOT) ultimately rejected these findings and, consequently, research in the US stalled.
Things picked up again in 1998, when the Office of Motor Carriers of the Federal Highway Administration funded the first major US-based large-scale research on the relationship between truck driver compensation and safety. The project’s report was the first to establish a general connection between compensation and truck safety outcomes in the US (Belzer et al Reference Belzer, Rodriguez and Sedo2002). Since then, this relationship has been replicated multiple times and in multiple countries.
Monaco and Williams (Reference Monaco and Williams2000) performed a probit analysis of the University of Michigan Trucking Industry Program’s (UMTIP) driver survey data (Belman et al Reference Belman, Monaco and Brooks2004). They found that occupational characteristics were better predictors of safety performance than demographic characteristics, that hourly pay itself was associated with better safety performance, and that higher pay was associated with a lower probability of experiencing both logbook violations and crashes. Around the same time, Quinlan led an important inquiry into the causes of interstate truck safety problems in Australia. Among other things, he concluded that the externalisation of safety costs acted as an implicit subsidy for freight rates, that extreme competition in the presence of externalised safety costs contributes to an environment in which failure to abide by safety standards can deliver an economic advantage, and that this amplifies the capacity for performance based payment systems to encourage unsafe behaviour (Quinlan, Reference Quinlan2001; Quinlan and Wright, Reference Quinlan and Wright2008). More recently, using data from the 2012 NIOSH LHTDS, Kudo and Belzer (Reference Kudo and Belzer2019a) found evidence that better pay is associated with fewer violations and, using data from the National Transportation Institute’s 2018 National Survey of Driver Wages, Ryley and Belzer (Reference Ryley and Belzer2023) linked various types of compensation to crash incidence. Finally, Ju and Belzer (Reference Ju and Belzer2024) showed that, all else constant, intrastate carriers located in states with higher truck driver median hourly wages tend to be associated with fewer crashes.
The safe rates movement
In 2012, the Australian Parliament passed the first comprehensive national ‘safe rates’ law in the world: the Road Safety Remuneration Act (RSRA).Footnote 1 The origins of the RSRA can be traced back to Quinlan’s work in the early 2000s, as well as the US DOT OMC/FMCSA research that corroborated Quinlan’s report. Quinlan’s inquiry found that there was a crisis in Australian road transport safety, that the situation was due in large part to driver remuneration, and that regulation was necessary to deal with it (Quinlan, Reference Quinlan2001; Quinlan and Wright, Reference Quinlan and Wright2008).
The main thrust of the RSRA involved the creation of the Road Safety Remuneration Tribunal (RSRT). The RSRT’s primary responsibility was to ensure safe payments for road transportation services. However, the Labour government that had championed the initiative lost the 2013 national election and the new National-Liberal Coalition government quickly set its sights on dismantling the law. To do this, it hired consultants to pick apart the RSRA (Deighton-Smith, Reference Deighton-Smith2014) and then used their criticisms as ammunition to repeal the Act in 2016 (Belzer, Reference Belzer2016; Rawling et al Reference Rawling, Johnstone and Nossar2017). As a result, insolvency has become more frequent in Australian road transport and more people have died in collisions with heavy trucks (Rawling, Reference Rawling2019).
Despite setbacks in Australia, the safe rates movement made its way to the international stage. In 2015, the ILO Tripartite Sectoral Meeting on Safety and Health in the Road Transport Sector recommended that the International Labour Office ‘convene … a … meeting of experts to elaborate and adopt a code of practice or guidelines on best practices in road transport safety’ (International Labour Organization, 2020). The Governing Body of the ILO accepted this invitation, which ultimately led to the tripartite negotiation of Guidelines on the promotion of decent work and road safety in the transport sector (International Labour Organization, 2020). Guidelines 73–82 address safe payments. Specifically, guideline 73 states that ‘the remuneration of wage earning and non-wage-earning commercial motor vehicle (CMV) drivers should be sustainable and take into consideration the goals of increasing the attractiveness and sustainability of the industry’; guideline 81 recommends that ‘the calculation of rates for wage-earning CMV divers should also take into account remuneration for time spent on reasonably required subsidiary non-driving work activities’; and guideline 46 recommends that ‘governments should identify and implement measures to better collect, disaggregate and disseminate data on CMV drivers’ (International Labour Organization, 2020).
The first major effort to implement the emerging ILO agreement was the 2018 amendment to the South Korean Trucking Transport Business Act (TTBA), which introduced a system for establishing safe rates for some truck drivers.Footnote 2 While the protections afforded by these amendments were expansive, the law only covered two narrow sectors of the South Korean trucking industry: import/export container transport (intermodal freight) and bulk cement. This only accounted for approximately 6% of all commercial freight motor vehicles in the country (Belzer, Reference Belzer2022). Furthermore, the amendments were introduced for a time-limited period of 3 years and set to expire on 31 December 2022. The Korean Public Service and Transport Workers’ Union Cargo Truckers’ Solidarity Division (KPTU-TruckSol) set a goal to make the system permanent and expand its coverage. However, a newly elected conservative government blocked passage of new amendments that would have done this, and the system expired at the end of 2022 when an automatic ‘sunset’ clause suspended the safe rates provisions. At the time of this writing, a new bill that would broadly meet KPTU-TruckSol’s goals has been proposed by Democratic Party lawmakers, so the issues remain unresolved.
Experiences during the COVID-19 pandemic put a spotlight on US supply chain infrastructure, particularly the trucking segment. In response, President Biden, through Executive Order 14017, requested that the DOT assess the reliability of the US transportation and logistics industrial base. Among other things, the DOT cited a need for improving the quality of existing truck driving jobs and, as part of this, recommended that Congress eliminate the interstate truck driver exemption from the overtime protections enumerated in the FLSA (U.S. Department of Transportation, 2022). In the spirit of this, Congressman Andy Levin (D-Mich.-09), Senator Edward J. Markey (D-Mass), and Senator Alex Padilla (D-Calif.) introduced legislation guaranteeing overtime protections for truckers.Footnote 3
Bringing drivers under the protection of the FLSA would require carriers to pay a 50% wage premium for time exceeding 40 working hours per week, require carriers to use the Department of Labor’s (DOL) definition of work, and, generally speaking, would be a major first step towards safe rates in the US. It would also require trucking companies to record drivers’ hours of work because of the need to determine which working hours are paid at straight time and which hours are paid at the premium rate. The US DOL and DOT define work differently. Specifically, the DOL specifies that employers must pay workers for all time during which employers ‘suffer or permit’ employees to work. This includes waiting (see US CFR 785 Subpart C), loading, unloading, repairing, and even break times beyond the FLSA standard. The DOT, on the other hand, defines work as time drivers are responsible for their freight or passengers. Thus, if carriers claim that drivers are not responsible for the load while waiting, loading, or unloading, they can decline to pay for the time – even though, under the DOL’s standards, they would still be considered at work (Belzer, Reference Belzer, Stanger, Clark and Delaney2024, pp. 164–165). However, at the time of writing, none of the bills have moved towards passage.
Data
This research integrates three different US data sources, the FMCSA’s Motor Carrier Management Information System (MCMIS), the Bureau of Labor Statistics (BLS) Occupational Employment and Wage Statistics (OEWS), and the Census Bureau’s American Community Survey (ACS). These are all publicly available and a brief description of each dataset is provided below.
MCMIS
MCMIS houses the FMCSA’s safety performance relational database for passenger, non-passenger, and hazmat carriers. Much of these data are public facing and available at the FMCSA’s website. Specifically, we use data from the census files, crash files, and Safety Measurement System (SMS) summary reports for January of 2021 through January of 2023.
Among other things, the census files contain carrier names, operating addresses, operation classifications, hazmat statuses, power unit counts, and driver counts for all carriers under the FMCSA’s jurisdiction, filed on the Form MCS-150. All new interstate carriers must submit Form MCS-150 in order to acquire a DOT number and register with the FMCSA. Most states also require heavy-duty intrastate carriers to do this as well.Footnote 4 All filing carriers must update form MCS-150 within 30 days of any demographic changes and, regardless of changes, FMCSA rules require all carriers to update their filings every 24 months.
DOT numbers are unique carrier identification codes assigned by the FMCSA to companies that operate vehicles transporting passengers or freight commercially. They are nontransferable, assigned to only one person or legal entity, and function as a primary key for the rest of the MCMIS database. For purposes of this discussion, we use them to aggregate individual crash reports to the carrier level.
Under the Motor Carrier Safety Assistance Program, the FMCSA collects CMV inspection and crash reports from federal and state enforcement personnel. A reportable crash is any crash where a vehicle is towed away, somebody is injured and treated away from the scene, or somebody is killed – regardless of fault.
OEWS
MCMIS does not contain any compensation data, so we supplement with data from the US BLS’s OEWS. The OEWS contains annual employment and wage estimates for roughly 800 occupations. These data are based on semi-annual establishment surveys, the responses from which are used to impute wage and staffing information for unobserved and unresponsive establishments.
The BLS makes aggregations of these estimates publicly available starting at the ‘core-based statistical area’ (CBSA) level, which includes metropolitan statistical areas (MSAs) and non-metropolitan areas.Footnote 5 Establishments are grouped based on the North American Industry Classification System (NAICS), and occupations are categorised by the ACS Occupational Classification System codes (OCC). For this analysis, we use the May 2022 CBSA ‘Heavy and Tractor-Trailer Truck Driver’ (OCC 52-3032) median annual earnings estimates (see Figure 1). At the time of writing, these are the most recent and most granular data available.
2022 OEWS heavy and tractor trailer truck driver annual median incomes by CBSA. Notes: Data represent OEWS estimates of heavy and tractor trailer truck driver median annual incomes by CBSA for 2022. Grey areas indicate missing data.

ACS
The ACS is an annual survey conducted by the US Census Bureau. The survey is sent to approximately 300,000 addresses a month. As with the OEWS, responses are used to estimate unobserved values. The Census Bureau makes yearly aggregations of these estimates publicly available online. For purposes of this discussion, we are interested in the 2022 county level median household income estimates (see Figure 2).Footnote 6
2022 ACS median household income estimates by county. Notes: Data represent county level 2022 ACS median household income estimates. Grey areas indicate missing data.

Sampling
We consider all non-hazmat non-passenger intrastate carriers from the contiguous US, with more than one power unit, more than one driver, more than one vehicle mile travelled (VMT), and with mileage update years between 2017 and 2023. This leaves a sample of approximately 100,000 carriers and excludes single owner-operators and non-asset-based carriers and brokers.
We focus on intrastate carriers because they tend to have smaller hiring catchment areas and their VMT are restricted to their domicile states. This makes it easier to control for state effects (Gimpel, Reference Gimpel2012; Weber and Murray, Reference Weber and Murray2014) and better accommodates regional income measurement. Furthermore, most of the literature already focuses on interstate carriage and, relatively speaking, the intrastate space has received less attention.
We use the Census Bureau’s ‘TIGER files’ to map carriers’ addresses to their respective counties, which can then be linked to CBSAs and, by extension, OEWS earnings data for heavy and tractor-trailer truck drivers.Footnote 7 Altogether, we were able to place roughly 88,000 carriers using the raw address data contained in the January 2023 MCMIS Census File and the data filters described above. See Table 1 for a map of sample coverage and descriptive statistics.
Geographic representation and other sample descriptive statistics (N = 87,802)

Notes: Data are taken from the January 2023 MCMIS files (summary report, crash, and census files), May 2022 OEWS estimates, and 2022 ACS estimates. Note, carrier counts are in log scale. Thus, white counties represent counties in which there is only a single carrier, and grey counties reflect counties in which there are no carriers.
Empirical model
We hypothesise that crashes are a function of exposure, regulatory environment, economic activity, climate, geography, operational classification, compliance behaviour, and pay. The primary objective of this study is to investigate the relationship between relative pay and safety. Everything else is included as a control.
In equation form, we have:

The variable $C$
refers to the total number of DOT reportable crashes carriers experienced from January of 2021 through January of 2023. The vector
$C$
refers to the total number of DOT reportable crashes carriers experienced from January of 2021 through January of 2023. The vector ${X_{State}}$
refers to a set of domicile state indicator variables. The variable
${X_{State}}$
refers to a set of domicile state indicator variables. The variable ${X_{VMT}}$
refers to carrier VMT and the vector
${X_{VMT}}$
refers to carrier VMT and the vector ${X_{VMT\;Year}}$
contains a set of indicators identifying carriers’ MCS-150 mileage update years. The variable
${X_{VMT\;Year}}$
contains a set of indicators identifying carriers’ MCS-150 mileage update years. The variable ${X_{PU}}$
refers to the total number of power units in each carrier’s fleet and, similarly,
${X_{PU}}$
refers to the total number of power units in each carrier’s fleet and, similarly, ${X_D}$
is a driver count. The variable
${X_D}$
is a driver count. The variable ${X_{HOS}}$
contains carriers’ hours of service compliance scores;
${X_{HOS}}$
contains carriers’ hours of service compliance scores; ${X_{DF}}$
contains carriers’ driver fitness compliance scores;
${X_{DF}}$
contains carriers’ driver fitness compliance scores; ${X_{CSA}}$
contains carriers’ controlled-substance compliance scores;
${X_{CSA}}$
contains carriers’ controlled-substance compliance scores; ${X_{USD}}$
contains carriers’ unsafe driving compliance scores; and
${X_{USD}}$
contains carriers’ unsafe driving compliance scores; and ${X_{VM}}$
contains carriers’ vehicle maintenance compliance scores. Finally,
${X_{VM}}$
contains carriers’ vehicle maintenance compliance scores. Finally, ${X_{IR}}$
represents the ratio of 2022 median heavy and tractor-trailer truck driver earnings to 2022 median household incomes discussed above. This is our primary variable of interest.
${X_{IR}}$
represents the ratio of 2022 median heavy and tractor-trailer truck driver earnings to 2022 median household incomes discussed above. This is our primary variable of interest.
Firm size and exposure
Larger firms tend to receive more applicants, pay higher wages, and spend more on recruiting (Manning, Reference Manning2011; Oyer and Schaefer, Reference Oyer and Schaefer2010). Size also provides access to deeper financial, human, and physical capital resources that can make safety investment and compliance easier. These characteristics should translate into better safety performance, which has been demonstrated in the motor carrier safety literature (Cantor et al Reference Cantor, Corsi, Grimm and Singh2016). However, due to greater exposure, large carriers typically experience more crashes.
The term ‘power unit’ refers to either a straight truck or the tractor portion of a tractor-trailer combination. These are the primary capital investments for many carriers, and power unit counts are included to control for firm size. Similarly, drivers generally are the primary labour investment for motor carriers. Consequently, driver counts are also included to further control for size and, in conjunction with power unit counts, the presence of team driving.Footnote 8 While the correlation between power unit counts and driver counts typically is very high, given the sample size and the fact these variables are merely included as controls, multicollinearity is not a concern.
Activity
There is reason to believe that some carriers are not active or, at the very least, their census data are not current (Panel on the Review of the Compliance Safety and Accountability (CSA) Program of the Federal Motor Carrier Safety Administration, 2017). Unfortunately, official operational status is not available in the public MCMIS files. Thus, as outlined above, we have imposed several filters to arrive at the roughly 88,000 carriers in sample. In addition, we have included a set of indicator variables controlling for each carrier’s Form MCS-150 VMT update years. All else constant, carriers with more recent VMT reports on file should have a higher probability of being active and, by extension, increased crash exposure. Yearly indicators should also help tune the exposure variables, as this information ultimately comes from Form MCS-150 filings too, and, to the extent that update years are correlated with any lingering operational status issues, help to combat zero-inflation as well.
State effects
The regression sample consists entirely of intrastate carriers and, thus each carrier’s commercial activity lies within their respective domicile states. Differences in state regulations, locations of inspection stations, their hours of operation, and overall political climate can lead to structural differences in enforcement patterns (Gimpel, Reference Gimpel2012; Weber and Murray, Reference Weber and Murray2014). Empirical evidence also suggests that crash reporting rates are systematically different between states (Blower and Matteson, Reference Blower and Matteson2012a, Reference Blower and Matteson2012b, Reference Blower and Matteson2013). Furthermore, states can have different weather, size, levels of economic activity, and terrain, all of which can influence crash rates. To control for this, we include a set of domicile state indicator variables.
Compliance and supervision
The Federal Motor Carrier Safety Regulations (FMCRs) largely establish the safety standards for commercial carriage in the US. Title 49, parts 382, 383, 391, 392, 393, 395, 396, and 397 of the US Code of Federal Regulations (CFR), along with a handful of Hazardous Materials Regulations, make up the bulk of the road safety laws. Roughly 900 different violations apply to these sections. They are divided into six Behavior (sic) Analysis and Safety Improvement Categories (BASICs):Footnote 9 Unsafe Driving (Title 49 CFR 392 and 397), Hours of Service Compliance (Title 49 CFR 392 and 395), Vehicle Maintenance (Title 49 CFR 392, 393, and 396), Controlled Substances/Alcohol (Title 49 CFR 382 and 392), Hazardous Materials Compliance (Title 49 CFR 397 and 49 HMR 171–173 and 177–180), and Driver Fitness (Title 49 CFR 383 and 391). The FMCSA assigns safety performance measurements to motor carriers in each BASIC. These are commonly referred to as ‘BASIC scores’. Unsafe driving, hours of service compliance, controlled substances, and driver fitness are commonly referred to as the ‘driver BASICs’, as they contain violations that are largely discovered during driver inspections (Federal Motor Carrier Safety Administration, 2021c).Footnote 10
Carriers ranking low enough in any BASIC receive more scrutiny from FMCSA (Federal Motor Carrier Safety Administration, 2012, 2021c). Thus, as carriers incur violations, they may feel more pressure to drive safely. Furthermore, BASIC scores, presumably, reveal carrier safety culture and, by extension, should be systematically related to both crash incidence and pay – particularly the driver BASICs. Consequently, excluding them from the model would court omitted variable bias.
Private carriage
Private carriers haul their company’s materials to facilitate its broader operation. Whether carriers operate privately or on a for-hire basis can systematically affect driver responsibilities, route structures, cargo, vehicle type, regulatory exemptions, and compensation (Belzer et al Reference Belzer, Rodriguez and Sedo2002; Burks et al Reference Burks, Monaco and Myers-Kuykindall2004). To control for this, we include a private carriage indicator variable.
Earnings
Compensating labour at or above the market rate (i.e., at an ‘efficiency wage’) reinforces employees’ opportunity cost of losing their jobs and the external level of attraction to their position (Yellen, Reference Yellen1984). Presumably, this should lead to increased productivity, retention, and provide access to a better labour pool from which to hire (Cappelli and Chauvin, Reference Cappelli and Chauvin1991; Holzer, Reference Holzer1990). Thus, to the extent that safety performance is important to managers and safety factors are endogenous to labour characteristics, it follows that more attractive wages should be associated with better safety performance and vice versa.
To index the ‘attractiveness’ of wages, we divide heavy and tractor-trailer truck driver median income estimates by carriers’ domicile county median household income estimates. This is our primary variable of interest. See Figure 3 for a map of heavy and tractor-trailer truck driver income ratios. Although counties are small in the eastern portion of the US, this map shows substantial variation in this ratio across CBSAs.
Heavy and tractor trailer truck driver income ratio estimate. Notes: Data represent ratio of 2022 OEWS heavy and tractor trailer truck driver annual median income estimates to 2022 ACS median household income estimates. Grey areas indicate missing data.
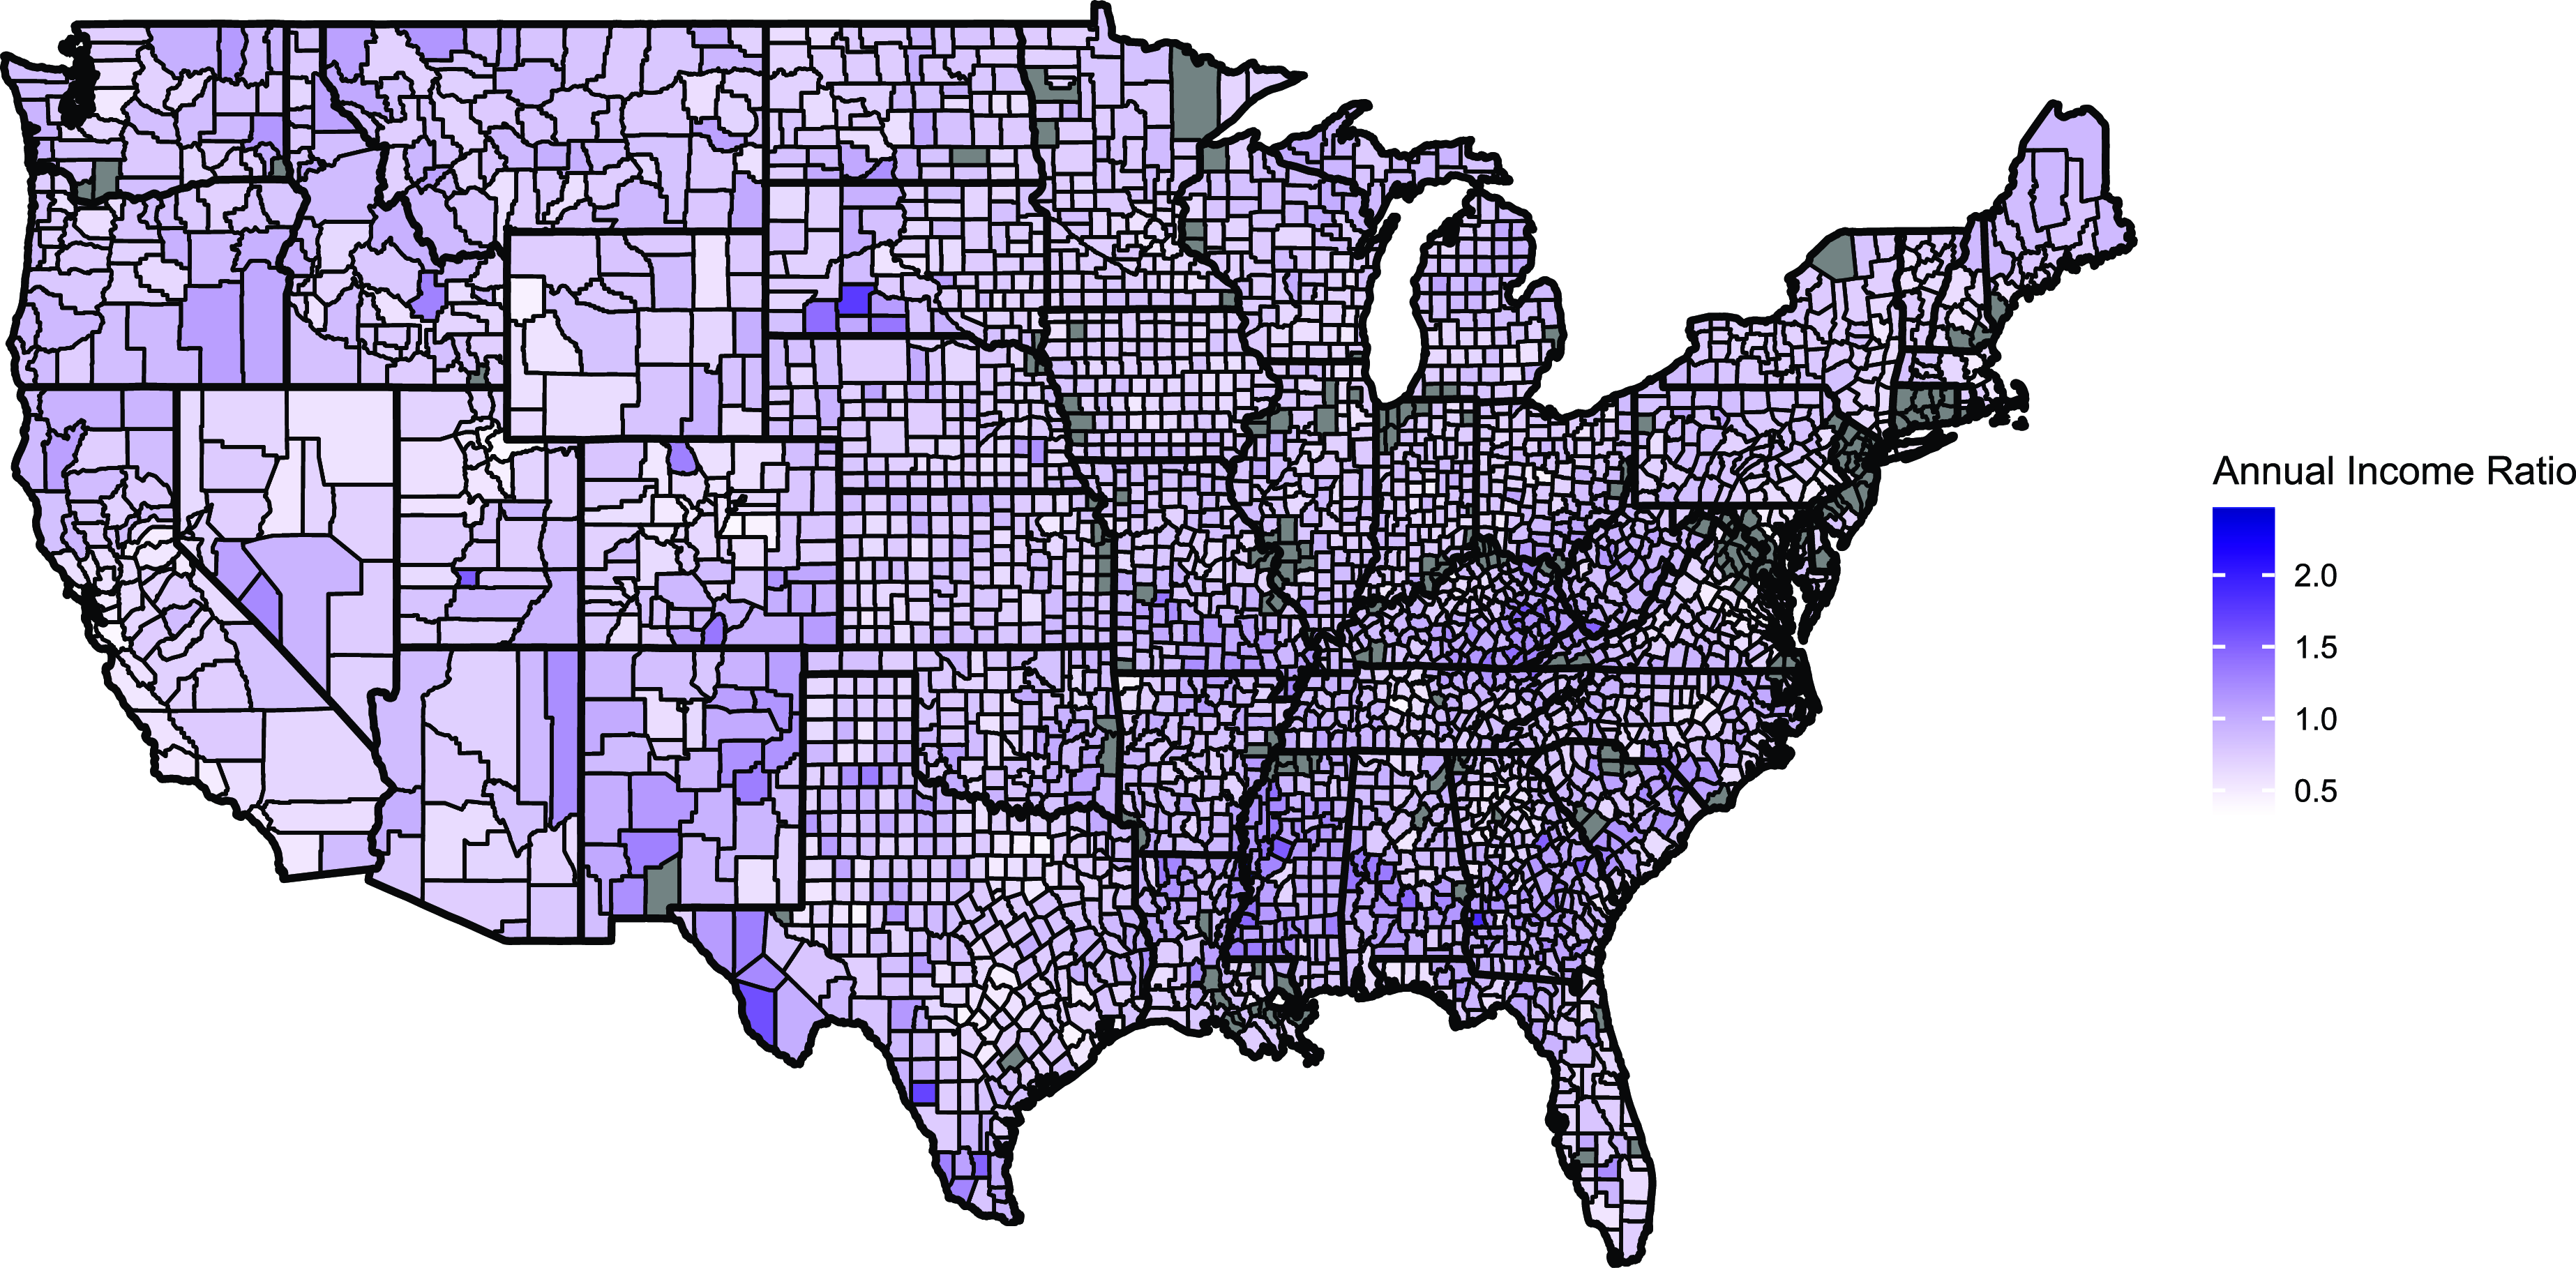
Recall that driver income is measured at the CBSA level and median household income data are reported at the county level. Therefore, the income ratio, which refers to the median heavy tractor trailer truck driver annual income divided by median household income, varies at the county level. Specifically, the darker regions in Figure 3 represent counties in which driver pay is relatively high. Presumably, these are areas where driving a truck is a more lucrative occupation (has a favourable opportunity cost compared with other occupations) and we hypothesise that all else constant, carriers located in these regions will be associated with fewer crashes.
Model output
Crash data are count data, so Poisson regression is the appropriate starting point. However, the data appear to be over-dispersed. Consequently, estimation was made using the ‘glm.nb’ command from the MASS library in R.Footnote 11 This command utilises the NB2 framework (i.e., quadratic/second-order variance structure), which is a standard calibration for modelling over-dispersed Poisson processes (Hilbe, Reference Hilbe2011; Zeileis et al Reference Zeileis, Kleiber and Jackman2008). Despite the fact that more than half of the sample has not experienced a crash, the negative binomial output did not present any issues with excess zeros. See Table 2 for regression output.
Crash regression, dependent variable is the number of reportable crashes per carrier

Notes: N refers to sample size, ${\rho _{\overline {{\chi ^2}} }}$
is the ρ-value associated with the dispersion test statistic
${\rho _{\overline {{\chi ^2}} }}$
is the ρ-value associated with the dispersion test statistic $\overline {{\chi ^2}} $
(H0: μ = σ2), and asterisks indicate statistical significance (10% [*], 5% [**], and 1% [***]).
$\overline {{\chi ^2}} $
(H0: μ = σ2), and asterisks indicate statistical significance (10% [*], 5% [**], and 1% [***]).
The traditional coefficient of determination (‘ ${R^2}$
’) is not well-defined for generalised linear models (GLMs). In lieu of this, null and residual deviance information has been included. Deviance is, essentially, the GLM analogue to squared error. Specifically, residual deviance is defined as twice the difference between the log likelihood from a saturated model and the fitted model. Similarly, null deviance is defined as twice the difference between the log-likelihood from a saturated model and the null model (i.e., intercept-only). In general, models that eliminate a substantial amount of deviance can be interpreted as fitting well. Our model eliminates approximately 34% of deviance and this figure, 0.34, can be interpreted as a goodness of fit measure, analogous to an
${R^2}$
’) is not well-defined for generalised linear models (GLMs). In lieu of this, null and residual deviance information has been included. Deviance is, essentially, the GLM analogue to squared error. Specifically, residual deviance is defined as twice the difference between the log likelihood from a saturated model and the fitted model. Similarly, null deviance is defined as twice the difference between the log-likelihood from a saturated model and the null model (i.e., intercept-only). In general, models that eliminate a substantial amount of deviance can be interpreted as fitting well. Our model eliminates approximately 34% of deviance and this figure, 0.34, can be interpreted as a goodness of fit measure, analogous to an ${R^2}$
(Cameron and Windmeijer, Reference Cameron and Windmeijer1996).
${R^2}$
(Cameron and Windmeijer, Reference Cameron and Windmeijer1996).
The marginal effects associated with GLM coefficients are difficult to observe straight away and, thus, the coefficients are often transformed before they’re interpreted. In this case, we will rely on elasticity and semi-elasticity.
Semi-elasticities represent percentage changes in the dependent variable induced by some change in the level of the independent variable. For non-logged first-order terms, this is approximated well by $100{\beta _i}\partial {X_i}$
. This makes indicator variables relatively easy to interpret, as
$100{\beta _i}\partial {X_i}$
. This makes indicator variables relatively easy to interpret, as $\partial {X_i}$
is restricted to 1. However, because
$\partial {X_i}$
is restricted to 1. However, because $\partial {X_i}$
is not pinned down, the magnitude of the effects of non-binary variables are somewhat obscured. For this reason, we report elasticities from the mean for the non-binary terms.
$\partial {X_i}$
is not pinned down, the magnitude of the effects of non-binary variables are somewhat obscured. For this reason, we report elasticities from the mean for the non-binary terms.
Standard first-order variables have linear elasticities of the form ${\beta _i}{X_i}$
and, from the mean,
${\beta _i}{X_i}$
and, from the mean, ${\beta _i}\overline {{X_i}} $
. Logged variables, on the other hand, imply constant elasticities, and, thus, their elasticities from the mean are the same as their regression coefficient values. In general, elasticities with absolute values larger than
${\beta _i}\overline {{X_i}} $
. Logged variables, on the other hand, imply constant elasticities, and, thus, their elasticities from the mean are the same as their regression coefficient values. In general, elasticities with absolute values larger than $1$
indicate that the dependent variable is relatively sensitive (i.e., elastic) to the independent variable in question and the opposite is true for elasticity coefficients less than
$1$
indicate that the dependent variable is relatively sensitive (i.e., elastic) to the independent variable in question and the opposite is true for elasticity coefficients less than $1$
.
$1$
.
Results
For brevity, state and VMT update year indicator coefficients have been omitted from Table 2.Footnote 12 In our opinion, these are ‘black boxes’. They aggregate several different phenomena, including geography, climate, enforcement patterns, and more. Unfortunately, there is no way to parse out these effects and, thus, the coefficients themselves should not be interpreted as anything besides controls.
Exposure variable coefficients (vehicle miles travelled, power unit counts, and driver counts) are positive. We expected this because crashes happen on the road. While the literature does suggest that bigger carriers tend to be safer, controlling for other factors (Cantor et al Reference Cantor, Corsi, Grimm and Singh2016), we already are controlling for compliance scores and wages, and are unable to observe ‘fault’. We therefore are not surprised that, all else constant, higher mileage, having more trucks, and having more drivers, are associated with more crashes.
The private carriage indicator is negative, statistically significant, and relatively large. The coefficient itself is approximately −0.48, which, using the semi-elasticity formula discussed above, implies that, all else constant, private operating authority is associated with 48% fewer crashes. While some of the most sought-after trucking jobs are in private carriage, on average private carriers tend to pay less (Belzer et al Reference Belzer, Rodriguez and Sedo2002; Burks et al Reference Burks, Monaco and Myers-Kuykindall2004). However, private carriage also comes with a higher likelihood of non-piece-rate pay, shorter hauls (e.g., local delivery), more regular routes, and more home time. This is particularly true for intrastate carriage.
While inelastic, BASIC score coefficients are, for the most part, positive and statistically significant. This is not surprising. BASIC scores are measures of safety disability and, to the extent that FMCSA has their SMS properly calibrated, one would expect these scores to be positively correlated to crash incidence. The lacklustre performance of driver fitness also does not come as a surprise. This has been documented before; for example, see Lueck (Reference Lueck2012).
The income ratio is our primary variable of interest. Its coefficient is negative and statistically significant. The ratio varies at the county level, suggesting that carriers located in counties with relatively high trucking pay tend to experience fewer crashes and, thus, that higher pay is associated with fewer crashes – all else constant.
The income ratio’s elasticity from the mean suggests that a 1% increase in relative earnings in the average county would be associated with approximately 0.2% fewer crashes for each carrier in that county and, by extension, that a 10% increase would be associated with roughly 2% fewer crashes. At first glance, this seems relatively small and, indeed, in absolute terms, it is. However, even small reductions in crash rates may not be trivial when summed across all carriers in the county and/or industry. Furthermore, because the cost of crashes is so high, the expected cost savings from small reductions still can be substantial.
To illustrate, note that the standard deviation for the income ratio is 0.142 and its regression coefficient is −0.296. Using the semi-elasticity formula discussed above, $100{\beta _i}\partial {X_i}$
, we can infer that increasing heavy and tractor-trailer truck drivers’ relative income by one standard deviation is associated with approximately 4% fewer crashes. Since sample carriers experienced just over 17,000 crashes, a 4% reduction would be associated with roughly 715 fewer crashes. Approximately 3% of crashes in the regression sample had at least one fatality. Assuming these were uniformly distributed, the 4% reduction would lead to roughly 21 fewer deaths. Using Zaloshnja and Miller’s (Reference Zaloshnja and Miller2007) inflation-adjusted average cost of a fatal heavy truck crash (2023USD 5.6 million), that is an additional cost of at least 2023USD 100 million.
$100{\beta _i}\partial {X_i}$
, we can infer that increasing heavy and tractor-trailer truck drivers’ relative income by one standard deviation is associated with approximately 4% fewer crashes. Since sample carriers experienced just over 17,000 crashes, a 4% reduction would be associated with roughly 715 fewer crashes. Approximately 3% of crashes in the regression sample had at least one fatality. Assuming these were uniformly distributed, the 4% reduction would lead to roughly 21 fewer deaths. Using Zaloshnja and Miller’s (Reference Zaloshnja and Miller2007) inflation-adjusted average cost of a fatal heavy truck crash (2023USD 5.6 million), that is an additional cost of at least 2023USD 100 million.
Like any study, this one is not without its weaknesses. For example, we do not have carrier-level wage data or information on work time. However, more detailed compensation information is unavailable and, thus, researchers in this space often must use novel methods to measure driver wages. Also, as we allude above, the dependent variable does not take fault into consideration. This was largely done out of necessity, as quite a bit of crash information is missing from MCMIS – particularly where preventability and citation description are concerned (Panel on the Review of the Compliance Safety and Accountability (CSA) Program of the Federal Motor Carrier Safety Administration, 2017). Furthermore, FMCSA currently includes all reportable crashes in their targeting decisions anyway – regardless of fault or citation (Federal Motor Carrier Safety Administration, 2021c).
Discussion
Guideline 73 of the ILO’s Guidelines on the promotion of safe and decent work in the road transport sector states that ‘the remuneration of … CMV [commercial motor vehicle] drivers should be sustainable and take into consideration the attractiveness and sustainability of the industry’ (International Labour Organization, 2020). Model output seems to validate this sentiment by suggesting that safety performance is improved as driver income increases, relative to local opportunities.
Of course, driver wages are set by market forces and, in theory, a competitive labour market should already fully account for work amenities, including safety conditions, in its equilibrium process (Rosen, Reference Rosen1974; Thaler and Rosen, Reference Thaler, Rosen and Terleckyj1976). However, in practice, the evidence that this actually happens is mixed (Kuhn and Ruf, Reference Kuhn and Ruf2013; Leeth and Ruser, Reference Leeth and Ruser2003; Wang et al Reference Wang, Cheng and Smyth2016). Presumably, this is due to a preponderance of real-world frictions and imperfect competition that is not accounted for in the vacuum of perfectly competitive models (Manning, Reference Manning2013). To illustrate, Webber (Reference Webber2015) found that the average US firm’s labour supply elasticity actually was much lower (i.e., more monopsonistic) than scholars had previously thought. He also found that this phenomenon was more concentrated in relatively low paying occupations, and, interestingly, that, on average, transportation NAICS codes had barely elastic labour supply. In the presence of non-trivial monopsony power, microeconomic theory suggests that higher wages could actually increase employment and net social benefit as well.
It also is important that trucking takes place on public roads and, therefore, truck crashes have the potential to generate external costs. If insurance markets work well, crash risk should be internalised through higher premiums. However, in practice, data are limited, economic costs are hard to measure, crashes are hard to predict, and, as a result, crash risk is hard to price. Importantly, the minimum liability requirement for interstate carriage, an important benchmark for intrastate liability requirements, has remained frozen at USD 750,000 per incident since 1985.Footnote 13 Meanwhile, the DOT’s average value of a statistical life has risen from roughly USD 1 million to well over USD 12 million (Federal Motor Carrier Safety Administration, 2016; 2021b) which means that the average social cost of a fatal heavy truck crash has probably risen an order of magnitude, to well over 2023USD 5 million. Thus, there is reason to believe that the public bears a significant portion of the costs of fatal crashes and, therefore, that driver pay may not fully internalise safety performance risk. According to microeconomic theory, the presence of a negative externality implies that, if left to its own devices, the market will settle on prices that are too low and, consequently, that regulation could be used to improve economic efficiency.
US motor carrier safety regulators do not consider compensation. Instead, they have opted to combat unsafe behaviour with complex downstream regulation and intrusive surveillance. The most recent iteration of this involves mandatory electronic logging device (ELD) (a.k.a. electronic logbook, or ELB) requirements. However, despite the presence of ELDs, drivers can still exploit loopholes to bend hours of service regulations. This is because the FMCSA defines work as the time during which drivers are responsible for their freight (or passengers), which allows carriers to claim that drivers are not working while they wait for loading, unloading, or even while the process is underway, and even when the driver is performing the labour, and, thus, decline to pay them for the time. This transfers delay costs from cargo owners to carriers to drivers, increases the economic pressure felt by drivers, provides an incentive to falsify logbooks, diminishes carriers’ incentive to punish cargo owners for free-riding on drivers’ time, and, by extension, implicitly, encourages delays and excessive work hours. None of this is safe. To illustrate, in 2018, the Office of the Inspector General found that a 15-minute increase in average dwell time greater than two hours of dwell time was associated with 1 additional crash per 1,000 power units or, using 2013 crash data, roughly 6,500 more crashes (Office of the Inspector General, 2018). To put that in perspective, FMCSA reported that in 2020, roughly 1% of crashes involving large trucks had at least one fatality and 24% came with injuries (Federal Motor Carrier Safety Administration, 2022). At that rate, 6,500 more crashes scale up to more than 65 additional fatalities and 1,500 more injuries.
Furthermore, to the extent that carriers can gain a competitive advantage through unsafe pay and drivers can increase earnings by working unsafe hours, both drivers and carriers have a persistent incentive to continue to search for ways to circumvent the rules. Therefore, by ignoring compensation, FMCSA regulators have effectively locked themselves into a perpetual game of cat-and-mouse. This is expensive, which begs the question: would it be more efficient to focus on incentives and, in doing so, passively discourage unsafe behaviour? For example, Belzer and Sedo (Reference Belzer and Sedo2018) used UMTIP driver survey data to estimate a supply curve for truck driver hours of work. At the average rate of pay, they found that drivers would choose to work unsafe and even illegal hours. However, at higher rates – those above the inflection point on their supply curve – they found that drivers would be more inclined to trade labour for leisure and, by extension, work safer hours. Similarly, using the NIOSH LHTDS data, Kudo and Belzer (Reference Kudo and Belzer2019b) show that explicitly compensating drivers for non-driving duties is associated with fewer work hours as well.
Granted, higher wages and/or compensation for non-driving labour could put upward pressure on freight prices. However, at least some of that should be offset by hiring and retention efficiencies, as well as higher productivity and profitability (Belzer et al Reference Belzer, Rodriguez and Sedo2002; Faulkiner and Belzer, Reference Faulkiner and Belzer2019; Rodriguez et al Reference Rodriguez, Targa and Belzer2006). Furthermore, if drivers are paid for more of their time, carriers could have greater incentive (or even a requirement) to charge cargo owners for delays. This should reduce average dwell time and, in doing so, increase productivity as well as safety, which, presumably, offsets additional cost pressure. Moreover, even if the explicit cost of freight increases, a priori it is not obvious that this would be a net loss. For example, safe rates promise to reduce the necessity of supervising hours of service and, by extension, the tax burden required to fund the effort. Also, crashes are expensive and anything that reduces their likelihood potentially represents a non-trivial cost savings.
Research contribution
Mounting criticism led to a review of FMCSA’s existing SMS, written into the 2015 Fixing America’s Surface Transportation (FAST) Act, and the National Academies’ (NAS) Committee on National Statistics was commissioned to evaluate it. The findings from the investigation were published in 2017. Among other things, the NAS recommended that FMCSA explore ways of collecting further data, including pay rate and the value of unpaid time, that would help it better measure safety performance (Panel on the Review of the Compliance Safety and Accountability (CSA) Program of the Federal Motor Carrier Safety Administration, 2017). Shortly after, the ILO adopted safe rates principles into its Guidelines on the promotion of safe and decent work in the road transport sector. Specifically, guideline 73 states that rates should take into consideration the goals of increasing the attractiveness of the industry, and guideline 46, part a, recommends that governments should identify and implement measures to better collect and disseminate economic data (International Labour Organization, 2020). This study directly addresses these recommendations.
As economists, we naturally are interested in the relationship between compensation, labour characteristics, labour market dynamics, and safety outcomes. Our primary intention here is to demonstrate that compensation information is an important predictor of safety performance, and, by extension, that pay is a potentially useful policy lever for motor carrier safety regulators. On these grounds, the results of the analysis do not disappoint. The income ratio has a higher crash-elasticity than all of the BASICs combined.
While the proposition that pay and safety are related is certainly not new, it still is contentious in many political arenas and, therefore, it is useful to have as much supporting evidence as possible. Furthermore, the bulk of the literature on driver compensation contains analysis done at the driver level (Kudo and Belzer, Reference Kudo and Belzer2019a, Reference Kudo and Belzer2019b), uses annual income divided by vehicle miles travelled (Kudo and Belzer, Reference Kudo and Belzer2019a, Reference Kudo and Belzer2019b; Monaco and Williams, Reference Monaco and Williams2000), or focuses on a single carrier (Belzer et al Reference Belzer, Rodriguez and Sedo2002; Faulkiner and Belzer, Reference Faulkiner and Belzer2019; Rodriguez et al Reference Rodriguez, Targa and Belzer2006). In this study, we take a novel approach by considering the ratio of driver pay to household incomes. Thus, instead of measuring driver earnings per se, we proxy the attractiveness of trucking jobs in particular geographic regions. To the extent that ‘safe rates’ involves making trucking an attractive occupation, this is an important nuance and, according to our model, crash incidence falls as trucking becomes more lucrative relative to other local opportunities.
Finally, the FMCSA’s primary mandate is to help keep roads safe and this necessarily involves reducing the incidence of crashes. To that end, FMCSA uses safety performance measurements (i.e., BASIC scores) to help them target carriers at a higher risk of crashing. Our research suggests that they should be interested in the extent to which these metrics predict crashes in large sample studies. In this study, we have presented evidence that BASIC scores, with the exception of driver fitness, have a statistically significant positive correlation to crash incidence and, while not our primary focus, given the contemporary discourse surrounding the existing SMS, we think this is important as well. While BASICS are important, our research suggests that pay factors may be considerably better predictors of safety.
Conclusion
Since the late 1970s, deregulation, intense competition, and de-unionisation have eroded working conditions and compensation for truck drivers. Road transport is now one of the most dangerous civilian occupations in the country, and long hours in a truck tractor certainly are not conducive to a healthy lifestyle. If policymakers want workers to opt into the industry, society needs to pay them for their work. In efficient markets, this should already be priced into wage offers. However, to the extent that labour markets are imperfectly competitive and safety costs are externalised, there is no reason to expect them to operate efficiently when left to their own devices.
Unfortunately, in the US, the FMCSA’s current position does not explicitly consider economic incentives, which overlooks an important policy lever. Instead of micromanaging downstream effects, it would be more effective and efficient to make unsafe behaviour unattractive. This could be done by aligning the DOT’s definition of work with the DOL’s, extending mandatory overtime protections to truck drivers, and paying sustainable rates. Since this ultimately would involve broad-based changes in regulatory policy, individual carriers would not face competitive disadvantages for compensation practices that make them safe. Furthermore, eliminating the reward for violating hours of service should reduce the cost of policing it, and with safer hours come fewer crashes. This should help offset possible increases in the cost of freight and, more importantly, save lives.
At the end of the day, we would all feel more comfortable on the road thinking that heavy duty truck drivers pursue their jobs with professionalism. However, this will not happen if work conditions continue to deteriorate and/or if wages are not competitive with other blue-collar occupations. Given the current regulatory fixation with downstream issues, this is something that is almost never discussed in the US and, consequently, we hope that this research helps start a new conversation.
Walter T. Ryleyis an Assistant Teaching Professor of Economics at Bowling Green State University. His research interests involve trucking industry pay practices, safety performance measurement, and crashes.
Michael H. Belzer is Professor and Director of Graduate Studies in Economics at Wayne State University. He created the TRB Trucking Industry Research Committee and chaired it for more than 12 years. Belzer wrote Sweateshops on Wheels: Winners and Losers in Trucking Deregulation (Oxford, 2000), and numerous peer-reviewed articles on trucking industry economics, labour, and OHS.


 Open access