


How do professors’ identities, including gender and perceived race and ethnicity, affect students’ course-enrollment preferences? This is the primary research question that this study answers. Although previous research investigated the impact of faculty members’ identity on their career development (Blell, Liu, and Verma Reference Blell, Liu and Verma2023; Candido et al. Reference Candido, Catelano, Chaguri, Marques, de Oliveira and Biroli2023; Dion and Mitchell Reference Dion and Mitchell2020; Liu, Devine, and Gauder Reference Liu, Devine and Gauder2020; MacNell, Driscoll, and Hunt Reference MacNell, Driscoll and Hunt2015; Monroe and Chiu Reference Monroe and Chiu2010; Pyke Reference Pyke2011; Reidy and Stockemer Reference Reidy and Stockemer2024), there is little research regarding the impact of an instructor’s identity on a student’s course selection before any interaction between the instructor and the student.
When many studies examine the influence of faculty members’ identities on student perceptions, they focus on how faculty gender, race, and ethnicity affect student evaluations of teaching (SET). Because SET scores are crucial for faculty tenure, promotion, and compensation, understanding these biases is particularly important (Anderson and Miller Reference Andersen and Miller1997; Martin Reference Martin2016; Mitchell and Martin Reference Mitchell and Martin2018). For instance, in political science, women professors on average receive lower scores than their men peers in quantitative student evaluations. Additionally, women professors are more likely to receive qualitative comments unrelated to their teaching skills or the subject matter (Mitchell and Martin Reference Mitchell and Martin2018). Beyond the direct influence of gender, studies have found that students are more likely to have a negative perception of women professors who do not conform to expectations of being “friendly” and “approachable,” such as by asking students to address them by their first name (Foster Reference Foster2023). These previous studies indicate that faculty members’ gender influences how they are perceived by students.
Gender also intersects with other attributes including race and ethnicity. Although students are unable to separate these different attributes (Crenshaw Reference Crenshaw and Maschke2013), there is a significant body of research that illustrates the impact of race and ethnicity on how students evaluate their professors. For example, scholars found that Black faculty members are more likely to receive lower evaluation scores when they do not act like students’ peers, such as asking students to address them as “Dr.” or another professional title (Foster Reference Foster2023). This influence is not limited to a professor’s appearance or accent; even their last name can shape students’ perceptions and judgments. For example, research by Chávez and Mitchell (Reference Chávez and Kristina2020) found that students in online courses are more likely to give women professors who are perceived as persons of color lower evaluation scores than professors who are perceived as white.
These findings underscore the importance of understanding how professors’ identities affect students’ evaluations, which may be crucial for their academic promotion. Ensuring fairness in promotion processes necessitates a comprehensive overview of this topic. However, existing studies are not sufficiently comprehensive in capturing the holistic impact of professors’ identities. First, most research focuses on binary gender identification, often overlooking the significance of nonbinary gender identities. Second, studies on racial and ethnic identity tend to focus on white faculty members versus faculty who are persons of color, neglecting the variations among those of a different race and ethnicity. This approach fails to reflect real diversity and inclusive perspectives, assuming that all professors of color are treated similarly. Third, most studies examine students’ perceptions after they have interacted with their professors; few studies address how professors’ identities affect students’ perceptions before their first encounter (Bavishi, Madera, and Hebl Reference Bavishi, Madera and Hebl2010). With budget limitations and declining student populations in higher education, universities must be selective about which courses to offer. If professors’ identities influence students’ perceptions, they also may affect their course-enrollment decisions based on those identities. Therefore, this study used a conjoint experiment to understand how professors’ gender identities and implied racial and ethnic backgrounds influence students’ willingness to enroll in a course under a hypothetical situation. Although the experiment was based on a hypothetical choice of courses, this research provides a more comprehensive understanding of how the role of professors’ identities shape students’ perceptions and decisions. This ultimately may contribute to fairer academic promotion processes and more inclusive educational environments.
BEYOND BINARY GENDER IDENTIFICATION
An increasing number of studies illustrate the overall experience of gender-diverse faculty members in higher education, but they still fail to focus specifically on how students perceive faculty members’ gender identity. First, research illustrates how an increasing number of faculty members in higher education disclose their gender pronouns on their course-management website and email signatures to support gender diversity and inclusion (Goldberg, Smith, and Beemyn Reference Goldberg, Smith and Beemyn2019; Gustafsson Sendén, Renström, and Lindqvist Reference Sendén, Marie and Lindqvist2021; Smith Reference Smith2020). This practice also may help students to understand their professor’s gender identity or provide clues that they can use to make assumptions about a professor. Although the influence of a binary professor’s gender on student perceptions and evaluations has been studied, there is less research on how students perceive nonbinary and gender-diverse faculty members. Moreover, recent work by Benato, Fraser, and White (Reference Benato, Fraser and White2024) and Goldenberg and Brubaker (Reference Goldenberg and Brubaker2024) underscores how institutional practices (e.g., pronoun disclosure) are emerging but rarely link faculty members’ identity to student choice. This gap partly reflects the broader demographic and institutional context: the number of faculty members who publicly identify as nonbinary remains small. Only in recent years have many felt sufficiently safe and supported to disclose their gender identity within an academic setting. Consequently, empirical research on this population has faced challenges related to participant recruitment, confidentiality, and data availability. These structural barriers have delayed systematic inquiry rather than indicating a lack of scholarly interest.
Second, most existing gender-diverse studies focus on the experiences and struggles that transgender and gender-diverse students and faculty face in higher education (Gonzalez et al. Reference Gonzalez, Dusic, Operario, Velasquez and Restar2024), providing best practices to counter obstacles and discrimination. However, there is relatively little focus on the experiences of transgender and gender-diverse faculty members, particularly regarding how their gender identity affects students’ perceptions. Specifically, limited studies indicate that transgender and gender-diverse faculty members often face both implicit and explicit discrimination in higher education. Some research suggests that these faculty members may feel that they are treated as a “token” (Hughes, Horner, and Velez Ortiz Reference Hughes, Horner and Ortiz2012; LaSala et al. Reference LaSala, Jenkins, Wheeler and Fredriksen-Goldsen2008).
Third, LGBTQ+ faculty members also encounter more subtle forms of discrimination, such as exclusion and isolation (Bilimoria and Stewart Reference Bilimoria and Stewart2009; Dozier Reference Dozier2015). Conversely, some transgender and gender-diverse social science faculty members feel a sense of responsibility to disclose their gender identity (Jennings Reference Jennings2010). These studies are important for illustrating the overall experience of faculty members within institutions of higher education, but they still fail to focus specifically on students’ perceptions.
Furthermore, when we examined how a professor’s gender identity affects students’ perceptions and evaluations, the results were mixed. On the one hand, some studies argue that discrimination and bias against LGBTQ+ faculty members manifest in multiple forms, including negative student evaluations (Bailey and Miller Reference Bailey and Miller2015; Ewing, Stukas, and Sheehan Reference Ewing, Stukas and Sheehan2003). On the other hand, other studies suggest that the disclosure of a transgender or gender-diverse identity can be beneficial. It can increase authenticity, be perceived positively by students, and improve the overall classroom environment (Cooper, Brownell, and Gormally Reference Cooper, Brownell and Gormally2019). Women and gender-diverse students also report an increased sense of belonging when their professors disclose their gender-diverse identity (Busch et al. Reference Busch, Supriya, Cooper and Brownell2022). Additionally, some studies find no significant effect on student perceptions of nonbinary gender faculty (Jennings Reference Jennings2010). Gender identity and its impact on students’ perceptions also may be contextual based on subject matter. For example, under role-congruity theory, students may have gender expectations based on the course subject that may differ in social science courses (SSCs) compared to STEM courses (Aragón, Pietri, and Powell Reference Aragón, Pietri and Powell2023).
Because our research question primarily investigated how professors’ perceived identities—including nonbinary gender identities and implied race and ethnic backgrounds—affect students’ course-enrollment preferences, this article focuses on how students perceive nonbinary professors before any interaction occurs. In situations in which no personal interaction has occurred, research has found that individuals with nonbinary gender pronouns are more likely to face discrimination, even when they list nonbinary pronouns (i.e., they/them) on their resumé (Eames Reference Eames2024). It is noteworthy that SET and pre-interaction course choice occur at different stages of the student–faculty member relationship and may not be driven by identical mechanisms. We drew on this literature to motivate expectations about how students form judgments under conditions of limited information. Therefore, we hypothesized that:
H1: Students are less likely to enroll in courses taught by professors who are not cisgender.
THE IMPACT OF IMPLIED RACE AND ETHNICITY
As discussed previously, the existing research on the impact of a professor’s racial and ethnic background on students’ perceptions primarily focuses on student evaluations. For instance, Wang and Gonzalez (Reference Wang and Gonzalez2020) found that after controlling for course difficulty, white American professors received higher SET scores compared to nonwhite American and foreign professors. Specifically, Black and Asian professors were evaluated more negatively than their white counterparts regarding overall quality, helpfulness, and clarity; however, they were rated higher on easiness. Reid (Reference Reid2010) similarly noted that Black and Asian professors are more likely to receive the lowest ratings on platforms such as Rate My Professor (RMP). Studies in computer science departments also highlight racial disadvantages. Findings confirm that “Asian” instructors face biases related to their race and language, although the discriminatory discourse on RMP often is subtle and reflects dominant language ideologies in nuanced ways. Another study that provided college-preparatory students with curricula vitae of professors of varying races, genders (i.e., binary), and academic disciplines found that Asian professors were judged to possess significantly poorer interpersonal skills compared to white professors (Bavishi, Madera, and Hebl Reference Bavishi, Madera and Hebl2010). These findings suggest that a professor’s racial and ethnic background significantly influences students’ evaluations. However, students’ perceptions of faculty members are distinct from their evaluations.
Perceptions can begin even before a course starts. For example, students are less supportive than faculty members concerning hiring structurally marginalized faculty members (Carey et al. Reference Carey, Carman, Clayton, Horiuchi, Htun and Ortiz2020). Mendez and Mendez (Reference Mendez and Mendez2018) found that students tend to choose courses taught by men faculty members who are white, Black, or Asian, whereas women faculty members are more likely to be selected if they are Hispanic. This suggests that even the implied race of professors—inferred from their last name—can shape students’ perceptions. Although racism related to ethnic names exists in higher education, research on how these implied racial identities affect professors based on students’ perceptions remains limited.
When we expanded our focus to other domains, the implications of racial and ethnic biases based on names were relatively well documented. Studies show that structurally marginalized candidates must apply for more jobs to receive the same number of interviews as their white counterparts. For example, applicants with a white-sounding name receive 50% more callbacks than those with a Black-sounding name, which indicates significant racial discrimination in the American labor market (Booth, Leigh, and Varganova Reference Booth, Leigh and Varganova2012). Based on this finding as well as that people make assumptions about an individual’s race and ethnicity or place of birth because of their last name (Abel and Burger Reference Abel and Burger2023; Elder and Hayes Reference Elder and Hayes2023; Gaddis Reference Gaddis2017), we hypothesized that:
H2: Professors with a last name that students perceive as not being “white American” are less likely to be preferred by students.
METHOD AND DATA
To examine whether faculty gender identification and perceived race and ethnicity affect students’ course-selection preferences, we used a choice-based conjoint experiment at a medium-sized, private, predominantly white, nonprofit religious university located in the Midwest. The participants for the study were first-year students enrolled in a mandatory course titled “Introduction to the University Experience” (IUE). It is required across various disciplines to familiarize students with their major and provide strategies for success throughout their college experience. There were 35 sections with 740 students in total. We contacted all instructors teaching IUE, and instructors of 15 sections agreed to distribute the survey between October 30 and November 30, 2023 (i.e., the course-enrollment period). A total of 240 students participated and completed the experiment, which brings our observations of the conjoint experiment to 2,400 (Liu, Brough, and Gaozhao Reference Liu, Brough and Gaozhao2026).
At the time of the survey, all second-year students were required to take an interdisciplinary SSC, a sophomore-level general education course. Despite sharing the same course number and learning objectives, each SSC section was taught by a different social science professor and focused on different related themes. In the experiment, we first presented a statement explaining what an SSC was and informed participants that they were required to take the course in their sophomore year. Specifically, they were presented with the following statement:
SSC is a theme-based course that varies across sections but shares common learning outcomes: application of social science methods and social theory, critically examining human issues and problems from the perspective of at least three social science disciplines. All students, including you, are required to take an SSC before you graduate. The following five pairs of SSC details will be presented to you. Please simply pick the course that interests you more from each pair.
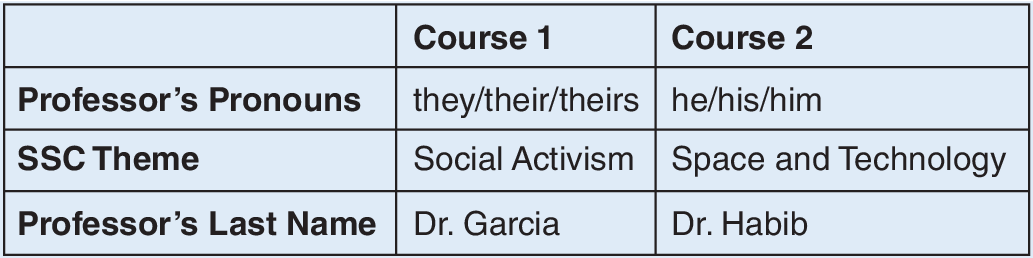
Respondents were then shown five sets of two SSC profiles. Each profile included three attributes related to the information that students typically use when they make enrollment decisions: course themes, the professor’s preferred gender pronoun, and the professor’s last name. The order of the attributes were randomized across student participants. For each attribute, one level was randomly selected from a predetermined set. Specifically, the course themes included five different levels: “space and technology,” “nuclear power and war,” “religion and common good,” “sex and relations,” and “social activism.” A professor’s preferred gender pronouns could be “she/her/hers,” “he/him/his,” or “they/them/theirs.” For the professor’s last name, we included names that were selected based on the most common last names within specific racial and ethnic groups to measure perceived ethnicity. The five levels of a professor’s last name included “Dr. Chen,” “Dr. Williams,” “Dr. Garcia,” “Dr. Habib,” and “Dr. Smith.” Respondents were shown five pairs of two-course profiles and asked to choose in which SSC they preferred to enroll for each pair. Figure 1 is an example of what participants saw as they completed the survey. After their five selections, as an attention check, we asked which course information had not been provided previously.
Example of the Experiment

The conjoint experiment was suitable for this research because course selection is multidimensional, and this method allowed each participant to choose a preferred course based on a combination of attributes. Additionally, selecting a course based on a professor’s gender identity and perceived ethnicity is a socially sensitive issue, making it difficult to elicit honest opinions due to social-desirability bias. The conjoint experiment prevented this bias. To further prevent respondents from focusing on a specific attribute or sensing the study’s intention, we included course themes. This allowed respondents to focus on the attributes that they found most important in terms of course selection.
RESULTS
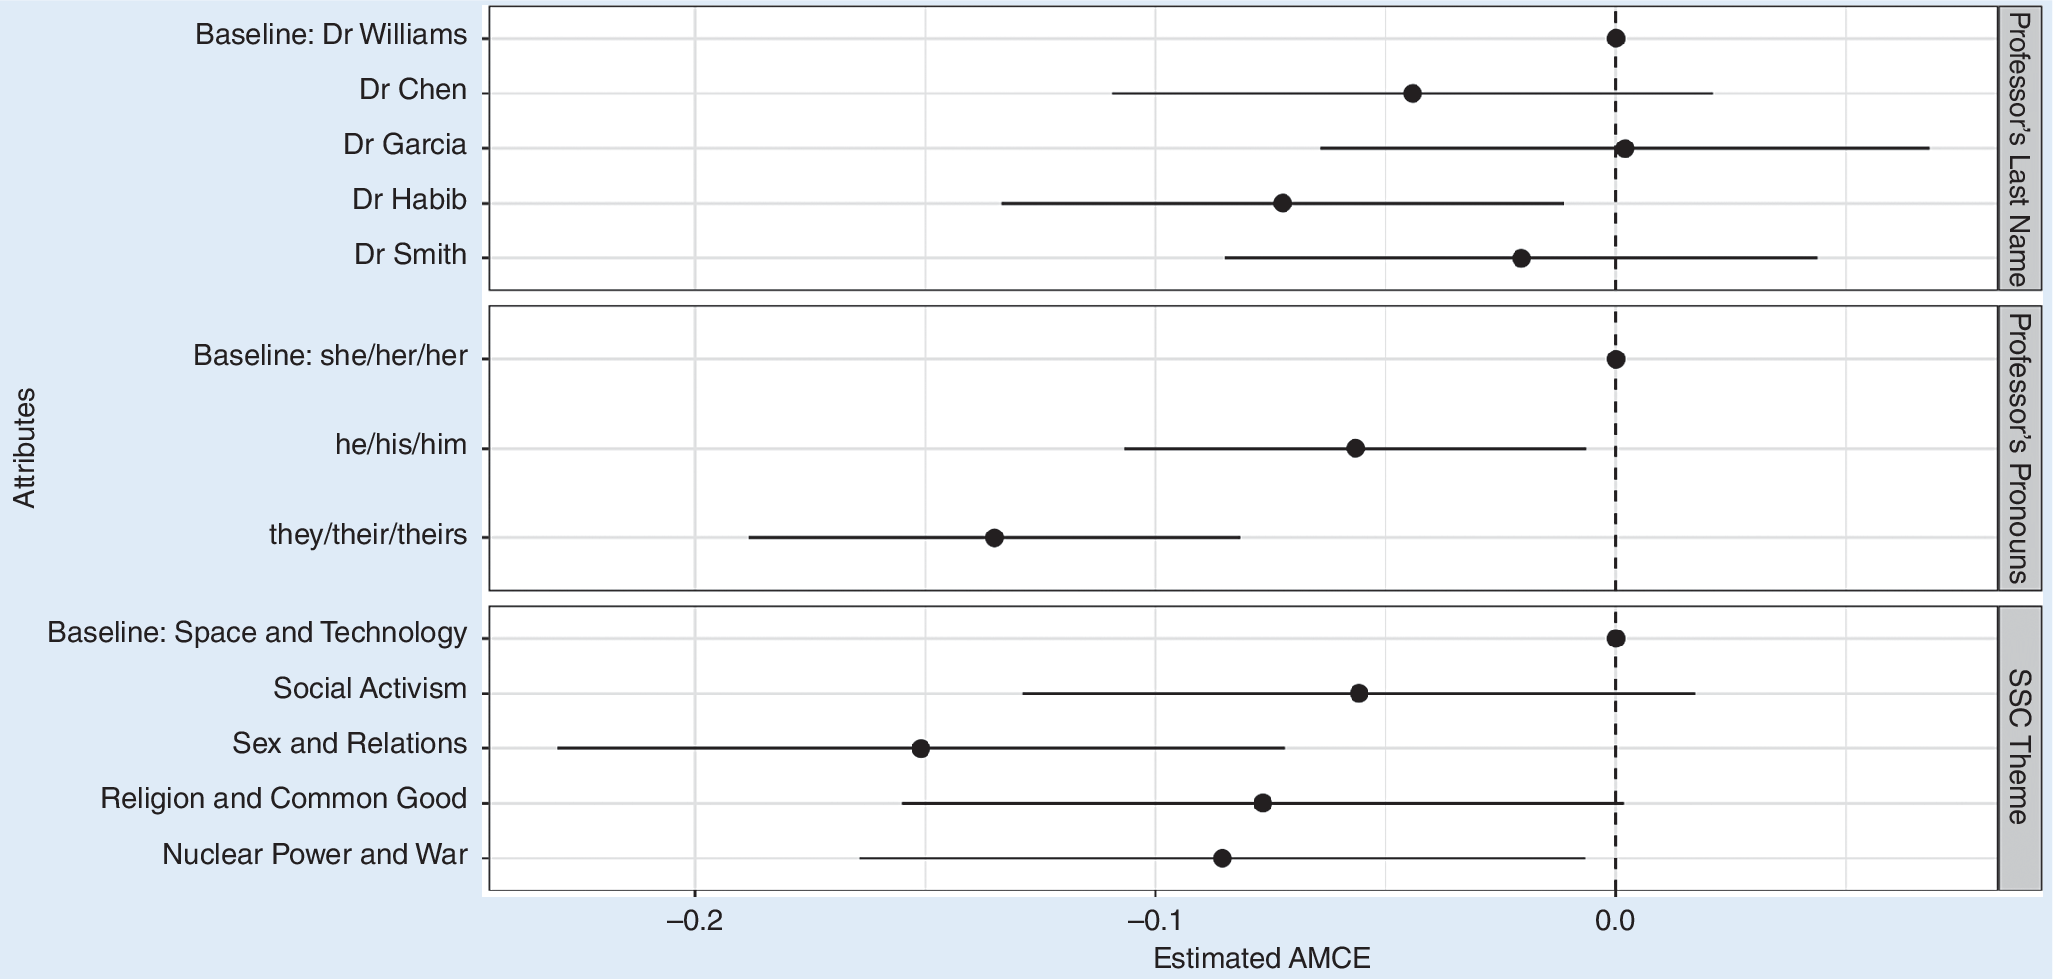
By reviewing students’ preferred choices, we estimated the average marginal component effect (AMCE) for each attribute of the SSC by conducting conjoint analysis. The causal relationship between an attribute and the likelihood that it would be chosen was captured by an AMCE. Because each participant received five pairs of course profiles, we clustered standard errors by participant to account for the possible non-independence of their choice outcomes.
The AMCE estimates and 95% confidence intervals for each attribute level are displayed in figure 2. Relative to their baselines, there were 10 AMCE estimates. These estimates can be perceived as the marginal effect of each attribute level on a student’s choice of an SSC. Their favorable attitudes toward the assigned attribute levels were indicated by a positive AMCE and unfavorable attitudes toward similar levels were indicated by a negative number. Overall, participants least preferred an SSC related to religion and common good that was taught by Dr. Habib with they/them/theirs pronouns.
Pooled Average Marginal Component Effects
Notes: Estimates are based on the regression estimators with clustered standard errors. Bars show 95% confidence intervals. Regression coefficients are in table 1.

Pooled Conjoint Analysis Results

Notes: Standard errors are in parentheses. * $ p $
<0.05; **
$ p $
<0.05; ** $ p $
<0.01; ***
$ p $
<0.01; *** $ p $
<0.001.
$ p $
<0.001.
Particularly regarding a perceived professor’s race and ethnicity, participants on average were 7% less likely to select Dr. Habib as their preferred instructor when compared to Dr. Williams (SE=0.031, p=0.021). Regarding a perceived professor’s gender, having he/him/his pronouns reduced the likelihood of being selected by 5.7% when the alternative option was a professor whose pronouns were she/her/hers (SE=0.026, p=0.027). The likelihood was even lower for a professor who had they/them/theirs pronouns—a disadvantage of 13.5% less likely to be preferred over the she/her/hers professor (SE=0.027, p<0.001). For course themes, space and technology was the most popular among five available themes whereas two other themes—nuclear power and war and sex and relations—had relatively lower albeit statistically insignificant levels of students’ preferences. The difference in the probability of being selected among the baseline, space and technology, and social activism themes was –0.085 (p=0.035), which suggests a position of disadvantage for the latter theme. The religion and common good theme was approximately 15.1% less likely to be selected by students compared to the baseline (p<0.001).
DISCUSSION
How does a professor’s gender identity and implied race and ethnicity affect students’ course-enrollment decisions? Our results reveal that courses taught by nonbinary professors and those with a last name of Habib were less likely to be selected by students. The results imply that nonbinary professors face more challenges in achieving their course-enrollment targets. Also, unlike most previous studies that investigated the influence of a professor’s gender on students’ evaluation and perception that often find that men professors tend to receive more favorable evaluations, our results indicate the opposite. Specifically, courses taught by professors using “she/her/hers” pronouns were more likely to be preferred by students than those taught by professors using “he/him/his” or “they/them/theirs” pronouns. Although this may challenge the typical advantage observed for men professors, these results should be interpreted with caution. One possibility is that gender cues may operate differently across stages of the student–faculty member relationship. In pre-interaction settings, students may associate she/her/hers pronouns with approachability, inclusiveness, and instructional support. However, post-interaction evaluations reflect classroom dynamics and performance expectations that may disadvantage women when gendered expectations are unmet.
…nonbinary professors face more challenges in achieving their course-enrollment targets.
In pre-interaction settings, students may associate she/her/hers pronouns with approachability, inclusiveness, and instructional support. However, post-interaction evaluations reflect classroom dynamics and performance expectations that may disadvantage women when gendered expectations are unmet.
In addition, our conjoint experiment was designed to identify students’ preferences when all other factors were held equal, thereby isolating the causal effects of a professor’s gender identity and implied racial and ethnic background. In real-world course enrollment, however, other contextual factors—including course time and location, instructor reputation, and scheduling conflicts—also may influence students’ choices. Furthermore, students’ preferences may be influenced by the specific IUE instructors and other professors with whom they have interacted at the university. These interactions and the university’s unique environment may have a crucial role in shaping students’ preferences in course selection. Therefore, we cannot conclude that professors who identify themselves as women always have more advantages in course enrollment than professors who identify as men.
Moreover, not all professors with a perceived “nonwhite, non-American” last name face the same level of disadvantage regarding course enrollment. Professors with a last name that implies that they are Asian or Hispanic did not receive the same disadvantages as those with a last name such as Habib. Future research could incorporate actual enrollment data to examine whether these experimentally identified preferences are reflected in actual enrollment behavior. These analyses would provide valuable complementary evidence about how structural and situational factors interact with identity-based cues in shaping students’ course decisions. Also, this study—which is based on existing literature—treats last names as interpretable identity cues; however, students may vary in how they understand and respond to these cues. For example, certain names may activate more specific associations that extend beyond ethnicity and nationality. For example, “Habib” may cue religious identity or contemporary geopolitical narratives in ways that do not apply to names such as “Chen” and “Garcia.” Relatedly, certain combinations of attributes in our conjoint experiment—for example, nonbinary pronouns paired with a particular last name or course theme related to religion—may carry overlapping or amplified meanings for some students. Due to the scope of the study and space constraints, our analysis did not test higher-order interaction effects. Accordingly, the findings should be interpreted as capturing average marginal penalties associated with individual cues rather than definitive evidence about how specific attribute combinations are evaluated jointly. Future research should examine whether name-based cues are interpreted as markers of nationality, religion, and other identities and investigate their joint effects.
…not all professors with a perceived “nonwhite, non-American” last name face the same level of disadvantage regarding course enrollment. Professors with a last name that implies that they are Asian or Hispanic did not receive the same disadvantages as those with a last name such as Habib.
In addition to our analytical results, one IUE instructor contacted us to share reflections from their students (i.e., the participants). Many participants argued that “the choice of pronouns or ethnicity of a name did not matter to them in terms of class choice.” Yet, the analysis indicates that gender pronouns and implied and/or perceived ethnicity do matter. The student participants’ subjective perceptions of what mattered to them for course choice may not accurately reflect what determined it. The influence of a professor’s gender identity and implied race and ethnicity had a more implicit yet significant impact on students’ preferences than they may have realized. In addition, when participants were presented with a professor’s last name, we did not provide any other cues to suggest the professor’s ethnicity. As we anticipated, the reflections revealed that students were interpreting the last name as an indicator of the professor’s ethnicity.
Studies have argued that implicit bias is a reflection of the environment or the system that is in place (Payne and Hannay Reference Payne and Hannay2021). These implicit biases can manifest in various ways and significantly influence students’ preferences and perceptions, which in turn affects professors who identify as non-cisgender and those who are perceived to belong to a certain racial or ethnic group. Research indicates that these biases are not only challenging to detect but also difficult to change without intentional and sustained efforts to advocate for equity (Jackson, Hillard, and Schneider Reference Jackson, Hillard and Schneider2014).
Our findings raise important questions about how course-enrollment patterns differ from those observed in SET scores. At first glance, our finding that students are more likely to select courses taught by professors using she/her/hers pronouns seems inconsistent with prior evidence showing that men professors often receive higher SET scores. However, course-enrollment decisions and SET scores capture distinct stages of a student–faculty member interaction and are shaped by different mechanisms. Course choice reflects pre-interaction judgments based on limited identity cues such as pronouns that may inform perceptions of approachability, inclusiveness, and teaching style. In contrast, SET scores are post-interaction evaluations incorporating classroom experiences, workload, and grading fairness—factors that can disadvantage women professors who deviate from gendered expectations of warmth and leniency (Foster Reference Foster2023; Mitchell and Martin Reference Mitchell and Martin2018). Students therefore initially may prefer professors who use she/her/hers pronouns based on perceived approachability but later evaluate them less favorably if those expectations are unmet. It is important to note that our study did not directly test hypotheses comparing SET scores and course-enrollment choices. Therefore, this analysis remains interpretive rather than causal.
These findings also have broader institutional implications. In a context in which administrators often make difficult decisions about which courses to offer and who will teach them, course-enrollment patterns shaped by students’ preferences can have unintended consequences. When certain instructors are less likely to attract enrollments due to gender or racial cues, these patterns may influence teaching assignments and, over time, affect faculty members’ visibility and advancement opportunities. The results of our study suggest how enrollment bias can operate as an early mechanism of inequality. However, because our study did not examine administrative responses to enrollment patterns or promotion and evaluation decisions, we cannot establish a direct link between pre-interaction preferences and career outcomes. Recognizing this dynamic suggests a potential area for future research and institutional reflection regarding fairness and inclusion in course planning and personnel decisions.
However, whereas there are challenges to addressing or detecting bias, stereotypes and biases have been found to weaken with exposure to those to whom a bias is directed (Beaman et al. Reference Beaman, Chattopadhyay, Duflo, Pande and Topalova2009). Therefore, it is crucial to acknowledge and address these biases to ensure a fairer academic environment and to consider how students are exposed to those who are different from them.
ACKNOWLEDGMENTS
This study draws on research conducted as part of the 2023 Gender Equity Research Fellowship. We acknowledge the Provost’s Office and the Women’s Center at the University of Dayton for their support in hosting the fellowship. We thank our research assistants, Hannah Kling, Isabella Thomeier, and Veronica Vasko, for their contributions to data collection and analysis throughout the project. We also thank anonymous reviewers and editors for their constructive comments.
DATA AVAILABILITY STATEMENT
Research documentation and data that support the findings of this study are openly available at the PS: Political Science & Politics Harvard Dataverse at https://doi.org/10.7910/DVN/DSOBOP.
CONFLICTS OF INTEREST
The authors declare that there are no ethical issues or conflicts of interest in this research.


 Open access