


1. Introduction
Porous materials, so called multi-porosity materials, predominantly manifest in the forms of foams, powders and aerosols. They are endowed with superior permeability, energy absorption capacity and thermal insulation characteristics, which have garnered significant relevance across disciplines such as astrophysics, inertial confinement fusion (ICF) and military engineering[ Reference Falize, Michaut and Bouquet1– Reference Dunne, Borghesi, Iwase, Jones, Taylor, Willi, Gibson, Goldman, Mack and Wattet4]. The investigation of the equation of state (EOS) for porous material is a critical area of research within the field of materials science and high-pressure physics[ Reference Kormer, Funtikov, Urlin and Kolesnikova5]. Porous materials generally exhibit an energy-absorbing reverse expansion phenomenon within the pressure region of about 10 GPa. As the pressure increases, the density of the porous material will continue to rise after it is compressed to a dense state[ Reference Vogler, Lee and Grady6– Reference Fredenburg, Koller, Rigg and Scharff11]. Furthermore, if the material is porous enough and the shock intensity is high enough, abnormal Hugoniot behavior is observed because the material expands due to the heating[ Reference Fredenburg, Koller, Coe and Kiyanda12– Reference Geng, Wu, Tan, Cai and Jing14]. Consequently, the investigation of porous materials facilitates the exploration of material property parameters across an expanded domain, enabling the acquisition of EOSs that are inaccessible to solid materials with normal density.
Research on the equations of state for powders primarily commenced around the 1960s[ Reference Geng, Wu, Tan, Cai and Jing14]. Several theoretical studies developed analytical continuum compaction models that adeptly represent the macroscopic response of ductile porous materials when subjected to planar shock wave loading[ Reference Fredenburg, Carney, Fichtl and Ramsey15, Reference Voorhees, Steiner, Kennedy, Fredenburg and Thadhani16]. Within the elastic-plastic domain, the description of particle dimensions, porosity and other intrinsic attributes of porous materials is frequently accomplished through the application of isothermal compression techniques. These methods are instrumental in the formulation of pertinent numerical models, exemplified by the prevalent P-α and P-λ models[ Reference Herrmann17– Reference Fredenburg and Thadhani19]. These models frequently employ a semi-empirical approach grounded in the Mie–Grüneisen EOS, utilizing the known Hugoniot curve of the true dense state to ascertain the impact-compression state of the corresponding loose substance via isochoric compression[ Reference Geng, Wu, Tan, Cai and Jing14, Reference Dijken and De Hosson20, Reference Demaske, Hudspeth and Mandal21]. However, most models incorporate one or more empirical fitting parameters. Typically, these parameters lack a direct correlation with measurable physical properties and are primarily utilized to enhance the model’s alignment with experimental data. This adaptability enables the model to adeptly delineate the impact densification process of a specific powder system. As a result, in the low-pressure regime, the model’s computational predictions are relatively precise. Deviation in theoretical outcomes tends to occur beyond pressures of 200 GPa[ Reference Kobayashi22, Reference Kobayashi23]. In the domain of high temperature and pressure, theoretical models predominantly revolve around the Thomas–Fermi (TF) framework to elucidate the contributions of high-temperature electronic terms. However, the scarcity and dispersion of experimental data in the high-pressure regime are inadequate for the sophisticated modeling demands of the relevant theories, necessitating the development of corresponding experimental techniques.
The paper introduces a method for conducting EOS experiments on metallic powder materials under intense shock loading using a laser facility. Addressing the technical challenges associated with the nonuniformity and amorphous nature of powder materials, three-dimensional imaging technology is employed to achieve precise measurement of experimental target parameters. The study has successfully acquired the EOS data for copper powder within a pressure regime surpassing 200 GPa, thereby bridging certain gaps in the high-pressure research of porous materials. Furthermore, the WEOS-Pα model has been proposed and compared with the experimental data, which exhibits a high degree of conformity. It is distinctly different from the results of the TF model, which does not account for correlation effects and quantum mechanical effects.
2. Experimental details
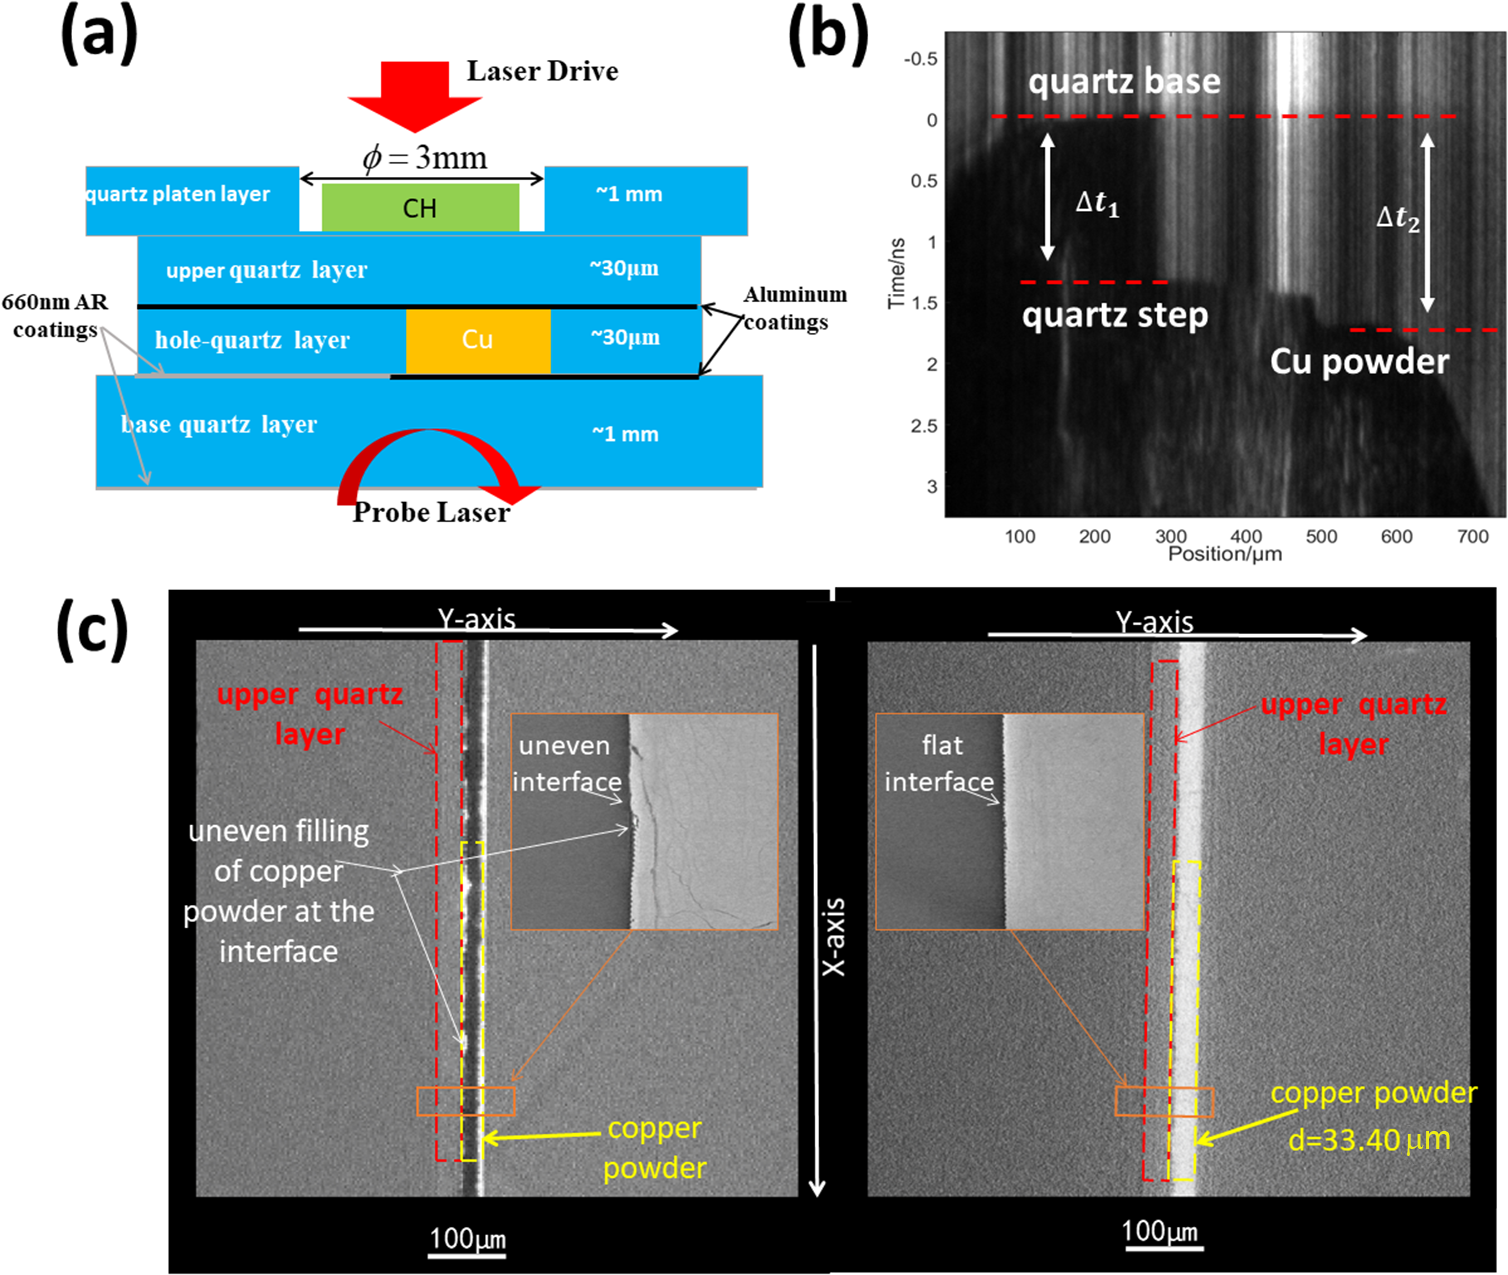
A high-fidelity experimental target design was developed for laser-driven experiments, employing impedance matching techniques to ensure stable laser coupling. Quartz was selected as the reference material due to its well-characterized properties. Given the requirements for laser loading stability, the thickness of the powder layer had to be meticulously controlled at the nanometer scale, specifically around 30 μm, presenting a formidable challenge in the fabrication of high-quality experimental targets. The study of Weck et al. [ Reference Weck, Cochrane, Root, Lane, Shulenburger, Carpenter, Sjostrom, Mattsson and Vogler24] in 2018 conducted EOS experiments on CeO2 powder using the Z machine; we adapted their approach by perforating quartz substrates. Figure 1(a) shows the structure of the target. By creating through-holes in the 30-μm-thick quartz substrate (hole quartz layer) and bonding it with a 1-mm-thick quartz plate (base quartz layer), a ‘container’ for powder filling was formed. After filling with the powder, another quartz plate was used to seal the top (upper quartz layer), thereby forming an impedance-matched target composed of quartz and powder. To suppress the X-ray preheating induced by intense laser irradiation, a layer of approximately 20-μm-thick hydrocarbon material was applied to the loading surface of the quartz. Considering the inherently low reflectivity of the powder material, thin-film coatings were applied at the primary interfaces to ensure the contrast of the experimental signals. The coating material was aluminum, with a thickness of approximately 50 nm (shown as a black line in Figure 1(a)). This meticulous design approach ensures not only the experimental stability and repeatability but also the fidelity of the measurements, which is crucial for the accurate determination of the EOS under impact loading conditions.
(a) Schematic of the impedance-matched experimental target design, featuring a through-hole in a 30-μm-thick hole quartz layer and bonding it to a 1-mm-thick base quartz layer, creating a powder-filled ‘container’ sealed by an upper quartz layer. To suppress X-ray preheating from intense laser irradiation, an approximately 20-μm-thick hydrocarbon layer was applied to the quartz loading surface. The 660 nm anti-reflective coating (shown as a gray line) was deposited on quartz, while 50-nm-thick aluminum coatings (depicted as black lines) were deposited at primary interfaces to enhance signal contrast due to the powder’s low reflectivity. (b) Experimental image obtained by a streak camera. Measurement of shock wave transit times through quartz and powder layers (steps), with the impedance matching method used to calculate the equation of state (EOS) parameters. (c) CT scans of target structures with suboptimal (left) and optimal (right) powder filling, where the left-hand image displays uneven copper powder interfaces with nonuniform topography, while the right-hand image features smooth, dense packing.

Due to the adhesive process employed at the interface between the hole quartz layer and the base quartz layer, the introduction of an adhesive layer is an unavoidable consequence. This problem could be circumvented through a coating technique. A thin film is applied to the basal surface of the hole quartz layer, with an aluminum thin film being specifically vapor-deposited within a 250 μm peripheral boundary. Given that the quartz layer’s thickness had been previously measured using confocal microscopy, the transparent adhesive layer, situated beneath the 250 μm aluminum film, exerts no influence on the precise measurement of the shock wave unloading time at the rear quartz interface.
The experiment utilized copper powder particles with a granulometry of approximately 0.8–1.0 μm. To ensure the stability of the initial density value, the uniformity of the powder filling thickness was controlled to be better than 0.15 μm. Concurrently, by regulating the mass of the filled powder and the compaction force, experimental targets with varying initial densities were obtained. The initial densities of the copper powder studied in this paper were 4.05 ± 0.15 g/cm3 and 4.50 ± 0.15 g/cm3.
After the powder particles are filled and sealed, three-dimensional X-ray computed tomography (CT) imaging technology is employed to characterize the quality of the filling, with a characterization precision better than 1 μm. By adopting a CT-oriented measurement approach, the intensity distribution of the X-ray transmission through the powder layer is obtained. Analysis of the photon intensity values at different locations allows for the determination of the relative density of the powder surface. Analysis has shown that the current powder filling technique can ensure a surface density variation of less than 3%. Utilizing a CT lateral measurement method, the intensity distribution of X-ray transmission at the interfaces between different target components can be used to identify the bonding degree of the quartz-to-quartz interface and the quartz-to-powder interface, thereby enabling the selection of experimental targets without gaps. Figure 1(c) presents CT scans of target structures with suboptimal (left) and optimal (right) powder filling configurations. The CT image on the left reveals irregularities at the copper powder filling interface, characterized by a nonuniform surface topography, while the right-hand target demonstrates a planar, smooth interface with dense packing morphology. Quantitative analysis further shows excellent consistency between copper powder thickness measurements derived from CT imaging and those obtained via a step profiler, thereby reinforcing the precision of thickness characterization.
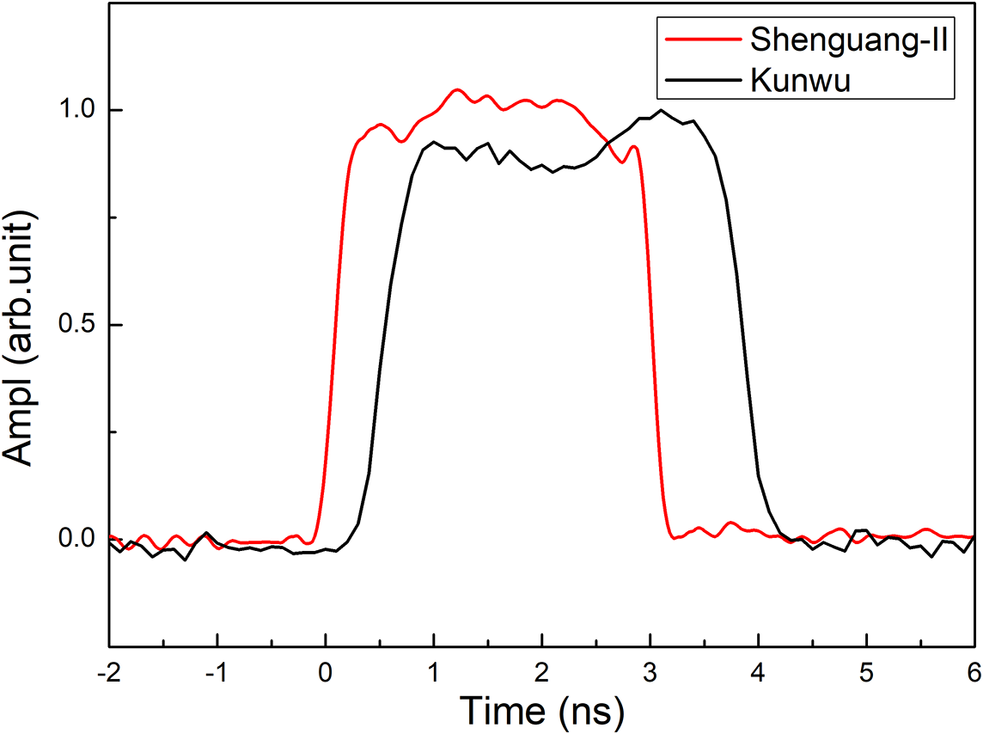
The EOS experiments of the copper powders were carried out using the Shenguang-II Nd:glass laser of the National Laboratory of High Power Laser and Physics and the Kunwu laser facility of the Shanghai Institute of Laser Plasma[ Reference Cui, Gao, Rao, Liu, Li, Ji, Shi, Liu, Zhao, Feng, Xia, Liu, Li, Wang, Ma and Sui25– Reference Wang, An, Fang, Xiong, Xie, Wang, He, Jia, Wang, Zheng, Xia, Feng, Shi, Wang, Sun, Gao and Fu27]. For the ninth laser of the Shenguang-II facility, energies of 800–1500 J were delivered in a 3 ns pulse at 351 nm. For the Kunwu laser facility, energies of 400–650 J were delivered in a 3 ns pulse at 527 nm. Figure 2 shows the temporal shapes of the 3 ns laser pulse for the Shenguang-II and Kunwu laser facilities. The pulse profiles, characterized using a fast photodiode and an oscilloscope, show a flat-top waveform with a full width at half maximum (FWHM) of 3.0 ± 0.1 ns for the Shenguang-II facility and an FWHM of 3.2 ± 0.1 ns for the Kunwu laser facility.
The temporal shapes of the 3 ns laser pulse for the Shenguang-II and Kunwu laser facilities. It shows a flat-top waveform with a full width at half maximum (FWHM) of 3.0 ± 0.1 ns or 3.2 ± 0.1 ns for the Shenguang-II and Kunwu laser facilities, respectively.
The spatial intensity distribution of the laser has been optimized using LA (lens array) beam smoothing technology[ Reference Deng, Liang, Chen, Yu and Ma28, Reference Fu, Gu, Wu and Wang29], achieving a uniform focal spot size of 0.5 mm × 0.7 mm or 1.0 mm × 0.7 mm. The experimental procedure involved the deployment of a probe laser with a wavelength of 660 nm to quantify the variations in reflectivity as the planar shock wave propagated across the posterior interface of the quartz and powder. We used a single-leg velocity interferometer system for any reflector (VISAR) to collect shock breakout signals. The experimental setup was designed to create shock conditions along the Hugoniot locus, where the post-shock state maintained thermodynamic equilibrium and temporal stability over a period long enough to ensure accurate measurements. The VISAR probe beam (660 nm) was sequentially reflected from the base quartz layer, hole quartz layer and Cu powder. As shown in Figure 1(a), an anti-reflective coating (transmittance ≥98.5% for a 660 nm probe laser, shown as a gray line) was deposited on quartz, and a reflective film (50 nm Al, shown as a black line) was added to the bottom of the quartz, which is filled with copper powder to enhance reflectivity. These reflections were recorded by a streak camera with a temporal resolution of approximately 20 ps and a spatial resolution of approximately 7 μm, enabling precise tracking of shock wave propagation. For samples of quartz and copper powder, shock velocities were calculated by measuring the thickness of the step structures and the transition time of the shock wave front, taking advantage of the high temporal resolution of the VISAR system. As shown in Figure 1(b), the traversal times of the shock wave through the quartz and powder steps were obtained, and the impedance matching method was employed to calculate the corresponding parameters of the EOS.
3. Results and discussion
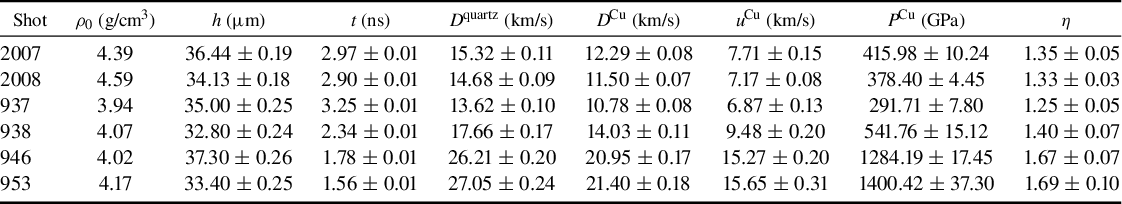
A shocked sample’s particle velocity and pressure can be determined through shock-velocity measurements in the sample and a reference material by the impedance-matching technique[ Reference Fu, Huang, Ma, Shu, Wu, Ye, He, Gu, Luo, Rong and Zhang30]. In this work, the shock state of quartz was determined using the known Hugoniot measurement of quartz[ Reference Desjarlais, Knudson and Cochrane31] and the measured shock velocity of quartz. Table 1 shows the data obtained in the experiments. In particular, ρ 0 denotes the initial average density of the powder material, h signifies the average thickness of the powder layer, t is the transit time of the shock wave within the powder step, D is the velocity of the shock wave, u represents the particle velocity in the powder, P represents the pressure within the powder and η is the density compressibility of Cu powder, which can be calculated by ρ/ρ 0. The uncertainties of the data are also given.
Principal Hugoniot data determined using the IM technique with quartz as standard. Here, ρ0 is the initial average density of the powder material, h is the average thickness of the powder layer and t is the transit time of the shock wave within the powder step. The shock velocities of quartz D quartz and Cu powder D Cu were used in impedance-matching analysis to determine the particle velocity u Cu, pressure P Cu and compressibility η of Cu powder behind the shock front.

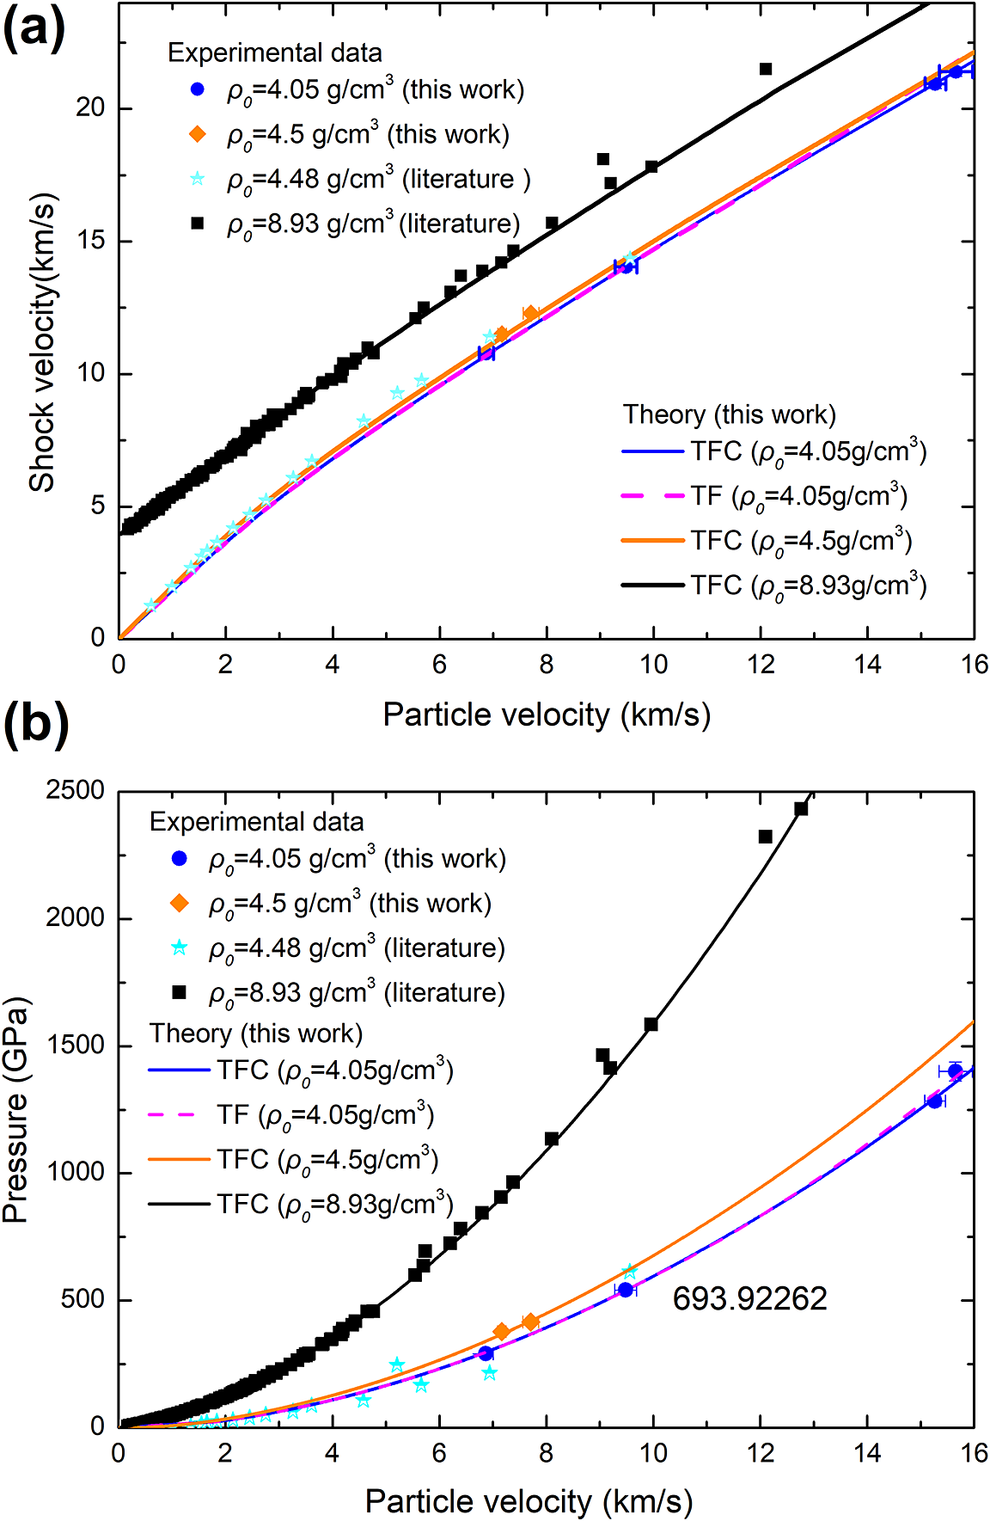
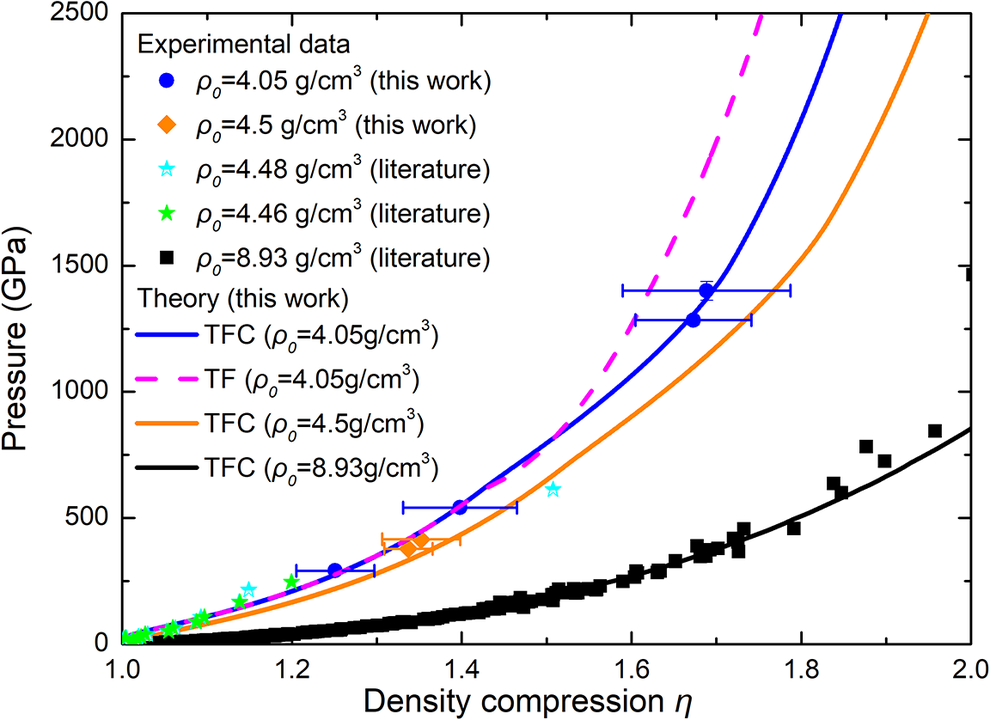
The experimental results obtained above indicate that the pressure range spans from 200 to 1400 GPa, with shock wave velocities distributed between 10 and 21 km/s and particle velocities ranging from 6 to 16 km/s. It clearly reflects the different trends between the initial densities of 4.05 ± 0.15 g/cm3 and 4.50 ± 0.15 g/cm3. Figures 3 and 4 show the D-u, P-u and P-η (the density compression, ρ/ρ 0) relationships of the experimental data in this work (marked with blue circles and orange diamonds). The data with an initial density of 4.48 g/cm3 (marked with a blue hollow star) and 4.46 g/cm3 (marked with a green solid star) and the solid initial density (marked with a black square) from other research studies are also shown for comparison[ Reference Kormer, Funtikov, Urlin and Kolesnikova5, Reference Ali, Swift, Wu and Kraus32– Reference Benuzzi, Lower, Koenig, Faral, Batani, Beretta, Danson and Pepler59]. From the figures, it can be seen that this work has filled the gap of copper powder under pressures above 1000 GPa.
Comparison between the D-u relationship (a) and P-u relationship (b) calculated from the theoretical equation of state and the experimental data of this work and the literature[ Reference Kormer, Funtikov, Urlin and Kolesnikova5, Reference Ali, Swift, Wu and Kraus32– Reference Benuzzi, Lower, Koenig, Faral, Batani, Beretta, Danson and Pepler59].
Comparison between the P-η relationship calculated from the theoretical equation of state and the experimental data of this work and the literature[ Reference Kormer, Funtikov, Urlin and Kolesnikova5, Reference Ali, Swift, Wu and Kraus32– Reference Benuzzi, Lower, Koenig, Faral, Batani, Beretta, Danson and Pepler59].

Liu et al. [ Reference Liu, Song, Zhang, Zhang and Zhao60] introduced the wide range equation of state (WEOS) developed by the Institute of Applied Physics and Computational Mathematics (IAPCM). This EOS employs Helmholtz free energy to achieve a unified description of solid, liquid, gas and plasma states. It calibrates adjustable parameters through experimental and theoretical data, presenting a semi-empirical model that combines various theoretical models. Taking copper as an example, the study examines the cold compression curve, isothermal curve, Hugoniot, off-Hugoniot and sound velocity data, all of which yield satisfactory results. However, the WEOS calculations for the Hugoniot lines of powder materials with different porosities show significant deviations from the experimental results. In addition, the WEOS uses two theoretical models, the TF and TFC (Thomas–Fermi–Kirzhnits), to describe the contribution of the electronic term at high temperatures. Due to the previous experimental data being too scattered, it is not possible to determine which theory, the TF or TFC, is more reasonable in this region.
To enhance the characterization of porous materials, this paper has constructed the WEOS-Pα model. It is assumed that under isothermal and isobaric conditions, the specific internal energy of porous materials is equal to that of dense materials. The porosity coefficient α is used to represent the density relationship between porous and dense materials under these conditions, such that
 $$\begin{align}\alpha ={\rho}^{\mathrm{s}}/\rho,\end{align}$$
 $$\begin{align}P\left(\rho, T\right)={P}^{\mathrm{s}}\left({\rho}^{\mathrm{s}},T\right)={P}^{\mathrm{s}}\left(\alpha \rho, T\right),\end{align}$$
 $$\begin{align}E\left(\rho, T\right)={E}^{\mathrm{s}}\left({\rho}^{\mathrm{s}},T\right)={E}^{\mathrm{s}}\left(\alpha \rho, T\right).\end{align}$$
In this context, P, E and ρ represent the pressure, energy and density of the porous material, respectively, while P s , E s and ρ s represent the pressure, energy and density of the dense material, respectively. The porosity coefficient α is the key parameter that couples the equations of porous and dense materials. Assuming that this coefficient is not significantly affected by temperature, we have the following:
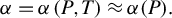 $$\begin{align}\alpha =\alpha \left(P,T\right)\approx \alpha (P).\end{align}$$
The porosity coefficient α(P) can be determined by the P-α model, which is a constitutive equation that describes the behavior of porous materials:
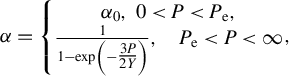 $$\begin{align}\alpha =\left\{\begin{array}{@{}c}{\alpha}_0,\kern0.36em 0<P<{P}_{\mathrm{e}},\\ {}\frac{1}{1-\exp \left(-\tfrac{3P}{2Y}\right)},\quad {P}_{\mathrm{e}}<P<\infty \end{array}\right.\!\!\!\!\!\!,\end{align}$$
in which α 0 represents the initial porosity and P e represents the elastic limit of the porous material, given by the following equation:
 $$\begin{align}{\alpha}_0={\rho_0}^{\mathrm{s}}/{\rho}_0,\end{align}$$
 $$\begin{align}{P}_{\mathrm{e}}=(2/3)Y\ln\;{\alpha}_0/\left({\alpha}_0-1\right),\end{align}$$
where Y represents the yield strength of the dense material and P e tends to infinity as α 0 approaches 1; the formulation is only suitable for porous materials.
The TF equation does not account for correlation effects, which include both the exchange effects between particles and the correlation effects that reflect the imprecision of the independent particle picture, as well as quantum mechanical effects, which encompass quantum effects related to the uncertainty principle and the shell effects that reflect the atomic structure[
Reference Xu and Zhang61]. However, the characteristic lengths associated with exchange and correlation are of the order of magnitude of the de Broglie wavelength, implying that the relative contributions of exchange effects and quantum mechanical effects are of the same order. The dimensionless parameter representing this relationship is denoted by ${\delta_{\mathrm{q}}\sim \delta_{\mathrm{X}} \sim \rho/p^4_{\mathrm{F}}}$
. When revising the TF theory, it is imperative to concurrently consider both exchange and quantum effects. Kirzhnits et al. [
Reference Kirzhnits, Lozovik and Shpatakovskaya62] introduced quantum corrections and exchange corrections into the TF model, a modification commonly referred to as the TFK or TFC theory. From this perspective, the TFK (TFC) model offers a more accurate description of the actual state of matter than the TF model.
${\delta_{\mathrm{q}}\sim \delta_{\mathrm{X}} \sim \rho/p^4_{\mathrm{F}}}$
. When revising the TF theory, it is imperative to concurrently consider both exchange and quantum effects. Kirzhnits et al. [
Reference Kirzhnits, Lozovik and Shpatakovskaya62] introduced quantum corrections and exchange corrections into the TF model, a modification commonly referred to as the TFK or TFC theory. From this perspective, the TFK (TFC) model offers a more accurate description of the actual state of matter than the TF model.
A comparative analysis between the experimental results and the calculations derived from the WEOS-Pα model has been conducted as shown in Figures 2 and 3. This theoretical EOS was parameterized based on the experimental data of dense materials and Murnaghan’s elastic limit, without employing the data from this specific experiment for parameter determination. As evident from the figure, the shock Hugoniot curve calculated by the theoretical EOS for an initial density of 8.93 g/cm3 (for solid materials) accurately replicates the experimental data in previous studies. The shock Hugoniot curves for initial densities of 4.05 and 4.5 g/cm3 were calculated, and the D-u/P-u relationship calculated aligns well with the experimental results. However, there is still some deviation in the P-η/η 0 relationship and further analysis of the experimental results is warranted. The four shots at 291, 547, 1284 and 1400 GPa exhibit good consistency and agree well with the calculations from the TFC model. Notably, the points at 1284 and 1400 GPa are significantly lower than the results calculated by the TF model, which is consistent with our understanding of the TFC model and indirectly confirms that the TFC model better simulates the actual state of matter.
4. Conclusion
To conclude, a laser-driven powder micro-target has been developed. In the experiments, high-precision characterization of the initial state of copper powder has been achieved. A set of experimental data within the pressure range of 200–1400 GPa has also been obtained. The data exhibit good consistency, effectively distinguishing the trends of data under different initial densities, and show a high degree of conformity with relevant data trends in other work. Furthermore, this work independently proposes a theoretical model. Our experimental data can effectively differentiate between the TF model and the TFC model in the high-pressure region, robustly supporting the TFC model, which more accurately describes the actual state of matter. Thus, this experimental technique can be extended to the high-pressure physical property studies of other powder particles.
Acknowledgements
This work was supported by the National Natural Science Foundation of China (Grant No. 12205281). The authors express gratitude to the Joint Laboratory of the Shanghai Institute of Optics and Fine Mechanics, Chinese Academy of Sciences, and the Kunwu Facility Group of the Shanghai Institute of Laser Plasma for providing an essential laser loading platform for the research of the project.


 Open access